
Hydrogen Production Cost Forecasts since the 1970s and Implications for Technological Development


Abstract
:1. Introduction
2. Hydrogen Production Technologies and Cost Estimations
2.1. Hydrogen Production Technologies
2.2. Cost Estimation Methods
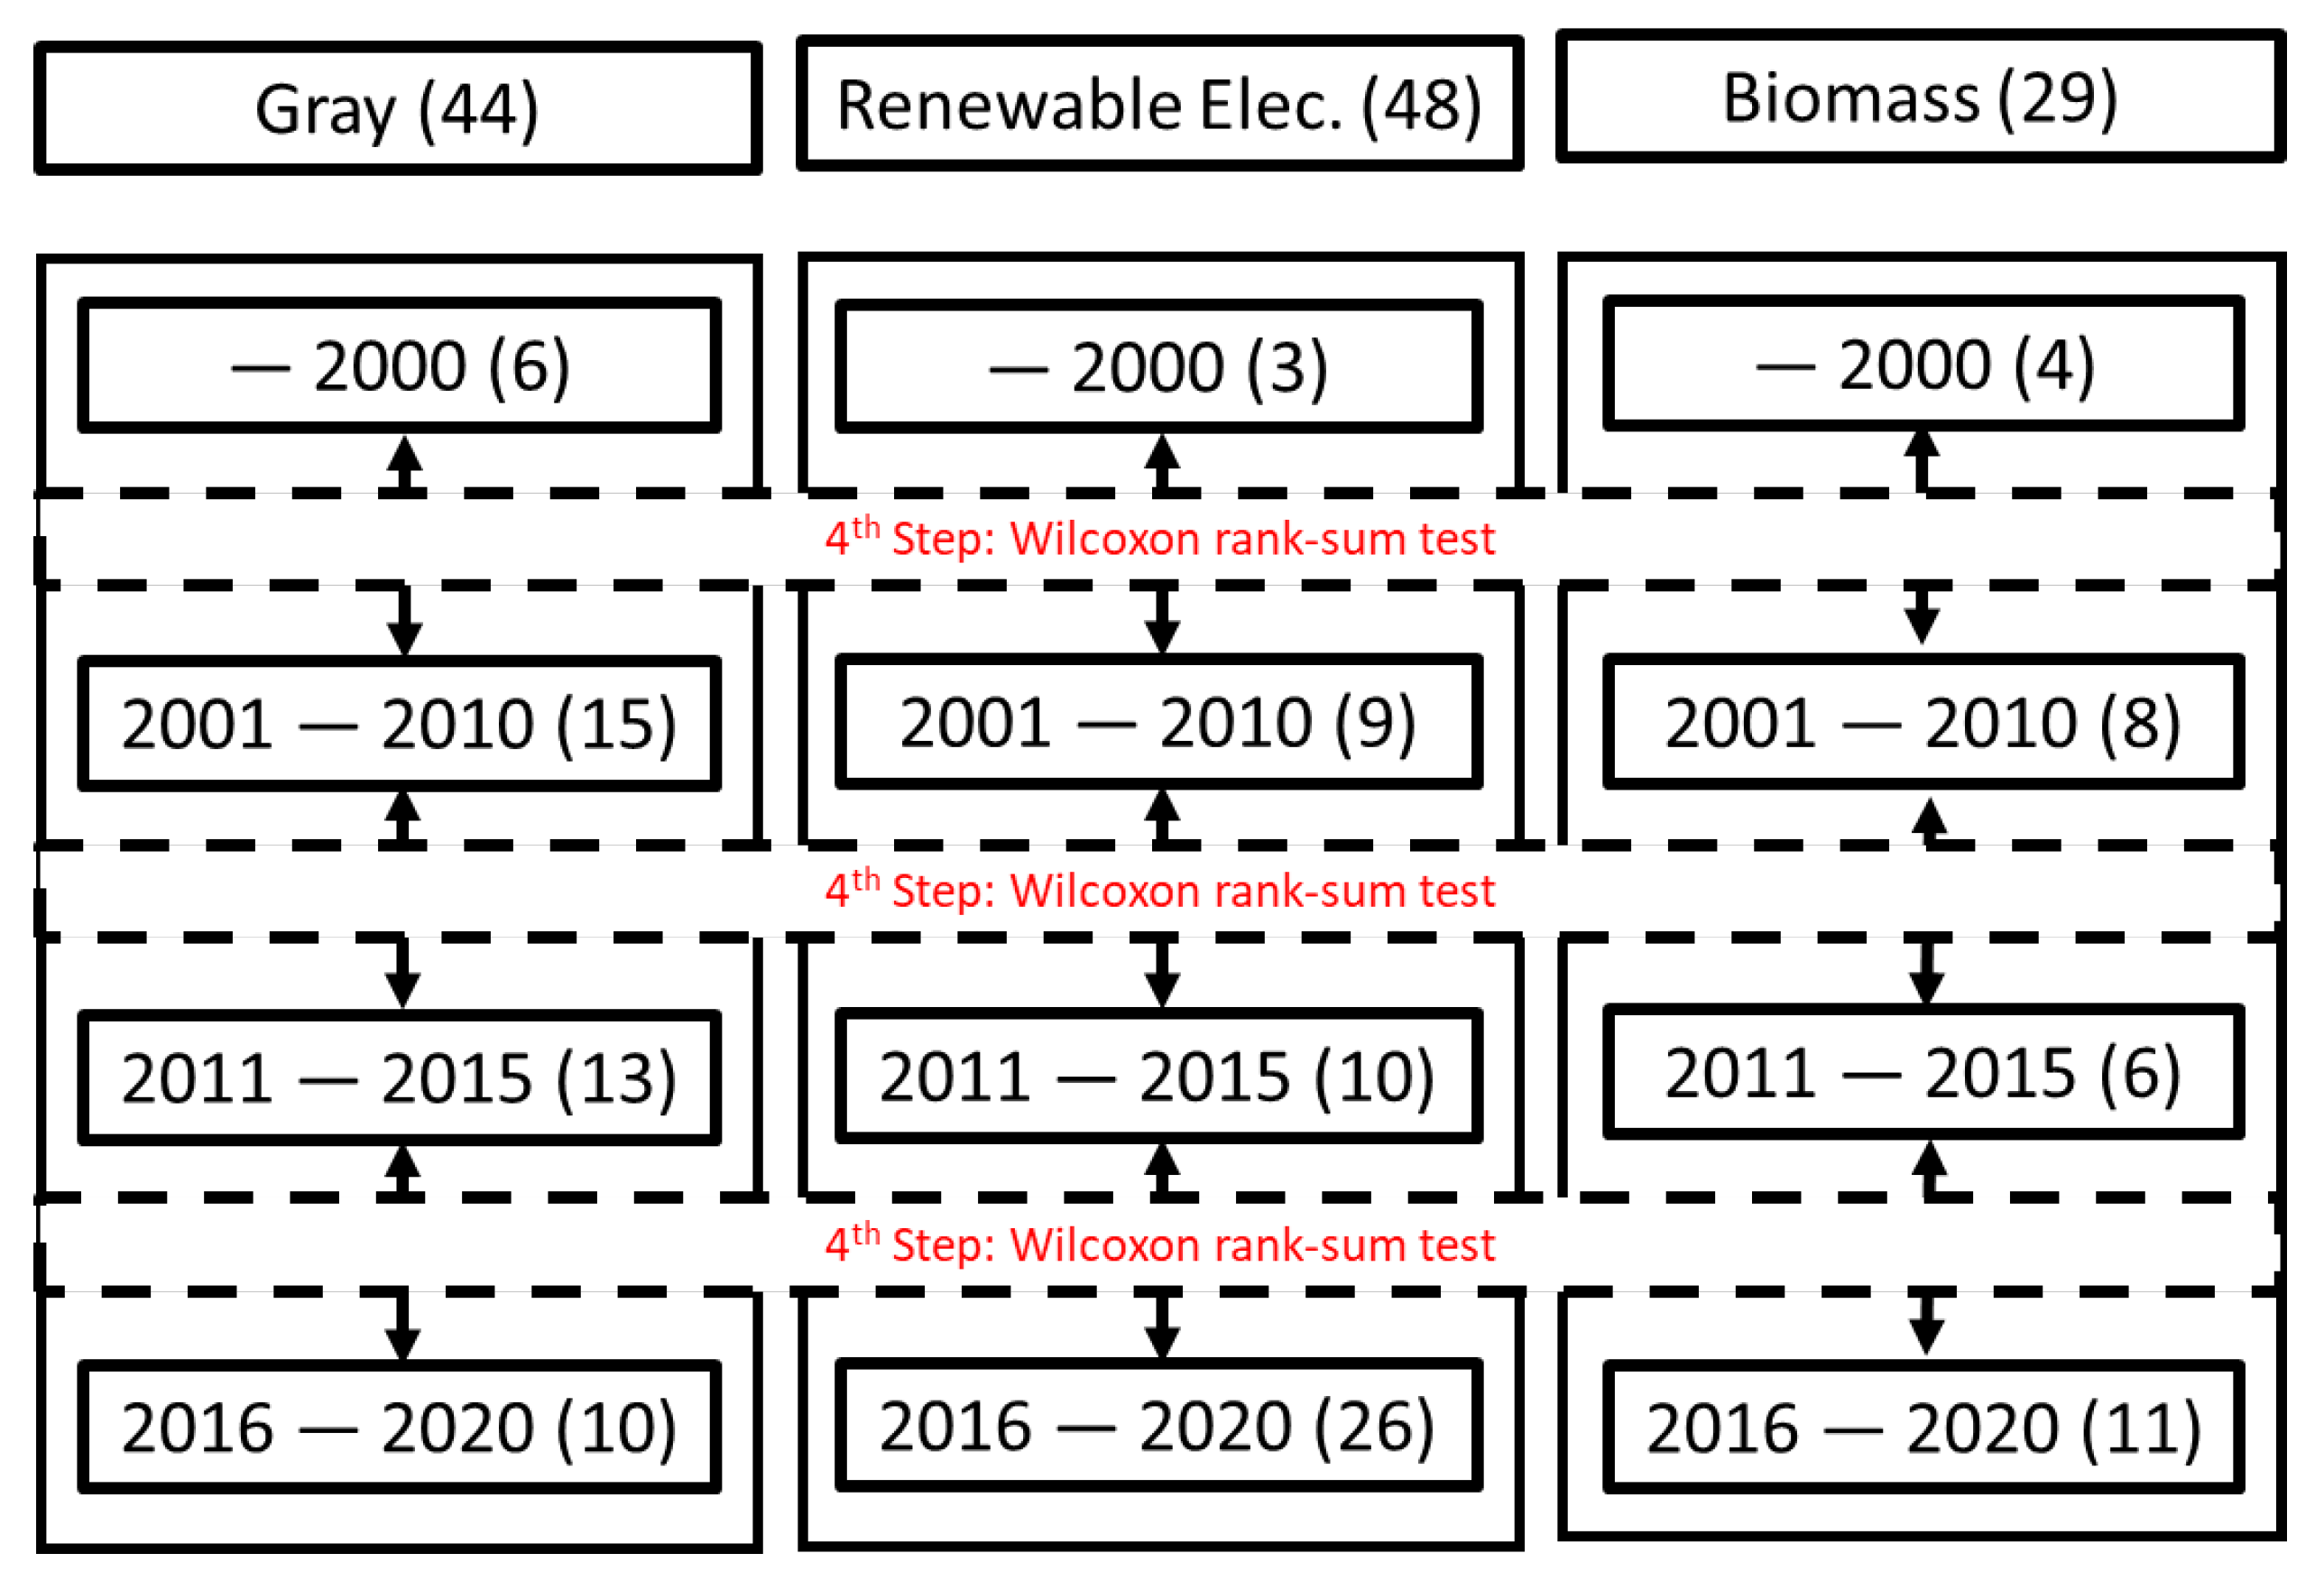
3. Methods
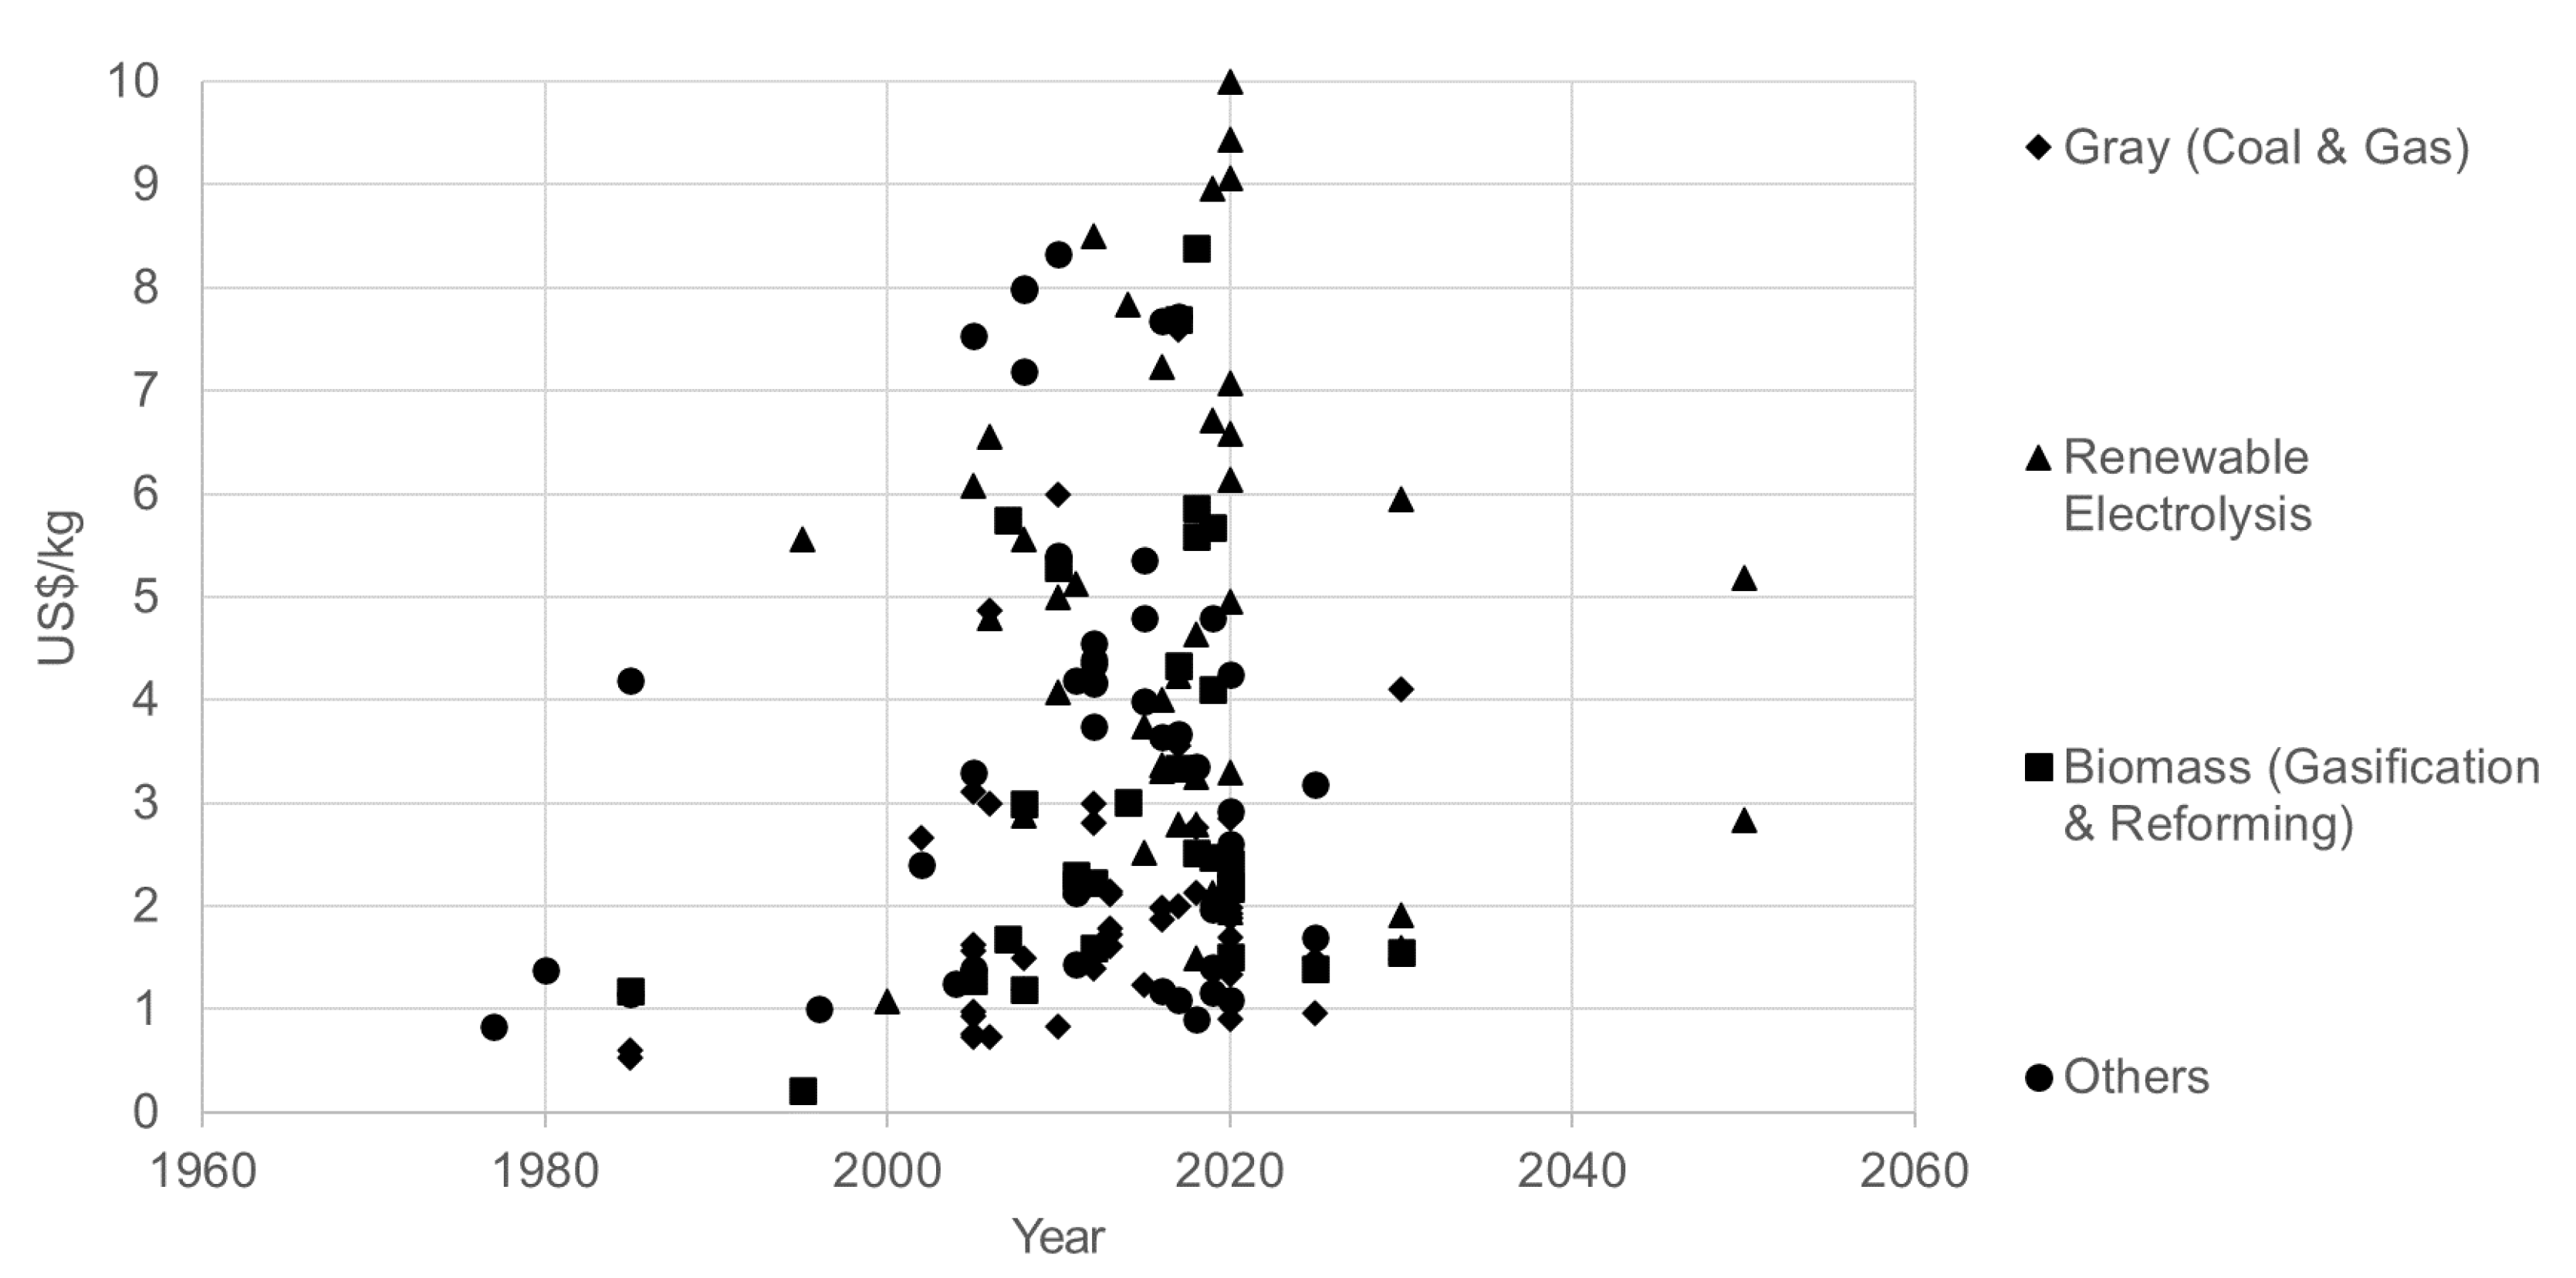
4. Results
4.1. Gray Hydrogen
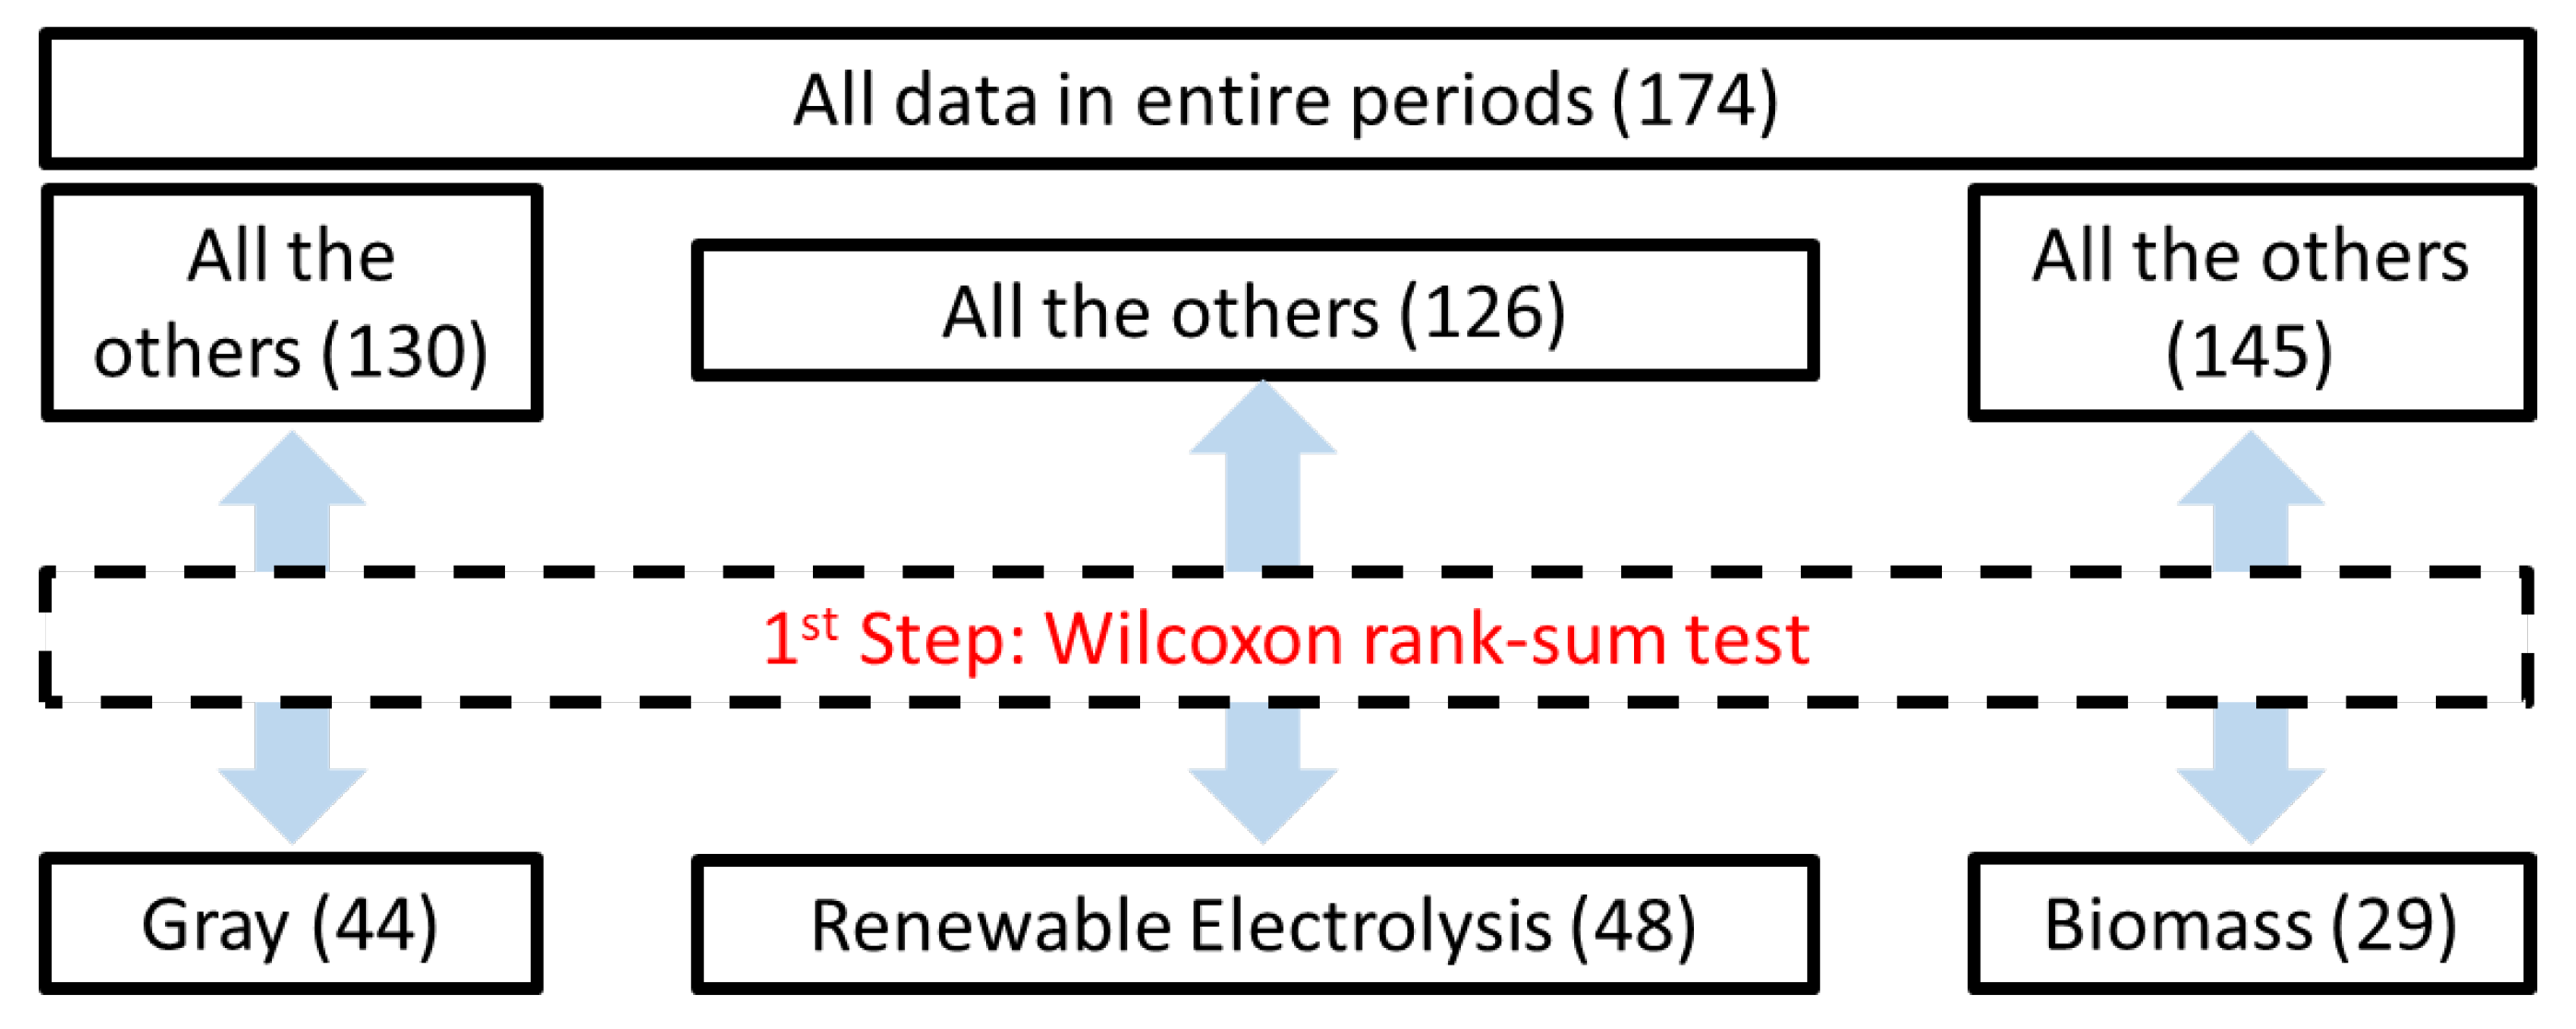
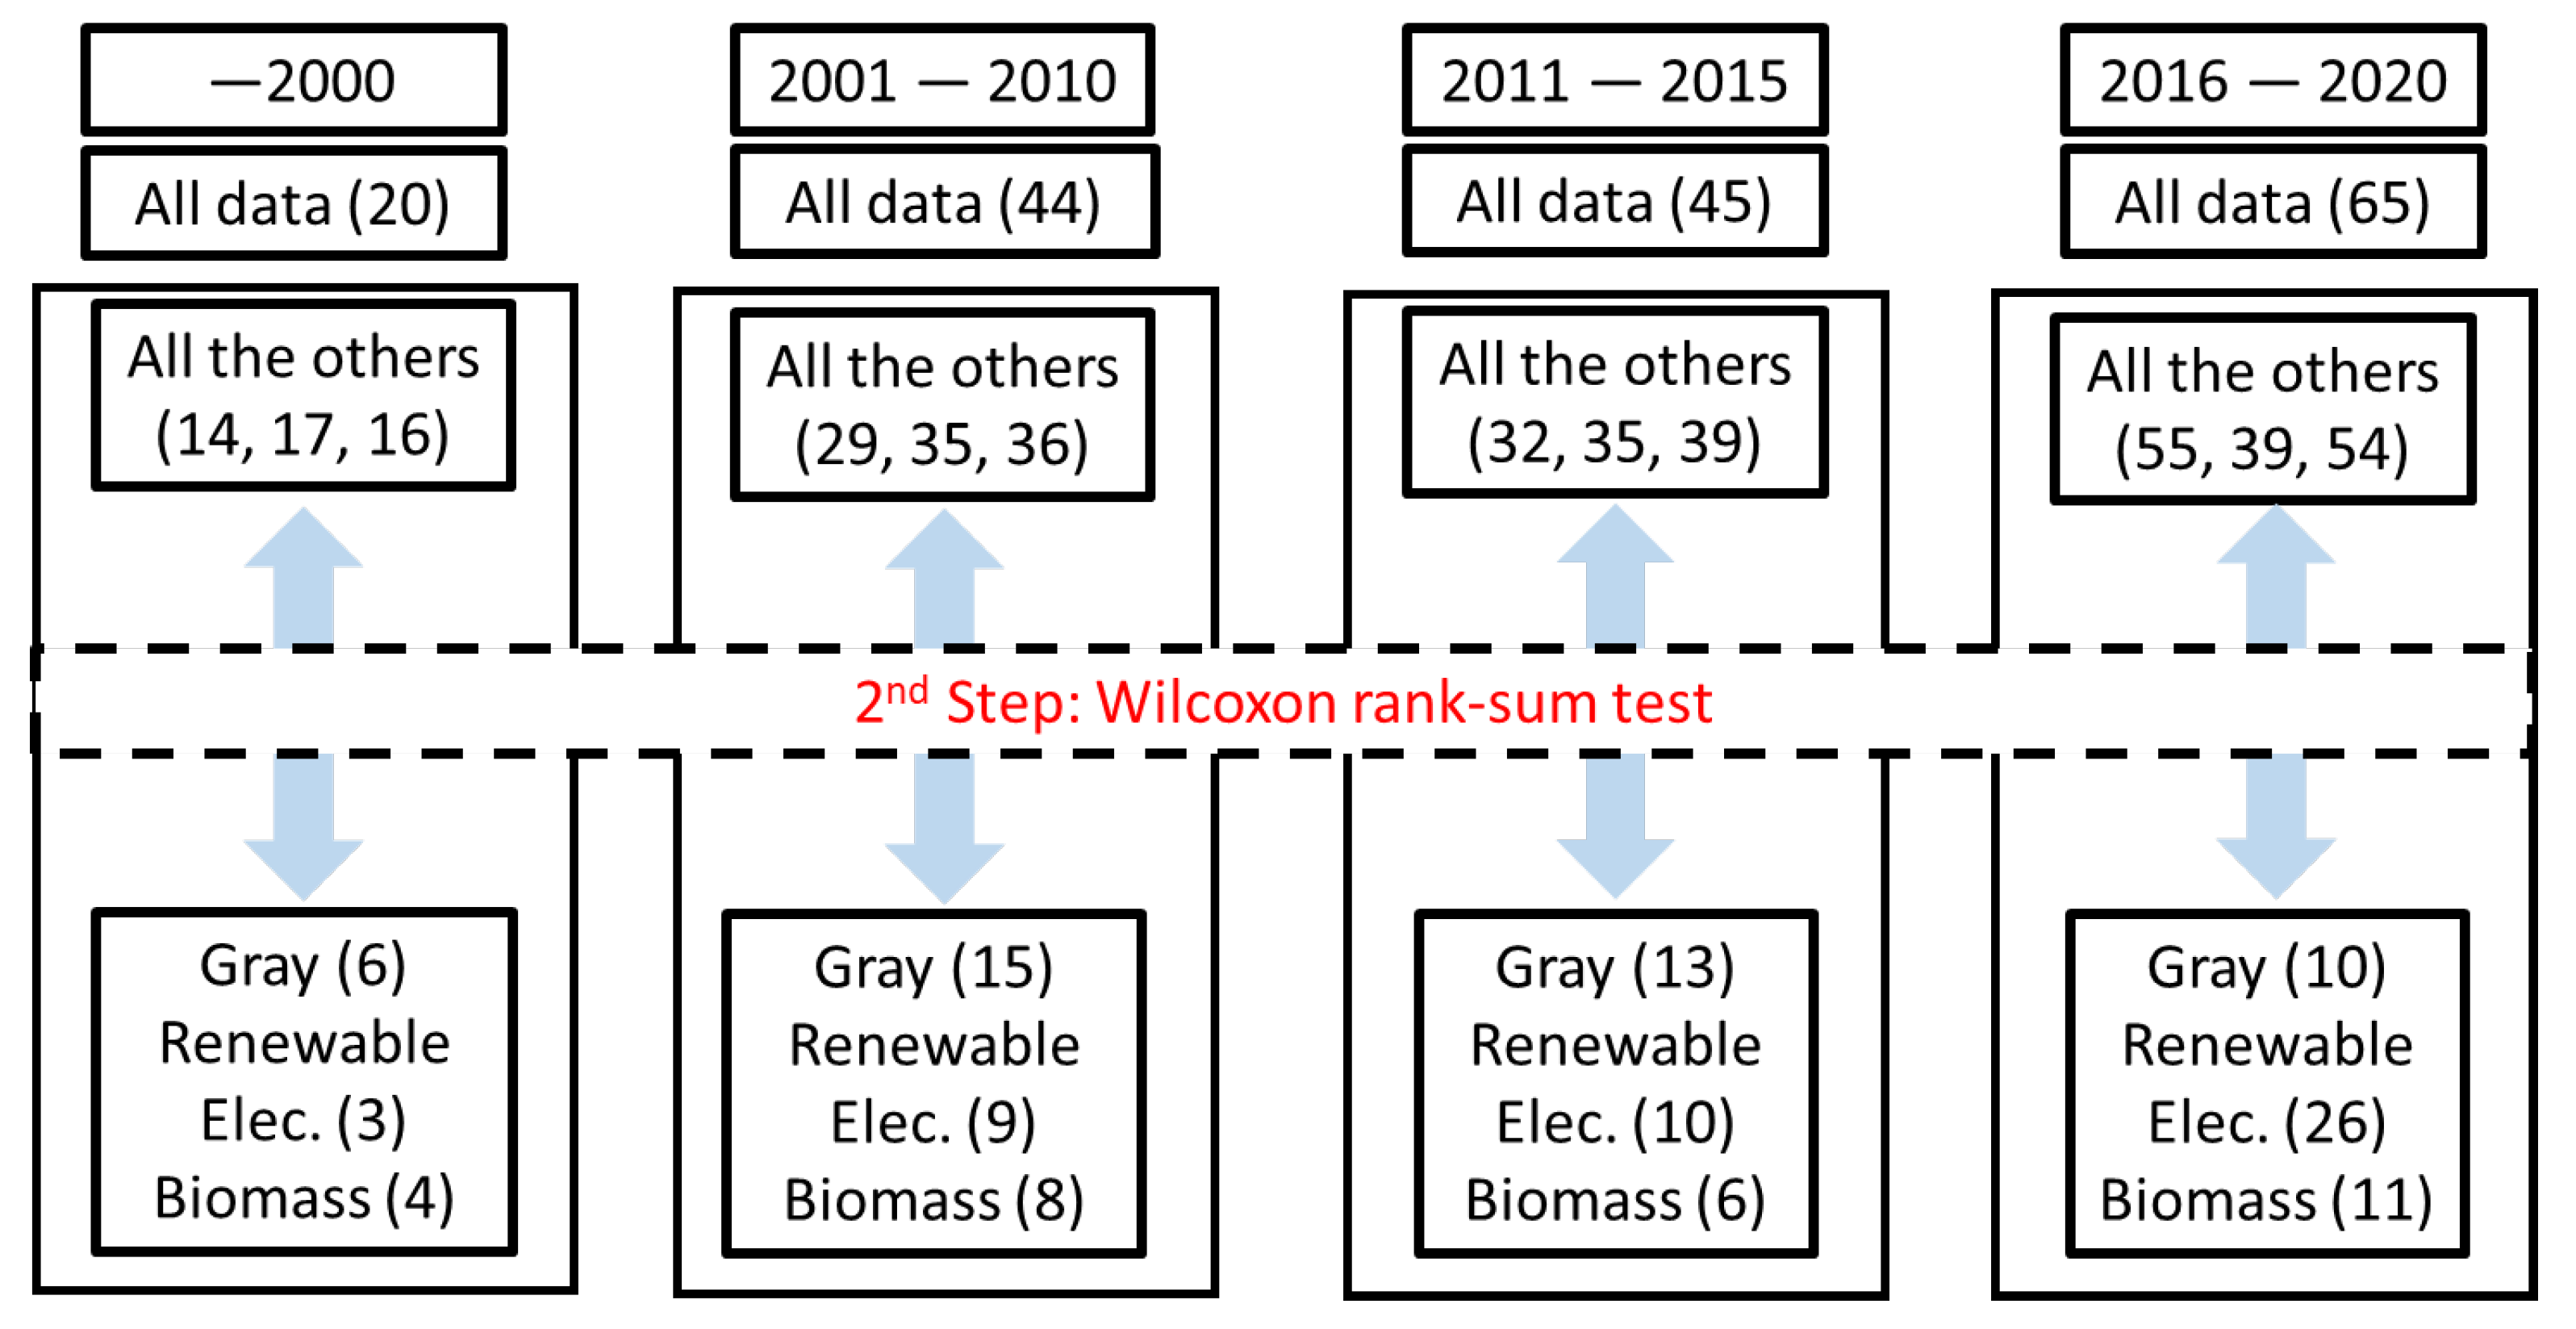
4.1.1. Wilcoxon Rank-Sum (First and Second Step) Tests between Gray Hydrogen and Other Hydrogen Types over Time
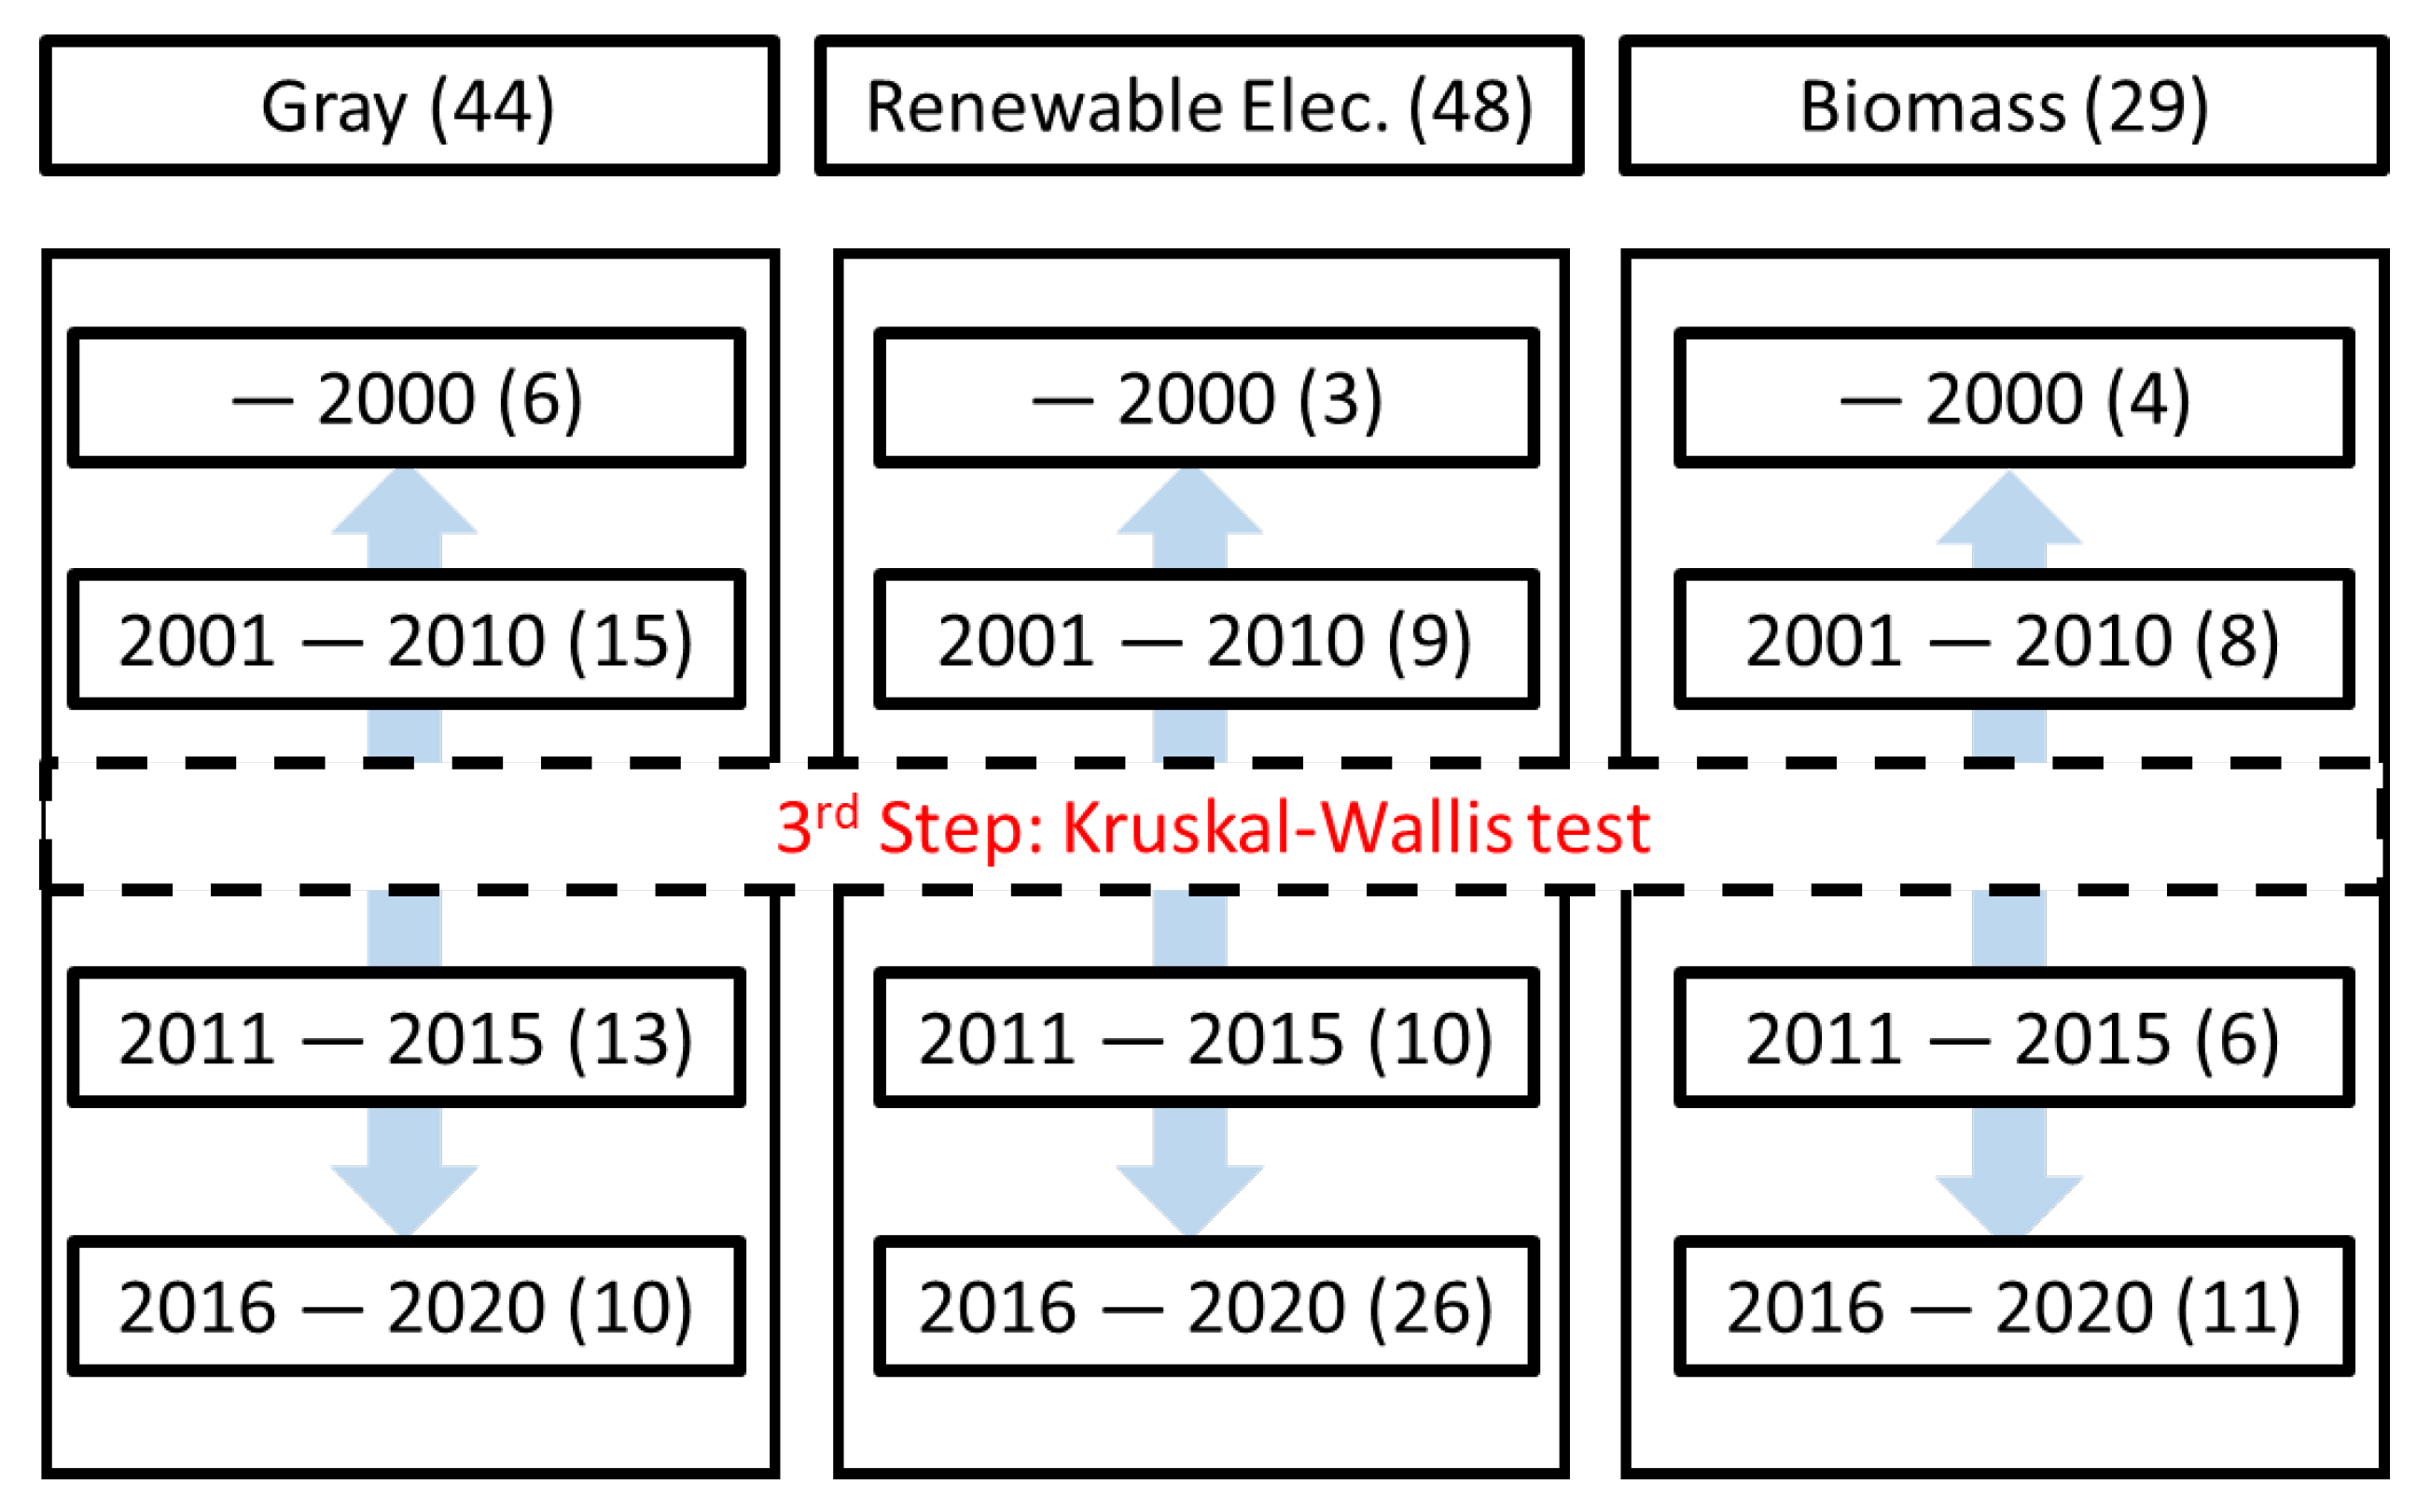
4.1.2. Kruskal–Wallis Test for Gray Hydrogen for Different Periods (Third Test)
4.1.3. Wilcoxon Rank-Sum Test for Gray Hydrogen for Different Periods (Fourth Step)
4.2. Renewable Electrolysis Hydrogen
4.2.1. Wilcoxon Rank-Sum (First and Second Step) Tests between Renewable Electrolysis Hydrogen and Other Hydrogens over Time
4.2.2. Kruskal–Wallis Test for Renewable Electrolysis Hydrogen for Different Periods (Third Test)
4.2.3. Wilcoxon Rank-Sum Test for Renewable Electrolysis Hydrogen for Different Periods (Fourth Step)
4.3. Biomass Hydrogen
4.3.1. Wilcoxon Rank-Sum (First and Second Step) Test between Biomass Hydrogen and Other Hydrogens over Time
4.3.2. Kruskal–Wallis Test for Biomass Hydrogen for Different Periods (Third Step)
4.3.3. Wilcoxon Rank-Sum Test for Biomass Hydrogen for Different Periods (Fourth Step)
5. Discussion
5.1. Gray Hydrogen
5.2. Renewable Electrolysis Hydrogen
5.3. Biomass Hydrogen
6. Conclusions
Funding
Institutional Review Board Statement
Informed Consent Statement
Data Availability Statement
Conflicts of Interest
Appendix A

| Authors | Issued Year | Projected Timing | Production Method | Country | Region | Production Cost Forecast |
|---|---|---|---|---|---|---|
| Beghi G.E. [13] | 1979 | 1977 | Electrolysis | USD 7–8/GJ | ||
| Broggi A. et al. [14] | 1981 | 1996 | Electrolysis | USD 8.40–9.21/GJ | ||
| Carleson G. [15] | 1982 | 1985 | Biomass (gasification) | Sweden | Europe | USD 9.80/GJ |
| Carleson G. [15] | 1982 | 1985 | Coal gasification | Sweden | Europe | USD 5.05/GJ |
| Carleson G. [15] | 1982 | 1985 | Electrolysis | Sweden | Europe | USD 9.65/GJ |
| Carleson G. [15] | 1982 | 1985 | SMR | Sweden | Europe | USD 4.45/GJ |
| Estève D. et al. [16] | 1982 | 1986 | Electrolysis (solar) | USD 1.4/m3 | ||
| Estève D. et al. [16] | 1982 | 1995 | Electrolysis (solar) | USD 0.5/m3 | ||
| Carleson G. [15] | 1982 | 2005 | Biomass (gasification) | Sweden | Europe | USD 10.70/GJ |
| Carleson G. [15] | 1982 | 2005 | Coal gasification | Sweden | Europe | USD 6.30/GJ |
| Carleson G. [15] | 1982 | 2005 | Electrolysis | Sweden | Europe | USD 11.60/GJ |
| Carleson G. [15] | 1982 | 2005 | SMR | Sweden | Europe | US7.80/GJ |
| Carleson G. [15] | 1982 | 2025 | Biomass (gasification) | Sweden | Europe | USD 11.6/GJ |
| Carleson G. [15] | 1982 | 2025 | Coal gasification | Sweden | Europe | USD 8.0/GJ |
| Carleson G. [15] | 1982 | 2025 | Electrolysis | Sweden | Europe | USD 14.1/GJ |
| Carleson G. [15] | 1982 | 2025 | SMR | Sweden | Europe | US12.4/GJ |
| Krikorian O.H. et al. [17] | 1983 | 1980 | Electrolysis | US | N America | USD 11.53–14.43/GJ |
| Aochi A. et al. [18] | 1989 | 1985 | Electrolysis | Japan | Asia | JPY 77.2/m3 |
| Ogden J.M. [19] | 1991 | 2000 | Electrolysis (solar) | US | N America | USD 9–14/GJ |
| Shiga H. et al. [20] | 1998 | 1995 | Biomass (gasification) | India | Asia | JPY 310/GJ |
| Ewan B.C.R. et al. [21] | 2005 | 2005 | Coal gasification | UK | Europe | USD 1.621/kg |
| Ewan B.C.R. et al. [21] | 2005 | 2005 | Coal gasification + CCS | UK | Europe | USD 3.114/kg |
| Da Silva E.P. et al. [22] | 2005 | 2005 | Electrolysis | Brazil | S America | USD 10.3/kg |
| Ewan B.C.R. et al. [21] | 2005 | 2005 | Electrolysis (solar) | UK | Europe | USD 14.95/kg |
| Ewan B.C.R. et al. [21] | 2005 | 2005 | Electrolysis (wind) | UK | Europe | USD 6.081/kg |
| Chen Z. et al. [23] | 2005 | 2005 | SMR | US | N America | USD 0.74–0.97/kg |
| Ewan B.C.R. et al. [21] | 2005 | 2005 | SMR | UK | Europe | USD 0.982/kg |
| Ewan B.C.R. et al. [21] | 2005 | 2005 | SMR + CCS | UK | Europe | USD 1.575/kg |
| Chen Z. et al. [24] | 2006 | 2006 | SMR | US | N America | USD 0.74–0.97/kg |
| Giaconia A. et al. [25] | 2007 | 2005 | Electrolysis | Italy | Europe | USD 7.531/kg |
| Dowaki K. et al. [26] | 2007 | 2007 | Biomass (gasification) | Japan | Asia | USD 5.75–7.86/kg |
| Forsberg P. et al. [27] | 2007 | 2010 | SMR (@ refueling station) | US | N America | USD 6.0/kg |
| Forsberg P. et al. [27] | 2007 | 2030 | SMR (@ refueling station) | US | N America | USD 4.1/kg |
| Lv P. et al. [28] | 2008 | 2007 | Biomass (gasification) | China | Asia | USD 1.69/kg |
| Balat M. [3] | 2008 | 2008 | Biomass | Turkey | Middle East | USD 10–14/GJ |
| Muradov N. et al. [29] | 2008 | 2008 | Biomass (reforming) | USA | N America | USD 3.00/kg |
| Balat M. [3] | 2008 | 2008 | Coal gasification | Turkey | Middle East | USD 10–12/GJ |
| Graf D. et al. [30] | 2008 | 2008 | Electrolysis | Germany | Europe | EUR 5.8/kg |
| Charvin P. et al. [31] | 2008 | 2008 | Electrolysis | France | Europe | USD 7.98/kg |
| Balat M. [3] | 2008 | 2008 | Electrolysis | Turkey | Middle East | USD 8/kg |
| Rivera-Tinoco R. et al. [32] | 2008 | 2008 | Electrolysis (biomass) | France | Europe | EUR 2.32/kg |
| Rodrigues Halmeman M.C. et al. [33] | 2008 | 2008 | Electrolysis (biomass) | Brazil | S America | USD 0.50 m3 |
| Balat M. [3] | 2008 | 2008 | SMR | Turkey | Middle East | USD 1.5/kg |
| Pilavachi P.A. et al. [34] | 2009 | 2004 | Electrolysis (hydraulic) | Greece | Europe | USD 1.25/kg |
| Pilavachi P.A. et al. [34] | 2009 | 2004 | Electrolysis (solar) | Greece | Europe | USD 16.00/kg |
| Lewis M.A. et al. [35] | 2009 | 2005 | Electrolysis | US | N America | USD 3.30/kg |
| Pilavachi P.A. et al. [34] | 2009 | 2007 | Biomass (gasification) | Greece | Europe | USD 23.78/kg 1 |
| Pilavachi P.A. et al. [34] | 2009 | 2007 | Coal gasification | Greece | Europe | USD 22.37/kg 2 |
| Pilavachi P.A. et al. [34] | 2009 | 2007 | Electrolysis (wind) | Greece | Europe | USD 36.75/kg 3 |
| Pilavachi P.A. et al. [34] | 2009 | 2007 | Smr | Greece | Europe | USD 32.75/kg 4 |
| Pregger T. et al. [36] | 2009 | 2020 | Biomass (gasification) | Germany | Europe | EUR 3.2–13ct/kWh |
| Pregger T. et al. [36] | 2009 | 2020 | Coal gasification + CCS | Germany | Europe | EUR 4.2–8.6ct/kWh |
| Pregger T. et al. [36] | 2009 | 2020 | Electrolysis (solar) | Germany | Europe | EUR 20–22ct/kWh |
| Pregger T. et al. [36] | 2009 | 2020 | Electrolysis (wind) | Germany | Europe | EUR 7–8ct/kWh |
| Pregger T. et al. [36] | 2009 | 2020 | SMR | Germany | Europe | EUR 3.6–7.7ct/kWh |
| Pregger T. et al. [36] | 2009 | 2020 | SMR + CCS | Germany | Europe | EUR 4.0–9.1ct/kWh |
| Wang Z.L. et al. [37] | 2010 | 2002 | Electrolysis | Canada | N America | USD 2.41/kg |
| Wang Z.L. et al. [37] | 2010 | 2002 | SMR | Canada | N America | USD 2.67/kg |
| Ljunggren M. et al. [38] | 2010 | 2010 | Biomass (fermentation) | Sweden | Europe | EUR 19.93/kg |
| Lemus R.G. et al. [6] | 2010 | 2010 | Biomass (gasification) | Spain | Europe | USD 44–82/GJ |
| Lemus R.G. et al. [6] | 2010 | 2010 | Electrolysis (hydraulic) | Spain | Europe | USD 45–66/GJ |
| Lemus R.G. et al. [6] | 2010 | 2010 | Electrolysis (solar) | Spain | Europe | USD 41.7–166/GJ |
| Lemus R.G. et al. [6] | 2010 | 2010 | Electrolysis (wind) | Spain | Europe | USD 34.0–75.2/GJ |
| Leybros J. et al. [39] | 2010 | 2010 | Hybrid-sulfur cycle | France | Europe | EUR 6.6/kg |
| Lemus R.G. et al. [6] | 2010 | 2010 | SMR | Spain | Europe | USD 6.9/GJ |
| Leybros J. et al. [40] | 2010 | 2010 | Sulfur–Iodine | France | Europe | EUR 12/kg |
| Lemus R.G. et al. [6] | 2010 | 2020 | Biomass (gasification) | Spain | Europe | USD 18.3/GJ |
| Lemus R.G. et al. [6] | 2010 | 2030 | Biomass (gasification) | Spain | Europe | USD 13–17/GJ |
| Ljunggren M. et al. [41] | 2011 | 2011 | Biomass (fermentation) | Sweden | Europe | EUR 51.0/kg |
| Müller S. et al. [42] | 2011 | 2011 | Biomass (gasification) | Austria | Europe | EUR 54/MWh |
| Huisman G.H. et al. [43] | 2011 | 2011 | Biomass (gasification) | Sweden | Europe | EUR 14.4/GJ |
| Mansilla C. et al. [44] | 2011 | 2011 | Electrolysis | France | Europe | EUR 3.27/kg |
| Balta M.T. et al. [45] | 2011 | 2011 | Electrolysis (geothermal) | Turkey | Middle East | USD 1.446–2.706/kg |
| Lu Y. et al. [46] | 2011 | 2011 | Electrolysis (solar) | China | Asia | RMB38.46/kg |
| Menanteau P. et al. [47] | 2011 | 2011 | Electrolysis (wind) | France | Europe | EUR 4–12/kg |
| Holtermann T. et al. [48] | 2011 | 2011 | Photobioreactor | Germany | Europe | EUR 50/MWh |
| Corgnale C. et al. [49] | 2011 | 2015 | Solar thermochemical | US | N America | USD 4.80/kg |
| Huisman G.H. et al. [43] | 2011 | 2020 | Biomass (gasification) | Sweden | Europe | EUR 12.8/GJ |
| Corgnale C. et al. [49] | 2011 | 2025 | Solar thermochemical | US | N America | USD 3.19/kg |
| Gim B. et al. [50] | 2012 | 2006 | Electrolysis (wind) | Korea | Asia | USD 6.55/kg |
| Gim B. et al. [50] | 2012 | 2006 | Electrolysis (wind) | US | N America | USD 4.80/kg |
| Gim B. et al. [50] | 2012 | 2006 | SMR | Korea | Asia | USD 4.87/kg |
| Gim B. et al. [50] | 2012 | 2006 | SMR | US | N America | USD 3.00/kg |
| Lysenko S. et al. [4] | 2012 | 2012 | Biomass (gasification) | US | N America | USD 2.23–3.01/kg |
| Becker W.L. et al. [51] | 2012 | 2012 | Biomass (gasification) | US | N America | USD 1.6/kg |
| Becker W.L. et al. [51] | 2012 | 2012 | CHHP | US | N America | USD 4.4/kg |
| Chiuta S. et al. [52] | 2012 | 2012 | Coal gasification | South Africa | Africa | USD 3/kg |
| Mansilla C. et al. [53] | 2012 | 2012 | Electrolysis | France | Europe | EUR 2.90/kg |
| Becker W.L. et al. [51] | 2012 | 2012 | Electrolysis | US | N America | USD 4.17/kg |
| Genç G. et al. [54] | 2012 | 2012 | Electrolysis (wind) | Turkey | Middle East | USD 8.5/kg |
| Becker W.L. et al. [51] | 2012 | 2012 | SMR | US | N America | USD 1.4/kg |
| Liberatore R. et al. [55] | 2012 | 2012 | Solar sulfur–iodine thermochemical | Italy | Europe | EUR 8.3/kg |
| Gim B. et al. [50] | 2012 | 2017 | Electrolysis (wind) | Korea | Asia | USD 4.23/kg |
| Gim B. et al. [50] | 2012 | 2017 | Electrolysis (wind) | US | N America | USD 2.80/kg |
| Gim B. et al. [50] | 2012 | 2017 | SMR | Korea | Asia | USD 3.56/kg |
| Gim B. et al. [50] | 2012 | 2017 | SMR | US | N America | USD 2.00/kg |
| Mansilla C. et al. [56] | 2013 | 2012 | Electrolysis | France | Europe | EUR 3.37/kg |
| Mansilla C. et al. [56] | 2013 | 2012 | Electrolysis | Germany | Europe | EUR 3.23/kg |
| Mansilla C. et al. [56] | 2013 | 2012 | Electrolysis | Spain | Europe | EUR 3.52/kg |
| Wu W. et al. [57] | 2013 | 2012 | SMR | Taiwan | Asia | USD 5.67/kmol |
| Olateju B. et al. [58] | 2013 | 2013 | Coal gasification | Canada | N America | USD 1.78/kg |
| Olateju B. et al. [58] | 2013 | 2013 | Coal gasification + CCS | Canada | N America | USD 2.11/kg |
| Olateju B. et al. [58] | 2013 | 2013 | Coal gasification + EOR | Canada | N America | USD 1.61/kg |
| Olateju B. et al. [58] | 2013 | 2013 | SMR | Canada | N America | USD 1.73/kg |
| Olateju B. et al. [58] | 2013 | 2013 | SMR + CCS | Canada | N America | USD 2.14/kg |
| Urbaniec K. et al. [59] | 2014 | 2014 | Biomass (fermentation) | Poland | Europe | EUR 9.30/kg |
| Brown D. et al. [60] | 2014 | 2014 | Biomass (gasification) | Canada | N America | USD 3.01/kg |
| Olateju B. et al. [61] | 2014 | 2014 | Electrolysis (wind) | Canada | N America | USD 7.84/kg |
| Guo L.J. et al. [62] | 2015 | 2015 | Coal gasification | China | Asia | USD 0.111m3 |
| Bennoua S. et al. [63] | 2015 | 2015 | Electrolysis | France | Europe | EUR 3.0–4.5/kg |
| Matzen M. et al. [64] | 2015 | 2015 | Electrolysis (wind) | US | N America | USD 3.74–5.86/kg |
| Galera S. et al. [65] | 2015 | 2015 | Water reforming | Spain | Europe | USD 5.36/kg |
| Loisel R. et al. [66] | 2015 | 2030 | Electrolysis (wind) | France | Europe | EUR 4.2–13.0/kg |
| Han W. et al. [67] | 2016 | 2016 | Biomass (fermentation) | China | Asia | USD 14.89/kg |
| Abuşoğlu A. et al. [68] | 2016 | 2016 | Electrolysis (biomass) | Turkey | Middle East | USD 3.31–15.63/kg |
| Olateju B. et al. [69] | 2016 | 2016 | Electrolysis (hydraulic) | Canada | N America | USD 1.18–2.43/kg |
| Southall G.D. et al. [70] | 2016 | 2016 | Electrolysis (renewable) | UK | Europe | GBP 4.98/kg |
| Olateju B. et al. [71] | 2016 | 2016 | Electrolysis (wind) | Canada | N America | USD 3.37–9.0/kg |
| AlRafea K. et al. [72] | 2016 | 2016 | Electrolysis (wind) | Canada | N America | USD 4.0–5.0/kg |
| Oh T.H. [73] | 2016 | 2016 | Formic acid | Korea | Asia | USD 380/kg 5 |
| Olateju B. et al. [71] | 2016 | 2016 | SMR | Canada | N America | USD 1.87–2.60/kg |
| Shafiee A. et al. [74] | 2016 | 2016 | SMR | Saudi Arabia | Middle East | USD 1.98/kg |
| Couto N.D. et al. [75] | 2016 | 2016 | Waste gasification | Portugal | Europe | EUR 2.66/kg |
| Chang W.-C. et al. [76] | 2016 | 2016 | Waste hydrogen from coked coal | Taiwan | Asia | USD 0.69–0.78/m3 |
| Gillessen B. et al. [77] | 2017 | 2015 | Electrolysis (solar) | Germany | Europe | EUR 0.057/kWh |
| Wang G.-R. et al. [78] | 2017 | 2017 | Biomass (gasification) | China | Asia | EUR 2.4–3.85/kg |
| Lei Y. et al. [79] | 2017 | 2017 | Biomass (reforming) | China | Asia | USD 0.231–0.465/kWh |
| Madeira J.G.F. et al. [80] | 2017 | 2017 | Biomass (reforming) | Brazil | S America | USD 0.13–0.24/kWh |
| Lee B. et al. [81] | 2017 | 2017 | Electrolysis | Korea | Asia | USD 7.72/kg |
| Yuksel Y.E. et al. [82] | 2017 | 2017 | Electrolysis (geothermal) | Turkey | Middle East | USD 1.1/kg |
| Lee B. et al. [81] | 2017 | 2017 | SMR | Korea | Asia | USD 7.59/kg |
| Ozcan H. et al. [83] | 2017 | 2017 | Water thermochemical | Canada | N America | USD 3.67/kg |
| Gillessen B. et al. [77] | 2017 | 2030 | Electrolysis (solar) | Germany | Europe | EUR 0.034/kWh |
| Schweitzer D. et al. [84] | 2018 | 2018 | Biomass (gasification) | Germany | Europe | EUR 6–10/kg |
| Di Marcoberardino G. et al. [85] | 2018 | 2018 | Biomass (reforming) | Italy | Europe | EUR 4–4.1/kg |
| Lin K.-W. et al. [86] | 2018 | 2018 | Biomass (reforming) | Taiwan | Asia | USD 5.1–5.66/kmol |
| Di Marcoberardino G. et al. [87] | 2018 | 2018 | Biomass (reforming) | Italy | Europe | EUR 4.2–5.0/kg |
| Ajanovic A. et al. [88] | 2018 | 2018 | Electrolysis (renewable) | Austria | Europe | EUR 0.07–0.12/kWh |
| Andresen L. et al. [89] | 2018 | 2018 | Electrolysis (renewable) | Germany | Europe | EUR 2.00–4.55/kg |
| Robinius M. et al. [90] | 2018 | 2018 | Electrolysis (renewable) | Germany | Europe | EUR 4–7.5/kg |
| Boudries R. [91] | 2018 | 2018 | Electrolysis (solar) | Algeria | Africa | USD 1.5–2.0/kg |
| Touili S. et al. [92] | 2018 | 2018 | Electrolysis (solar) | Morocco | Africa | USD 4.64–5.79/kg |
| Arora A. et al. [93] | 2018 | 2018 | SMR | US | N America | USD 2.13–3.12/kg |
| Riva L. et al. [94] | 2018 | 2018 | SMR | Europe | EUR 0.178/m3 | |
| Lee D.-Y. et al. [95] | 2018 | 2018 | Steam cracking | US | N America | USD 0.9–1.1/kg |
| Keipi T. et al. [96] | 2018 | 2018 | Thermal decomposition of methane | Finland | Europe | EUR 72/MWh |
| Ajanovic A.et al. [88] | 2018 | 2050 | Electrolysis (renewable) | Austria | Europe | EUR 0.06–0.09/kWh |
| Grabarczyk R. et al. [97] | 2019 | 2019 | Biomass (fermentation) | Poland | Europe | EUR 32.68/kg |
| Becker W.L. et al. [98] | 2019 | 2019 | Biomass (gasification) | US | N America | USD 2.48/kg |
| Rau F. et al. [99] | 2019 | 2019 | Biomass (reforming) | Germany | Europe | EUR 2.90–5.32/kg |
| Di Marcoberardino G. et al. [100] | 2019 | 2019 | Biomass (reforming) | Italy | Europe | EUR 4.01–4.11/kg |
| Chisalita D.-A. et al. [101] | 2019 | 2019 | Chemical looping | Romania | Europe | EUR 41.84/MWH |
| Bahzad H. et al. [102] | 2019 | 2019 | Chemical looping | UK | Europe | USD 1.16–2.10/kg |
| Bahzad H. et al. [103] | 2019 | 2019 | Chemical looping | UK | Europe | USD 1.41–1.62/kg |
| González Rodríguez D. et al. [104] | 2019 | 2019 | Electrolysis (nuclear) | Brazil | S America | USD 4.8–5.96/kg |
| Timmerberg S. et al. [105] | 2019 | 2019 | Electrolysis (renewable) | Algeria, Morocco, Libya | Africa | EUR 45–99/MWh |
| Grüger F. et al. [106] | 2019 | 2019 | Electrolysis (renewable) | Germany | Europe | EUR 11.52–13.42/kg |
| Arellano-Garcia H. et al. [107] | 2019 | 2019 | Electrolysis (solar) | Europe | USD 10.9–11.0/kg | |
| Micena R.P. et al. [108] | 2019 | 2019 | Electrolysis (solar) | Brazil | S America | USD 8.96–13.55/kg |
| Becker W.L. et al. [98] | 2019 | 2019 | Electrolysis (wind) | US | N America | USD 6.71/kg |
| Guerra O.J. et al. [109] | 2019 | 2020 | Electrolysis | UA | N America | USD 2.6–12.3/kg |
| Kikuchi Y. et al. [110] | 2019 | 2030 | Electrolysis (solar) | Japan | Asia | JPY 17.42–26.39/m3 |
| Khzouz M. et al. [111] | 2020 | 2020 | SMR | UK | Europe | USD 0.9/kg |
| Khzouz M. et al. [111] | 2020 | 2020 | Electrolysis | UK | Europe | USD 2.92/kg |
| Tolley T.E. et al. [112] | 2020 | 2020 | SMR | US | N America | USD 1.10/gge |
| He Y. et al. [113] | 2020 | 2020 | Chemical looping | China | Asia | USD 32.87/MWh |
| Armijo J. et al. [114] | 2020 | 2020 | Electrolysis (renewable) | Chile, Argentine | S America | USD 1.94–2.33/kg |
| Coleman D. et al. [115] | 2020 | 2020 | Electrolysis (wind) | Germany | Europe | EUR 3.50/kg |
| Schnuelle C. et al. [116] | 2020 | 2020 | Electrolysis (solar) | Germany | Europe | EUR 5.00/kg |
| Schnuelle C. et al. [116] | 2020 | 2020 | Electrolysis (wind) | Germany | Europe | EUR 4.33/kg |
| Roussanaly S. et al. [117] | 2020 | 2020 | SMR | Norway | Europe | EUR 12.2/m3 |
| Roussanaly S. et al. [117] | 2020 | 2020 | SMR + CCS | Norway | Europe | EUR 18.1ct/m3 |
| Lux B. et al. [118] | 2020 | 2050 | Electrolysis (renewable) | Europe | EUR 110/MWh | |
| Matute G. et al. [119] | 2021 | 2020 | Electrolysis | Spain | Europe | EUR 3.0/kg |
| Kazi M.-K. et al. [120] | 2021 | 2020 | Electrolysis (renewable) | Qatar | Middle East | USD 10.0/kg |
| Herwarts S. et al. [121] | 2021 | 2020 | Electrolysis (wind) | Germany | Europe | EUR 6.4/kg |
| Koleva M. et al. [122] | 2021 | 2020 | Electrolysis (solar) | US | N America | USD 6.59/kg |
| Koleva M. et al. [122] | 2021 | 2020 | SMR | US | N America | USD 1.34/kg |
| de Souza T.A.Z. et al. [123] | 2021 | 2020 | Biomass (reforming) | Brazil | S America | USD 2.42–5.26/kg |
References
- Maggio, G.; Nicita, A.; Squadrito, G. How the hydrogen production from RES could change energy and fuel markets: A review of recent literature. Int. J. Hydrogen Energy 2019, 44, 11371–11384. [Google Scholar] [CrossRef]
- Sharma, S.; Agarwal, S.; Jain, A. Significance of hydrogen as economic and environmentally friendly fuel. Energies 2021, 14, 7389. [Google Scholar] [CrossRef]
- Balat, M. Potential importance of hydrogen as a future solution to environmental and transportation problems. Int. J. Hydrogen Energy 2008, 33, 4013–4029. [Google Scholar] [CrossRef]
- Lysenko, S.; Sadaka, S.; Brown, R.C. Comparison of the cost of hydrogen from air-blown and thermally ballasted gasifiers. Biofuels Bioprod. Biorefining 2012, 6, 673–685. [Google Scholar] [CrossRef]
- US Department of Energy. DOE H2A Production Analysis. Available online: https://www.hydrogen.energy.gov/h2a_production.html (accessed on 15 May 2022).
- Lemus, R.G.; Martínez Duart, J.M. Updated hydrogen production costs and parities for conventional and renewable technologies. Int. J. Hydrogen Energy 2010, 35, 3929–3936. [Google Scholar] [CrossRef]
- BP. Statistical Review of World Energy. 2021. Available online: https://www.bp.com/en/global/corporate/energy-economics/statistical-review-of-world-energy.html (accessed on 15 May 2022).
- International Renewable Energy Agency. Renewable Power Generation Costs in 2020. 2021. Available online: https://www.irena.org/publications/2021/Jun/Renewable-Power-Costs-in-2020 (accessed on 15 May 2022).
- Christensen, A. Assessment of Hydrogen Production Costs from Electrolysis: United States and Europe; International Council on Clean Transportation: Washington, DC, USA, 2020. [Google Scholar]
- Food and Agriculture Organization of the United Nations. Food Outlook—Biannual Report on Global Food Markets. 2020. Available online: https://www.fao.org/documents/card/en/c/ca9509en/ (accessed on 15 May 2022).
- International Labour Organization. Global Wage Report 2020–2021. 2020. Available online: https://www.ilo.org/global/research/global-reports/global-wage-report/2020/lang--en/index.htm (accessed on 15 May 2022).
- International Energy Agency. Energy Technology Perspectives 2020, Special Report on Carbon Capture Utilisation and Storage. 2020. Available online: https://www.iea.org/reports/energy-technology-perspectives-2020 (accessed on 12 June 2022).
- Beghi, G.E. Present state and future prospects of thermochemical hydrogen production. Int. J. Hydrogen Energy 1979, 4, 499–512. [Google Scholar] [CrossRef]
- Broggi, A.; Joels, R.; Mertel, G.; Morbello, M. A method for the techno-economic evaluation of chemical processes-improvements to the “OPTIMO” code. Int. J. Hydrogen Energy 1981, 6, 25–44. [Google Scholar] [CrossRef]
- Carleson, G. Assessment of the potential future market in Sweden for hydrogen as an energy carrier. Int. J. Hydrogen Energy 1982, 7, 821–829. [Google Scholar] [CrossRef]
- Estève, D.; Ganibal, C.; Steinmetz, D.; Vialaron, A. Performance of a photovoltaic electrolysis system. Int. J. Hydrogen Energy 1982, 7, 711–716. [Google Scholar] [CrossRef]
- Krikorian, O.H.; Brown, L.C. Thermochemical hydrogen production based on magnetic fusion. Int. J. Hydrogen Energy 1983, 8, 515–528. [Google Scholar] [CrossRef] [Green Version]
- Aochi, A.; Tadokoro, T.; Yoshida, K.; Kameyama, H.; Nobue, M.; Yamaguchi, T. Economical and technical evaluation of UT-3 thermochemical hydrogen production process for an industrial scale plant. Int. J. Hydrogen Energy 1989, 14, 421–429. [Google Scholar] [CrossRef]
- Ogden, J.M. Cost and performance sensitivity studies for solar photovoltaic/electrolytic hydrogen systems. Sol. Cells 1991, 30, 515–523. [Google Scholar] [CrossRef]
- Shiga, H.; Shinda, K.; Hagiwara, K.; Tsutsumi, A.; Sakurai, M.; Yoshida, K.; Bilgen, E. Large-scale hydrogen production from biogas. Int. J. Hydrogen Energy 1998, 23, 631–640. [Google Scholar] [CrossRef]
- Ewan, B.C.R.; Allen, R.W.K. A figure of merit assessment of the routes to hydrogen. Int. J. Hydrogen Energy 2005, 30, 809–819. [Google Scholar] [CrossRef]
- Da Silva, E.P.; Marin Neto, A.J.; Ferreira, P.F.P.; Camargo, J.C.; Apolinário, F.R.; Pinto, C.S. Analysis of hydrogen production from combined photovoltaics, wind energy and secondary hydroelectricity supply in Brazil. Sol. Energy 2005, 78, 670–677. [Google Scholar] [CrossRef]
- Chen, Z.; Elnashaie, S.S.E.H. Economics of the clean fuel hydrogen in a novel autothermal reforming process. Ind. Eng. Chem. Res. 2005, 44, 4834–4840. [Google Scholar] [CrossRef]
- Chen, Z.; Elnashaie, S.S.E.H. Development of a novel autothermal reforming process and its economics for clean hydrogen production. Asia-Pac. J. Chem. Eng. 2006, 1, 5–12. [Google Scholar] [CrossRef]
- Giaconia, A.; Grena, R.; Lanchi, M.; Liberatore, R.; Tarquini, P. Hydrogen/methanol production by sulfur-iodine thermochemical cycle powered by combined solar/fossil energy. Int. J. Hydrogen Energy 2007, 32, 469–481. [Google Scholar] [CrossRef]
- Dowaki, K.; Ohta, T.; Kasahara, Y.; Kameyama, M.; Sakawaki, K.; Mori, S. An economic and energy analysis on bio-hydrogen fuel using a gasification process. Renew. Energy 2007, 32, 80–94. [Google Scholar] [CrossRef]
- Forsberg, P.; Karlström, M. On optimal investment strategies for a hydrogen refueling station. Int. J. Hydrogen Energy 2007, 32, 647–660. [Google Scholar] [CrossRef]
- Lv, P.; Wu, C.; Ma, L.; Yuan, Z. A study on the economic efficiency of hydrogen production from biomass residues in China. Renew. Energy 2008, 33, 1874–1879. [Google Scholar] [CrossRef]
- Muradov, N.; Smith, F.; T-Raissi, A. Hydrogen production by catalytic processing of renewable methane-rich gases. Int. J. Hydrogen Energy 2008, 33, 2023–2035. [Google Scholar] [CrossRef]
- Graf, D.; Monnerie, N.; Roeb, M.; Schmitz, M.; Sattler, C. Economic comparison of solar hydrogen generation by means of thermochemical cycles and electrolysis. Int. J. Hydrogen Energy 2008, 33, 4511–4519. [Google Scholar] [CrossRef]
- Charvin, P.; Stéphane, A.; Florent, L.; Gilles, F. Analysis of solar chemical processes for hydrogen production from water splitting thermochemical cycles. Energy Convers. Manag. 2008, 49, 1547–1556. [Google Scholar] [CrossRef]
- Rivera-Tinoco, R.; Mansilla, C.; Bouallou, C.; Werkoff, F. On the possibilities of producing hydrogen by high temperature electrolysis of water steam supplied from biomass or waste incineration units. Int. J. Green Energy 2008, 5, 388–404. [Google Scholar] [CrossRef]
- Rodrigues Halmeman, M.C.; Melegari de Souza, S.N.; Oyama, P.T. Potential and costs for the production of electrolytic hydrogen in alcohol and sugar cane plants in the central and south regions of Brazil. Int. J. Hydrogen Energy 2008, 33, 6858–6864. [Google Scholar] [CrossRef]
- Pilavachi, P.A.; Chatzipanagi, A.I.; Spyropoulou, A.I. Evaluation of hydrogen production methods using the Analytic Hierarchy Process. Int. J. Hydrogen Energy 2009, 34, 5294–5303. [Google Scholar] [CrossRef]
- Lewis, M.A.; Ferrandon, M.S.; Tatterson, D.F.; Mathias, P. Evaluation of alternative thermochemical cycles—Part III further development of the Cu-Cl cycle. Int. J. Hydrogen Energy 2009, 34, 4136–4145. [Google Scholar] [CrossRef]
- Pregger, T.; Graf, D.; Krewitt, W.; Sattler, C.; Roeb, M.; Möller, S. Prospects of solar thermal hydrogen production processes. Int. J. Hydrogen Energy 2009, 34, 4256–4267. [Google Scholar] [CrossRef]
- Wang, Z.L.; Naterer, G.F.; Gabriel, K.S.; Gravelsins, R.; Daggupati, V.N. Comparison of sulfur-iodine and copper-chlorine thermochemical hydrogen production cycles. Int. J. Hydrogen Energy 2010, 35, 4820–4830. [Google Scholar] [CrossRef]
- Ljunggren, M.; Zacchi, G. Techno-economic evaluation of a two-step biological process for hydrogen production. Biotechnol. Prog. 2010, 26, 496–504. [Google Scholar] [CrossRef] [PubMed]
- Leybros, J.; Saturnin, A.; Mansilla, C.; Gilardi, T.; Carles, P. Plant sizing and evaluation of hydrogen production costs from advanced processes coupled to a nuclear heat source: Part II: Hybrid-sulphur cycle. Int. J. Hydrogen Energy 2010, 35, 1019–1028. [Google Scholar] [CrossRef]
- Leybros, J.; Gilardi, T.; Saturnin, A.; Mansilla, C.; Carles, P. Plant sizing and evaluation of hydrogen production costs from advanced processes coupled to a nuclear heat source. Part I: Sulphur-iodine cycle. Int. J. Hydrogen Energy 2010, 35, 1008–1018. [Google Scholar] [CrossRef]
- Ljunggren, M.; Wallberg, O.; Zacchi, G. Techno-economic comparison of a biological hydrogen process and a 2nd generation ethanol process using barley straw as feedstock. Bioresour. Technol. 2011, 102, 9524–9531. [Google Scholar] [CrossRef] [PubMed]
- Müller, S.; Stidl, M.; Pröll, T.; Rauch, R.; Hofbauer, H. Hydrogen from biomass: Large-scale hydrogen production based on a dual fluidized bed steam gasification system. Biomass Convers. Biorefinery 2011, 1, 55–61. [Google Scholar] [CrossRef] [Green Version]
- Huisman, G.H.; Van Rens, G.L.M.A.; De Lathouder, H.; Cornelissen, R.L. Cost estimation of biomass-to-fuel plants producing methanol, dimethylether or hydrogen. Biomass Bioenergy 2011, 35 (Suppl. S1), S155–S166. [Google Scholar] [CrossRef]
- Mansilla, C.; Dautremont, S.; Shoai Tehrani, B.; Cotin, G.; Avril, S.; Burkhalter, E. Reducing the hydrogen production cost by operating alkaline electrolysis as a discontinuous process in the French market context. Int. J. Hydrogen Energy 2011, 36, 6407–6413. [Google Scholar] [CrossRef]
- Balta, M.T.; Dincer, I.; Hepbasli, A. Exergoeconomic analysis of a hybrid copper-chlorine cycle driven by geothermal energy for hydrogen production. Int. J. Hydrogen Energy 2011, 36, 11300–11308. [Google Scholar] [CrossRef]
- Lu, Y.; Zhao, L.; Guo, L. Technical and economic evaluation of solar hydrogen production by supercritical water gasification of biomass in China. Int. J. Hydrogen Energy 2011, 36, 14349–14359. [Google Scholar] [CrossRef]
- Menanteau, P.; Quéméré, M.M.; Le Duigou, A.; Le Bastard, S. An economic analysis of the production of hydrogen from wind-generated electricity for use in transport applications. Energy Policy 2011, 39, 2957–2965. [Google Scholar] [CrossRef] [Green Version]
- Holtermann, T.; Madlener, R. Assessment of the technological development and economic potential of photobioreactors. Appl. Energy 2011, 88, 1906–1919. [Google Scholar] [CrossRef]
- Corgnale, C.; Summers, W.A. Solar hydrogen production by the Hybrid Sulfur process. Int. J. Hydrogen Energy 2011, 36, 11604–11619. [Google Scholar] [CrossRef]
- Gim, B.; Yoon, W.L. Analysis of the economy of scale and estimation of the future hydrogen production costs at on-site hydrogen refueling stations in Korea. Int. J. Hydrogen Energy 2012, 37, 19138–19145. [Google Scholar] [CrossRef]
- Becker, W.L.; Braun, R.J.; Penev, M.; Melaina, M. Design and technoeconomic performance analysis of a 1 MW solid oxide fuel cell polygeneration system for combined production of heat. J. Power Source 2012, 200, 34–44. [Google Scholar] [CrossRef]
- Chiuta, S.; Blom, E. Techno-economic evaluation of a nuclear-assisted coal-to-liquid facility. Prog. Nucl. Energy 2012, 54, 68–74. [Google Scholar] [CrossRef]
- Mansilla, C.; Louyrette, J.; Albou, S.; Barbieri, G.; Collignon, N.; Bourasseau, C.; Salasc, B.; Valentin, S.; Dautremont, S.; Martin, J.; et al. Electric system management through hydrogen production-A market driven approach in the French context. Int. J. Hydrogen Energy 2012, 37, 10986–10991. [Google Scholar] [CrossRef]
- Genç, G.; Çelik, M.; Serdar Genç, M. Cost analysis of wind-electrolyzer-fuel cell system for energy demand in Pnarbaş-Kayseri. Int. J. Hydrogen Energy 2012, 37, 12158–12166. [Google Scholar] [CrossRef]
- Liberatore, R.; Lanchi, M.; Giaconia, A.; Tarquini, P. Energy and economic assessment of an industrial plant for the hydrogen production by water-splitting through the sulfur-iodine thermochemical cycle powered by concentrated solar energy. Int. J. Hydrogen Energy 2012, 37, 9550–9565. [Google Scholar] [CrossRef]
- Mansilla, C.; Louyrette, J.; Albou, S.; Bourasseau, C.; Dautremont, S. Economic competitiveness of off-peak hydrogen production today—A european comparison. Energy 2013, 55, 996–1001. [Google Scholar] [CrossRef]
- Wu, W.; Wang, C.-Y. Design and control of stand-alone hydrogen production systems with maximum waste heat recovery. Ind. Eng. Chem. Res. 2013, 52, 14601–14612. [Google Scholar] [CrossRef]
- Olateju, B.; Kumar, A. Techno-economic assessment of hydrogen production from underground coal gasification (UCG) in Western Canada with carbon capture and sequestration (CCS) for upgrading bitumen from oil sands. Appl. Energy 2013, 111, 428–440. [Google Scholar] [CrossRef]
- Urbaniec, K.; Grabarczyk, R. Hydrogen production from sugar beet molasses—A techno-economic study. J. Clean. Prod. 2014, 65, 324–329. [Google Scholar] [CrossRef]
- Brown, D.; Rowe, A.; Wild, P. Techno-economic comparisons of hydrogen and synthetic fuel production using forest residue feedstock. Int. J. Hydrogen Energy 2014, 39, 12551–12562. [Google Scholar] [CrossRef]
- Olateju, B.; Monds, J.; Kumar, A. Large scale hydrogen production from wind energy for the upgrading of bitumen from oil sands. Appl. Energy 2014, 118, 48–56. [Google Scholar] [CrossRef]
- Guo, L.J.; Jin, H.; Ge, Z.W.; Lu, Y.J.; Cao, C.Q. Industrialization prospects for hydrogen production by coal gasification in supercritical water and novel thermodynamic cycle power generation system with no pollution emission. Sci. China Technol. Sci. 2015, 58, 1989–2002. [Google Scholar] [CrossRef]
- Bennoua, S.; Le Duigou, A.; Quéméré, M.-M.; Dautremont, S. Role of hydrogen in resolving electricity grid issues. Int. J. Hydrogen Energy 2015, 40, 7231–7245. [Google Scholar] [CrossRef]
- Matzen, M.; Alhajji, M.; Demirel, Y. Chemical storage of wind energy by renewable methanol production: Feasibility analysis using a multi-criteria decision matrix. Energy 2015, 93, 343–353. [Google Scholar] [CrossRef] [Green Version]
- Galera, S.; Gutiérrez Ortiz, F.J. Techno-economic assessment of hydrogen and power production from supercritical water reforming of glycerol. Fuel 2015, 144, 307–316. [Google Scholar] [CrossRef]
- Loisel, R.; Baranger, L.; Chemouri, N.; Spinu, S.; Pardo, S. Economic evaluation of hybrid off-shore wind power and hydrogen storage system. Int. J. Hydrogen Energy 2015, 40, 6727–6739. [Google Scholar] [CrossRef]
- Han, W.; Hu, Y.Y.; Li, S.Y.; Li, F.F.; Tang, J.H. Biohydrogen production from waste bread in a continuous stirred tank reactor: A techno-economic analysis. Bioresour. Technol. 2016, 221, 318–323. [Google Scholar] [CrossRef] [Green Version]
- Abuşoğlu, A.; Demir, S.; Özahi, E. Energy and economic analyses of models developed for sustainable hydrogen production from biogas-based electricity and sewage sludge. Int. J. Hydrogen Energy 2016, 41, 13426–13435. [Google Scholar] [CrossRef]
- Olateju, B.; Kumar, A. A techno-economic assessment of hydrogen production from hydropower in Western Canada for the upgrading of bitumen from oil sands. Energy 2016, 115, 604–614. [Google Scholar] [CrossRef]
- Southall, G.D.; Khare, A. The feasibility of distributed hydrogen production from renewable energy sources and the financial contribution from UK motorists on environmental grounds. Sustain. Cities Soc. 2016, 26, 134–149. [Google Scholar] [CrossRef]
- Olateju, B.; Kumar, A.; Secanell, M. A techno-economic assessment of large scale wind-hydrogen production with energy storage in Western Canada. Int. J. Hydrogen Energy 2016, 41, 8755–8776. [Google Scholar] [CrossRef]
- AlRafea, K.; Fowler, M.; Elkamel, A.; Hajimiragha, A. Integration of renewable energy sources into combined cycle power plants through electrolysis generated hydrogen in a new designed energy hub. Int. J. Hydrogen Energy 2016, 41, 16718–16728. [Google Scholar] [CrossRef]
- Oh, T.H. A formic acid hydrogen generator using Pd/C3N4 catalyst for mobile proton exchange membrane fuel cell systems. Energy 2016, 112, 679–685. [Google Scholar] [CrossRef]
- Shafiee, A.; Arab, M.; Lai, Z.; Liu, Z.; Abbas, A. Modelling and sequential simulation of multi-tubular metallic membrane and techno-economics of a hydrogen production process employing thin-layer membrane reactor. Int. J. Hydrogen Energy 2016, 41, 19081–19097. [Google Scholar] [CrossRef]
- Couto, N.D.; Silva, V.B.; Rouboa, A. Assessment on steam gasification of municipal solid waste against biomass substrates. Energy Convers. Manag. 2016, 124, 92–103. [Google Scholar] [CrossRef]
- Chang, W.-C.; Huang, A.Y.-J.; Huang, D.-R.; Chen, T.-Y. An economic evaluation on the purification and storage of waste hydrogen for the use of fuel cell scooters. Int. J. Green Energy 2016, 13, 1608–1614. [Google Scholar] [CrossRef]
- Gillessen, B.; Heinrichs, H.U.; Stenzel, P.; Linssen, J. Hybridization strategies of power-to-gas systems and battery storage using renewable energy. Int. J. Hydrogen Energy 2017, 42, 13554–13567. [Google Scholar] [CrossRef]
- Wang, G.-R.; Li, D.-X.; Ruan, W.-B.; Jin, C.-L. Simulation and economic study of hydrogen production from biomass and RDF gasification. Energy Sources Part B Econ. Plan. Policy 2017, 12, 1061–1065. [Google Scholar] [CrossRef]
- Lei, Y.; Bin, Y.; Peng, J. Economic analysis of hydrogen production from steam reforming process. Energy Sources Part B Econ. Plan. Policy 2017, 12, 1074–1079. [Google Scholar] [CrossRef]
- Madeira, J.G.F.; Delgado, A.R.S.; Boloy, R.A.M.; Coutinho, E.R.; Loures, C.C.A. Exergetic and economic evaluation of incorporation of hydrogen production in a cassava wastewater plant. Appl. Therm. Eng. 2017, 123, 1072–1078. [Google Scholar] [CrossRef]
- Lee, B.; Chae, H.; Choi, N.H.; Moon, C.; Moon, S.; Lim, H. Economic evaluation with sensitivity and profitability analysis for hydrogen production from water electrolysis in Korea. Int. J. Hydrogen Energy 2017, 42, 6462–6471. [Google Scholar] [CrossRef]
- Yuksel, Y.E.; Ozturk, M. Thermodynamic and thermoeconomic analyses of a geothermal energy based integrated system for hydrogen production. Int. J. Hydrogen Energy 2017, 42, 2530–2546. [Google Scholar] [CrossRef]
- Ozcan, H.; Dincer, I. Exergoeconomic optimization of a new four-step magnesium–chlorine cycle. Int. J. Hydrogen Energy 2017, 42, 2435–2445. [Google Scholar] [CrossRef]
- Schweitzer, D.; Albrecht, F.G.; Schmid, M.; Beirow, M.; Spörl, R.; Dietrich, R.-U.; Seitz, A. Process simulation and techno-economic assessment of SER steam gasification for hydrogen production. Int. J. Hydrogen Energy 2018, 43, 569–579. [Google Scholar] [CrossRef]
- Di Marcoberardino, G.; Foresti, S.; Binotti, M.; Manzolini, G. Potentiality of a biogas membrane reformer for decentralized hydrogen production. Chem. Eng. Process.-Process Intensif. 2018, 129, 131–141. [Google Scholar] [CrossRef]
- Lin, K.-W.; Wu, H.-W. Hydrogen-rich syngas production of urea blended with biobutanol by a thermodynamic analysis. Int. J. Hydrogen Energy 2018, 43, 17562–17573. [Google Scholar] [CrossRef]
- Di Marcoberardino, G.; Vitali, D.; Spinelli, F.; Binotti, M.; Manzolini, G. Green hydrogen production from raw biogas: A techno-economic investigation of conventional processes using pressure swing adsorption unit. Processes 2018, 6, 19. [Google Scholar] [CrossRef] [Green Version]
- Ajanovic, A.; Haas, R. Economic prospects and policy framework for hydrogen as fuel in the transport sector. Energy Policy 2018, 123, 280–288. [Google Scholar] [CrossRef]
- Andresen, L.; Bode, C.; Schmitz, G. Dynamic simulation of different transport options of renewable hydrogen to a refinery in a coupled energy system approach. Int. J. Hydrogen Energy 2018, 43, 19600–19614. [Google Scholar] [CrossRef]
- Robinius, M.; Raje, T.; Nykamp, S.; Rott, T.; Müller, M.; Grube, T.; Katzenbach, B.; Küppers, S.; Stolten, D. Power-to-Gas: Electrolyzers as an alternative to network expansion—An example from a distribution system operator. Appl. Energy 2018, 210, 182–197. [Google Scholar] [CrossRef]
- Boudries, R. Techno-economic study of hydrogen production using CSP technology. Int. J. Hydrogen Energy 2018, 43, 3406–3417. [Google Scholar] [CrossRef]
- Touili, S.; Alami Merrouni, A.; Azouzoute, A.; El Hassouani, Y.; Amrani, A.-I. A technical and economical assessment of hydrogen production potential from solar energy in Morocco. Int. J. Hydrogen Energy 2018, 43, 22777–22796. [Google Scholar] [CrossRef]
- Arora, A.; Bajaj, I.; Iyer, S.S.; Hasan, M.M.F. Optimal synthesis of periodic sorption enhanced reaction processes with application to hydrogen production. Comput. Chem. Eng. 2018, 115, 89–111. [Google Scholar] [CrossRef] [Green Version]
- Riva, L.; Martínez, I.; Martini, M.; Gallucci, F.; van Sint Annaland, M.; Romano, M.C. Techno-economic analysis of the Ca-Cu process integrated in hydrogen plants with CO2 capture. Int. J. Hydrogen Energy 2018, 43, 15720–15738. [Google Scholar] [CrossRef]
- Lee, D.-Y.; Elgowainy, A. By-product hydrogen from steam cracking of natural gas liquids (NGLs): Potential for large-scale hydrogen fuel production, life-cycle air emissions reduction, and economic benefit. Int. J. Hydrogen Energy 2018, 43, 20143–20160. [Google Scholar] [CrossRef]
- Keipi, T.; Tolvanen, H.; Konttinen, J. Economic analysis of hydrogen production by methane thermal decomposition: Comparison to competing technologies. Energy Convers. Manag. 2018, 159, 264–273. [Google Scholar] [CrossRef]
- Grabarczyk, R.; Urbaniec, K.; Wernik, J.; Trafczynski, M. Evaluation of the two-stage fermentative hydrogen production from sugar beet molasses. Energies 2019, 12, 4090. [Google Scholar] [CrossRef] [Green Version]
- Becker, W.L.; Penev, M.; Braun, R.J. Production of synthetic natural gas from carbon dioxide and renewably generated hydrogen: A techno-economic analysis of a power-to-gas strategy. J. Energy Resour. Technol. Trans. ASME 2019, 141, 21901. [Google Scholar] [CrossRef]
- Rau, F.; Herrmann, A.; Krause, H.; Fino, D.; Trimis, D. Efficiency of a pilot-plant for the autothermal reforming of biogas. Int. J. Hydrogen Energy 2019, 44, 19135–19140. [Google Scholar] [CrossRef]
- Di Marcoberardino, G.; Liao, X.; Dauriat, A.; Binotti, M.; Manzolini, G. Life cycle assessment and economic analysis of an innovative biogas membrane reformer for hydrogen production. Processes 2019, 7, 86. [Google Scholar] [CrossRef] [Green Version]
- Chisalita, D.-A.; Cormos, C.-C. Techno-economic assessment of hydrogen production processes based on various natural gas chemical looping systems with carbon capture. Energy 2019, 181, 331–344. [Google Scholar] [CrossRef]
- Bahzad, H.; Katayama, K.; Boot-Handford, M.E.; Mac Dowell, N.; Shah, N.; Fennell, P.S. Iron-based chemical-looping technology for decarbonising iron and steel production. Int. J. Greenh. Gas Control 2019, 91, 102766. [Google Scholar] [CrossRef]
- Bahzad, H.; Shah, N.; Dowell, N.M.; Boot-Handford, M.; Soltani, S.M.; Ho, M.; Fennell, P.S. Development and techno-economic analyses of a novel hydrogen production process via chemical looping. Int. J. Hydrogen Energy 2019, 44, 21251–21263. [Google Scholar] [CrossRef]
- González Rodríguez, D.; Brayner de Oliveira Lira, C.A.; García Hernández, C.R.; Roberto de Andrade Lima, F. Hydrogen production methods efficiency coupled to an advanced high-temperature accelerator driven system. Int. J. Hydrogen Energy 2019, 44, 1392–1408. [Google Scholar] [CrossRef]
- Timmerberg, S.; Kaltschmitt, M. Hydrogen from renewables: Supply from North Africa to Central Europe as blend in existing pipelines—Potentials and costs. Appl. Energy 2019, 237, 795–809. [Google Scholar] [CrossRef]
- Grüger, F.; Hoch, O.; Hartmann, J.; Robinius, M.; Stolten, D. Optimized electrolyzer operation: Employing forecasts of wind energy availability, hydrogen demand, and electricity prices. Int. J. Hydrogen Energy 2019, 44, 4387–4397. [Google Scholar] [CrossRef]
- Arellano-Garcia, H.; Ife, M.R.; Sanduk, M.; Sebastia-Saez, D. Hydrogen Production via Load-Matched Coupled Solar-Proton Exchange Membrane Electrolysis Using Aqueous Methanol. Chem. Eng. Technol. 2019, 42, 2340–2347. [Google Scholar] [CrossRef]
- Micena, R.P.; Llerena-Pizarro, O.R.; de Souza, T.M.; Silveira, J.L. Solar-powered Hydrogen Refueling Stations: A techno-economic analysis. Int. J. Hydrogen Energy 2019, 45, 2308–2318. [Google Scholar] [CrossRef]
- Guerra, O.J.; Eichman, J.; Kurtz, J.; Hodge, B.-M. Cost Competitiveness of Electrolytic Hydrogen. Joule 2019, 3, 2425–2443. [Google Scholar] [CrossRef]
- Kikuchi, Y.; Ichikawa, T.; Sugiyama, M.; Koyama, M. Battery-assisted low-cost hydrogen production from solar energy: Rational target setting for future technology systems. Int. J. Hydrogen Energy 2019, 44, 1451–1465. [Google Scholar] [CrossRef]
- Khzouz, M.; Gkanas, E.I.; Shao, J.; Sher, F.; Beherskyi, D.; El-Kharouf, A.; Qubeissi, M.A. Life Cycle Costing Analysis: Tools and Applications for Determining Hydrogen Production Cost for Fuel Cell Vehicle Technology. Energies 2020, 13, 3783. [Google Scholar] [CrossRef]
- Tolley, T.E.; Fronk, B.M. Investigation of the benefits of diabatic microreactors for process intensification of the water-gas shift reaction within the steam reforming process. Int. J. Hydrogen Energy 2020, 45, 31507–31522. [Google Scholar] [CrossRef]
- He, Y.; Zhu, L.; Li, L.; Liu, G. Hydrogen and Power Cogeneration Based on Chemical Looping Combustion: Is It Capable of Reducing Carbon Emissions and the Cost of Production? Energy Fuels 2020, 34, 3501–3512. [Google Scholar] [CrossRef]
- Armijo, J.; Philibert, C. Flexible production of green hydrogen and ammonia from variable solar and wind energy: Case study of Chile and Argentina. Int. J. Hydrogen Energy 2020, 45, 1541–1558. [Google Scholar] [CrossRef]
- Coleman, D.; Kopp, M.; Wagner, T.; Scheppat, B. The value chain of green hydrogen for fuel cell buses—A case study for the Rhine-Main area in Germany. Int. J. Hydrogen Energy 2020, 45, 5122–5133. [Google Scholar] [CrossRef]
- Schnuelle, C.; Wassermann, T.; Fuhrlaender, D.; Zondervan, E. Dynamic hydrogen production from PV & wind direct electricity supply—Modeling and techno-economic assessment. Int. J. Hydrogen Energy 2020, 45, 29938–29952. [Google Scholar]
- Roussanaly, S.; Anantharaman, R.; Fu, C. Low-carbon footprint hydrogen production from natural gas: A techno-economic analysis of carbon capture and storage from steam-methane reforming. Chem. Eng. Trans. 2020, 81, 1015–1020. [Google Scholar]
- Lux, B.; Pfluger, B. A supply curve of electricity-based hydrogen in a decarbonized European energy system in 2050. Appl. Energy 2020, 269, 115011. [Google Scholar] [CrossRef]
- Matute, G.; Yusta, J.M.; Beyza, J.; Correas, L.C. Multi-state techno-economic model for optimal dispatch of grid connected hydrogen electrolysis systems operating under dynamic conditions. Int. J. Hydrogen Energy 2021, 46, 1449–1460. [Google Scholar] [CrossRef]
- Kazi, M.-K.; Eljack, F.; El-Halwagi, M.M.; Haouari, M. Green hydrogen for industrial sector decarbonization: Costs and impacts on hydrogen economy in Qatar. Comput. Chem. Eng. 2021, 145, 107144. [Google Scholar] [CrossRef]
- Herwartz, S.; Pagenkopf, J.; Streuling, C. Sector coupling potential of wind-based hydrogen production and fuel cell train operation in regional rail transport in berlin and Brandenburg. Int. J. Hydrogen Energy 2021, 46, 29597–29615. [Google Scholar] [CrossRef]
- Koleva, M.; Guerra, O.J.; Eichman, J.; Hodge, B.-M.; Kurtz, J. Optimal design of solar-driven electrolytic hydrogen production systems within electricity markets. J. Power Source 2021, 483, 229183. [Google Scholar] [CrossRef]
- De Souza, T.A.Z.; Coronado, C.J.R.; Silveira, J.L.; Pinto, G.M. Economic assessment of hydrogen and electricity cogeneration through steam reforming-SOFC system in the Brazilian biodiesel industry. J. Clean. Prod. 2021, 279, 123814. [Google Scholar] [CrossRef]

| Field | Option Introduced |
|---|---|
| Keywords | “hydrogen” AND “economic *” 1 AND “supply chain” |
| Search in | Title, abstract, keywords |
| Period explored | Open |
| Type of documents | Articles |
| Language | English |
| Database | Scopus |
| Production Technology | Storage | Delivery Mode | Refilling |
|---|---|---|---|
| Coal gasification | Liquid | Tanker truck | Liquid refilling |
| Gas reformer (SMR) | Compressed gas | Tube trailer | Gas refilling |
| Biomass gasification | Ammonia | Pipeline | Onsite reforming |
| Electrolysis | Railway | ||
| Ship |
| Field | Option Selected |
|---|---|
| Keywords | “hydrogen production cost” |
| Search in | Title, abstract, keywords |
| Period explored | Open |
| Type of documents | Articles |
| Language | English |
| Database | Scopus |
| Hydrogen conversion | 1 Gigajoule (GJ) = 8.333 kg |
| 1 Cubic meter (m3) = 0.08988 kg | |
| 1 Megawatt hour (MWh) = 30.0 kg | |
| 1 kilo mol (kmol) = 2.02 kg | |
| Exchange rates | Purchasing power parity (OECD) |
| (USD/kg) | Total | Gray (Coal and Gas) | Renewable Electrolysis | Biomass (Gasification and Reforming) | Others |
|---|---|---|---|---|---|
| Number of Samples | 174 | 44 | 48 | 29 | 53 |
| Average | 4.81 | 2.08 | 6.05 | 3.18 | 6.85 |
| Max. | 65.35 | 7.59 | 16.31 | 8.38 | 65.35 |
| Min. | 0.21 | 0.53 | 1.08 | 0.21 | 0.84 |
| Stdev. | 6.70 | 1.41 | 3.82 | 2.03 | 10.81 |
| Obs. | R. sum | Ex. | Obs. | R. sum | Ex. | Obs. | R. sum | Ex. | Obs. | R. sum | Ex. | Obs. | R. sum | Ex. | |
|---|---|---|---|---|---|---|---|---|---|---|---|---|---|---|---|
| Entire Period | –2000 | 2001–2010 | 2011–2015 | 2016–2020 | |||||||||||
| Gray | 44 | 2225 | 3850 | 6 | 38 | 63 | 15 | 190.5 | 337.5 | 13 | 160 | 299 | 10 | 183 | 330 |
| Others | 130 | 13,000 | 11,375 | 14 | 172 | 147 | 29 | 799.5 | 652.5 | 32 | 875 | 736 | 55 | 1962 | 1815 |
| Total | 174 | 15,225 | 15,225 | 20 | 210 | 210 | 44 | 990 | 990 | 45 | 1035 | 1035 | 65 | 2145 | 2145 |
| z value | 5.626 *** | 2.063 ** | 3.640 *** | 3.481 *** | 2.673 *** | ||||||||||
| Published Years | Number of Observations | Rank-Sum |
|---|---|---|
| −2000 | 6 | 41 |
| 2001–2010 | 15 | 320 |
| 2011–2015 | 13 | 375 |
| 2016–2020 | 10 | 254 |
| Chi-squared value: 12.732 with 3 d.f. | ||
| p-value: 0.0053 | ||
| Obs. | R. sum | Ex. | Obs. | R. sum | Ex. | Obs. | R. sum | Ex. | |
|---|---|---|---|---|---|---|---|---|---|
| –2000 vs. 2001–2010 | 2001–2010 vs. 2011–2015 | 2011–2015 vs. 2016–2020 | |||||||
| Earlier | 6 | 34 | 66 | 15 | 184 | 217.5 | 13 | 168 | 156 |
| Later | 15 | 197 | 165 | 13 | 222 | 188.5 | 10 | 108 | 120 |
| Total | 21 | 231 | 231 | 28 | 406 | 406 | 23 | 276 | 276 |
| z value | −2.492 ** | −1.544 | 0.744 | ||||||
| Obs. | R. sum | Ex. | Obs. | R. sum | Ex. | Obs. | R. sum | Ex. | Obs. | R. sum | Ex. | Obs. | R. sum | Ex. | |
|---|---|---|---|---|---|---|---|---|---|---|---|---|---|---|---|
| Entire Period | –2000 | 2001–2010 | 2011–2015 | 2016–2020 | |||||||||||
| R. Elec | 48 | 5628 | 4200 | 3 | 48 | 31.5 | 9 | 282 | 202.5 | 10 | 338.5 | 230 | 26 | 1009.5 | 858 |
| Others | 126 | 9597 | 11,025 | 17 | 162 | 178.5 | 35 | 708 | 787.5 | 35 | 696.5 | 805 | 39 | 1135.5 | 1287 |
| Total | 174 | 15,225 | 15,225 | 20 | 210 | 210 | 44 | 990 | 990 | 45 | 1035 | 1035 | 65 | 2145 | 2145 |
| z value | −4.808 *** | −1.747 * | −2.313 ** | −2.962 *** | −2.029 ** | ||||||||||
| R.Elec Issued | Obs | Rank-Sum |
|---|---|---|
| −2000 | 3 | 73.5 |
| 2001–2010 | 9 | 254.5 |
| 2011–2015 | 10 | 269 |
| 2016–2020 | 26 | 579 |
| chi-squared value: 1.609 with 3 d.f. | ||
| p-value: 0.6573 | ||
| Obs. | R. sum | Ex. | Obs. | R. sum | Ex. | Obs. | R. sum | Ex. | |
|---|---|---|---|---|---|---|---|---|---|
| –2000 vs. 2001–2010 | 2001–2010 vs. 2011–2015 | 2011–2015 vs. 2016–2020 | |||||||
| Earlier | 3 | 18.5 | 19.5 | 9 | 93 | 90 | 10 | 212 | 185 |
| Later | 9 | 59.5 | 58.5 | 10 | 97 | 100 | 26 | 454 | 481 |
| Total | 12 | 78 | 78 | 19 | 190 | 190 | 36 | 666 | 666 |
| z value | −0.185 | 0.245 | 0.954 | ||||||
| Obs. | R. sum | Ex. | Obs. | R. sum | Ex. | Obs. | R. sum | Ex. | Obs. | R. sum | Ex. | Obs. | R. sum | Ex. | |
|---|---|---|---|---|---|---|---|---|---|---|---|---|---|---|---|
| Entire Period | –2000 | 2001–2010 | 2011–2015 | 2016–2020 | |||||||||||
| Biomass | 29 | 2257.5 | 2538 | 4 | 38.5 | 42 | 8 | 134.5 | 180 | 6 | 78 | 138 | 11 | 427.5 | 363 |
| Others | 145 | 12,968 | 12,688 | 16 | 171.5 | 168 | 36 | 855.5 | 810 | 39 | 957 | 897 | 54 | 1717.5 | 1782 |
| Total | 174 | 15,225 | 15,225 | 20 | 210 | 210 | 44 | 990 | 990 | 45 | 1035 | 1035 | 65 | 2145 | 2145 |
| z value | 1.131 | 0.331 | 1.385 | 2.003 ** | −1.128 | ||||||||||
| Biomass Issued | Obs | Rank-Sum |
|---|---|---|
| −2000 | 4 | 12 |
| 2001–2010 | 8 | 103 |
| 2011–2015 | 6 | 76 |
| 2016–2020 | 11 | 244 |
| chi-squared = 16.719 with 3 d.f. | ||
| probability = 0.0008 | ||
| Obs. | R. sum | Ex. | Obs. | R. sum | Ex. | Obs. | R. sum | Ex. | |
|---|---|---|---|---|---|---|---|---|---|
| –2000 vs. 2001–2010 | 2001–2010 vs. 2011–2015 | 2011–2015 vs. 2016–2020 | |||||||
| Earlier | 4 | 12 | 26 | 8 | 56 | 60 | 6 | 24 | 54 |
| Later | 8 | 66 | 52 | 6 | 49 | 45 | 11 | 129 | 99 |
| Total | 12 | 78 | 78 | 14 | 105 | 105 | 17 | 153 | 153 |
| z value | −2.378 ** | -0.516 | −3.015 *** | ||||||
Publisher’s Note: MDPI stays neutral with regard to jurisdictional claims in published maps and institutional affiliations. |
© 2022 by the authors. Licensee MDPI, Basel, Switzerland. This article is an open access article distributed under the terms and conditions of the Creative Commons Attribution (CC BY) license (https://creativecommons.org/licenses/by/4.0/).
Share and Cite
Miyagawa, T.; Goto, M. Hydrogen Production Cost Forecasts since the 1970s and Implications for Technological Development. Energies 2022, 15, 4375. https://doi.org/10.3390/en15124375
Miyagawa T, Goto M. Hydrogen Production Cost Forecasts since the 1970s and Implications for Technological Development. Energies. 2022; 15(12):4375. https://doi.org/10.3390/en15124375
Chicago/Turabian StyleMiyagawa, Tomonori, and Mika Goto. 2022. "Hydrogen Production Cost Forecasts since the 1970s and Implications for Technological Development" Energies 15, no. 12: 4375. https://doi.org/10.3390/en15124375
APA StyleMiyagawa, T., & Goto, M. (2022). Hydrogen Production Cost Forecasts since the 1970s and Implications for Technological Development. Energies, 15(12), 4375. https://doi.org/10.3390/en15124375