1. Introduction
One of the methods of improving the reliability of transportation systems involves increasing the safety of people and of the environment, which translates into maintaining the continuity of the transportation process. An analysis of a danger zone range is of crucial importance to the assessment of leak, fire or explosion consequences and to the process of risk acceptability. Such analyses facilitate implementing modifications to risk management and introducing changes to existing emergency plans. Computer simulations of emergency modelling constitute a good quality assurance tool. At the same time, they enable a description of the reliability of the entire complex system. Simulation models support the organisation of the operation of prevention systems that are intended to monitor hazardous substance release and rescue operations in the event of an uncontrolled depressurization which subsequently leads to hazardous substance propagation [
1]. An important issue that aims to increase energy quality and energy safety of every country, apart from the diversification of energy sources, is a variety of the modes of transport used for the substances that constitute energy sources [
2]. In that regard it needs to be noted that maritime transport constitutes a significant component of a delivery chain, which is a relatively inexpensive method of transporting a large amount of substances [
3]. Transport development is correlated with GDP growth, while expanding globalization is a process that is a natural force intensifying the processes related to transport. From the standpoint of ensuring transport reliability, the development of transport infrastructure is not sufficient. In order to improve transport systems efficiency, innovative solutions need to be introduced, which will contribute to raising reliability and consequently to raising safety levels and the continuity of deliveries [
4,
5]. A crucial element related to safety improvement involves an emergency scenario analysis, which enables the optimization of a transport network. Modelling and analysis of dangerous scenarios makes it possible to raise the level of reliability and improving operational and quality indicators, thereby contributing to efficient transport management, while simultaneously ensuring care for the environment, human health and infrastructure [
6,
7,
8,
9,
10]. The process of climate change taking place before our very eyes and a simultaneous intensively growing demand for energy forces us to constantly search for new energy sources as well as innovative application of already known and available energy sources [
11,
12,
13,
14]. Growing restrictions regarding exhaust emissions [
15,
16], and oil costs lead to an increasing interest in fuels other than oil or coal [
17,
18,
19]. In these circumstances, methane appears to be an interesting product, even though it is classified as an extremely flammable compound, in order to reach its flammability limit it needs to go into a gaseous phase and reach a volume fraction of 5–15% in the air. The above-mentioned properties of methane disappear when methane is liquefied. Methane liquefaction, irrespective of the method used, is not really problematic. A similarly intensively developing process of LNG quality control enables determining the composition and physical-chemical properties of regasified LNG [
20,
21].
Methane is obtained from natural gas, which in the process of liquefaction is purified of water, carbon dioxide and sulphur compounds, making it possible to treat liquefied methane as an energy source emitting fewer pollutants in the form of SOx as well as CO
2, since those are removed from natural gas at the stage of its liquefaction. Natural gas in liquid phase, known as LNG (Liquefied Natural Gas), is convenient to transport, provided that it is maintained at a low temperature of −163 [°C]. At such a low temperature, LNG can be transported under regular pressure. However, the above arguments do not mean that transport of LNG and the process of its warehousing in the port area do not involve any risks [
22,
23]. The consequences of releasing LNG into the natural environment may entail a fire, an explosion, burns or cryogenic frostbite [
24,
25]. In the event of an uncontrolled LNG emission, it is suddenly converted into gaseous phase compounded with a dramatic volume change (600-fold increase in volume) [
26,
27]. Therefore, the implementation of procedures designed to improve the safety of transport, pumping and storage of a hazardous substance constitutes a major issue [
27]. In order to refine the procedures related to maintaining the continuation of transportation processes, scenarios of uncontrolled substance release into the environment need to be analysed. Such information cannot always be obtained through research conducted in micro scale, since it frequently does not translate into macro scale. In a laboratory, variable environment conditions cannot be taken into account, which has an impact on the imperfection of the laboratory data obtained [
28,
29]. Furthermore, it must be noted that the currently available models of chemical substance distribution often do not take into consideration turbulences and Pasquill stability schemes [
30].
Furthermore, defining a danger zone range up to the level of 2.5 [% V] for LNG over water surface is problematic, particularly in terms of the turbulences caused by LNG dispersion and vaporization over water surface, which constitute crucial factors for the expansion of an LNG vapour cloud. In each of the above-mentioned case it is vital to immediately define the ranges of the zones for which gaseous methane concentration reaches the level of an LFL-Fraction (Lower Flammable Limit-Fraction).
This article shows that although the physical and chemical properties of LNG are well known, defining the risks and risk areas for LNG unsealing can be problematic. The presented scenarios show how unpredictable the consequences of LNG leaks are as a function of weather conditions. The calculations suggest how strongly the range of danger zones depends on the changing weather conditions. At the same time, the authors emphasize that it is impossible to underline one dominant factor responsible for the extent of cloud cover or thermal radiation for all cases, because the factors directly affect each other and, as a result, the dominant parameter changes as a function of the selected weather conditions. The well-known size of hazardous zones, from thermal and toxicological points of view, contribute to the proper matching of technical solutions in order to minimize the effects of the accident.
The management of crisis situation, and thus the concern about ensuring safety for people and the environment, enforces the development and system update in order to reduce the risk associated with an emergency situation. The analysis of LNG release scenarios is essential for taking control and reacting efficiently over the critical situation.
2. Materials and Methods
Considering the fact that ensuring safety in the areas in which LNG spills may occur is a priority, the sites that may be the source of danger must be identified first, following which the danger zone dimensions resulting from LNG spills must be determined [
31,
32]. Computer simulations appear to be helpful in determining the dimensions of danger zones, since they enable the forecasting of the propagation of a hazardous substance, which makes it possible to select suitable forces and methods related to the utilisation of the spilled substance [
28,
33,
34,
35]. This article features a cycle of simulations with the use of DNV-Phast software for depressurization instances arising in the course of vessel manoeuvres and for an LNG spill from a damaged tank of a bulk carrier. The calculations were conducted for two LNG types (LNG-Light and LNG-Heavy) with the chemical composition presented in
Table 1. The choice of an LNG type is dictated by qualitative and quantitative parameters of the LNG delivered to LNG terminal in Świnoujście (Poland).
The calculations were carried out for the following geographic coordinates: 53.937476, 14.280516 (53°56′14.914 N, 14°16′49.857 E), which correspond to the most protruding part of the Eastern Breakwater in Świnoujście. Weather conditions were selected in such a way so as to reflect average annual insolation in the analysed area. The simulations featured an assumed wind speed of 1.5 [m/s] for night-time conditions, which corresponds to Pasquill stability class F (stable—night with moderate clouds and light moderate wind) and a wind speed of Beaufort force 1, as well as 5 [m/s] for daytime conditions corresponding to Pasquill stability class D (neutral—little sun and high wind or overcast/windy night). This speed is equivalent to a wind of Beaufort force 3, featuring a gentle breeze and large wavelets with glassy crests. LNG temperature adopted in the simulation was −163 [°C]. LNG volume was chosen at 40 [m
3]. The calculations were conducted for situations in which vessel hulls sustain damage at water surface level and at a height of 1 [m], 2 [m] and 5 [m] above sea level (ASL). The diameter of a damaged hull in the examined scenarios is equal to 1000 [mm]. The adopted surface roughness coefficient is 3.33 [mm], which corresponds to sea state 1. The simulations were carried out for concentrations corresponding to the upper and lower explosive limits as well as for the concentration corresponding to half of the lower explosive limit (
Table 2). The values of UFL concentrations were determined with DNV-Phast software—obtaining the values complying with the data found in the data sheets.
The transport of hazardous substances in the atmosphere depends both on the source as well as on the physical and chemical properties of the released substance and on atmospheric conditions. The parameter that determines the method in which such a substance travels in the air is the mixed convection parameter. Substances with a density smaller than air have a positive mixed convection parameter, substances with a density equal to air density are assigned with a neutral mixed convection parameter, while the substances featuring greater density than air have a negative mixed convection parameter. At low temperatures, evaporating liquefied gases with a molecular mass lower than the average molecular mass of air behave like gases with a negative mixed convection parameter. It creates a problem when estimating danger zones emerging as a result of thermal substance decompression, in which a substance transforms from liquid to gas as a result of heating. Depressurization of LNG stored at low temperatures is an example of such a phenomenon. This paper presents simulations of resultant danger zones on the basis of a UDM (Unified Dispersion Model) implemented into PHAST software. The model assumes dispersion comprised of three phases: jet substance release, heavy gas phase and then passive transport. The model takes into account a two-phase release, in which drop falling, creation of a spill on land and re-evaporation were taken into consideration. The model provides a choice of a spill type—the simulation allows us to choose between continuous and instantaneous release. The concentration c is given by a similarity profile:
where:
—centre-line concentration, kg of component/m
3;
—vertical distribution function for concentration (-);
—horizontal distribution function for concentration (-);
—distance perpendicular to plume centre-line, m;
—term in vertical concentration profile, m [
];
—term in cross-wind concentration profile, m
;
m—exponent of horizontal distribution function for concentration (-);
n—exponent of vertical distribution function for concentration (-);
x,
y,
z—Cartesian co-ordinates correspond to the downwind, cross-wind and vertical directions, respectively;
—standard empirical correlation for passive crosswind dispersion coefficient, m;
—standard empirical correlation for vertical crosswind dispersion coefficient, m.
In case of an instantaneous release, density distribution can be represented with the following Equation (2):
where:
—centre-line concentration, kg of component/m
3;
—vertical distribution function for concentration (-);
—horizontal distribution function for concentration (-);
—distance perpendicular to plume centre-line, m;
—horizontal downwind distance, m;
—horizontal downwind position of cloud, m;
—crosswind distance, m. Equation (1), dedicated to the dispersion arising as a result of a substance release into the atmosphere, describes an exponential concentration disappearance in
and
variables through a horizontal and vertical dispersion coefficient
,
. In such a case, experimental correlations are assumed for determining m, n exponents. The values of those coefficients are selected in such a way so that the plume profile of sharp edges assumes the shape of Gauss distribution for large distances from the source, where passive transport principles apply (m = 2).
When discussing the equations describing dispersion, mass conservation Equations (3) and (4) need to be considered:
The above equations express the change in cloud mass as a result of entrainment of air into the cloud and water-vapour transfer substance. —the total air entrainment, kg/m/s for continuous dispersion, and kg/s for instantaneous dispersion; —mass in plume (instantaneous release, kg) or mass rate in plume (continuous release, kg/s); —water vapour added from the substrate, kg or kg/s; —arclength along the centre-line of the plume, m.
The process of modelling a propagating gas plume satisfies the principles of horizontal and vertical momentum conservations. The adopted momentum equations are as follows for continuous dispersion (5):
and for instantaneous dispersion (6):
where:
—ground impact force, N/m or N, resulting from plume collision with the ground;
—ground drag force, N/m or N;
—cross sectional area of continuous cloud, m
2;
—cloud density, kg/m
3;
—density of ambient air, kg/m
3;
—gravitational acceleration 9.81 m/s
2;
—volume of cloud, m
3;
—angle to horizontal of plume, rad;
—arclength along centre-line of the plume, m.
Plume trajectory is determined on the basis of a system of equations:
Equations dedicated to continuous release (7), (8):
Equations dedicated to instantaneous release (9), (10):
where:
—horizontal downwind position of cloud, m;
—cloud centre-line height above ground, m;
—arclength along centre-line of the plume, m
2;
—angle to horizontal of plume, rad;
,
—horizontal and vertical components of cloud speed
, m/s.
Thermal conductivity coming from the substrate is described by the following differential Equations (11) and (12) for continuous release:
where:
—heat transfer rate from ground to cloud, J or J/s;
—arclength along centre-line of the plume, m;
—footprint half-width for continuous plume, m;
—footprint area for instantaneous plume, m
2;
—heat conduction flux, W/m
2.
The heat conduction flux
transferred from the substrate to the cloud is given by Equations (13) and (14):
where:
—natural convection flux from the substrate to the vapour cloud (Mc Adams), W/m
2;
—forced convection flux from the substrate to the vapour cloud (Holman), W/m
2.
Water vapour transfer from the substrate also constitutes an important issue. According to the first law of thermodynamics, water vapour may be transferred from water surface to a cloud when cloud temperature is lower than water surface temperature. An equation linking the speed of water vapour absorption with thermal convection from water surface assumes the form of Equations (15) and (16):
For instantaneous release:
where:
—saturated vapour pressure as a function of temperature (K) for water, Pa;
—substrate temperature, K;
—atmospheric pressure, Pa;
—vapour heat capacity of cloud mixture, J/(kgK).
The last element that ought to be taken into account involves substance vertical spreading in relation to wind direction. Three subsequent stages can be differentiated in that regard:
- -
substance spreading in a jet release phase;
- -
substance spreading in a heavy gas phase;
- -
substance spreading in a passive phase.
The first phase of near-field spreading is based on an assumption that a cloud cross-section is circular in shape until it turns into a passive phase or until wave propagation speed does not decrease to the speed corresponding to heavy gases, which comes down to the following equation:
where:
—term in cross-wind concentration profile, m;
—term in vertical concentration profile, m.
The second stage, described as heavy gas spreading, assumes that the speed of heavy gas spreading applies to the time of transfer into a passive phase. A continuous dispersion can be described with Equation (18), while instantaneous dispersion can described with Equation (19):
where:
—Van Ulden cross-wind spreading parameter, 1.15 (-);
—conversion factor between cloud half-widths,
,
—effective half width of plume, m;
—horizontal component of cloud speed,
;
—vertical height above ground, m;
—height above ground of cloud centroid, m;
—fraction of bottom half of cloud which is above ground, (-);
—density of plume, kg/m
3;
—density of ambient air, kg/m
3;
-Gamma function, (-);
—horizontal downwind distance, m.
3. Results
Two basic scenarios of substance releases are presented in this paper, i.e., catastrophic rupture and leak. For a scenario related to catastrophic rupture the processes of dispersion and of flash fire were analysed. In the leak scenario the phenomenon of creating pool vaporisation, dispersion, jet fire and early pool fire were considered.
For the “catastrophic rupture” scenario, dispersion calculations were carried out for winter and summer conditions—the data are presented in
Table 3 and
Table 4, respectively. The relation of the concentration vs. time of the dispersion for the “catastrophic rupture” scenario is presented in
Figure 1a–p. The concentration of hazardous substance as a function of distance is presented in
Figure 2a–p. For the situation related to the “catastrophic rupture” scenario the “flash fire” phenomenon was also taken into account, which is illustrated in
Figure 3a–j, and the calculated data on the extent of hazardous zones are presented in
Table 5.
For the “leak” type scenario, a variant related to the formation of a spill field was considered. This relationship is shown in
Figure 4a,b (pool radius vs. time) and also
Figure 4c,d. Dispersion data for the ‘leak’ scenario are summarized in
Table 6 (for winter conditions) and
Table 7 (for summer conditions). For the ‘leak’ scenario, the “jet fire” phenomenon is also introduced:
Table 8 (winter) and
Table 9 (summer). Graphical representations of the radiation level vs. distance for LNG-Heavy and LNG-Light are presented in
Figure 5a,b. Additionally, “early pool fire” situations were also considered. Data obtained for the above simulation are presented in
Table 10 (winter conditions) and
Table 11 (summer conditions). An example of the radiation level vs. distance dependence is shown in
Figure 6.
3.1. Catastrophic Rupture
Simulations were conducted for the lowest ambient air temperature in February for a given area 1.4 [°C]. At the same time water temperature was equal to 2.0 [°C]. Relative air humidity was 82 [%] (pl.climate-data.org, accessed on 1 February 2022). Analogous calculations were carried out for the warmest month in the analysed area—the adopted ambient air temperature in August was 21.4 [°C], water temperature 19 [°C], the adopted relative humidity was equal to 73 [%]. Surface roughness length was 3.33 [mm]. Atmospheric pressure was 101,325 [Pa]. Dispersion data calculated for light and heavy LNG are shown in the
Table 3 and
Table 4.
H represents the height expressed in [m] at which depressurization occurs.
Table 3.
Dispersion, catastrophic rupture, winter.
Table 3.
Dispersion, catastrophic rupture, winter.
LNG
Type | H
[m] | Range for UFL [m] | Range for LFL [m] | Range for LFL-Frac [m] |
|---|
| 1.5/F | 1.5/D | 5/D | 1.5/F | 1.5/D | 5/D | 1.5/F | 1.5/D | 5/D |
|---|
LNG
Light | 0 | 122 | 153 | 173 | 650 | 208 | 426 | 1445 | 437 | 695 |
| 1 | 88 | 103 | 184 | 268 | 301 | 437 | 625 | 409 | 671 |
| 2 | 87 | 104 | 182 | 271 | 304 | 436 | 628 | 415 | 670 |
| 5 | 93 | 112 | 181 | 291 | 327 | 442 | 638 | 443 | 675 |
LNG
Heavy | 0 | 148 | 185 | 202 | 481 | 262 | 418 | 1166 | 395 | 677 |
| 1 | 148 | 206 | 218 | 548 | 283 | 437 | 1272 | 414 | 714 |
| 2 | 152 | 210 | 216 | 545 | 287 | 438 | 1273 | 421 | 715 |
| 5 | 169 | 206 | 192 | 420 | 277 | 414 | 1120 | 418 | 671 |
Table 4.
Dispersion, catastrophic rupture, summer.
Table 4.
Dispersion, catastrophic rupture, summer.
LNG
Type | H
[m] | Range for UFL [m] | Range for LFL [m] | Range for LFL-Frac [m] |
|---|
| 1.5/F | 1.5/D | 5/D | 1.5/F | 1.5/D | 5/D | 1.5/F | 1.5/D | 5/D |
|---|
LNG
Light | 0 | 110 | 126 | 153 | 587 | 233 | 460 | 1449 | 513 | 761 |
| 1 | 116 | 130 | 152 | 549 | 234 | 457 | 1409 | 514 | 755 |
| 2 | 122 | 136 | 151 | 526 | 236 | 455 | 1384 | 518 | 753 |
| 5 | 135 | 151 | 150 | 475 | 241 | 452 | 1328 | 527 | 747 |
LNG
Heavy | 0 | 133 | 159 | 175 | 632 | 267 | 450 | 1433 | 501 | 740 |
| 1 | 140 | 162 | 176 | 616 | 272 | 447 | 1416 | 507 | 734 |
| 2 | 144 | 165 | 175 | 600 | 276 | 448 | 1402 | 512 | 735 |
| 5 | 155 | 172 | 172 | 574 | 289 | 445 | 1381 | 530 | 731 |
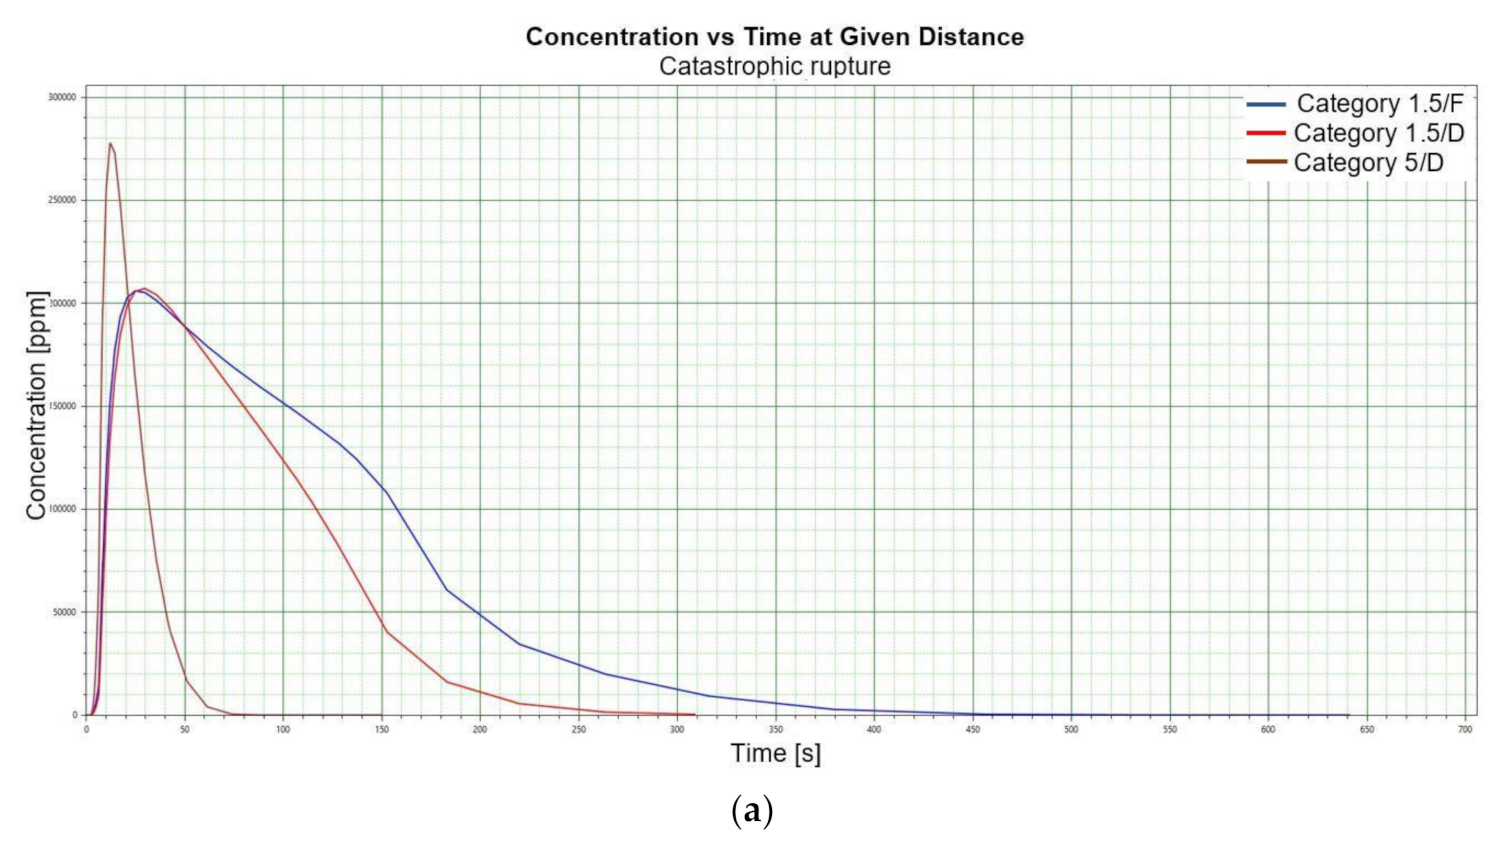
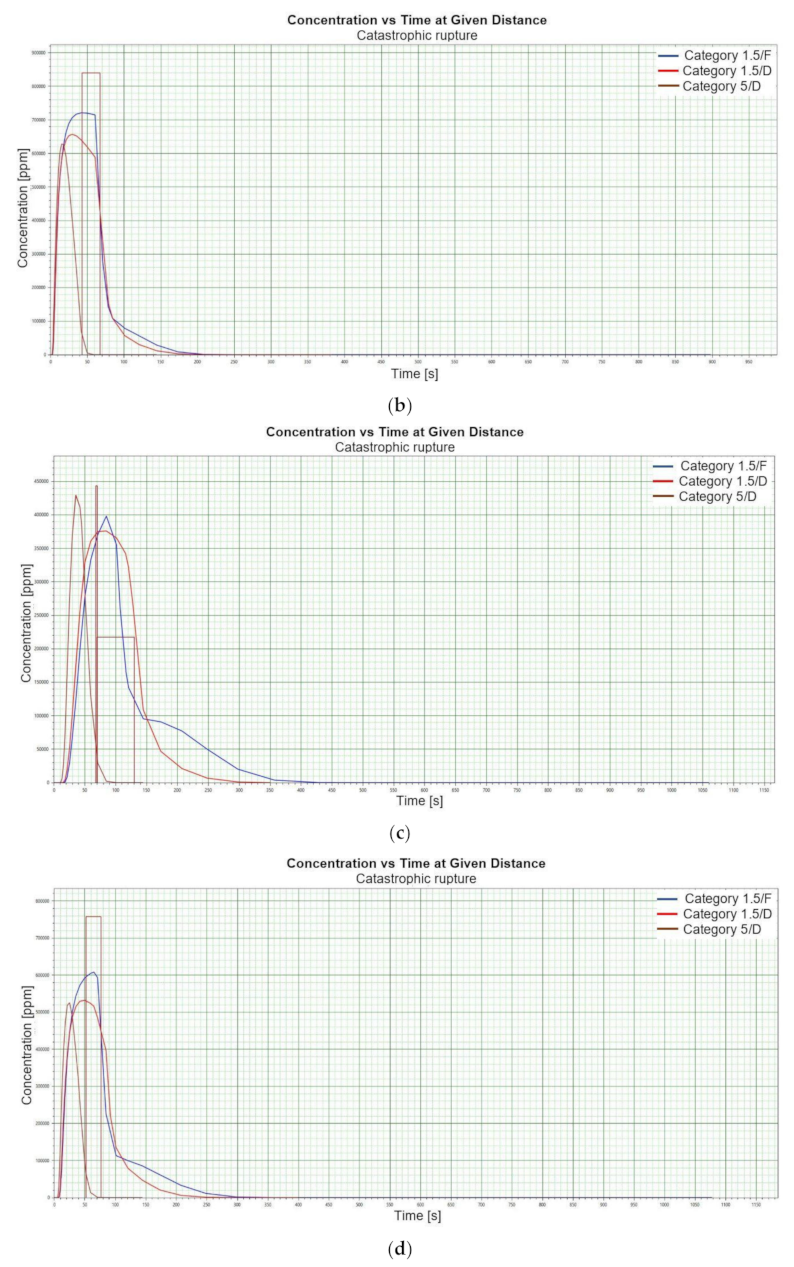
Figure 1.
(a). Concentration vs. time for catastrophic rupture–height 1 [m] ASL LNG Light, winter. (b). Concentration vs. time for catastrophic rupture–height 1 m ASL LNG Light, summer. (c). Concentration vs. time for catastrophic rupture–height 1 m ASL LNG Heavy, winter. (d). Concentration vs. time for catastrophic rupture–height 1 m ASL LNG Heavy, summer. (e). Concentration vs. time for catastrophic rupture–height 2 m ASL LNG Light, winter. (f). Concentration vs. time for catastrophic rupture–height 2 m ASL LNG Light, summer. (g). Concentration vs. time for catastrophic rupture–height 2 m ASL LNG Heavy, winter. (h). Concentration vs. time for catastrophic rupture–height 2 m ASL LNG Heavy, summer. (i). Concentration vs. time for catastrophic rupture–height 5 m ASL LNG Light, winter. (j). Concentration vs. time for catastrophic rupture–height 5 m ASL LNG Light, summer. (k). Concentration vs. time for catastrophic rupture–height 5 m ASL LNG heavy, winter. (l). Concentration vs. time for catastrophic rupture–height 5 m ASL LNG heavy, summer. (m). Concentration vs. time for catastrophic rupture–height 0 m ASL LNG light, winter. (n). Concentration vs. time for catastrophic rupture–height 0 m ASL LNG Light, summer. (o). Concentration vs. time for catastrophic rupture–height 0 m ASL LNG heavy, winter. (p). Concentration vs. time for catastrophic rupture–height 0 m ASL LNG heavy, summer.
When analysing the charts for a catastrophic rupture scenario, in which practically the entire contents of a tank is instantaneously released, it can be observed that the greatest LNG concentration (277,964 [ppm]) can be noted for the greatest wind speed analysed (5 [m/s]) after the passage of 12 [s] and for stability class D. The turbulences accompanying stability class D will result in the creation of a gas cloud which reaches its maximum density in a relatively short time, which causes maximum densities to appear more quickly for small stability classes, i.e., prior to the washout of a propagating wave, which results in reduced time of wave propagation with a simultaneous coalescence of maximum concentration. The characteristic look for the light variation of LNG (winter) similar for the following heights: 1, 2, 5 [m] (
Figure 1a,e,i) but they are different when the height of zero [m] is taken into account (
Figure 1m).
Figure 1b,j show the similarity in the characteristic for the LNG-Light (summer). The greater the height for the LNG-Light (summer) (in relation to the water surface) at which the leakage occurs the more the curve image differs from the curve obtained at surface water level (zero [m])—
Figure 1b,f,j,n. In contrast for LNG-Heavy (winter) obtained curves for the heights of 1 and 2 [m] are of similar shape, but they differ from curves obtained for the heights of 5 and 0 [m] (curves for 0 and 5 [m] are of similar shapes)—
Figure 1c,g,k,o. For LNG heavy summer obtained curves concentration vs. time look similar but maximum concentration vs. time occurs for the height of 5 [m]. For the height of 0 [m] concentration differs significantly (
Figure 1d,h,l,p). An analysis of curves from
Figure 1a leads to a conclusion that for the light LNG variety in the case of small speeds (1.5 [m/s]) the parameter influencing the range is Pasquill stability—the relationship is evident: the higher the stability, the longer the wave propagation time is. The time during which dispersion occurs is not consistent with the dimensions of wave propagation dimensions. The radius of a danger zone decreases along with an increase in stability, and it increases in a function of a growing wind speed for large concentrations. However, in the event of small concentrations of LFL-fraction range, deviations from the above relationship occur—when Pasquill stability rises, so do the dimensions of a danger zone (
Table 1). Yet, for a Pasquill stability category determined at an average level (D), an increase in wind speed enables a range increase by over 50 [%]. The cause of the changes observed for lower concentrations is the shape of the wave, which for low stability classes and low speeds creates a wave shape for which a cross-wind radius increases (
Figure 1b—brown curve). It is only a wind speed increase that generates wave shape lengthening in the direction of wind propagation.
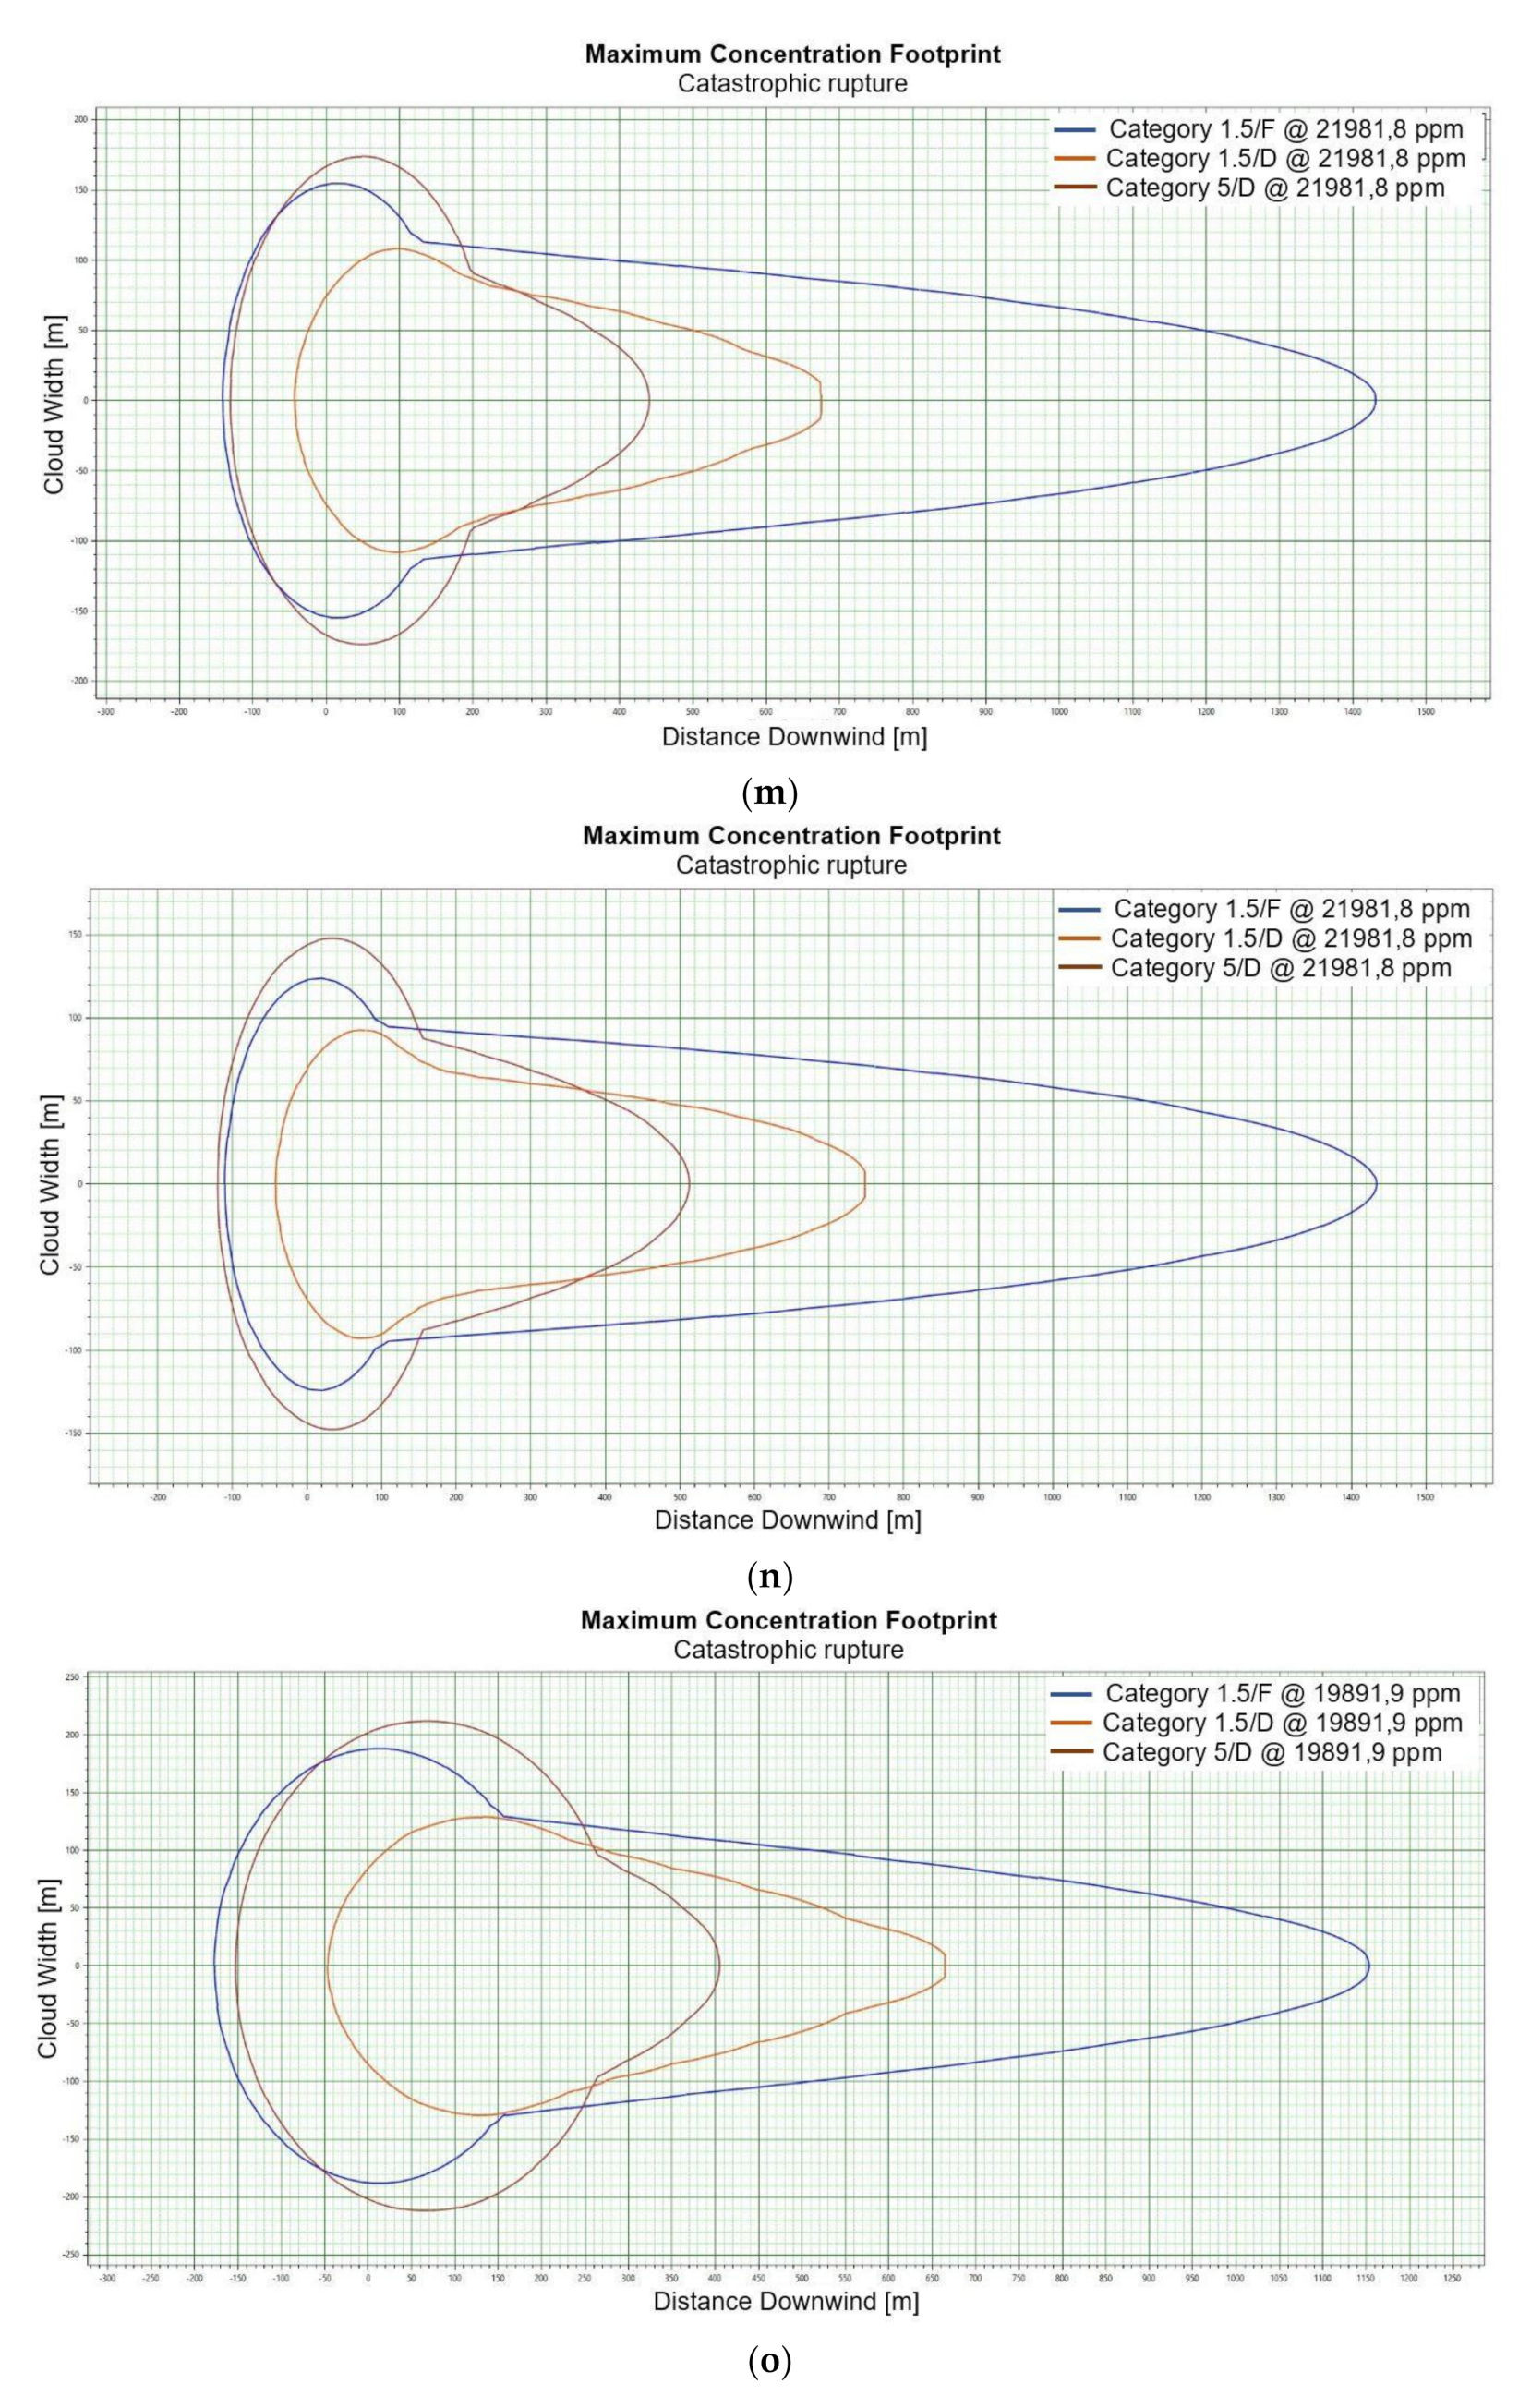
Although a heavy LNG variation for large fractions (UFL) shows an analogous pattern to the light LNG variation, it is less evident. For LFL level and LFL-fraction, a danger zone range increases along with the increase of stability. The zone grows along with the increase of wind speed. For small stability classes in the case of a heavy LNG variety, a phenomenon of wave expansion parallel to wind direction can be observed (
Figure 2a–p).
Figure 2.
(a). Concentration for catastrophic rupture for LFL-fraction 1 m ASL LNG light, winter. (b). Concentration for catastrophic rupture for LFL-fraction 1 m ASL LNG light, summer. (c). Concentration for catastrophic rupture for LFL-fraction 1 m ASL LNG heavy, winter. (d). Concentration for catastrophic rupture for LFL-fraction 1 m ASL LNG heavy, summer. (e). Concentration for catastrophic rupture for LFL-fraction 2 m ASL, LNG light, winter. (f). Concentration for catastrophic rupture for LFL-fraction 2 m ASL, LNG light, summer. (g). Concentration for catastrophic rupture for LFL-fraction 2 m ASL, LNG Heavy, winter. (h). Concentration for catastrophic rupture for LFL-fraction 2 m ASL, LNG Heavy, summer. (i). Concentration for catastrophic rupture for LFL-fraction 5 m ASL, LNG Light, winter. (j). Concentration for catastrophic rupture for LFL-fraction 5 m ASL, LNG Light, summer. (k). Concentration for catastrophic rupture for LFL-fraction 5 m ASL, LNG heavy, winter. (l). Concentration for catastrophic rupture for LFL-fraction 5 m ASL, LNG heavy, summer. (m). Concentration for catastrophic rupture for LFL-fraction 0 m ASL, LNG light, winter. (n). Concentration for catastrophic rupture for LFL-fraction 0 m ASL LNG, light, summer. (o). Concentration for catastrophic rupture for LFL-fraction 0 m ASL LNG heavy, winter. (p). Concentration for catastrophic rupture for LFL-fraction 0 m ASL, LNG heavy, summer.
For LNG light winter and LNG light summer (1 m; 2 m; 5 m), a fundamental difference can be observed in the shapes of the curves representing the ranges of dangerous zones, which suggests that for this fraction, at a certain height at which unsealing occurs, the weather conditions are crucial for the mentioned ranges (
Figure 2e,f). We do not observe such a relationship for the fractions of LNG heavy winter and LNG heavy summer (
Figure 2g,h).
The change in height for 1, 2 and 5 m for LNG-Light in the summer and winter seasons does not significantly affect the shape of the curves describing the ranges of hazardous zones [
Figure 2i–l].
For LNG light winter and LNG light summer (0 m), we observe a similar shape of the range curves of the hazardous zones (
Figure 2m,n). The situation is similar in the case of LNG heavy winter and LNG heavy summer, which proves that the main factor influencing the shape of the range curves is the zero meter height at which unsealing occurs (
Figure 2o,p). This is due to the fact that LNG molecules obtain energy from higher temperature water molecules. It looks like in this particular case, the environmental parameters do not affect the range.
3.2. Flash Fire
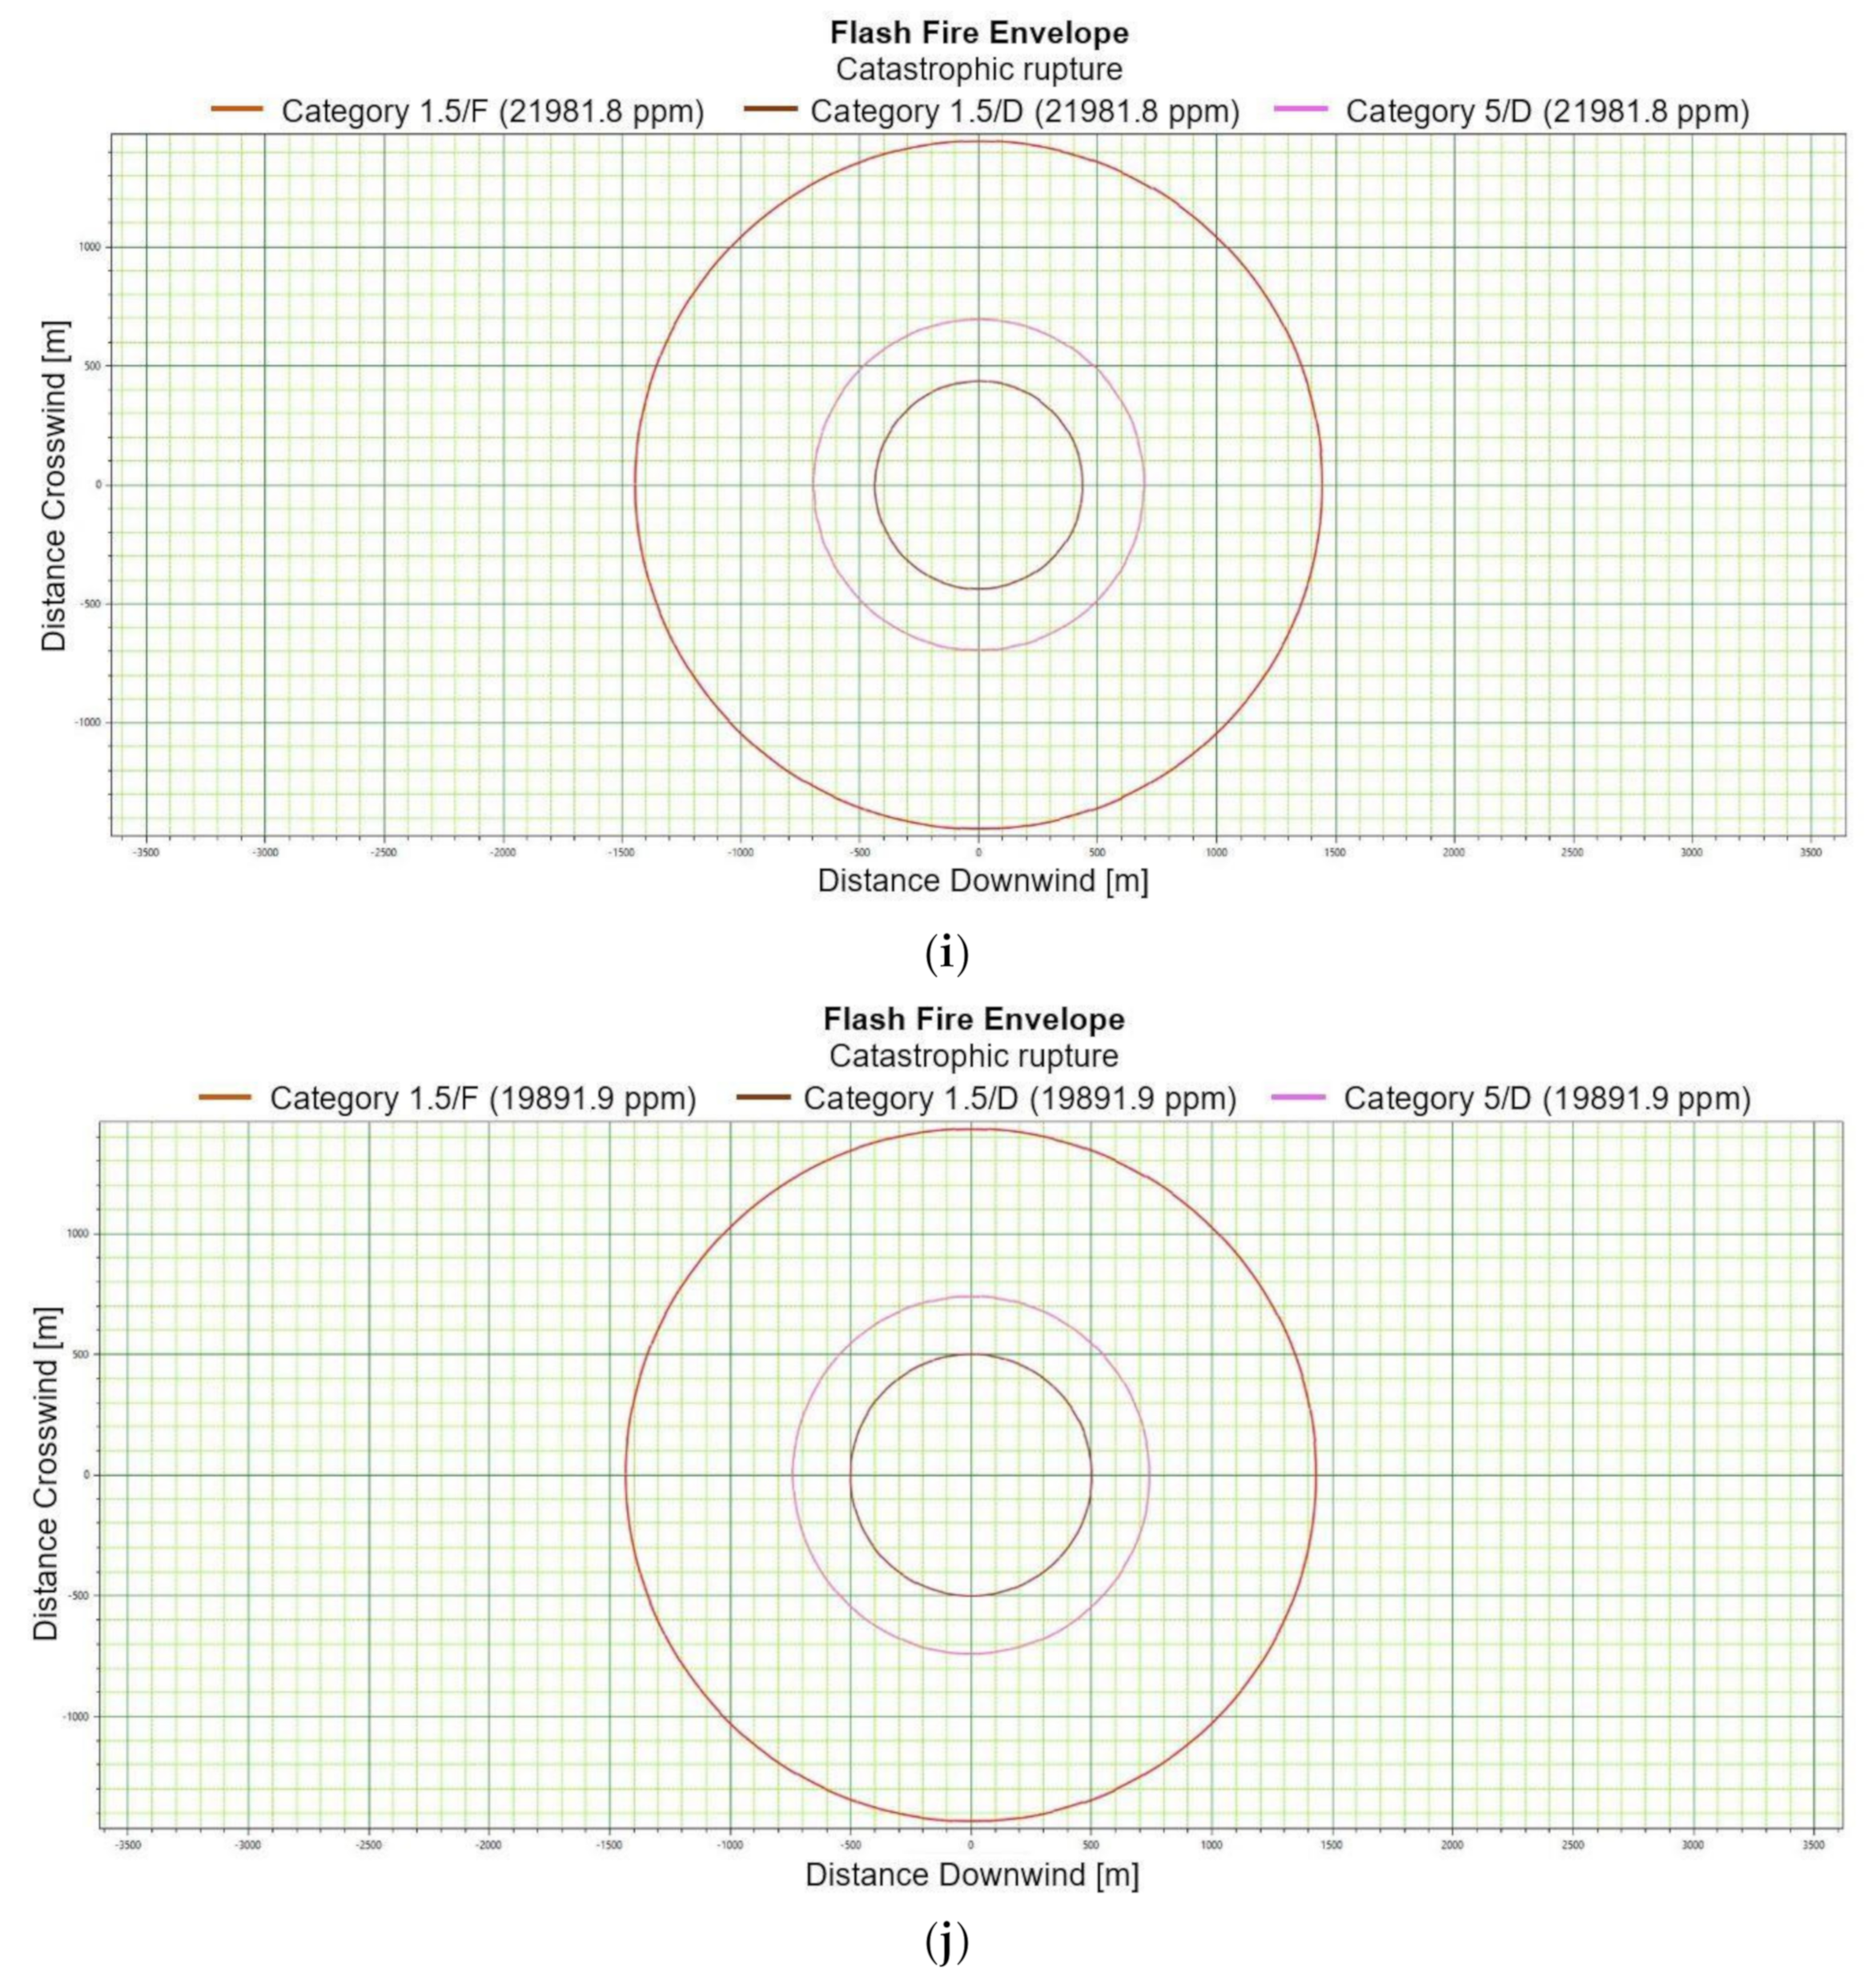
In the event when flash fire occurs as a result of an ignition of a mixture of air and dispersed flammable substance, i.e., depressurized LNG, a rapidly spreading fire occurs without creating harmful pressure. A flash fire is a type of fire in which flames spread with supersonic speed, hence most damage is caused by thermal radiation that may result in pulmonary tissue damage. For the light LNG variety, at the height of 1 [m], the danger zone ranges grow along with increasing speed and decreasing stability (
Table 5). For concentrations corresponding to LFL-fraction level, the range radius shrinks along with reduced stability—it is a situation complying with dispersion (
Figure 3a–j).
Table 5.
Flash fire envelope, range for LFL and LFL-Fraction.
Table 5.
Flash fire envelope, range for LFL and LFL-Fraction.
| LNG Type | H
[m] | Range for UFL
[m] | Range for LFL
[m] | Range for LFL-Frac [m] |
|---|
| 1.5/F | 1.5/D | 5/D | 1.5/F | 1.5/D | 5/D | 1.5/F | 1.5/D | 5/D |
|---|
LNG
Light | 0 | - | - | - | 651 | 208 | 426 | 1447 | 437 | 695 |
| 1 | - | - | - | 268 | 301 | 437 | 625 | 409 | 671 |
| 2 | - | - | - | 271 | 305 | 436 | 628 | 415 | 670 |
| 5 | - | - | - | 291 | 327 | 442 | 638 | 443 | 675 |
LNG
Heavy | 0 | - | - | - | 481 | 262 | 418 | 1166 | 395 | 677 |
| 1 | - | - | - | 548 | 284 | 437 | 1272 | 414 | 714 |
| 2 | - | - | - | 547 | 287 | 438 | 1273 | 421 | 715 |
| 5 | - | - | - | 420 | 277 | 413 | 1120 | 418 | 671 |
Figure 3.
(a). Flash fire envelope—catastrophic rupture 1 m ASL, LNG-Light, winter. (b). Flash fire envelope—catastrophic rupture 1 m ASL, LNG-Light, summer. (c). Flash fire envelope—catastrophic rupture 1 m ASL, LNG-Heavy, winter. (d). Flash fire envelope—catastrophic rupture 1 m ASL, LNG-Heavy, summer. (e). Flash fire envelope—catastrophic rupture 2 m ASL, LNG-Light, winter. (f). Flash fire envelope—catastrophic rupture 2 m ASL, LNG-Light, summer. (g). Flash fire envelope—catastrophic rupture 5 m ASL, LNG-Light, winter. (h). Flash fire envelope—catastrophic rupture 5 m ASL, LNG-Light, summer. (i). Flash fire envelope—catastrophic rupture 0 m ASL, LNG-Light, winter. (j). Flash fire envelope—catastrophic rupture 0 m ASL, LNG-Heavy, summer.
For LNG light winter and LNG light summer (1 m; 2 m; 5 m), the season of the year differentiates the shapes of the range curves, intensely influencing the ranges of the danger zones (
Figure 3e–h). By contrast, for LNG-Heavy, neither the season nor the altitude have a significant impact on the range curves. The examples of the range curves for the LNG heavy winter (1 m) and LNG light summer (1 m) are presented in
Figure 3c,d. For a height of zero meter, the fractional composition and the season of the year do not affect the range curves, in this case the main role is again played by energy exchange between LNG particles and water particles. Once again, it can be stated that the environmental parameters do not significantly affect the nature of the range curves for a height of zero meters above the water surface (
Figure 3i,j).
3.3. Leak
In the event of a leak, a larger number of scenarios need to be taken into account. Even though the situation analysed is limited to an LNG leak above water surface, a pool vaporisation scenario can be considered. The dimensions of pool vaporisation from LNG decompression will not be substantial on account of the physical and chemical properties of decompressed LNG. Pool vaporisation radius for winter conditions is 34 [m] for Light LNG and 35 [m] for Heavy LNG, while for summer conditions the radius for the Light and Heavy variety is 33 [m] and 34 [m] respectively. The time during which a maximum spill radius is reached in winter conditions for Light LNG is 51 [s] (
Figure 4a) and it is virtually independent of the height at which depressurization occurs in the analysed height range of 0–5 [m] (
Figure 4a). The situation for summer variation looks similar. In the case of Heavy LNG, the built-up rate is extended by less than 10 per cent, which does not constitute a substantial change. For all the analysed heights at which depressurization can occur the built-up rate oscillates within the range of 50–55 [s] and its shape is not significantly different from the one presented in
Figure 4a,b. Maximum pool vaporization radius for summer conditions is close to the values obtained for the winter season (
Figure 4b).
An example of the pool radius versus time curve is shown in
Figure 4a,b. Similarly, the course of the pool vaporization rate versus time curves is shown in
Figure 4c,d.
Figure 4.
(a). Pool radius vs. time, LNG-Light 1 m, winter. (b). Pool radius vs. time, LNG-Heavy 1 m, summer. (c). Pool vaporisation rate vs. time, LNG-Light 1 m, winter. (d). Pool vaporisation rate vs. time, LNG-Heavy 1 m, summer.
Figure 4.
(a). Pool radius vs. time, LNG-Light 1 m, winter. (b). Pool radius vs. time, LNG-Heavy 1 m, summer. (c). Pool vaporisation rate vs. time, LNG-Light 1 m, winter. (d). Pool vaporisation rate vs. time, LNG-Heavy 1 m, summer.
Pool vaporisation rate for LNG-Heavy in summer conditions is slightly greater than for the heavy variety (
Figure 4c,d). Those rates are 680 [kg/s] for Heavy-LNG and 620 [kg/s] for Light-LNG. For the remaining heights pool vaporisation rate curves are of similar shape and numerical value to the one presented. In the case of summer conditions pool vaporization rate assumes the value of 660 [kg/s] for Heavy-LNG and 640 for Light-LNG.
In the event of a dispersion scenario caused by a leak, the data obtained are consistent with the ones presented in
Table 6 and
Table 7. It can easily be noticed that for the determined rate and stability, the danger zone ranges decrease along with increasing concentration. For LFL and LFL-fraction concentrations the greatest danger zones occurred at wind speed of 1.5 [m/s] and stability class F. At the wind speed determined for LFL and LFL-fraction concentrations, a decreased Pasquill stability causes the danger zone to shrink. In the zone of higher concentrations, the opposite phenomenon can be observed. An increased height does not provide unequivocal certainty as to the direction in which a danger zone radius changes.
Table 6.
Dispersion, leak, winter.
Table 6.
Dispersion, leak, winter.
| LNG Type | H
[m] | Range for UFL
[m] | Range for LFL
[m] | Range for LFL-Frac [m] |
|---|
| 1.5/F | 1.5/D | 5/D | 1.5/F | 1.5/D | 5/D | 1.5/F | 1.5/D | 5/D |
|---|
LNG
Light | 0 | 67 | 106 | 148 | 1138 | 497 | 398 | 2493 | 935 | 649 |
| 1 | 91 | 107 | 149 | 1083 | 491 | 398 | 2422 | 927 | 647 |
| 2 | 109 | 127 | 156 | 1071 | 488 | 412 | 2402 | 923 | 670 |
| 5 | 168 | 213 | 193 | 1046 | 493 | 462 | 2392 | 937 | 743 |
LNG
Heavy | 0 | 76 | 121 | 159 | 977 | 459 | 393 | 2204 | 861 | 630 |
| 1 | 82 | 121 | 160 | 944 | 453 | 392 | 2152 | 851 | 628 |
| 2 | 104 | 124 | 161 | 935 | 451 | 392 | 2139 | 849 | 628 |
| 5 | 178 | 233 | 191 | 910 | 447 | 435 | 2105 | 842 | 693 |
Table 7.
Dispersion, leak, summer.
Table 7.
Dispersion, leak, summer.
| LNG Type | H
[m] | Range for UFL
[m] | Range for LFL
[m] | Range for LFL-Frac [m] |
|---|
| 1.5/F | 1.5/D | 5/D | 1.5/F | 1.5/D | 5/D | 1.5/F | 1.5/D | 5/D |
|---|
LNG
Light | 0 | 51 | 79 | 148 | 1076 | 492 | 443 | 2574 | 991 | 727 |
| 1 | 67 | 81 | 150 | 1025 | 484 | 444 | 2503 | 977 | 729 |
| 2 | 80 | 91 | 149 | 1006 | 481 | 443 | 2478 | 974 | 726 |
| 5 | 115 | 139 | 168 | 967 | 475 | 482 | 2423 | 973 | 795 |
LNG
Heavy | 0 | 60 | 96 | 146 | 1012 | 475 | 417 | 2404 | 939 | 687 |
| 1 | 62 | 97 | 153 | 982 | 471 | 436 | 2359 | 932 | 713 |
| 2 | 78 | 98 | 154 | 945 | 471 | 438 | 2349 | 931 | 716 |
| 5 | 129 | 160 | 166 | 1104 | 523 | 450 | 2573 | 975 | 737 |
For a leak scenario in the process of LNG dispersion, the range of danger zones grows in summer conditions along with an increase in stability for the highest concentrations (UFL). An identical property is observed for winter conditions. Lower concentrations, corresponding to LFL and LFL-fraction level, are accompanied by an opposite relation, i.e., stability growth causes the danger zone to shrink. A rise in wind speed within the examined range (0–5 m/s) generates an increase in the danger zone size for concentrations at UFL level, while for lower LFL or LFL-fraction concentrations the situation is reversed. Thus, the nature of the changes is chiefly determined by wind speed and Pasquill stability value within the analysed temperature range.
A leak scenario designed to a flash fire phenomenon is the same as for dispersion.
A jet fire phenomenon also ought to be considered for a leak scenario. Such a type of a diffusion flame is a result of burning fuel released at a certain speed in a specific direction. A jet fire phenomenon constitutes a significant risk factor related to serious breakdowns, both at off-shore installations and as a result of a mechanical damage to a ship’s hull. A jet fire can damage a tank or another construction element, causing breakdown escalation. The figures calculated for selected values of jet density of thermal radiation are presented in
Table 8 and
Table 9. The selected thermal radiation values were 4 [kW/m
2], 12.5 [kW/m
2] and 37.5 [kW/m
2]. These are the jet densities of thermal radiation which are assigned to zero fatality rate—4 [kW/m
2] as well as a high probability of bodily harm and 1 [%] fatality rate following an exposure of the body for 60 [s]—12.5 [kW/m
2]. The value of 37.5 [kW/m
2] involves damage to technical equipment and 1 [%] fatality rate within a 10-s exposure. The dimensions of maximum of thermal radiation can be referenced from
Figure 5a,b. The values of the jet density of thermal radiation in a function of distance from an emission source are important from the standpoint of planning rescue operations. They enable planning the forces and resources to be used in extinguishing a fire. They enable selecting a suitable class of equipment adapted to thermal radiation. Comparing the Light and Heavy LNG varieties, it can be noted that for the composition corresponding to the heavy variety, maximum jet densities of thermal radiation are higher than for the light variety; however, they have a shorter range.
Table 8.
Jet fire, winter.
Table 8.
Jet fire, winter.
Typ
LNG | H
[m] | Range
for 4 [kW/m2] | Range
for 12.5 [kW/m2] | Range
for 37.5 [kW/m2] |
|---|
| 1.5/F | 1.5/D | 5/D | 1.5/F | 1.5/D | 5/D | 1.5/F | 1.5/D | 5/D |
|---|
LNG
Light | 0 | 155 | 153 | 144 | 125 | 124 | 114 | 102 | 101 | 96 |
| 1 | 239 | 243 | 219 | 193 | 196 | 172 | 159 | 161 | 144 |
| 2 | 263 | 273 | 265 | 212 | 220 | 208 | 175 | 181 | 173 |
| 5 | 329 | 345 | 361 | 264 | 277 | 282 | 219 | 229 | 234 |
LNG
Heavy | 0 | 105 | 104 | 155 | 85 | 84 | 121 | 69 | 68 | 102 |
| 1 | 169 | 174 | 167 | 136 | 140 | 131 | 112 | 116 | 109 |
| 2 | 197 | 206 | 212 | 158 | 166 | 166 | 131 | 137 | 138 |
| 5 | 264 | 280 | 312 | 212 | 224 | 243 | 175 | 186 | 201 |
Table 9.
Jet fire, summer.
Table 9.
Jet fire, summer.
Typ
LNG | H
[m] | Range
for 4 [kW/m2] | Range
for 12.5 [kW/m2] | Range
for 37.5 [kW/m2] |
|---|
| 1.5/F | 1.5/D | 5/D | 1.5/F | 1.5/D | 5/D | 1.5/F | 1.5/D | 5/D |
|---|
LNG
Light | 0 | 152 | 151 | 153 | 124 | 123 | 122 | 101 | 100 | 103 |
| 1 | 229 | 234 | 211 | 186 | 189 | 167 | 153 | 156 | 141 |
| 2 | 254 | 263 | 255 | 205 | 213 | 202 | 170 | 176 | 169 |
| 5 | 319 | 335 | 354 | 258 | 271 | 279 | 214 | 225 | 233 |
LNG
Heavy | 0 | 108 | 107 | 175 | 88 | 87 | 139 | 72 | 70 | 116 |
| 1 | 162 | 166 | 159 | 131 | 135 | 125 | 107 | 111 | 106 |
| 2 | 190 | 197 | 203 | 153 | 159 | 160 | 127 | 132 | 134 |
| 5 | 255 | 269 | 304 | 206 | 217 | 239 | 171 | 180 | 199 |
In a leak scenario, a jet fire generates greater danger zones in case of greater heights from which the substance is released. Such a trend is maintained for both seasons. The heavy variety causes smaller danger zones than the light variety does, irrespectively of the season. An increase in stability does not significantly affect the change the radius of danger zones. Greater stability does not generate any serious change in the radius size of danger zones. Maximum concentration jet and radiation is observed for both light and heavy LNG variety at wind speed of 1.5 [m/s] and for stability class D. The situation is similar in summer conditions.
Examples of graphs showing the level of radiation as a function of distance are shown in
Figure 5a,b.
Figure 5.
(a). Radiation vs. distance, jet fire, LNG-Light 1 m, winter. (b). Radiation vs. distance, jet fire, LNG-Heavy 1 m, summer.
Figure 5.
(a). Radiation vs. distance, jet fire, LNG-Light 1 m, winter. (b). Radiation vs. distance, jet fire, LNG-Heavy 1 m, summer.
For a leak scenario, the phenomenon of early pool fire can also be considered, in which a layer of liquid fuel evaporates and burns. Fires of that type are important from the standpoint of liquid fuel storage and transport by different industries. The most important parameter in describing an early pool fire is a heat release rate, which enables defining a safe distance for avoiding thermal burns. Therefore, danger zones were set for thermal radiation presented in
Table 10 and
Table 11. H represents the height expressed in [m] at which depressurization occurs. The thermal radiation in a function of distance is presented in figures
Figure 6.
Table 10.
Early pool fire, winter.
Table 10.
Early pool fire, winter.
| LNG Type | H
[m] | Range
for 4 [W/m2] | Range
for 12.5 [W/m2] | Range
for 37.5 [W/m2] |
|---|
| 1.5/F | 1.5/D | 5/D | 1.5/F | 1.5/D | 5/D | 1.5/F | 1.5/D | 5/D |
|---|
LNG
Light | 0 | 400 | 400 | 422 | 228 | 228 | 267 | 108 | 108 | 152 |
| 1 | 402 | 402 | 425 | 231 | 231 | 270 | 111 | 111 | 154 |
| 2 | 402 | 402 | 425 | 231 | 231 | 270 | 111 | 111 | 155 |
| 5 | 403 | 403 | 424 | 233 | 233 | 271 | 113 | 113 | 156 |
LNG
Heavy | 0 | 357 | 357 | 373 | 208 | 209 | 236 | 104 | 104 | 143 |
| 1 | 359 | 359 | 376 | 211 | 211 | 239 | 106 | 106 | 245 |
| 2 | 359 | 360 | 376 | 211 | 211 | 239 | 107 | 107 | 146 |
| 5 | 361 | 362 | 376 | 213 | 213 | 240 | 109 | 109 | 147 |
Table 11.
Early pool fire, summer.
Table 11.
Early pool fire, summer.
| LNG Type | H
[m] | Range
for 4 [W/m2] | Range
for 12.5 [W/m2] | Range
for 37.5 [W/m2] |
|---|
| 1.5/F | 1.5/D | 5/D | 1.5/F | 1.5/D | 5/D | 1.5/F | 1.5/D | 5/D |
|---|
LNG
Light | 0 | 345 | 375 | 402 | 218 | 218 | 256 | 97 | 97 | 135 |
| 1 | 378 | 378 | 403 | 215 | 215 | 260 | 100 | 100 | 138 |
| 2 | 378 | 378 | 403 | 215 | 215 | 258 | 101 | 101 | 138 |
| 5 | 379 | 379 | 403 | 217 | 217 | 259 | 103 | 103 | 139 |
LNG
Heavy | 0 | 336 | 336 | 354 | 195 | 195 | 226 | 94 | 94 | 130 |
| 1 | 339 | 339 | 357 | 198 | 198 | 229 | 97 | 97 | 133 |
| 2 | 340 | 340 | 358 | 198 | 198 | 230 | 98 | 98 | 134 |
| 5 | 341 | 341 | 359 | 200 | 200 | 231 | 100 | 100 | 135 |
A pool fire scenario for a leak demonstrates that the ranges of danger zones do not depend on Pasquill stability. Greater heights at which depressurization occurs do not result in a distinct trend involving an increase of the radius of a danger zone. Those trends are observed both for summer and winter conditions. A rate increase generates areas of greater radius. Light LNG and heavy LNG have a similar heat radiation characteristic. Heavy LNG demonstrates a slightly higher maximum of thermal radiation when compared to Light LNG. An example graph of the radiation vs. distance relationship for LNG-light and winter conditions is shown in
Figure 6.
Figure 6.
Early pool fire, radiation vs. distance, LNG-Light, 2 m, winter.
Figure 6.
Early pool fire, radiation vs. distance, LNG-Light, 2 m, winter.
4. Discussion
Modelling the physical and chemical effects related to uncontrolled hazardous substance releases into the atmosphere and their consequences constitutes a fundamental component of risk analysis [
36]. In the process of modelling the characteristic of a release source must be taken into consideration along with substance dispersion in the atmosphere as well as the zones of physical and chemical effects and their possible consequences [
37,
38]. It is a multi-stage process in which the final results of one stage constitute input data in a subsequent stage. Although it is a complicated process, it is essential at the first stage of risk analysis, which focuses on identifying risks. LNG is a substance whose behaviour is difficult to predict owing to dramatic changes in temperature, which results in a change of density. Vapours from vaporizing liquids and cold gas clouds belong to the so-called dense gases and vapours whose density is much higher than air density. A dense gas cloud drops like a waterfall, often covering large distances before its concentration decreases or turbulences dispersing the cloud occur. Dense gas clouds are affected by the wind, although permanent structures may form cloud propagation direction. At room temperature methane is denser than air—as a consequence, a description of cloud propagation becomes problematic, since when LNG turns from liquid to gas it also changes its characteristics. As the released LNG gets warmer, the characteristics of decompressed gas are transformed from “dense” to “light”, which can be observed during an LNG spill. Initially, a cloud of dense and cold gas causes water vapour condensation from the surrounding atmosphere, the effect of which presents as fog. At a temperature equal to −112 [°C] methane’s density is close to air density, and when it is heated further, methane starts behaving like a light gas. In the first phase of methane dissipation the concentration of the gas cloud diminishes. At the same time gas density starts dropping. Once the density reaches the same value as air density, it becomes neutral in relation to air, which means that the diluted gas is no longer separated from the air.
In the event of dispersion, the relation between an increase of range in a function of fraction composition becomes clearly noticeable—typically in such a case the range zone for LNG-Heavy variety expands. The above relations are not the same when low concentrations of LNG-fraction as well as low water temperatures are taken into account in the situation when LNG is realised at water surface level. With the increase of height above water surface, the danger range zone typically expands as well, however, for the height of substance release equal to zero, a distinct deviation can be observed, especially evident in a simulation with cold water. Low wind speeds and high stability contribute to LNG drawing energy from the water surface and the molecules of propagating gas gaining the energy necessary to overcome surface roughness. The intensity of the process is also affected by fraction composition and ambient temperature. The process of wave propagation and its analysis in terms of the shape suggests a substantial participation of turbulences that will create longitudinal and crosswise propagation radius in relation to wind direction. Turbulences cause the emergence of a maximum density gas cloud in a short time counted from the moment of substance release. At the same time, turbulences cause the emergence of clouds in which a vertical radius is decidedly greater than a horizontal radius. As stability rises, the lack of turbulence is usually the reason for the widening of a horizontal radius of a gas cloud. In the event of a Flash Fire, the ranges of danger zones are consistent with maximum ranges of the zones determined for dispersion. The rate at which a jet fire advances has serious consequences to defining a control strategy and risk assessment. A jet fire poses a thermal risk; thus, it is essential to analyse the jet density of thermal radiation. The significance of the phenomenon is evidenced by reports co-financed by the European Community. Jet fires can be dangerous in contact with water, as in the event of unlimited fires the flame may burn out before fuel supply is cut off, which results in an explosion. The actual heat transfer from fire to ship’s components is not fully defined, which renders the requirements for emergency decompression to be highly uncertain. If depressurization occurs at a height equal to zero, the smallest energy emission zones are observed owing to a rapid extinguishing of the jet fire effect. Along with an increase of the height, the dimensions of danger zones grow substantially.
Table 8 and
Table 9 demonstrate how intensively a change in the height at which LNG is released affects the range of a danger zone. Greater wind speeds do not translate into any significant change in the dimensions of the zones of specified jet densities of thermal radiation, with the exception of heavy LNG for depressurizations occurring at the level of water surface, where a rate growth generates a greater radius of the danger zone. This phenomenon is caused by LNG molecules being carried by wind. The molecules of LNG-Heavy mix with the air of high humidity at the water surface level, which results in a more intensive reduction of the mixture density, consequently the mixture molecules are more susceptible to being carried by wind and they possess a greater total energy necessary to overcome the friction force acting on the surface. Such a phenomenon is no longer observed for a light LNG variety even at the level of water surface. The effect is determined by the vapour pressure of both LNG variants as well as by air density at water surface level, which is lower for humid air on account of the fact that the molecular mass of water is smaller than the mean molecular mass of dry air.
Pasquill stability exerts virtually no influence on the ranges of the zones created for the phenomenon of an early pool fire. The leading parameter is wind speed—the greater the wind speed, the greater the size of the zones of a specified thermal radiation level. The height at which depressurization occurs does not affect the size of the zones of thermal radiation. In the case of a heavy LNG variation, the size of the zone in which maximum thermal radiation persists is slightly greater than for the light variation. Simultaneously, the area in which thermal emission diminishes to zero observes a slight increase for the light variation.


 ,
, 


