Article

Pore Water and Its Influences on the Nanopore Structures of Deep Longmaxi Shales in the Luzhou Block of the Southern Sichuan Basin, China

1
State Key Laboratory of Organic Geochemistry, Guangzhou Institute of Geochemistry, Chinese Academy of Sciences, Guangzhou 510640, China
2
CAS Center for Excellence in Deep Earth Science, Guangzhou 510640, China
3
University of Chinese Academy of Sciences, Beijing 100049, China
4
Research Institute of Shale Gas, PetroChina Southwest Oil and Gas Fields, Chengdu 610002, China
*
Author to whom correspondence should be addressed.
Energies 2022, 15(11), 4053; https://doi.org/10.3390/en15114053
Submission received: 18 April 2022 / Revised: 24 May 2022 / Accepted: 24 May 2022 / Published: 31 May 2022
(This article belongs to the Special Issue New Challenges in Shale Gas and Oil)

Abstract

:
In the Luzhou Block of the southern Sichuan Basin, the deep Longmaxi shales have become important exploration targets in recent years. However, the water-bearing properties of these shales are still unclear, which significantly limits evaluations of reservoir pore structures and gas-in-place (GIP) contents. In this study, twelve fresh shale core samples were collected at the well site, and the pore water (CPW) and equilibrium water (CEW) contents, as well as the pore structures of the shales, were analyzed under both as-received and dried conditions. The results indicate that the deep shales have low water-bearing extents with a pore water content (CPW) of 3.82–16.67 mg/g, and that both the organic matter (OM) and inorganic matter (IM) pores can be used for pore water storage. The extent of influence of pore water on nonmicropores and IM pore structures is more significant than that on micropores and OM pore structures. Meanwhile, the pore water obviously reduces the retention effects of nanopores and may block nanopores with pore widths < 0.5 nm. An average of 40% of pore spaces were taken up by pore water in the studied deep shales in the Luzhou Block, and the residual pore surface area and pore volume of the shales were mainly contributed from micropores and nonmicropores, respectively.

1. Introduction

In the last two decades, more than 95% of commercial shale gas in China was produced from the Upper Ordovician Wufeng-Lower Silurian Longmaxi (WF-LMX) marine shales in the Sichuan Basin, and the majority of the production was contributed by shallow shale reservoirs with burial depths of less than 3500 m, such as the Changning, Weiyuan, Zhaotong and Fuling shale gas plays [1,2,3]. In recent years, shale gas exploration in China has progressively extended to deeper shale reservoirs with burial depths of more than 3500 m in the southern Sichuan Basin [4]. The geological shale gas resources of the WF-LMX shales in the Luzhou Block are expected to be more than 10 × 1012 m3, and 80% of them are stored in deep shale reservoirs [5,6]. The Luzhou Block of the southern Sichuan Basin is located in the sedimentary center of the deep-water shelf, and the WF-LMX deep shales were well developed and generally retained in an overpressure state. These shales, generally with high TOC contents of greater than 3%, reached highly mature or over mature stages with Ro values of 2.5–4.5%. Meanwhile, plenty of nanopores were developed in these shales, including both organic matter and inorganic matter pores, with an average porosity of more than 4%. The geological factors and geochemical properties of the shales were significantly beneficial for the enrichment and accumulation of shale gas, which leads to the deep shales in the Luzhou Block having a large shale gas potential [7,8]. Several deep shale gas wells have been drilled in the Luzhou Block that exhibit great potential for shale gas [9]. For example, Well L203, with a vertical depth of 3890 m, had a test production of 138 × 104 m3/d [10]. Deep shales have become important exploration targets in the Sichuan Basin, especially in the Luzhou Block.
However, several challenges have arisen in the exploration of deep shale reser-voirs in the Luzhou Block. For example, deep shale reservoirs generally exhibit low electrical resistivity, and their gas-in-place (GIP) contents vary significantly in different tectonic areas [11,12]. The water-bearing properties of deep shale may be one of the main causes of these problems because the pore water of the shale can largely deter-mine its electrical resistivity and effective pore spaces. Although most of the pore water has been removed from the shale reservoirs, resulting from the displacement by hydrocarbons as well as the compaction of overlying strata, some pore water remained in the shale pores [13,14,15]. Because shale gas and pore water are concomitantly stored in the shale pore system, the gas-bearing property of shale is significantly affected by the pore water content and distribution [16,17,18]. Previous practical shale gas exploration and development experience has shown that shale reservoirs with a water saturation of less than 45% generally have a high gas production, while those with a water saturation of greater than 45% generally have a low gas production [19,20].
At present, however, the water-bearing properties of deep shales are not fully understood due to the lack of typical deep shale geological samples and effective methods, which significantly hinders the evaluation of effective pore structures and GIP contents of deep shales. In this study, a set of fresh shale plunger samples was collected during the drilling process of Well Z216 in the Luzhou Block, and the water-bearing properties and their effects on pore structures were investigated. The results of this study have practical significance for realizing the effective pore spaces of the deep shales in the southern Sichuan Basin.

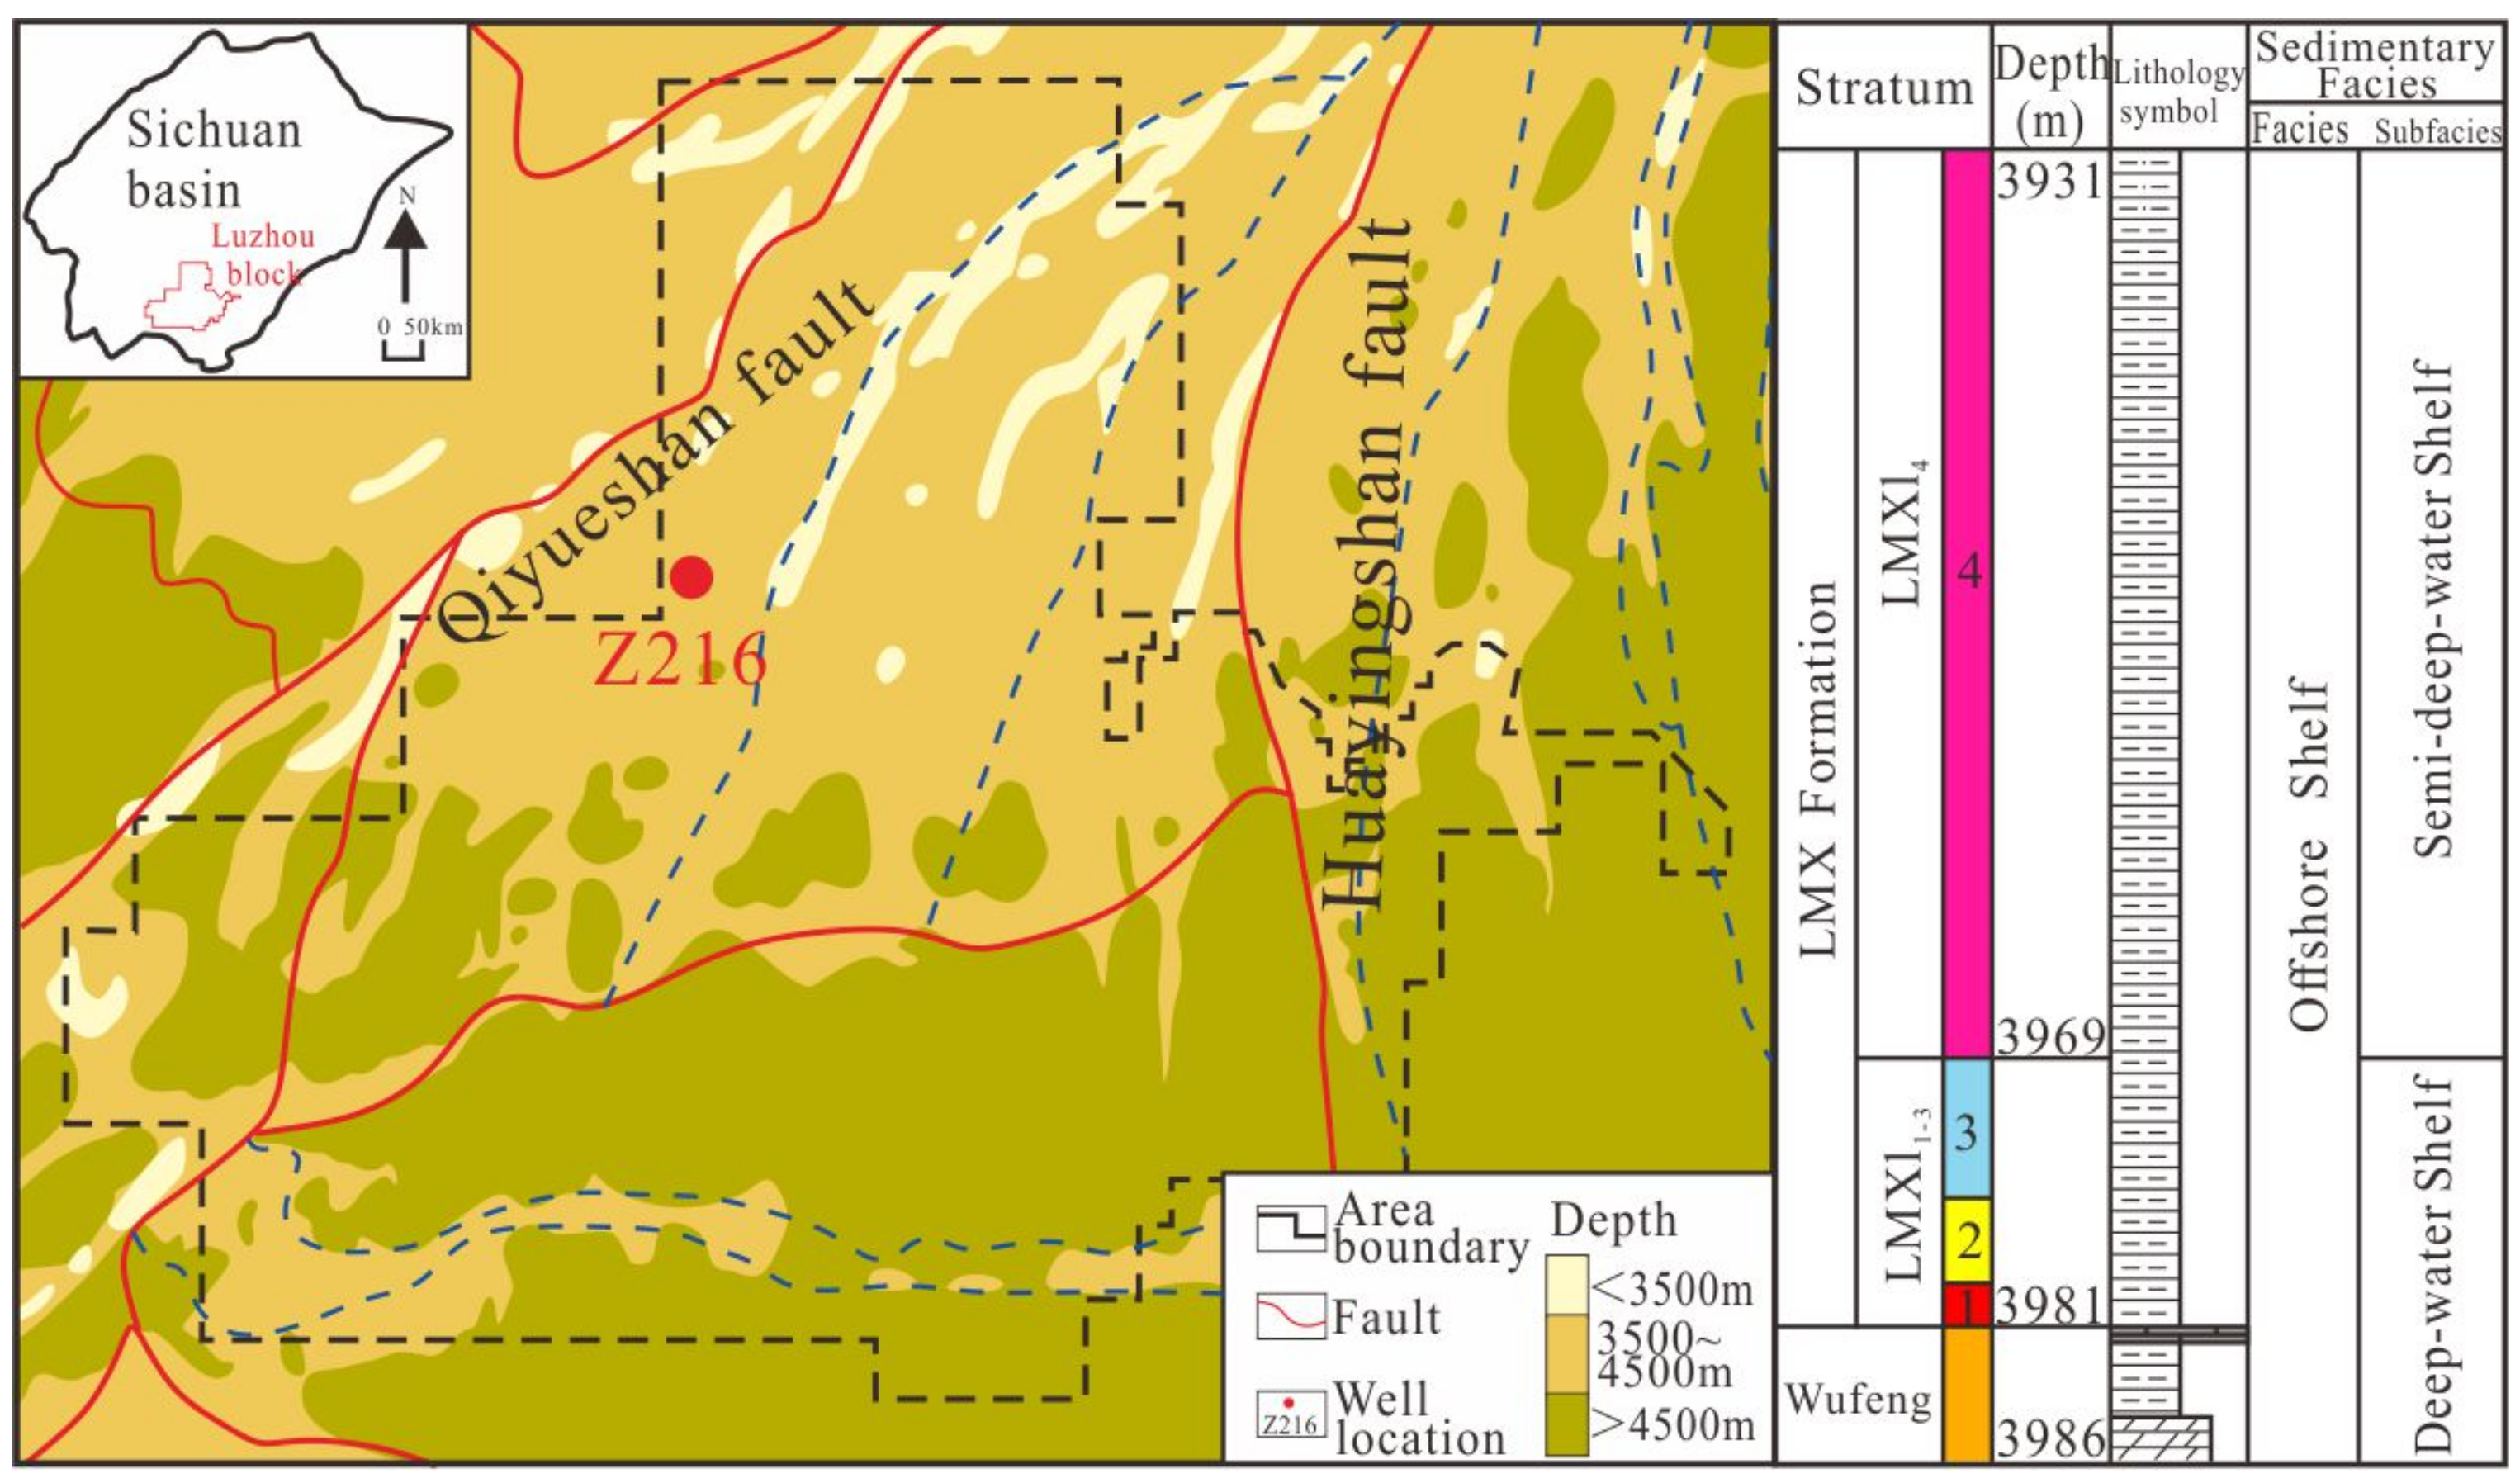
2. Geological Background

The Luzhou Block, in the southern Sichuan Basin, has an area of 5848 km2 and is bounded by the Qiyueshan fault in the east and the Huayingshan fault in the west [21]. It is located in a fold structure area that is divided by intervals of subanticlines and subsynclines (Figure 1) [22,23]. During the upper Ordovician and Lower Silurian, Luzhou Block was located in the center of the sedimentary basin, so the WF-LMX Formation were formed in a reductive depositional environment [24]. In addition, the depositional environment of the Wufeng shales was more reductive than that of the Longmaxi shales [25]. Organic-rich siliceous shales were widely developed in the Wufeng Formation (WF) and the sublayers of the first member of the Longmaxi Formation (LMX11-3), with sedimentary thicknesses of 6 m–11 m and 5 m–24 m, respectively (Figure 1) [26,27]. The burial depths of the WF-LMX shales in the Luzhou Block are generally more than 3500 m, and they progressively increase from north to south (Figure 1) [28].

3. Samples and Experiments

3.1. Samples and Pretreatments

The studied shale samples were derived from Well Z216 in the Luzhou Block of the southern Sichuan Basin (Figure 1). During the core drilling, shale core samples were collected at an interval of 1 m after target cores were taken out of the coring barrel. Then, the shale cores were split into small blocks, and one of them was immersed in water to check whether it contained gas. Only gas-bearing shale samples were selected to drill small plunger samples (20 mm in height and 15 mm in diameter) from the inner parts of shale cores. After that, the drilled plunger core samples were wrapped with fresh-keeping film and sealed in plastic bags. A total of twelve typical shale plunger samples were collected from the LMX11–3 subsection, and the burial depths of these samples were between 3969 m and 3981 m (Table 1).

3.2. Experiments

3.2.1. TOC and XRD Analysis

Diluted hydrochloric acid with a concentration of 6 mL/L was used to remove the carbonates of powdered shale samples (less than 80 mesh). After the prehandled shale powders were dried, they were used to measure the TOC content with a carbon sulfur analyzer (Eario El Cube). The mineral contents of the shale samples were analyzed by an X-ray diffractometer (XRD, Bruker D8 Advance). The shale samples were crushed to less than 200 mesh, and the measurements were performed at 30 mA and 40 kV with Cu Kα radiation. The rate of stepwise scanning was 4°/min over a range of 3° to 85°. Two measurements of TOC content and mineral content were carried out for each shale sample, and the obtained values were averaged in this study.

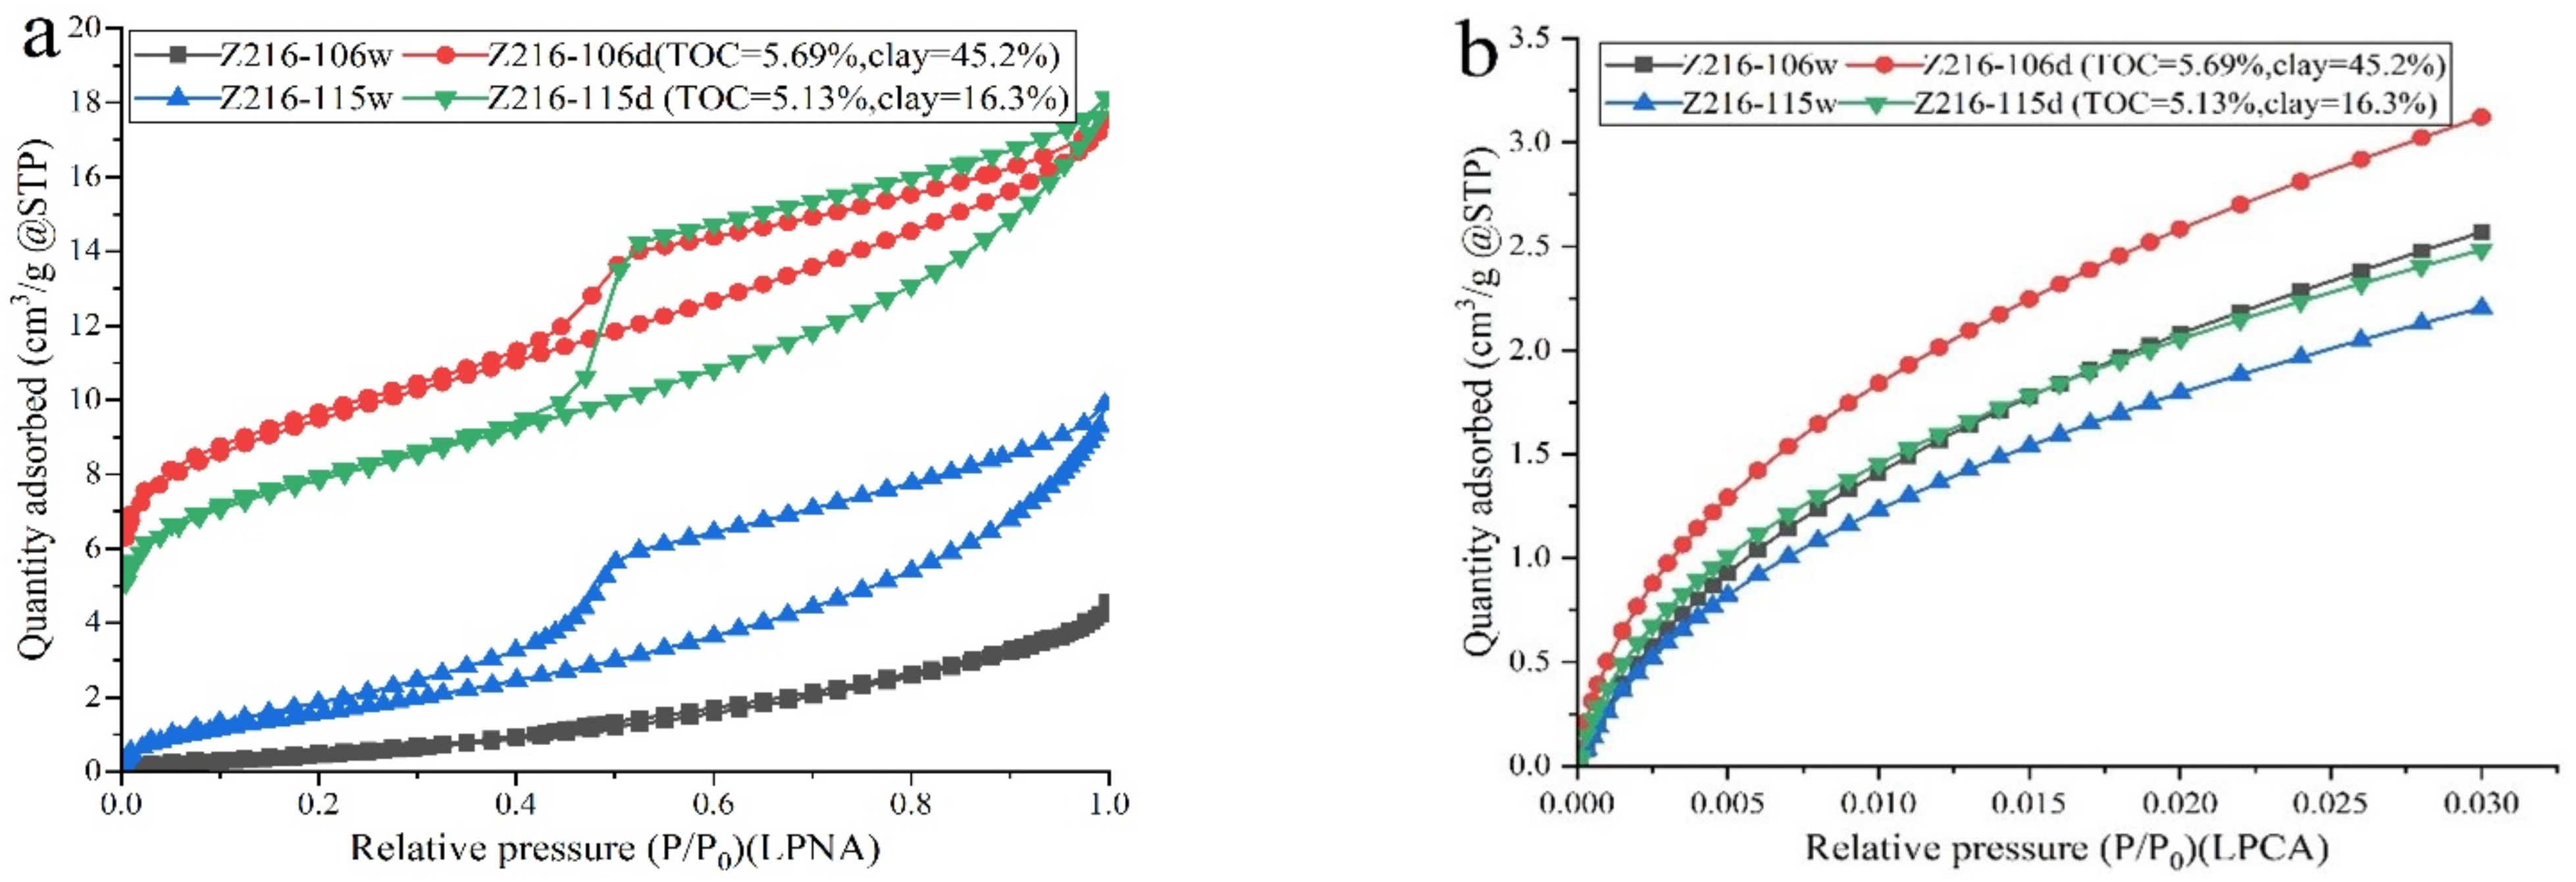
3.2.2. Low-Pressure Gas Adsorption Experiments

According to the International Union of Pure and Applied Chemistry (IUPAC), the nanopores of shales can be divided into three parts based on their pore width, including macropores (>50 nm), mesopores (2 nm–50 nm) and micropores (<2 nm) [29]. In this study, the pore surface area and volume of micropores and nonmicropores (including mesopores and macropores) were measured by low-pressure carbon dioxide adsorption (LPCA) and low-pressure nitrogen adsorption (LPNA) experiments, respectively [30,31,32]. The measurements were performed on shale grains of 20 mesh–40 mesh by a Micromeritics ASAP 2020 M instrument. Before the LPCA and LPNA experiments, as-received shale samples were initially stored at a liquid nitrogen temperature of −196.56 °C and an ice-water mixture temperature of 0 °C, respectively, to limit the evaporation of pore water; however, dried shale samples were degassed in situ in the instrument for 12 h at 110 °C. The LPNA and LPCA experiments were carried out at relative pressures of 0.005–0.995 and 0.00001–0.032, respectively.

3.2.3. Water Content Analysis

The plunger shale core samples were directly weighed under as-received conditions (mAR) and then dried at a temperature of 105 °C for 12 h in a vacuum oven. After that, the dried plunger shale samples were weighed again (mDry). The difference in the mass between the two weights was the mass of pore water, and the pore water content of the shale sample (CPW, mg/g) was calculated using Equation (1):
CPW = [(mAR − mDry) × 1000]/mDry
The equilibrium moisture adsorption experiment was performed on dried shale plunger samples based on the recommended method [33]. The shale plunger samples were placed in a sealed vessel, and the bottom of the vessel was filled with a saturated solution of K2SO4. After the vessel was evacuated, the shale samples were held at a temperature of 30 °C and a relative humidity of 98% until they were fully saturated with the moisture. Then, the moisture-equilibrated shale plungers were weighed (mME) to calculate the equilibrium water content (CEW, mg/g) by Equation (2). Based on the CPW and CEW values, the pore water equilibrium extent (EPW, %) of the shale samples was calculated by Equation (3):
CEW = [(mME − mDry) × 1000]/mDry
EPW = CPW/CEW × 100%

4. Results and Discussions

4.1. Maturity, TOC and Mineral Contents

The maturity of the studied shale samples is high, with Ro values ranging from 3.4% to 3.5%, indicating that the organic matter was overmature (Table 1). The TOC contents of the shale samples are high and range from 1.38% to 8.54%, with an average value of 4.52% (Table 1). The minerals of the shale samples mainly include clay and brittle minerals, with contents of 6.8–56.7% and 41.2–92.5%, respectively. The clay minerals mainly contain chlorite and illite, with contents of 0–6.3% and 6.8–50.4%, respectively. The brittle minerals are mainly composed of quartz, with a content of 4.5–64.8%. In addition, the shale samples also have a certain amount of pyrite, with a content of 0.7–19.1% (Table 1 and Figure 2).

4.2. Water-Bearing Properties

The equilibrium water absorption curves of the studied shale samples are similar, and they can be divided into two stages according to the equilibrium water absorption time. At the early stage (<20 h), the CEW significantly increased with equilibrium time, which indicates that the shales have a high absorption rate for water. At the late stage (>20 h), however, the CEW slightly increase with equilibrium time, which indicates that the shales have a low absorption rate for additional water. All of the studied shales reached moisture equilibrium after approximately 100 h–150 h (Figure 3).
The CPW values of the studied shales are 3.82 mg/g–16.67 mg/g, and the average value is 8.27 mg/g (Table 2). Compared with the LMX shales of the YQ1 well in the outer boundary of the Sichuan Basin, the CPW values of the LMX shales in the Luzhou Block are higher [34]. The CEW values of the shale samples are between 7.01 mg/g and 26.80 mg/g, with an average value of 16.84 mg/g (Table 2). The CEW values are much higher than the CPW values for the studied shale samples, and their EPW values are in the range of 31.08–71.08%, with an average of 49.46% (Table 2), which indicates that these shales have a low water-bearing extent and are in a sub-equilibrium state [35].
The CPW and CEW values of deep shale samples have significantly positive correlations with the TOC contents, and the correlation coefficients (R2) are 0.65 and 0.77, respectively (Figure 4a), which can be attributed to the organic matter of shales developing OM pores for water storage. Similarly, the CPW and CEW values of deep shale samples also have positive correlations with clay mineral contents, and the R2 values are 0.68 and 0.59, respectively (Figure 4b), because the IM pores developed in clay minerals can be used for water storage. However, the CPW and CEW values of deep shale samples exhibit negative relationships with brittle mineral contents, with R2 values of 0.69 and 0.60, respectively (Figure 4c), which may be due to the poor development of the pores in brittle minerals [36,37]. Additionally, the EPW values of deep shales are also controlled by their OM and IM compositions (Figure 5a,b). The EPW values exhibit a weakly negative correlation with TOC contents, probably resulting from the low hydrophilia of OM pores, while they have an obviously positive relationship with clay contents because of the high hydrophilia of IM pores. Meanwhile, the EPW values have a negative correlation with brittle mineral contents (Figure 5c) because brittle minerals barely develop any pores [38,39].

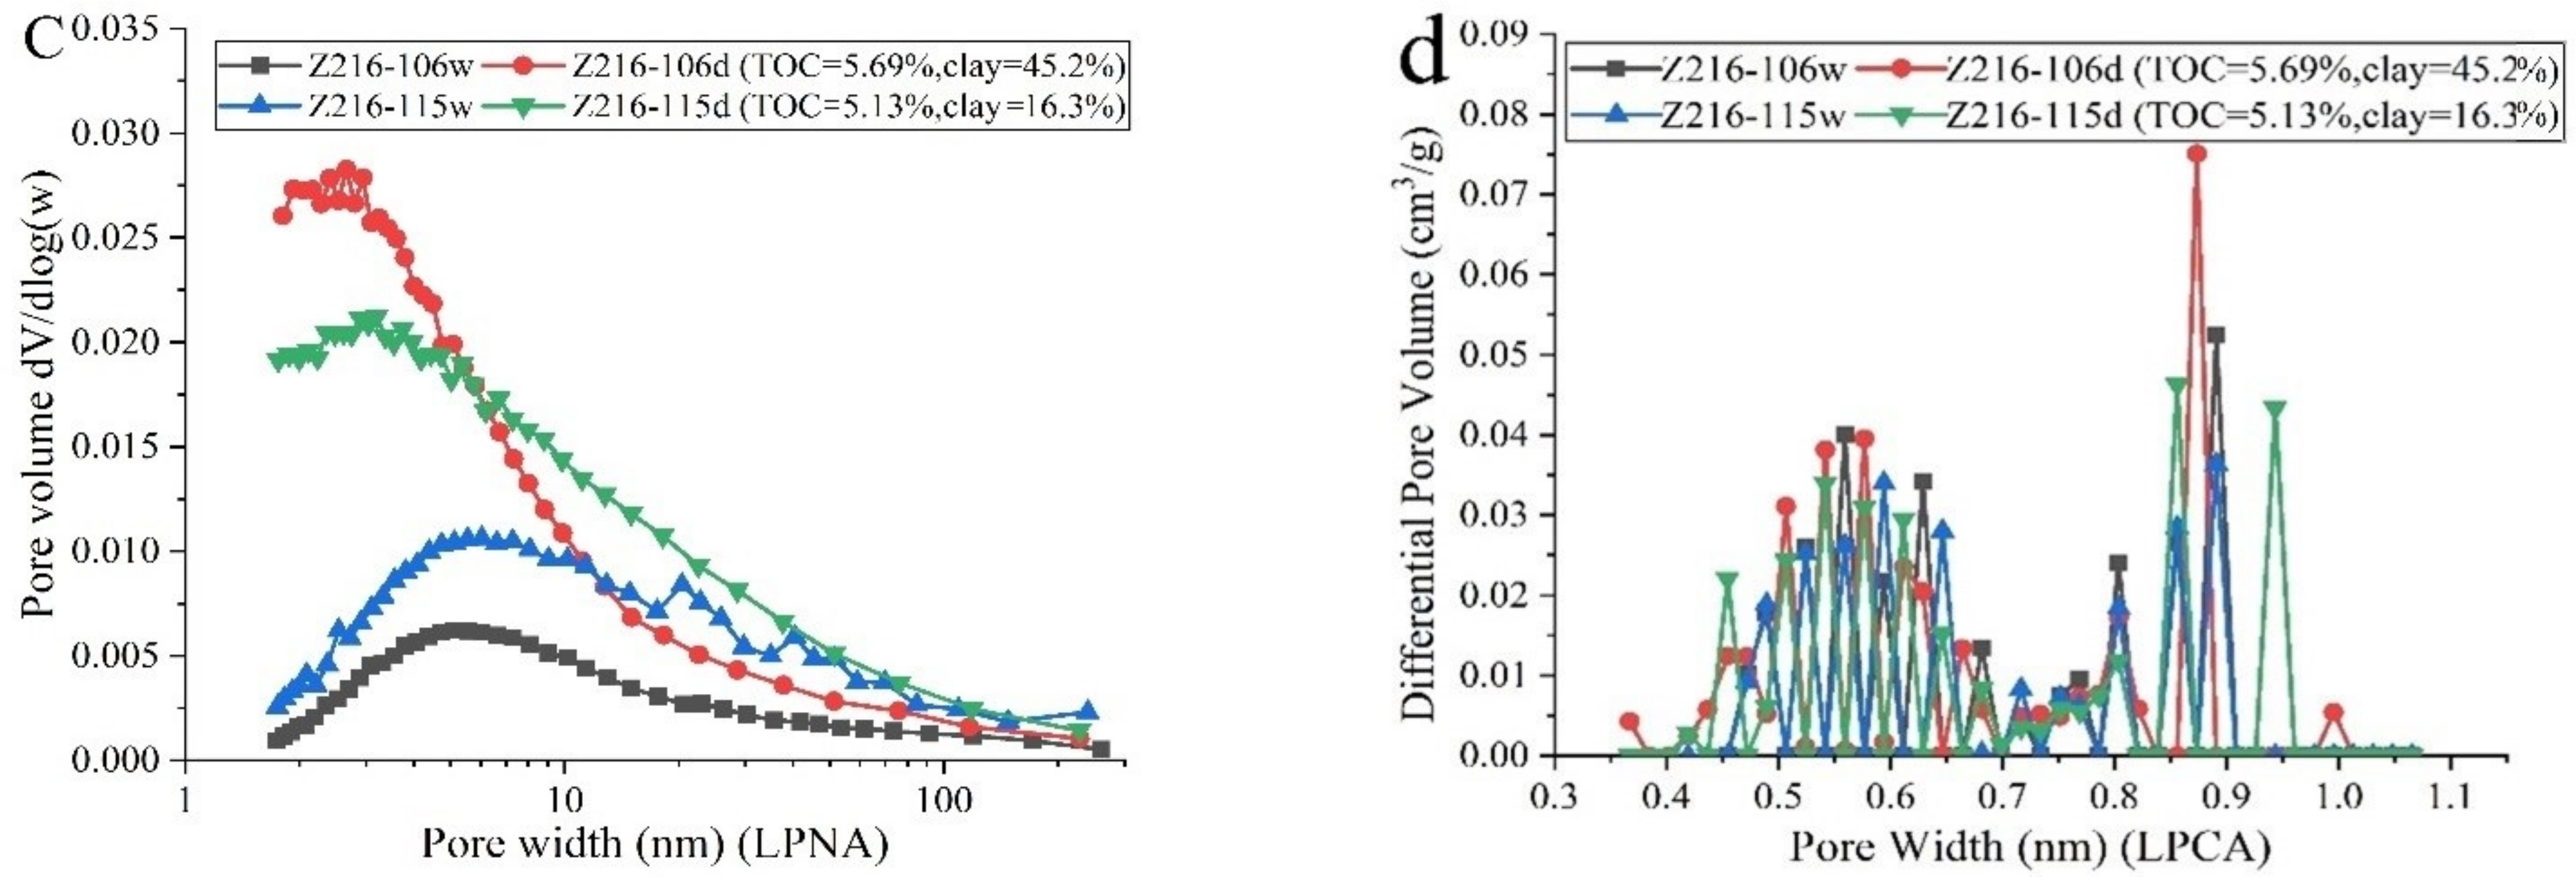
4.3. Pore Structure Characteristics of the Studied Deep Shales

The total pore (Stot), micropore (Smic) and nonmicropore (Snon) surface areas of the deep shale samples under dried conditions are 13.92 m2/g–64.65 m2/g, 8.25 m2/g–27.67 m2/g and 5.67 m2/g–36.98 m2/g, respectively (Table 3). Snon is significantly larger than Smic, indicating that the nonmicropore surface area accounts for a large proportion of the total surface area of the studied shale samples. The total pore (Vtot), micropore (Vmic) and nonmicropore (Vnon) volumes are 0.0136 cm3/g–0.0360 cm3/g, 0.0011 cm3/g–0.0049 cm3/g and 0.0124 cm3/g–0.0311 cm3/g, respectively (Table 3). Vnon is larger than Vmic, indicating that nonmicropores made a greater contribution to the total pore volumes of the studied shale samples. The pore surfaces and volumes of micropores and nonmicropores have positive correlations with TOC content, and the R2 values are between 0.52 and 0.87 (Figure 6a,b). However, these pore structure parameters exhibit no obvious correlations with clay contents for the shales under as-received conditions (Figure 7). The above correlations may show that the pore surface area and volume in shale samples are contributions from both OM and IM, and the former has a higher contribution than the latter.
For the studied shales under as-received conditions, their pore surfaces and volumes significantly decrease. The Stot, Smic and Snon values are 10.83 m2/g–35.45 m2/g, 7.72 m2/g–25.94 m2/g and 1.78 m2/g–9.51 m2/g, respectively (Table 3). Snon is obviously smaller than Smic, indicating that micropores made greater contributions to the Stot of the as-received shales. Vtot, Vmic and Vnon are 0.0100 cm3/g–0.0256 cm3/g, 0.0009 cm3/g–0.0043 cm3/g and 0.0071 cm3/g–0.0213 cm3/g, respectively (Table 3). Vnon is larger than Vmic, indicating that nonmicropores made greater contributions to the Vtot of the as-received shales. The pore structure parameters of micropores and nonmicropores have positive correlations with TOC contents, and the R2 values are between 0.24 and 0.96 (Figure 6). The pore structure parameters of micropores have weakly positive relationships with clay contents (Figure 7a,b); however, those of nonmicropores and total pores exhibit no obvious relationships with clay contents (Figure 7c–f). These correlations indicate that pore water has an obvious influence on shale pore structures, and the extent of its influence on IM pore structures is more significant than on OM pore structures.

4.4. Influences of Pore Water on Pores

4.4.1. Water-Occupied Pore Structures

The CPW and CEW values have positive correlations with the pore structures of micropores and nonmicropores, with R2 values ranging between 0.43 and 0.90 (Figure 8). These correlations indicate that pore water is stored in both the micropores and nonmicropores of the studied deep shales. In addition, the R2 values of the relationships between the CEW and pore structures are larger than those between the CPW and pore structures (Figure 8), which indicates that the water-bearing properties of the as-received shales may be affected by factors in addition to their pore structures.
The water-occupied pore spaces can be approximately characterized by the differences in shale pore structures under dried and as-received conditions. In this study, the difference between the pore surface area and volume of shale samples under different conditions and its proportion (PE) in the total pore structure were investigated to reveal the influence of pore water on nanopores (Table 4 and Table 5). The results indicate that the water-occupied pore surfaces and volumes are obviously positively associated with the CPW values, with R2 values ranging from 0.71 to 0.87 (Figure 9). Additionally, the water occupied pore surface area and volume of nonmicropores are significantly larger than those of micropores, and the differences in the water-occupied pore spaces between the two types of nanopores significantly increase with the increases in CPW (Figure 9), which indicates that pore water mainly takes up nonmicropore spaces of the studied deep shales, especially for those shales having high pore water contents. Based on the slopes in the correlations of CPW with water-occupied pore structures shown in Figure 9, it can be estimated that the extent of influence of pore water on nonmicropore structures is between 5.7 and 17.0 times higher than that on micropore structures, which probably can be attributed to the different occurrence phases of pore water in the two types of nanopores.

4.4.2. Influences of the Pore Water on Nanopores

Under geological conditions, the occurrence and distribution of pore water in shales are mainly affected by the capillary force and adsorption force induced by the inner surfaces of nanopores [40]. The adsorption forces are basically controlled by the hydrophilicity of the pore surfaces, and the hydrophilicity of OM pore surfaces is lower than that of IM pore surfaces for overmature shales [41]. The capillary forces are largely determined by the pore width, and the pores with a smaller pore width have a larger capillary force [31,42,43]. For shales in a subirreducible state, pore water generally fills micropores mainly by capillary forces and is simultaneously drawn into the surfaces of nonmicropores by adsorption forces [44].
In this study, the distributions of pore water in the OM and IM pores of shales were qualitatively investigated by two typical samples, Z216-106 and Z216-115 (Figure 10). Samples Z216-106 and Z216-115 have similar TOC contents, which implies that they may have similar OM pores. However, sample Z216-106 has a higher clay content than sample Z216-115, and thus, the pore structures of sample Z216-106 may have more IM pores. Under dried conditions, the two samples have similar Vtot values, and the Stot of sample Z216-106 is larger than that of sample Z216-115. However, under the as-received condition, both the Vtot and Stot values of sample Z216-106 are lower than those of sample Z216-115 (Table 3). In addition, the decreases in the adsorption quantities of N2 and CO2 adsorption between the as-received and dried samples are larger for sample Z216-106 than for sample Z216-115 (Figure 10a,b). Therefore, the extent of influence of pore water on the IM pores is more significant than that on the OM pores. Moreover, the hydrophilicity of the whole pore systems of shales may be enhanced by their increasing clay contents. The TOC contents of the two samples are similar; the clay mineral content of Z216-106 is much greater than that of Z216-115, and the water content of Z216-106 is approximately double than that of Z216-115.
Previous studies also reported that pore water can totally take up or block the IM pores of shales with pore widths < 0.7 nm [45,46]. Additionally, the N2 gas adsorption and desorption isotherms show obvious hysteresis loops for the dried shale samples, while the hysteresis loops are significantly reduced for the as-received shales (Figure 10a). This implies that the deep shales contain narrow pore network systems that induce pore retention effects; however, under as-received conditions, the pore water of shales forms a water film or is condensed in these narrow pore mouths, which obviously decreases the pore retention effects [47,48,49]. Moreover, the pore water has a larger effect on the nonmicropores with pore widths < 10 nm than on those with pore widths > 10 nm (Figure 10c), which can probably be attributed to the former nonmicropores having stronger capillary forces than the latter nonmicropores [43]. In addition, for the shales under as-received conditions, the micropores with pore widths < 0.5 nm were not detected in the pore size distributions (PSDs) (Figure 10d), which indicates that these micropores may be fully blocked or occupied by pore water.
Combined with the pore structures of shales and their water-bearing properties (Table 3 and Table 4), this study evaluated the effects of pore water on shale nanopores with various pore sizes. The results show that the relative percentages of each water-occupied pore structure of the as-received shales are 13.05%, 16.88%, 76.35% and 40.32% for Smic, Vmic, Snon and Vnon, respectively (Table 5 and Figure 11). Overall, an average percentage of 47.54% of the surface area and 37.20% of the pore volume were occupied by pore water for the deep Longmaxi Formation shales in the Luzhou Block (Table 5 and Figure 11).

4.5. Geological Significance

Although pore water has a significant effect on the nanopores of shales, the residual pore structures are effective for gas storage. The effective pore structures of shales can be calculated by subtracting water-occupied pore structures from the total pore structures. The results indicate that the average percentage (PE) of the effective pore structure in the total pore structure is 52.82% for Stol, including 40.07% for Smic and 12.75% for Snon, which indicates that the effective pore surface areas of the studied shales are mainly contributed by micropores (Table 5 and Figure 12). The PE values are 62.44% for Vtol, including 51.97% for Smic and 10.74% for Snon, which indicates that the effective pore volume in the studied shales is mainly provided by nonmicropores (Table 5 and Figure 12).
The pore water of gas shales has significant influences on their gas-bearing characteristics by taking up pore volumes and adsorption sites [50,51]. For the deep LMX shales in the Luzhou Block, the pore water occupies most of the surface areas of nonmicropores, which leads to micropores being the main place for adsorbed shale gas; meanwhile, it takes up most of the micropore volumes, which results in the free shale gas being predominantly stored in nonmicropores. Moreover, the pore water may block nanopores with pore widths < 0.5 nm, which causes these small nanopores to fail to store shale gas. In addition, the pore water significantly reduces the retention effects of shale nanopores, which may enhance the migration of shale gas. The effective pore spaces of water-bearing shales are obviously different from those of shales under dried conditions. Therefore, the water-bearing properties and their effects on nanopores of deep shales should be fully considered for the exploration and development of deep shale reservoirs in the southern Sichuan Basin.

5. Conclusions

In this study, a group of deep Longmaxi shale core samples were collected in situ during the drilling of Well Z216 in the Luzhou Block of the southern Sichuan Basin. The water-bearing properties and their influences on the pore structures of these fresh shale samples were investigated. The following conclusions were reached:
(1)
The deep shales have a low content of pore water, and the pore water was stored in both organic matter (OM) and inorganic matter (IM) nanopores of the deep shales. The water-bearing properties of these shales were largely determined by their TOC and clay mineral contents.
(2)
Pore water has greater influences on the non-micropores and inorganic pores than on the micropores and organic pores; meanwhile, it obviously reduces the retention effects of nanopores and may block nanopores with pore widths < 0.5 nm.
(3)
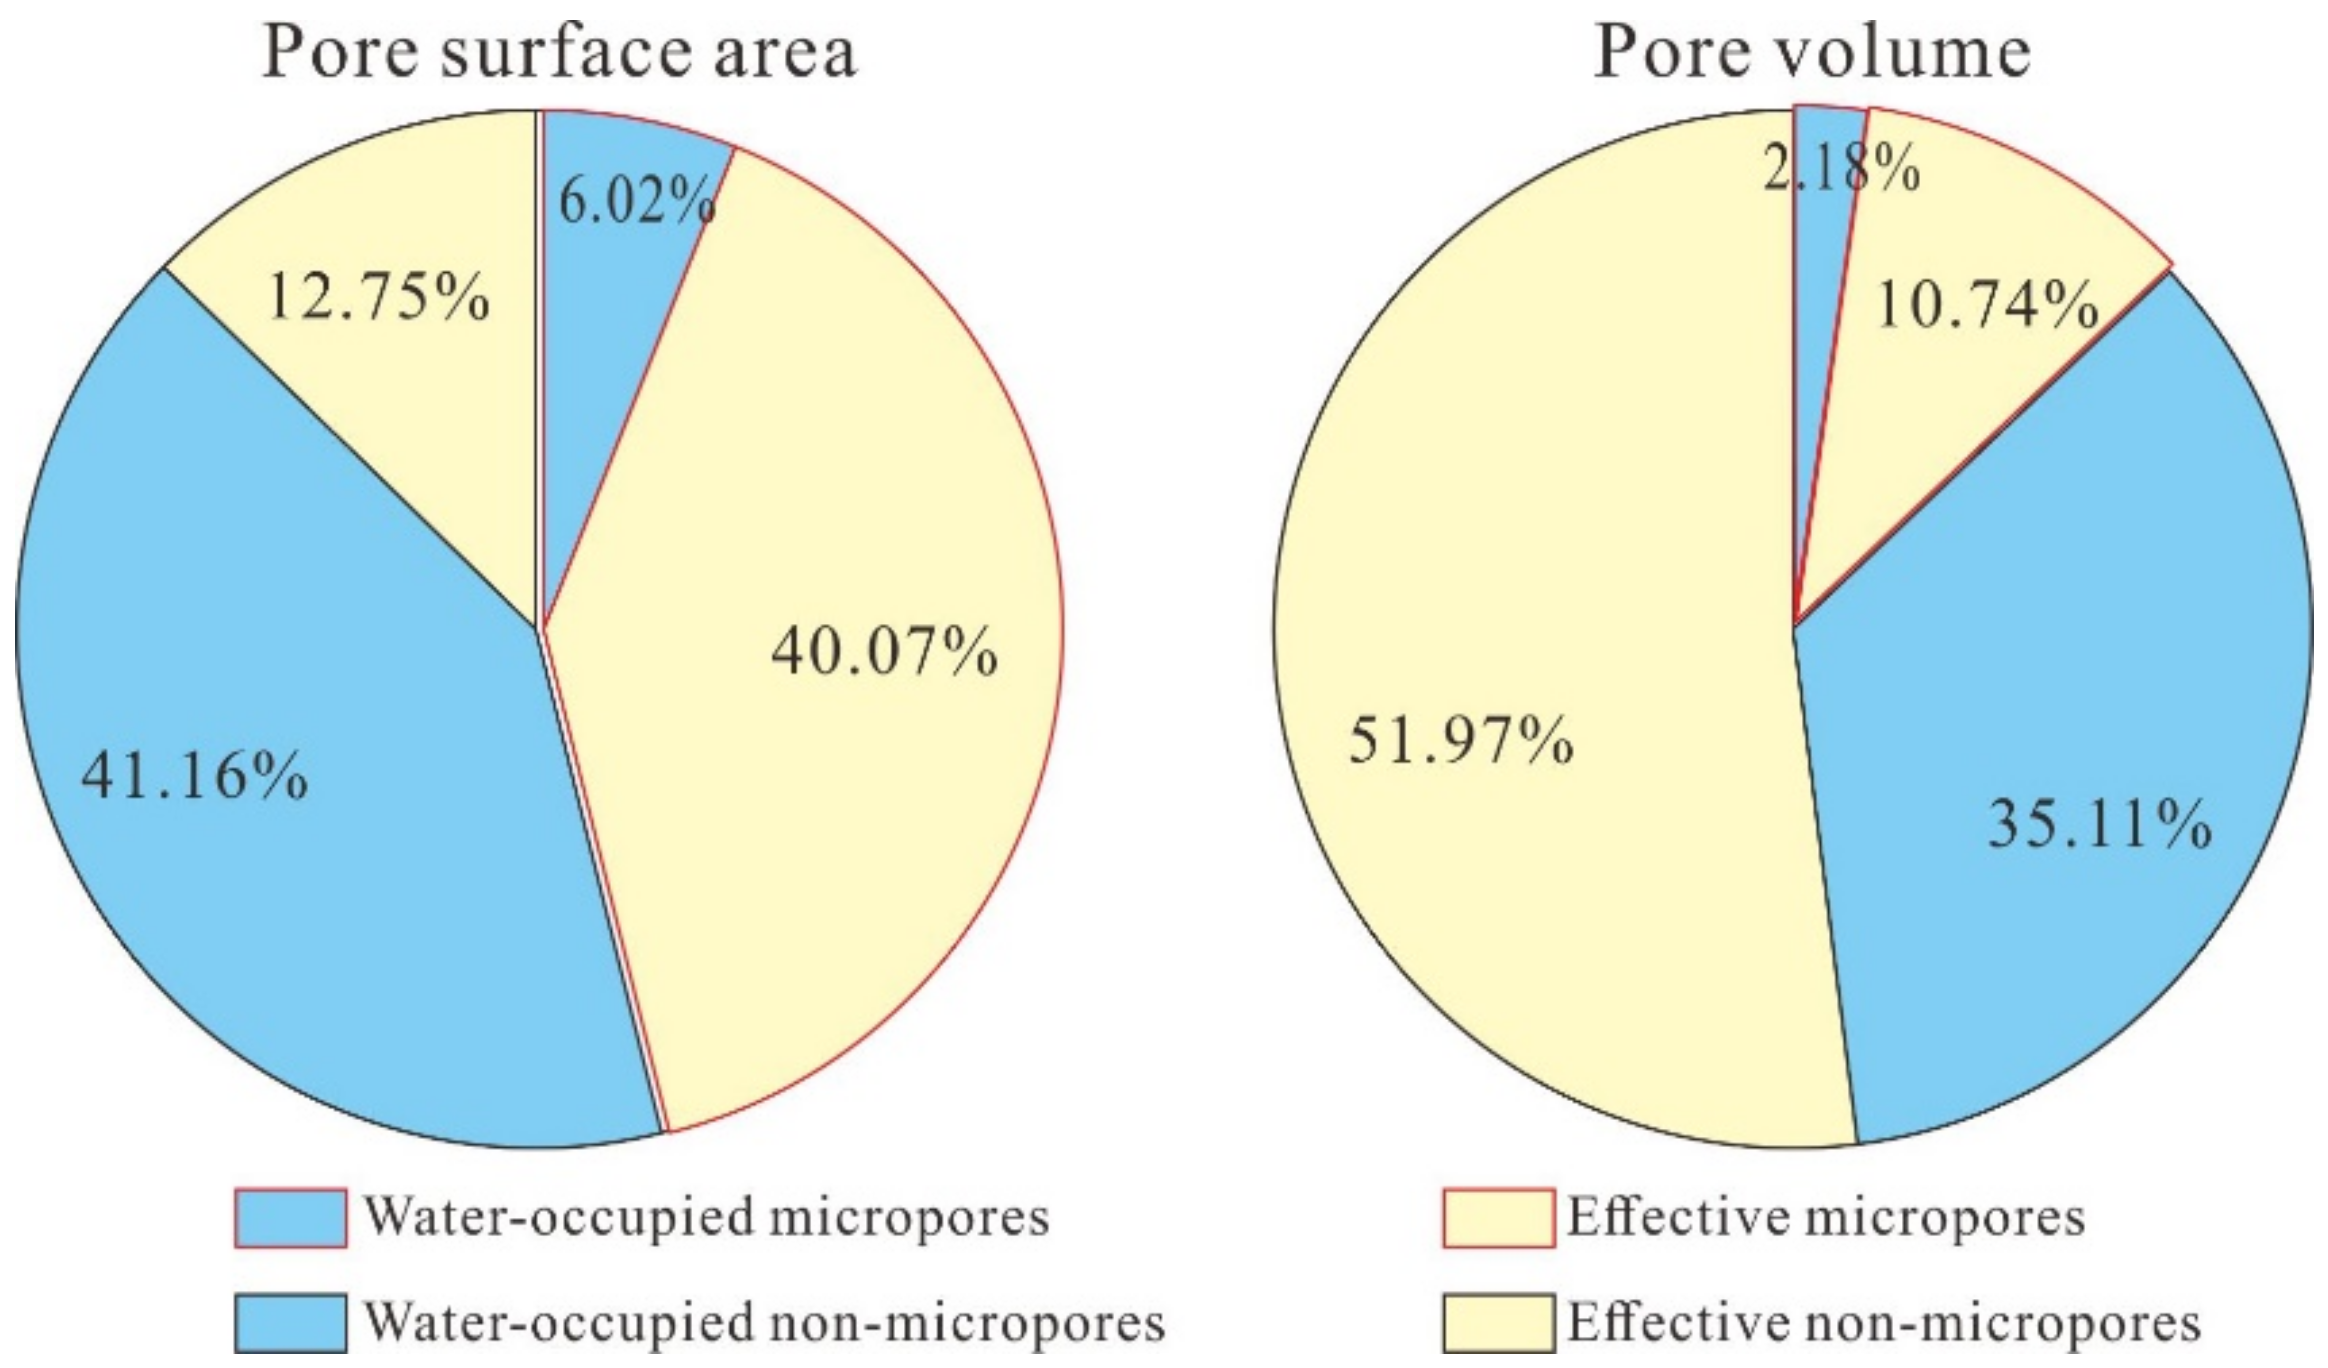
The pore water took up approximately 40% of the nanopore space of the deep shale in the Luzhou Block, and the effective pore surface area and pore volume for storing shale gas were mainly contributed by micropores and nonmicropores, respectively.

Author Contributions

Conceptualization, P.C.; methodology, T.L.; investigation, S.L., C.L. and K.Z.; resources, H.T. and W.W.; data curation, W.W.; writing—original draft preparation, H.G.; writing—review and editing, P.C.; supervision, H.T. All authors have read and agreed to the published version of the manuscript.

Funding

This study was supported by the National Natural Science Foundation of China (41402116, U1810201), the Project of PetroChina Southwest Oil and Gas Fields (XNS-YYY-JS2021-49), the Natural Science Foundation of Guangdong Province (2021A1515011381) and the Independent Project of the SKLOG (2020–2).

Institutional Review Board Statement

Not applicable.

Informed Consent Statement

Not applicable.

Data Availability Statement

Not applicable.

Conflicts of Interest

The authors declare no conflict of interest.

Nomenclature

TOCtotal organic carbon
XRDX-ray diffraction
CPWpore water content
CEWequilibrium water content
EPWequilibrium water saturation
IUPACInternational Union of Pure and Applied Chemistry
LPCALow-pressure Carbon Dioxide Adsorption
LPNALow-pressure Nitrogen Adsorption
Smicmicroporous specific surface area
Vmicmicroporous volume
Snonnonmicroporous surface area
Vnonnonmicroporous volume
Stottotal pore surface area
Vtottotal pore volume
R2correlation coefficient

References

  1. Long, S.; Feng, D.; Li, F.; Du, W. Prospect of the deep marine shale gas exploration and development in the Sichuan Basin. Nat. Gas Geosci. 2018, 29, 433–451. [Google Scholar]
  2. Li, S.; Li, Y.; He, Z.; Chen, K.; Zhou, Y.; Yan, D. Differential deformation on two sides of Qiyueshan Fault along the eastern margin of Sichuan Basin, China, and its influence on shale gas preservation. Mar. Pet. Geol. 2020, 121, 104602. [Google Scholar] [CrossRef]
  3. Zou, C.; Yang, Z.; Sun, S.; Zhao, Q.; Bai, W.; Liu, H.; Pan, S.; Wu, S.; Yuan, Y. Exploring petroleum inside source kitchen: Shale oil and gas in Sichuan Basin. Sci. China-Earth Sci. 2020, 63, 934–953. [Google Scholar] [CrossRef]
  4. Ma, X.; Wang, H.; Zhou, S.; Shi, Z.; Zhang, L. Deep shale gas in China: Geological characteristics and development strategies. Energy Rep. 2021, 7, 1903–1914. [Google Scholar] [CrossRef]
  5. Guo, X.; Hu, D.; Huang, R.; Wei, Z.; Duan, J.; Wei, X.; Fan, X.; Miao, Z. Deep and ultra-deep natural gas exploration in the Sichuan Basin: Progress and prospect. Nat. Gas Ind. 2020, 7, 419–432. [Google Scholar] [CrossRef]
  6. Zhang, J.; Tao, J.; Li, Z.; Wang, X.; Li, X.; Jiang, S.; Wang, D.; Zhao, X. Prospect of deep shale gas resources in China. Nat. Gas Ind. 2021, 41, 15–28. [Google Scholar]
  7. Cheng, C.; Bai, X.; Lin, H.; Feng, L.; Xia, Y. Study on the Calculation of Adsorption Gas Content of Longmaxi Formation Deep Shale Reservoir in Southern Sichuan Basin. Spec. Oil Gas Reserv. 2018, 25, 1–6. [Google Scholar] [CrossRef]
  8. Wu, Y.; Wang, Y.; Li, J. Sedimentary characteristics and main reservoir control factors of deep shale in the Sichuan Basin: A case study on the Longmaxi Formation in the eastern Weiyuan area. Nat. Gas Ind. 2021, 41, 55–65. [Google Scholar]
  9. Zhang, S.; Dong, D.; Liao, Q.; Sun, S.; Huang, S.; Guan, Q.; Zhang, C.; Guo, W.; Jiang, S.; Shi, P. Geological characteristics and resource prospect of deep marine shale gas in the southern Sichuan Basin. Nat. Gas Ind. 2021, 41, 35–45. [Google Scholar]
  10. Yang, H.; Zhao, S.; Liu, Y.; Wu, W.; Xia, Z.; Wu, T.; Luo, C.; Fan, T.; Yu, L. Main controlling factors of enrichment and high-yield of deep shale gas in the Luzhou Block, southern Sichuan Basin. Nat. Gas Ind. 2019, 39, 55–63. [Google Scholar]
  11. Wang, X.; Zhang, B.; He, Z.; He, L.; Yang, K.; Huang, T.; Luo, F.; Tang, J.; Gan, L. Electrical properties of Longmaxi organic-rich shale and its potential applications to shale gas exploration and exploitation. J. Nat. Gas Sci. Eng. 2016, 36, 573–585. [Google Scholar] [CrossRef]
  12. Shang, F.; Zhu, Y.; Hu, Q.; Zhu, Y.; Wang, Y.; Du, M.; Liu, R.; Han, Y. Characterization of methane adsorption on shale of a complex tectonic area in Northeast Guizhou, China: Experimental results and geological significance. J. Nat. Gas Sci. Eng. 2020, 84, 103676. [Google Scholar] [CrossRef]
  13. Wardlaw, N.; McKellar, M. Wettability and connate water saturation in hydrocarbon reservoirs with bitumen deposits. J. Pet. Sci. Eng. 1998, 20, 141–146. [Google Scholar] [CrossRef]
  14. Mahadevan, J.; Sharma, M.; Yortsos, Y. Water removal from porous media by gas injection: Experiments and simulation. Transp. Porous Media 2007, 66, 287–309. [Google Scholar] [CrossRef]
  15. Cheng, P.; Xiao, X.; Wang, X.; Sun, J.; Wei, Q. Evolution of water content in organic-rich shales with increasing maturity and its controlling factors: Implications from a pyrolysis experiment on a water-saturated shale core sample. Mar. Pet. Geol. 2019, 109, 291–303. [Google Scholar] [CrossRef]
  16. Gasparik, M.; Bertier, P.; Gensterblum, Y.; Ghanizadeh, A.; Krooss, B.; Littke, R. Geological controls on the methane storage capacity in organic-rich shales. Int. J. Coal Geol. 2014, 123, 34–51. [Google Scholar] [CrossRef]
  17. Merkel, A.; Fink, R.; Littke, R. The role of pre-adsorbed water on methane sorption capacity of Bossier and Haynesville shales. Int. J. Coal Geol. 2015, 147–148, 1–8. [Google Scholar] [CrossRef]
  18. Yang, R.; Jia, A.; He, S.; Hu, Q.; Dong, T.; Hou, Y.; Yan, J. Water adsorption characteristics of organic-rich Wufeng and Longmaxi shales, Sichuan Basin (China). J. Petrol. Sci. Eng. 2020, 193, 107387. [Google Scholar] [CrossRef]
  19. Li, J.; Li, X.; Wang, X.; Li, Y.; Wu, K.; Shi, J.; Yang, L.; Feng, D.; Zhang, T.; Yu, P. Water distribution characteristic and effect on methane adsorption capacity in shale clay. Int. J. Coal Geol. 2016, 159, 135–154. [Google Scholar] [CrossRef]
  20. Sun, J.; Xiao, X.; Wei, Q.; Cheng, P.; Tian, H. Occurrence of Irreducible Water and Its Influences on Gas-Bearing Property of Gas Shales From Shallow Longmaxi Formation in the Xishui Area, Guizhou, Southern China. Front. Earth Sci. 2021, 9, 654136. [Google Scholar] [CrossRef]
  21. Liao, J.; Zhao, N.; Chen, Y.; Tang, H.; Zheng, M.; Wu, W.; Luo, C.; Li, C.; Leng, Y. Constraints of sedimentary structures on key parameters of shale gas reservoirs: A case study of the Wufeng and Longmaxi formations of the Ordovician-Silurian transition in Luzhou block, Sichuan Basin, southwestern China. Geol. J. 2021, 56, 5691–5711. [Google Scholar] [CrossRef]
  22. Zheng, M.; Tang, H.; Li, H.; Zheng, J.; Jing, C. Geomechanical Analysis for Deep Shale Gas Exploration Wells in the NDNR Blocks, Sichuan Basin, Southwest China. Energies 2020, 13, 1117. [Google Scholar] [CrossRef] [Green Version]
  23. Tan, P.; Pang, H.; Zhang, R.; Jin, Y.; Zhou, Y.; Kao, J.; Fan, M. Experimental investigation into hydraulic fracture geometry and proppant migration characteristics for southeastern Sichuan deep shale reservoirs. J. Pet. Sci. Eng. 2020, 184, 106517. [Google Scholar] [CrossRef]
  24. Wang, S.; Dong, D.; Wang, Y.; Li, X.; Huang, J.; Guan, Q. Sedimentary geochemical proxies for paleoenvironment interpretation of organic-rich shale: A case study of the Lower Silurian Longmaxi Formation, Southern Sichuan Basin, China. J. Nat. Gas Sci. Eng. 2016, 28, 691–699. [Google Scholar] [CrossRef]
  25. Zhang, K.; Song, Y.; Jiang, S.; Jiang, Z.; Jia, C.; Huang, Y.; Wen, M.; Liu, W.; Xie, X.; Liu, T.; et al. Mechanism analysis of organic matter enrichment in different sedimentary backgrounds: A case study of the Lower Cambrian and the Upper Ordovician-Lower Silurian, in Yangtze region. Mar. Pet. Geol. 2019, 99, 488–497. [Google Scholar] [CrossRef]
  26. Wang, Y.; Dong, D.; Li, X.; Huang, J.; Wang, S.; Wu, W. Stratigraphic sequence and sedimentary characteristics of Lower Silurian Longmaxi Formation in the Sichuan Basin and its peripheral areas. Nat. Gas Ind. 2015, 35, 12–21. [Google Scholar] [CrossRef] [Green Version]
  27. Ma, X.; Xie, J. The progress and prospects of shale gas exploration and development in southern Sichuan Basin, SW China. Pet. Explor. Dev. 2018, 45, 172–182. [Google Scholar] [CrossRef]
  28. Jiang, Z.; Song, Y.; Tang, X.; Li, Z.; Wang, X.; Wang, G.; Xue, Z.; Li, X.; Zhang, K.; Chang, J.; et al. Controlling factors of marine shale gas differential enrichment in southern China. Pet. Explor. Dev. 2020, 47, 661–673. [Google Scholar] [CrossRef]
  29. Clarkson, C.; Solano, N.; Bustin, R.; Bustin, A.; Chalmers, G.; He, L.; Melnichenko, Y.; Radlinski, A.; Blach, T. Pore structure characterization of North American shale gas reservoirs using USANS/SANS, gas adsorption, and mercury intrusion. Fuel 2013, 103, 606–616. [Google Scholar] [CrossRef]
  30. Tian, H.; Pan, L.; Zhang, T.; Xiao, X.; Meng, Z.; Huang, B. Pore characterization of organic-rich Lower Cambrian shales in Qiannan Depression of Guizhou Province, Southwestern China. Mar. Pet. Geol. 2015, 62, 28–43. [Google Scholar] [CrossRef]
  31. Li, T.; Tian, H.; Xiao, X.; Cheng, P.; Zhou, Q.; Wei, Q. Geochemical characterization and methane adsorption capacity of overmature organic-rich Lower Cambrian shales in northeast Guizhou region, southwest China. Mar. Pet. Geol. 2017, 86, 858–873. [Google Scholar] [CrossRef]
  32. Mohsen, M.; Reza, S.; Peter, R. King Pore level characterization of Micro-CT images using percolation theory. J. Pet. Sci. Eng. 2022, 211, 110113. [Google Scholar]
  33. ASTM D1412–07; Standard Test Method for Equilibrium Moisture of Coal at 96 to 97 Percent Relative Humidity and 30 °C. American Society for Testing and Materials: West Conshohocken, PA, USA, 2010.
  34. Cheng, P.; Xiao, X.; Tian, H.; Wang, X. Water Content and Equilibrium Saturation and Their Influencing Factors of the Lower Paleozoic Overmature Organic-Rich Shales in the Upper Yangtze Region of Southern China. Energy Fuels 2018, 32, 11452–11466. [Google Scholar] [CrossRef]
  35. Bennion, D.; Thomas, F. Formation damage issues impacting the productivity of low permeability, low initial water saturation gas producing formations. J. Energy Res. Technol. 2005, 127, 240–247. [Google Scholar] [CrossRef]
  36. Qian, C.; Li, X.; Shen, W.; Guo, W.; Hu, Y.; Li, Z. Study on the Spontaneous Imbibition Characteristics of the Deep Longmaxi Formation Shales of the Southern Sichuan Basin, China. Geofluids 2021, 2021, 3563095. [Google Scholar] [CrossRef]
  37. Svabova, M.; Vorokhta, M. Water sorption and transport in Silurian shales. J. Petrol. Sci. Eng. 2022, 210, 109980. [Google Scholar] [CrossRef]
  38. Zhou, W.; Xie, S.; Bao, Z.; Carranza, E.; Wang, Y.; Tang, M. Modeling of the Correlation Between Mineral Size and Shale Pore Structure at Meso- and Macroscales. Math. Geosci. 2021, 54, 131–150. [Google Scholar] [CrossRef]
  39. Martyushev, D.A.; Suresh, K.; Li, Y.; Yang, Y. Experimental study of the influence of the content of calcite and dolomite in the rock on the efficiency of acid treatment. J. Pet. Sci. Eng. 2022, 208, 109770. [Google Scholar] [CrossRef]
  40. Chen, Z.; Song, Y.; Li, Z.; Liu, S.; Li, Y.; Liu, G.; Yang, W.; Wang, Q.; Yang, Y.; Gao, F. The occurrence characteristics and removal mechanism of residual water in marine shales: A case study of Wufeng-Longmaxi shale in Changning-Weiyuan area, Sichuan basin. Fuel 2019, 253, 1056–1070. [Google Scholar] [CrossRef]
  41. Cheng, P.; Xiao, X.; Tian, H.; Gai, H.; Zhou, Q.; Li, T.; Fan, Q.Z. Differences in the distribution and occurrence phases of pore water in various nanopores of marine-terrestrial transitional shales in the Yangquan area of the northeast Qinshui Basin, China. Mar. Pet. Geol. 2022, 137, 105510. [Google Scholar] [CrossRef]
  42. Striolo, A.; Naicker, P.; Chialvo, A.; Cummings, P.; Gubbins, K. Simulated water adsorption isotherms in hydrophilic and hydrophobic plunger nanopores. Adsorption 2005, 11, 397–401. [Google Scholar] [CrossRef]
  43. Wu, Y.; Chen, W.; Dai, C.; Huang, Y.; Li, H.; Zhao, M.; He, L.; Jiao, B. Reducing surfactant adsorption on rock by silica nanoparticles for enhanced oil recovery. J. Pet. Sci. Eng. 2017, 153, 283–287. [Google Scholar] [CrossRef]
  44. Chen, G.; Li, C.; Lu, S.; Guo, T.; Wang, M.; Xue, Q.; Zhang, T.; Li, Z.; Sun, Y.; Liu, J.; et al. Critical factors controlling adsorption capacity of shale gas in Wufeng-Longmaxi formation, Sichuan Basin: Evidences from both experiments and molecular simulations. J. Nat. Gas Sci. Eng. 2021, 88, 103774. [Google Scholar] [CrossRef]
  45. Li, J.; Wang, S.; Lu, S.; Zhang, P.; Cai, J.; Zhao, J.; Li, W. Microdistribution and mobility of water in gas shale: A theoretical and experimental study. Mar. Pet. Geol. 2019, 102, 496–507. [Google Scholar] [CrossRef]
  46. Wang, K.; Jiang, B.; Ye, K.; Li, H.; Tan, Y. Spontaneous imbibition model for micro-nano-scale pores in shale gas reservoirs considering gas-water interaction. J. Pet. Sci. Eng. 2022, 209, 109893. [Google Scholar] [CrossRef]
  47. Thommes, M.; Kaneko, K.; Neimark, A.; Olivier, J.; Rodriguez-Reinoso, F.; Rouquerol, J.; Sing, K. Physisorption of gases, with special reference to the evaluation of surface area and pore size distribution (IUPAC Technical Report). Pure Appl. Chem. 2015, 87, 1051–1069. [Google Scholar] [CrossRef] [Green Version]
  48. Bertier, P.; Schweinar, K.; Stanjek, H.; Ghanizadeh, A.; Clarkson, C.; Busch, A.; Kampman, N.; Prinz, D.; Amann-Hildenbrand, A.; Krooss, B.; et al. On the Use and Abuse of N2 Physisorption for the Characterization of the Pore Structure of Shales; The Clay Minerals Society Workshop Lectures Series; The Clay Minerals Society: Atlanta, GA, USA, 2016; Volume 21, pp. 151–161. [Google Scholar]
  49. Lahn, L.; Bertier, P.; Seemann, T.; Stanjek, H. Distribution of sorbed water in the pore network of mudstones assessed from physisorption measurements. Microporous Mesoporous Mater. 2020, 295, 109902. [Google Scholar] [CrossRef]
  50. Tan, Y.; Zhang, S.; Tang, S.; Cui, G.; Ma, Y.; Sun, M.; Pan, Z. Impact of water saturation on gas permeability in shale: Experimental and modelling. J. Nat. Gas Sci. Eng. 2021, 95, 104062. [Google Scholar] [CrossRef]
  51. Xie, J.; Qin, Q.; Fan, C. Influencing Factors of Gas Adsorption Capacity of Marine Organic Shale: A Case Study of Dingshan Area, Southeast Sichuan. J. Coast. Res. 2019, 93, 507–511. [Google Scholar] [CrossRef]
Figure 1. The structural framework of the Luzhou Block and the stratigraphic column of the Upper Ordovician-Lower Silurian strata of the southern Sichuan Basin (modified from (1)).
Energies 15 04053 g001
Figure 2. Mineral compositions of the studied deep shales from the Luzhou Block.
Energies 15 04053 g002
Figure 3. Water adsorption curves of the studied deep shales in the Luzhou Block.
Energies 15 04053 g003
Figure 4. Relationships between pore water contents and TOC (a), clay (b) and brittle mineral (c) contents.
Energies 15 04053 g004
Figure 5. Relationship between water equilibrium extent and TOC (a), clay (b) and brittle mineral (c) contents.
Energies 15 04053 g005aEnergies 15 04053 g005b
Figure 6. Correlations of pore surface area (a,c,e) and volume (b,d,f) with the TOC content of the deep shale samples in the Luzhou Block.
Energies 15 04053 g006aEnergies 15 04053 g006b
Figure 7. Correlations of pore surface area (a,c,e) and volume (b,d,f) with clay content of the deep shale samples in the Luzhou Block.
Energies 15 04053 g007
Figure 8. Correlations of pore water contents with pore structures for the studied deep shale samples in the Luzhou Block. (a) the relationship between water content with micropore surface area; (b) the relationship between water content with micropore volume; (c) the relationship between water content with non-micropore surface area; (d) the relationship between water content with non-micropore surface area.
Energies 15 04053 g008
Figure 9. Relationships between water-occupied pore surface areas (a), volumes (b) and pore water content for the shale samples.
Energies 15 04053 g009
Figure 10. Low-pressure gas adsorption curve (a,b) and pore size distributions (c,d) of typical deep shale samples in the Luzhou Block.
Energies 15 04053 g010aEnergies 15 04053 g010b
Figure 11. Average percentages of the water-occupied pore surfaces and volumes for the deep shales in the Luzhou Block.
Energies 15 04053 g011
Figure 12. Average percentages of water-occupied and effective pore surfaces and volumes for the deep shales in the Luzhou Block.
Energies 15 04053 g012
Table 1. Geological and geochemical characteristics as well as the mineral compositions of the deep shale samples from the Luzhou Block.
SamplesStratumDepth
(m)
Ro
(%)
TOC
(%)
Mineral Composition (%)
Brittle MineralsPyriteClay
QuartzFeldsparCalcite Dolomite IlliteChlorite
Z216-100LMX11-33969.533.53.4627.45.12.46.32.150.46.3
Z216-104LMX11-33972.12-1.644.57.277.73.10.76.80.0
Z216-106LMX11-33973.30-5.6927.75.04.315.32.440.44.8
Z216-109LMX11-33974.803.48.5451.44.820.70.07.313.62.3
Z216-115LMX11-33976.50-5.1343.63.422.91.910.613.52.8
Z216-116LMX11-33976.70-4.6026.24.210.522.83.429.63.3
Z216-118LMX11-33977.62-7.7861.04.021.01.63.87.51.1
Z216-126LMX11-33978.733.43.8422.74.118.30.019.134.11.8
Z216-128LMX11-33979.35-4.9436.30.017.831.11.613.20.0
Z216-132LMX11-33979.773.44.4344.41.921.80.015.714.02.3
Z216-134LMX11-33979.77-2.8353.81.415.82.813.211.51.5
Z216-136LMX11-33980.903.41.3864.80.014.17.81.212.00.0
Table 2. Water-bearing properties of the studied shale samples in the Luzhou Block.
SamplesPore Water Content (CPW, mg/g)Equilibrium Water Content (CEW, mg/g)Pore Water Equilibrium Extent (EPW, %)
Z216-10014.6126.2055.77
Z216-1043.947.3353.76
Z216-10616.6723.4571.08
Z216-1098.3618.6844.77
Z216-1159.4019.6747.78
Z216-1168.3116.8549.31
Z216-1188.3326.8031.08
Z216-1267.0713.7151.60
Z216-1288.1613.5560.20
Z216-1325.9016.5635.65
Z216-1344.6512.2737.88
Z216-1363.827.0154.58
Table 3. Pore structure characteristics of the studied deep shale samples under as-received and dried conditions.
SamplesSurface Area (m2/g)Volume (cm3/g)
As-Received ConditionDried ConditionAs-Received ConditionDried Condition
SmicSnonStotSmicSnonStotVmicVnonVtotVmicVnonVtot
Z216-10016.772.0218.7821.6728.8150.480.00250.00750.01000.00350.02860.0322
Z216-1047.723.1110.838.255.6713.920.00090.01090.01180.00110.01240.0136
Z216-10621.191.7822.9725.9433.0759.020.00330.00710.01040.00430.02710.0314
Z216-10917.094.6821.7619.6219.5339.150.00270.01240.01510.00320.02020.0234
Z216-11518.216.0924.3020.3727.4847.850.00290.01530.01820.00350.02800.0316
Z216-11616.152.4718.6219.2624.1143.370.00260.00770.01030.00320.02230.0254
Z216-11825.949.5135.4527.6736.9864.650.00430.02130.02560.00490.03110.0360
Z216-12614.214.5118.7216.9419.5136.440.00220.01060.01290.00260.01590.0186
Z216-12818.035.8623.8920.8224.5345.350.00310.01040.01350.00340.01590.0193
Z216-13216.576.9923.5619.0424.0243.050.00270.01370.01640.00320.01850.0217
Z216-13411.225.3316.5512.2015.3027.500.00170.01330.01500.00190.01440.0164
Table 4. Water-occupied pore surface areas and volumes of the studied deep shale samples.
SamplesSurface Area (m2/g)Volume (cm3/g)
SmicSnonStotVmicVnonVtot
Z216-1004.9026.8031.690.00110.02110.0222
Z216-1040.532.563.090.00020.00160.0018
Z216-1064.7531.2936.040.00090.02010.0210
Z216-1092.5314.8517.380.00050.00780.0083
Z216-1152.1621.4023.550.00070.01270.0134
Z216-1163.1121.6424.750.00060.01460.0152
Z216-1181.7327.4729.200.00060.00980.0104
Z216-1262.7215.0017.720.00040.00530.0057
Z216-1282.7918.6721.460.00030.00550.0058
Z216-1322.4617.0319.490.00050.00490.0054
Z216-1340.989.9710.950.00020.00110.0014
Table 5. Relative percentages of water-occupied and effective pore surface areas and volumes of the studied deep shale samples in the Luzhou Block.
SamplesWater-Occupied Pore Structures (%)Effective Pore Structures (%)
Surface Area Volume Surface Area Volume
SmicSnonStotVmicVnonVtotSmicSnonStotVmicVnonVtot
Z216-10022.6193.0062.7929.6673.8668.9977.397.0037.2170.3426.1431.01
Z216-1046.3945.2322.2118.4212.5513.0493.6154.7777.7981.5887.4586.96
Z216-10618.3294.6161.0721.6573.9366.8581.685.3938.9378.3526.0733.15
Z216-10912.9076.0544.4114.3838.7335.4087.1023.9555.5985.6361.2764.60
Z216-11510.5877.8649.2218.3645.4342.4089.4222.1450.7881.6454.5757.60
Z216-11616.1489.7557.0619.0565.3859.6483.8610.2542.9480.9534.6240.36
Z216-1186.2574.2845.1611.9931.5628.8993.7525.7254.8488.0168.4471.11
Z216-12616.0776.9148.6314.8333.4030.7783.9323.0951.3785.1766.6069.23
Z216-12813.3976.1147.329.4434.4630.0786.6123.8952.6890.5665.5469.93
Z216-13212.9370.8945.2715.9426.2824.7687.0729.1154.7384.0673.7275.24
Z216-1348.0265.1539.8111.987.898.3791.9834.8560.1988.0292.1191.63
Publisher’s Note: MDPI stays neutral with regard to jurisdictional claims in published maps and institutional affiliations.

