Abstract
Climate change is one of the biggest environmental, political, economic, technological, and social challenges of the 21st century. Due to ever-increasing fossil fuels costs. The world energy system should be transitioned to renewable energy sources to mitigate greenhouse gas emissions. Solar energy is one of the suitable alternatives to fossil fuel usage. Currently, the most widely available solar technologies are solar photovoltaic (PV) and solar thermal. The integration of these two techniques enables the exploitation of the most significant amount of solar radiation. This combination has led to a hybrid photovoltaic/thermal system (PV/T). Concentrated solar radiation on PV cells, known as concentrated photovoltaic (CPV), effectively decreases PV receivers’ area and harnesses the same quantity of solar radiation. However, the main problem with CPV is the elevated PV surface temperature, which often requires active cooling. This issue can be solved by introducing a Concentrating Photovoltaic Thermal (CPVT) system. In this article, a new CPVT hybrid system based on Point Focus Fresnel Lens (PFFL) and embedded Multi Junction Photovoltaic (MJPV) (GaInP/InGaAs/Ge) cells has been experimentally investigated and numerically modelled under indoor conditions. Experiments and simulations were carried out at different heat transfer fluid (HTF) flow rates and under constant irradiation emitted from a sun simulator. The results indicate that the thermal and electrical performance of the CPVT system improves under the testing conditions, where the total efficiency was 68.7% and 73.5% for the experimental and CFD models, respectively. At the same time, the highest thermal efficiency of the experimental and CFD models was 49.5% and 55.4%, respectively. In contrast, the highest electrical efficiency was 36.5% and 37.1%. Therefore, the CPVT system has an excellent possibility of being competitive with conventional power generation systems.
1. Introduction
As energy costs continue rising worldwide, efforts are being put into seeking alternative technologies to meet increasing energy demands. The amount of solar energy that hits the Earth’s surface in four hours is estimated to be greater than the amount of energy consumed by the entire Earth’s population in one year [1]. Therefore, solar energy is an excellent alternative energy source. However, solar energy still faces several hurdles before replacing fossil fuels for power generation. The most significant drawback of solar energy is its low energy density. As a result, solar energy penetration technology is continuously developed to increase the efficiency of equipment converting sunlight into usable energy. Solar photovoltaic (PV) and solar thermal are currently the most commonly available solar technologies whereas in PV technology, solar radiation is converted directly into electrical power. With solar thermal technology, thermal power can be generated from dissipative heat from solar radiation and utilized in practical applications. One of the methods to achieve better overall efficiency is to use the co-generation principle, where waste heat is captured and used as an additional energy product. Integrating these two techniques enables exploitation of the most significant amount of solar radiation. This combination has led to a hybrid system called the Photovoltaic/Thermal system (PV/T), which includes a heat exchanger or flow channel underneath the PV cells to collect heat dissipated from the cells.
However, the major challenge of PV/T technology is generating heat at a relatively low operating temperature and managing the high cost of PV cells. Further, as the temperature of PV cells rises, their conversion efficiency decreases [2]; keeping the PV surface at a low temperature is imperative. To increase productive energy, large areas of conventional PV arrays are required. PV panels for wide-ranging energy generation are expensive and have long payback periods. Concentrated solar radiation on PV cells is an effective method to decrease PV receivers’ area and harness the same quantity of solar radiation; this technology is known as a CPV. These CPV systems replace expensive PV cells with inexpensive concentrator optics, which is their main advantage. The main problem with CPV is the increased PV surface temperature caused by concentrated solar radiation, which often requires active cooling. In addition to the issue of the limited amount of thermal energy generated. We can address these issues by implementing the concept of a CPVT system, which harvests and converts the excess heat produced in PV cells into thermal energy. Thereby, the PV cells are maintained at a moderate temperature.
CPV systems commonly consist of multi-junction photovoltaic cells (MJPV), also known as a tandem, consisting of multiple material layers, usually triple, stacked on top of one another. Gallium indium phosphide (GaInP), Indium gallium arsenide (InGaAs), and germanium (Ge) are used, for example. These semiconductors utilize a different wavelength range of the solar spectrum to generate electricity [3]. To stack the layers, the materials with the largest bandgap are put on top and the materials with the smallest bandgap are at the bottom. In this configuration, the photons with the shortest wavelength are absorbed first, while those with the longest wavelength are absorbed last [4].
Each layer of the MJPV absorbs a part of the solar spectrum from its bandgap energy up to the following layer. Since each layer has a narrow absorption range, extra electrical power rather than heat will be produced. Therefore, MJPV cells are naturally prepared for concentrating systems such as a CPVT hybrid system and can operate at different concentration ratios [5,6]. In addition, MJPV considers the third generation of solar cells, which have a high electrical conversion efficiency even at a high concentration ratio. The advancement in MJPV over the last 30 years has been remarkable. The efficiency of MJPV cells, has increased by more than 200% since 1988. The Fraunhofer Institute for Solar Energy Systems set the record for MJPV efficiency in 2013 and 2014, where 44.7% and 46% have been recorded for a quadruple-layers cell [7,8]. Compared with the other PV cell technologies, MJPV cells have achieved much higher efficiencies than any other approach. For instance, the highest independently certified efficiencies for MJPV solar cells have improved from 29.1% in 2018 to the latest confirmed efficiency record of 47.1% in 2020 [9]. Due to the lack of manufacturers in this area, MJPV solar cells are currently more expensive than single-junction PV cells. The cost of these cells is expected to decrease as the technology matures and production capacity increases. These cells would become more economically competitive [4].
The CPVT system is considered a relatively complicated system. Despite enormous research, this system has no precise classification. Sharaf and Orhan [10] classified CPVT into three distinct types: CPVT-focused, system integration-focused, and component improvement-focused, as shown in Figure 1. We can also see from Figure 1, that the CPVT system has been divided into high concentration and low concentration. The high-concentration CPVT systems are divided into linear-focus and point-focus according to their concentration shape. The system could be based on linear Fresnel reflectors, linear Fresnel lenses, or parabolic trough collectors in the linear focus. While in point-focus, the system could be based on parabolic dish collector, heliostat field central receiver or point focus Fresnel lenses. Concentration Photovoltaic Thermal CPVT systems with a point focus will be studied in the current research.
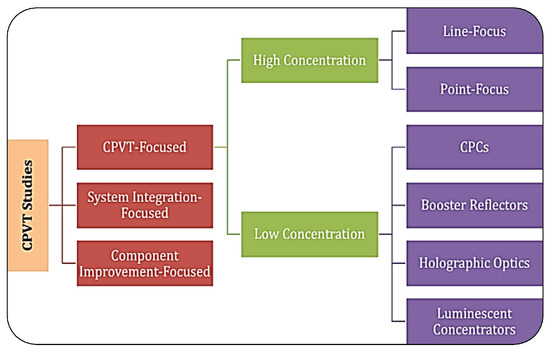
Figure 1.
Shows the classification of the CPVT hybrid system [10].
Furthermore, in CPVT systems, the concentration ratio is a significant parameter, and the review of previous studies demonstrates no specific definition of the concentration ratio. However, the concentration ratio is often classified into two categories. The first is the geometric concentration ratio, defined as the entrance aperture (area of the primary lens) divided by the exit aperture (receiver area). The second is the intensity of concentration (suns), defined as the ratio of the average intensity of the concentrated light on the active cell area divided by peak solar irradiance that is usually set at 1000 W/m2. Besides that, Katie et al. [11] mentioned in their study that the concentration ratio can be divided into four categories; low concentration (<10 suns), medium (10–100 suns), high (100–2000 suns), and ultrahigh (>2000 suns).
The first CPVT prototype was produced at Sandia National Laboratories. This early work described and attempted to solve most of the problems associated with concentration systems, and many of them were satisfactorily answered [12]. Several CPVTs have been designed and constructed for numerical and experimental research. The results reveal that they have high electrical and thermal performance. Kandilli, for example, found that the overall efficiency of these systems is 65.1 percent [13]. Moreover, Zhao et al. illustrated that the outlet temperature of the medium fluid reached 200 °C [14].
Furthermore, an excellent review of CPVT systems has been conducted by Sharaf and Orhan [10,15]. Their study focused on the design considerations and the characteristics of CPVTs and reviewed the crucial elements that compose a CPVT. Moreover, the geometrical parameters of different concentrators were investigated to achieve uniform illumination on PV panels. The experimental results showed that the linear Fresnel reflector could harvest more energy, with thermal energy and overall efficiency improved by 16 and 17.5 percent, respectively [16]. However, a comparative study between line-focus and point-focus Fresnel lenses as solar concentrating systems indicated that the thermal performance of the point-focus Fresnel lens is slightly better than the line-focus [17]. Besides that, there has been a significant increase in the number of CPVT-published research over the past 10–15 years [18,19]. Design considerations and theoretical and experimental investigations have been carried out throughout these studies. The results from these studies illustrate that hybrid CPVT systems have unique merits to penetrate the energy market. Daneshazarian et al. also reviewed of CPVT technology which included the basic concepts, design, and investigation of CPVT solar collectors. In their study, CPVT collectors were divided into system elements to illustrate the subsystems’ functionality and roles in the overall system performance [20]. Alzahrani et al. highlighted the influence of increasing the concentration ratio and the temperature on CPVT components in terms of MJPV and optical concentrator materials. Also, they discussed optical, thermal, and economic implications. The results showed that higher concentration ratios increased the temperature at which the CPVT system’s operation, performance, and reliability were affected [21]. According to the performance of the CPVT, the cost and payback period are concise. For example, the cost of electricity in a CPVT collector is 2.37 $/W [22], and total electrical and thermal expenses are 8.7 $/W [23]. Further, to estimate the energy costs of the CPV/T system, levelized costs of energy (LCOE) were conducted. The direct cost of the CPV/T system includes the PV cells, concentrators, heat exchanger, pump, pipes, HTF, etc. The results revealed that for an installed capacity of 30 MW and 120 MW, the values of LCOE are 0.043 $/kWh and 0.016 $/kWh, respectively [24].
According to the literature review, although many studies on the CPVT model have been conducted, the CPVT system is based on a point-focus Fresnel lens, MJPV cells, heat sink, and active cooling, which are still not mature. More research, investigation, and development work related to these design considerations are still necessary.
The present study focused on experimental investigations and numerical modelling of a CPVT system based on a point-focus Fresnel lens concentrator equipped with a high-efficiency GaInP/InGaAs/Ge triple-junction solar cell, a copper heat sink, and an absorber tube as an active cooling system. An experimental investigation was conducted to calculate the thermal and electrical performance of the CPVT system. Furthermore, a three-dimensional CFD model using Ansys code was developed to analyze the heat transfer during the CPVT model at various HTF flow rates and incidence irradiance. The results from the CFD model were compared with experimental results.
2. Experimental Setup
Figure 2 shows a photograph of the experimental setup of the CPVT system, which mainly consists of five parts (1) Sun simulator, which includes a 1000 W halogen lamp. (2) CPVT system including point focus Fresnel lenses, MJPV cell, and heat sink. (3) Flow loop includes a 1/2-inch copper pipe, HTF, circulation pump, and a flow meter to measure the mass flow rate. (4) Heat exchanger and thermal path system to control the inlet HTF temperature. (5) Data-collection system including data acquisition, an ammeter, a multi-meter, and a solar meter.
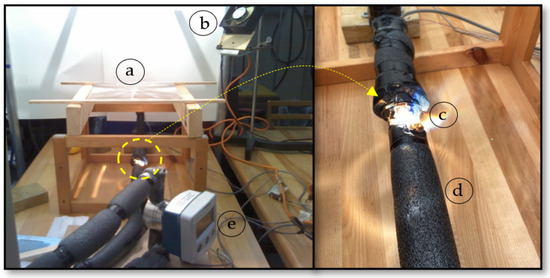
Figure 2.
Photograph of the experiment test section: (a) Fresnel lens; (b) cooling fan; (c) MJPV; (d) pipe and insulator; (e) flowmeter.
Nine T-type thermocouples were installed at several locations to measure the ambient, MJPV cell surface, heat sink surface, and HTF inlet and outlet temperatures. Besides that, the MJPV cell has been pasted onto a copper heat sink designed and manufactured specifically for this experiment using OB-101 Epoxy adhesive (high thermally conductive & high electrical insulation) glue. The heat sink has been fixed on a 1/2-inch copper pipe. The solar cell aligns against their respective Fresnel lens in the focal length. The area of the Fresnel lens is 280 × 280 mm2, and the size of the solar cell is 10 × 10 mm2, which means the geometric concentrating ratio of the CPVT system will be 784x. Moreover, the test section was fully automated through a PC using a data acquisition system (DAQ). Before taking any measurements in these experiments, a benchmarked test has been done for all equipment to ensure it is appropriately functional.
3. Thermal and Electrical Analysis
In this research, we used a FULLSUNS Triple-Junction Photovoltaic solar cell made of GaInP/InGaAs/Ge with an area of 100 mm2. Under measurement conditions, cell temperature of 25 °C and air mass AM of 1.5; the typical electrical efficiency is 41.15% and 40.34% at a concentration ratio of 500× and 1000×, respectively [25]. Furthermore, we considered several assumptions to evaluate the CPVT system’s performance and simplify the thermal analysis. The made assumptions for thermal and electrical analysis are as follows:
- Materials properties of MJPV are homogeneous and isotropic.
- Flow within the copper pipe is considered incompressible and uniform.
- The system is well insulated; therefore, the thermal losses will be negligible.
- The thermal properties of the HTF are constant.
- Fresnel lenses are free from manufacturing errors.
- Neglect dust or any other agent deposited on the CPVT system.
- The temperature gradients between cells and their substrates are negligible.
- The radiation concentrated uniformly along the area of the MJPV cells.
- The internal reflections within the transparent layers of the MJPV were neglected.
Figure 3, shows the energy balance through the CPVT system. As we can see, part of the total incident energy (qirr) on the MJPV solar cell is lost as optical losses (Qopt), while the remaining (Qin) is converted into two forms. The first portion is converted to electrical power (Pele), while the remaining is converted into heat (Qheat). A portion of this heat (Qth) is transferred to the water by convection, while the rest (Qloss) is transferred to the ambient by convection and radiation.
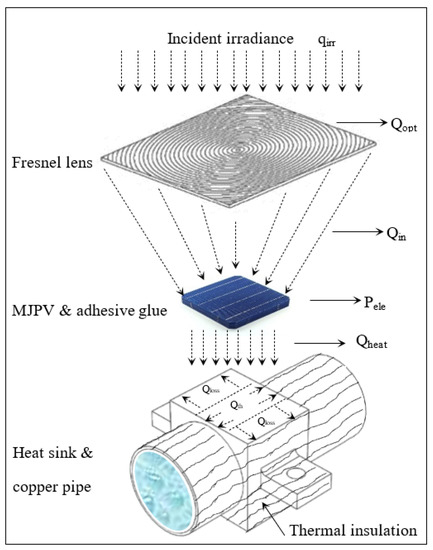
Figure 3.
A schematic diagram and the heat balance of a part of the CPVT model.
The geometrical concentration ratio of the CPVT system is calculated as follows [26]:
where is the Fresnel lens area, and is the solar cell area, and the maximum concentration ratio of the CPVT system can be calculated as [27]:
is the optical efficiency of the concentrator system, and it is typically around 80–90% [11]. The solar radiation flux , which reaches the MJPV cell, can be evaluated from the following relation:
where is the solar radiation flux emitted from the sun simulator measured above the Fresnel lens in (W/m2). The solar radiation flux received by the MJPV cell is converted into electrical power and heat. The electrical power can be determined as follows:
while the following equation can be used to calculate the amount of energy that converts to heat [28]:
where is the cell’s electrical efficiency of the MJPV and can be calculated as follows [29]:
where is the cell’s electrical efficiency at the solar cell reference temperature , which is equal to the ambient temperature of 25 ℃, is the solar cell temperature, and the is the temperature coefficient of the MJPV solar cell. The values of , are usually provided by the solar cell manufacturer. Also, the relation between the MJPV solar cells’ electrical efficiency and cell temperature and concentration ratio was expressed from experimental data. Compared to other equations, this experimental correlation gives ultra-high electrical efficiency values [19,30].
The thermal energy absorbed by HTF is expressed as:
where , , , and are mass flow rate, specific heat, inlet, and outlet temperatures of the HTF, respectively. Hence, the thermal efficiency can be determined as follows:
The electrical parameters of the solar cell are open-circuit voltage , short circuit current , current at maximum power , the voltage at maximum power , maximum power , theoretical maximum power , and fill factor FF. These electrical parameters are important to characterize the electrical performance of the solar cell. The maximum power produced by the solar cell exposed to the solar radiation flux can be determined as follows:
The theoretical maximum power can be determined as follows:
The ratio of the actual rated maximum power to the theoretical maximum power is known as the “Fill Factor” and can be calculated using the following equation:
The electrical efficiency of the system can be calculated as follows:
The overall efficiency of the CPVT system can be calculated using the following equation:
4. Theory and Governing Equations
The proposed model’s heat transfer characteristic and thermal performance analysis are based on an energy balance around the CPVT components. The energy balance includes the incident solar radiation, optical losses from the Fresnel lens, thermal losses from the CPVT, and the heat flow into the HTF. Figure 4 shows a side view of the one-dimensional steady-state energy balance for a cross-section of the CPVT model. Three heat transfer mechanisms exist: conduction, convection, and thermal radiation. Further, a part of this heat is transferred within the multi-junction solar cell solid layers by conduction. The remaining parts of the heat are lost to the surrounding environment by convection and radiation. As stated by Chou et al. [28], in the structure of the MJPV, the top (GaInP) and middle (InGaAs) subcells are much thinner than the bottom (Ge) substrate. Moreover, the (Ge) layer absorbs long-wavelength photons (870–1950 nm) and usually absorbs the most received irradiation. Therefore, the MJPV solar cell can be modelled as one homogeneous Germanium cell (Ge), and they would not influence the junction temperature. The thermal resistance diagram corresponding to the CPVT assembly layers is shown in Figure 5.
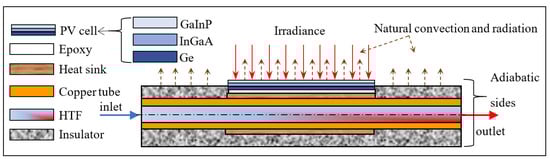
Figure 4.
Schematic description of CPVT assembly layers.
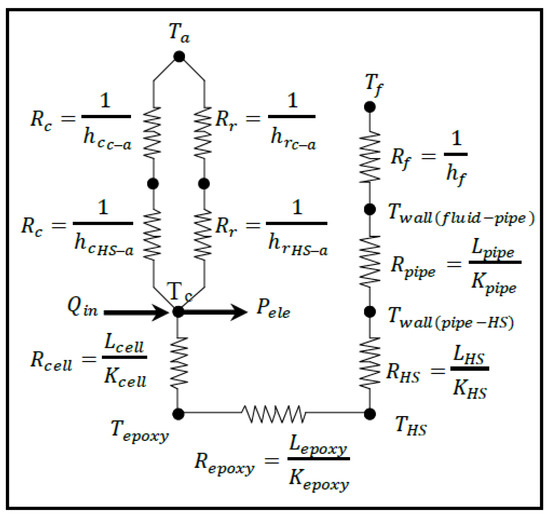
Figure 5.
Thermal resistance diagram corresponding to the CPVT assembly layers.
The steady-state heat conduction within the MJPV assembly to the top surface of the copper pipe is defined by Fourier’s law as follows:
where is the conduction heat transfer rate, is the layer area, is the thermal conductivity of the material of the layer, and is the temperature gradient. The solar energy converted to heat will be collected from the CPVT assembly by HTF or dissipated to the environment by convection and radiation.
The heat which is transferred by natural convection is described by [28,31]:
where is the natural convection heat transfer rate, is the natural convection heat transfer coefficient, and is the temperature difference between the surface and the ambient. Since the MJPV is placed in a horizontal position, it can be considered a horizontal heated upward-facing plate with uniform heat flux. The concentrated light heats the fluid near the top surface of the MJPV. Consequently, a natural convection is created. Therefore, the heat transfer by natural convection from the upper surface of the MJPV is correlated for (1 < Ra < 1010) by the equations presented below [32]:
where is the average “thin-layer-solution” Nusselt number for laminar flow. is the average Nusselt number taken over MJPV, assuming the laminar heat transfer is dominated. is the average Nusselt number taken over MJPV, assuming turbulent heat transfer is dominated, and is an approximately universal function of Prandtl numbers and have the values 0.515, 0.14 respectively [32]. The natural convection heat transfer coefficient can be expressed as follows:
where is the thermal conductivity of the air, and is the characteristic length defined as where , and are the surface area and the perimeter of the MJPV, respectively, and is the Rayleigh number, which is defined as follow:
where is the coefficient of volumetric thermal expansion, is the thermal diffusivity, is the kinematic viscosity, and is the gravitational acceleration.
The radiation heat transfer can be calculated from the following relations:
where is the radiation heat-transfer rate, ɛ is the emissivity of the solar cell material, is the Stefan Boltzmann constant, is the surface temperature, and is the ambient temperature.
5. Numerical Analysis
A numerical model was developed to investigate the heat transfer mechanism and the thermal performance of the CPVT system; these include the heat transfer from the MJPV to the HTF and the total heat losses to the surrounding. The simulation was performed using the computational fluid dynamic technique (CFD) in the Ansys Fluent 19.0. A three-dimensional CPVT model was designed using Ansys Design Modeller, as shown in Figure 6. The CPVT model consists of a single MJPV solar cell, a copper heat sink, and a 1/2-inch copper pipe. Unlike the experimental model, in the numerical model, the thermal resistance of the epoxy resin layer has been neglected since it is very thin and has high thermal conductivity.
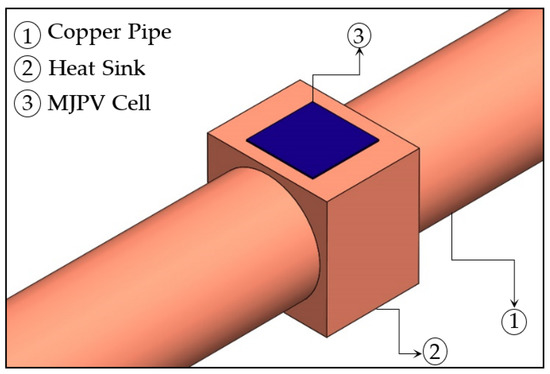
Figure 6.
Isometric view of the CPVT model in ANSYS Design Modeler.
Further, the model’s dimensions were chosen based on the actual geometry of the experimental model. The numerical simulation is performed by applying the Ansys Fluent solver, which uses the Finite Volume Method (FVM) to discretize the governing equations of continuity, momentum, and energy [27,28].
The flow of HTF inside the CPVT model was assumed to be incompressible and steady-state. Therefore, the continuity equation is given as:
where is the density of HTF, and , , and denote to HTF velocity in , , and directions.
The momentum equations in the x, y, and z directions for steady and laminar flow, which are also called Naiver Stokes equations and are expressed as:
where , is the pressure on the HTF element, , , and are the shear force, and , and are the gravitational forces in x, y, z directions. The energy balance equation is given as:
where is the specific heat, is the temperature, is thermal conductivity of the HTF, and is the heat source (i.e., solar radiation flux that reaches the MJPV cell).
5.1. Mesh of the CPVT Model
A hybrid unstructured tetrahedral and hexahedral mesh was employed in this simulation. The meshing has been done using the Ansys Fluent Meshing tool to generate small elements to solve flow and energy equations for the CPVT model computationally. The quality of the mesh plays a vital role in the stability and accuracy of the numerical results. Generating a low-quality mesh might lead to numerical diffusion and inaccurate results. In Ansys Fluent, checking the mesh’s quality is a significant step in implementing a robust simulation. Several mesh quality metrics for quantifying the quality include skewness, orthogonal quality, and aspect ratio. The skewness shows the perfectness of cells in terms of their angles. The skewness quality spans from 0 to 1, where the skewness quality of zero is the highest-meshed cell quality, and one indicates poor quality cells. Also, orthogonal quality ranges between 0 and 1, but unlike skewness, where values close to one correspond to high-quality meshed cells, whereas those close to zero are the worst quality [33].
Further, the aspect ratio represents the balance of the cells’ sides. To achieve an excellent overall mesh quality, it should be less than 100. Figure 7a illustrates the meshed CPVT model’s side view and isometric view. The mesh nodes were more than 1.3 million, whereas the mesh elements exceeded 2.0 million and the measured mesh qualities for the skewness, orthogonal quality and aspect ratio were 0.13, 0.86, and 26.87, respectively. Besides that, Figure 7 displays the mesh metrics graphs for the skewness (Figure 7b), and orthogonal quality (Figure 7c).
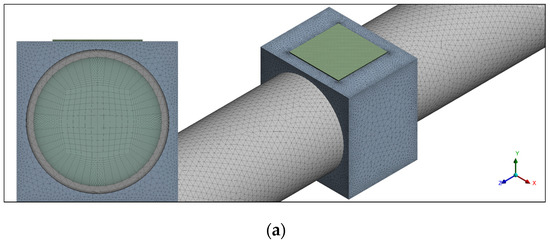
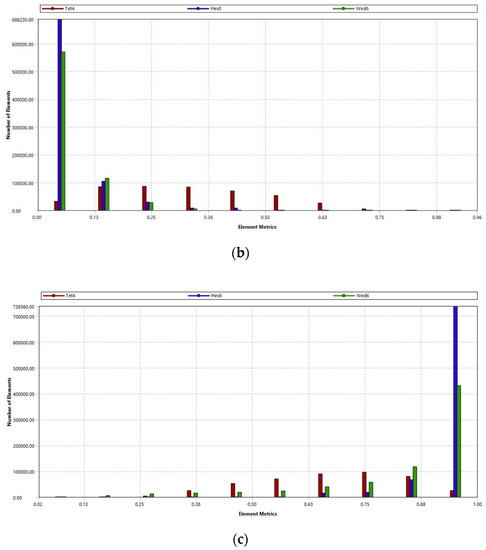
Figure 7.
Mesh of the CPVT model: (a) side view and isometric view of the meshed model; (b) the skewness; (c) orthogonal quality.
5.2. Mesh Independency Study
Six mesh independence tests have been conducted to obtain mesh-independent solutions and sustain credible results. The objective of these tests is to eliminate the influence of discretization, rounding, and iterative errors. The number of mesh elements ranges from 0.6 to 3.0 million, and the study was undertaken in terms of cell temperature and HTF outlet temperature. As shown in Figure 8, both cell temperature and HTF outlet temperature do not vary significantly with increasing the grid elements further. With these results, the number of mesh elements used in this study is sufficient for accuracy and simulation run time.
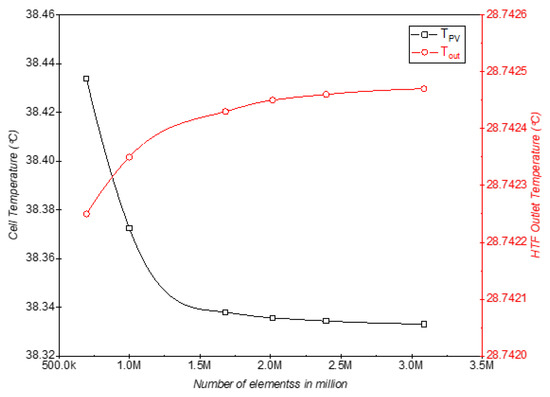
Figure 8.
Mesh independence study for solar cell temperature, and HTF outlet temperature.
5.3. Numerical Implementation
The meshed CPVT model was loaded into Ansys Fluent to solve the governing equations and show the actual physical heat and flow domain solutions. The computational domain was divided into several discrete control volumes and integrated into the differential governing equations to create algebraic equations for the dependent variables such as temperature, velocity, and pressure. Further, the double-precision option has been activated to obtain accurate results. The energy and laminar flow models are used for this simulation. The pressure-based type, absolute velocity formulation, and steady time solvers are default values [34]. The gravitational effect has been selected according to the HTF flow direction and geometry design of the CPVT model.
For the materials settings, water, copper, and MJPV were used, and their properties are presented in Table 1. The mass flow rate and the inlet temperature of the HTF were set up as input parameters, and their values have been imported from the experimental data. Constant heat flux was applied on the top surface of the MJPV. Its value was calculated based on the measured solar radiation flux emitted from the sun simulator, concentration ratio, optical efficiency of the Fresnel lens, and the solar cell area.

Table 1.
Materials properties for the CPVT simulation.
Notably, the boundary condition of all outer surfaces in contact with the surroundings was assumed to be adiabatic (fully insulated), i.e., zero heat flux, except the upper surface of the heat sink and MJPV.
The solution method incorporated the pressure-velocity coupling scheme using the SIMPLEC algorithm. For spatial discretization, a second-order discretization was utilized to obtain accurate results. Therefore, the second-order scheme was employed to spatially discretize the pressure, whereas the second-order upwind scheme was applied to discretize the momentum and energy. Besides, to control the solution variables, under-relaxation factors were used, and all default values were set as optimum values. The residuals of all variables have been monitored to ensure a convergent solution. The residuals of continuity, x-velocity, y-velocity, z-velocity, and energy are set to 1 × 10⁻³, 1 × 10⁻⁶, 1 × 10⁻⁶, 1 × 10⁻⁵, and 1 × 10⁻⁸ respectively. Further, before starting the calculations, standard initialization has to be applied to implement initial values of all variables in all cells of the domain.
6. Results and Discussion
The present study focused on experimental investigation and numerical modelling for a CPVT system based on a point-focus Fresnel lens concentrator, a single cell MJPV, a copper heat sink, and a copper pipe. The most common approach to evaluate the electrical characteristics of a CPVT system is to find its response curves, which provide short-circuit current Isc, open-circuit voltage Voc, and maximum power output. These responses are known as the I-V and P-V curves. In this regard, a mathematical I–V and P–V curve model was developed to calculate the current and voltage of the MJPV at different concentration ratios at the standard MJPV surface temperature. Therefore, the model is validated by comparing the results with indoor experimental data from manufacturers. Figure 9 shows the I-V curve created by the mathematical model compared to the manufacturer’s experimental data at an MJPV surface temperature of 25 °C and different concentration ratios.
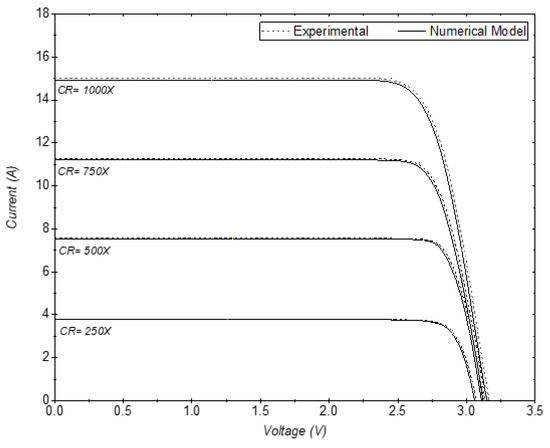
Figure 9.
Verification of the mathematical model results with the datasheet of I-V characteristics in different concentration ratios for FULLSUNS Triple-Junction Photovoltaic solar cell.
It is observed that the changes in Isc with radiation are more significant than the changes in the Voc. However, both changes increase with the incident radiation. The Isc increased by almost triples due to the increased CR from 250× to 1000×. Moreover, it can be noticed that the MJPV model simulation results of the I-V curve are a good match with the experimental data from the manufacturer, where the maximum percent error is less than 2%. Figure 10 shows the P-V curve generated by the developed electrical model under the same conditions. Figure 10 indicated that the higher concentration ratio would positively influence the solar cell output power.
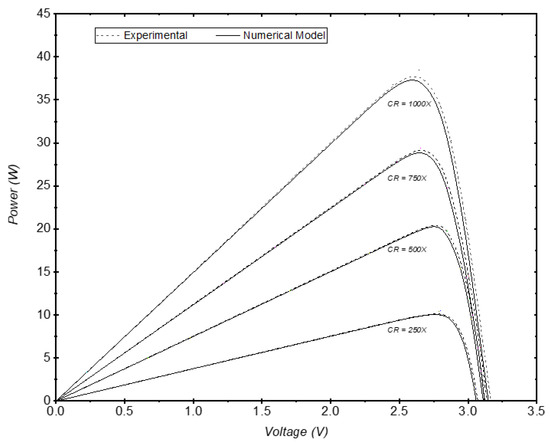
Figure 10.
Verification of the mathematical model results with the datasheet of P-V characteristics in different concentration ratios for FULLSUNS Triple-Junction Photovoltaic solar cell.
Moreover, the influence of mass flow rate, the temperature difference between inlet and outlet of HTF, and concentrated solar radiation on thermal and electrical efficiency has been studied experimentally and numerically in this paper. A variety of mass flow rates have been chosen according to the used OMEGA flowmeter range. The solar radiation emitted from the sun simulator has been measured on the Fresnel lens using a TES 1333 Solar Power Meter, which reads 783.7 w/m2. These experimental measurements, such as mass flow rates, the inlet temperature of the HTF, incident solar radiation, and ambient temperature, have been exported to the CFD model to ensure the comparison of the results will be conducted under the same conditions.
Figure 11 shows the effect of varying the mass flow rate of HTF on the temperature difference between the inlet and outlet of HTF. The temperature difference decreases as the mass flow rate of HTF increases. The results revealed a slight discrepancy between the experimental and simulation results attributed to the heat losses associated with the experimental model. Further, Figure 12 illustrates the electrical and thermal efficiencies changes with the mass flow rates. Based on Figure 12, as the mass flow rate increased, both electrical and thermal efficiencies increased. The highest thermal efficiencies of the experimental and CFD models were 49.5% and 55.4%, respectively, with an error percent of 10.65%. In contrast, the highest electrical efficiencies were 36.5% and 37.1%, respectively, with an error percent of 1.35%. Also, Figure 12 displays the total thermal and electrical efficiencies of the experimental and CFD models, which amounted to 68.7% and 73.5%, respectively.
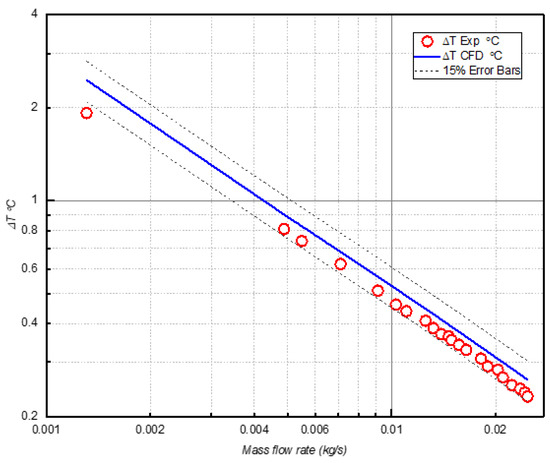
Figure 11.
The temperature difference between the outlet and inlet of the HTF at different mass flow rates.
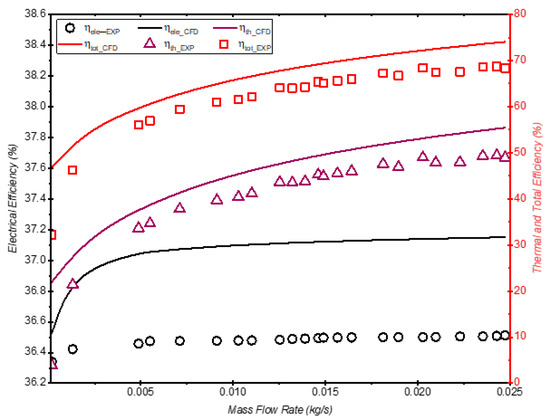
Figure 12.
Comparison of thermal, electrical, and total efficiency at different mass flow rates.
Figure 11 and Figure 12 demonstrate that, as the mass flow rate of HTF increases, the temperature difference decreases while the thermal efficiency increases. This is due to the influence of the mass flow rate of HTF, which overrides the effect of the temperature difference.
Figure 13 represents the variations in the cell temperature with various mass flow rates as we can see the cell temperature decreases with increased mass flow rates. Also, Figure 13 shows that the cell temperature directly impacts electrical efficiency; this effect corresponds to what was mentioned earlier. In the exact figure, we can also see that the thermal efficiency increased as the mass flow rate increased. The thermal efficiency increases dramatically at a low mass flow rate, while the efficiency curve increases slightly at a high mass flow rate. The reason is that the heat exchange time between the HTF, wall pipe, heat sink, and MJPV is too short at a high mass flow rate. Consequently, the difference between the inlet and outlet temperatures would be small.
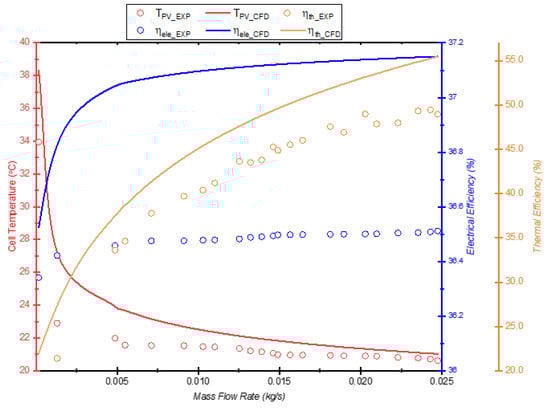
Figure 13.
Changes in MJPV temperature, thermal efficiency, and electrical efficiency at different mass flow rates.
In addition, the effect of the internal heat transfer coefficient has been studied in this paper. The internal heat transfer coefficient plays a vital role in the CPVT system since it influences thermal and electrical performance. A higher heat transfer coefficient enhances the thermal energy of the CPVT system, reduces the solar cell temperature, and improves electrical efficiency. Many design parameters affect the heat transfer coefficient, such as flow conditions, pipe diameter, thickness and thermal conductivity of the individual layers in the CPVT, and solar radiation intensity. Figure 14 demonstrates the change in the heat transfer coefficient with a variety of Reynolds numbers in the laminar regime. As the Reynolds number increased, the heat transfer coefficient increased. The experimental and simulated results for the heat transfer coefficient were well in agreement.
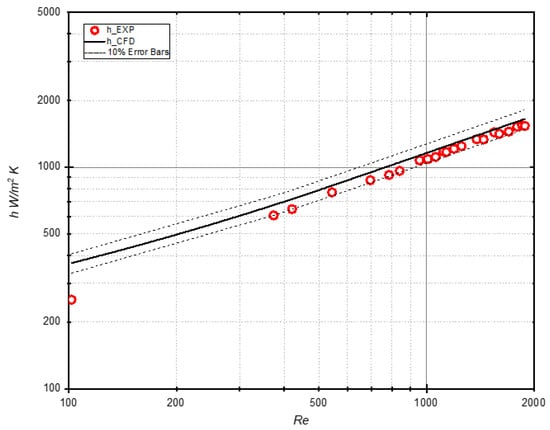
Figure 14.
Heat transfer coefficient versus Reynolds number for pipe flow.
Figure 15 displays 3D surface plots of the average wall temperature along the pipe at different mass flow rates. The highest temperature appeared at low mass flow rates due to HTF having a longer time to absorb the heat from the solar cell via heat sink and pipe thickness layers.
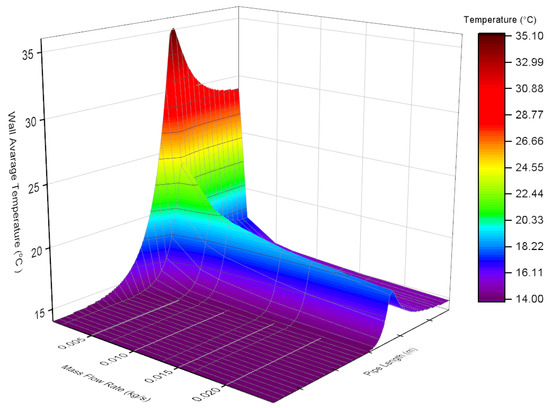
Figure 15.
Average wall temperature along the pipe at different mass flow rates.
Further, in this research, the influence of the mass flow rate on the temperature distribution of the MJPV surface was studied. Figure 16 presents the temperature distribution contours of MJPV at selected flow rates from low, medium, and high. To facilitate the comparison, all temperature contours were plotted in the CFD model at the same specified temperature range. The highest and lowest MJPV temperature was 38.33 ℃ and 21 ℃, respectively. Also, it can be seen that the changes in the MJPV temperature are not significant at high mass flow rates. This is because, at high flow rates, the temperature of MJPV approaches the HTF inlet temperature.
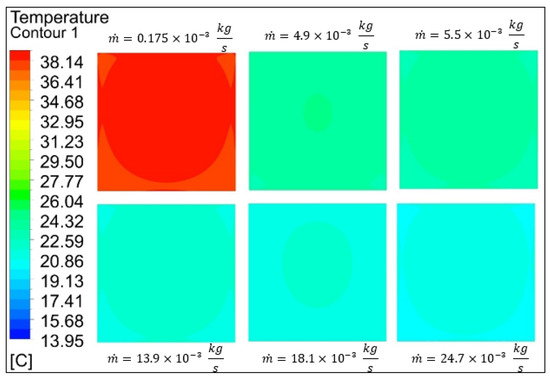
Figure 16.
Temperature distribution on MJPV surface at different mass flow rates.
Besides, Figure 17 shows temperature contours of outlet HTF at selected flow rates from low, medium, and high. All temperature contours have been plotted at the individual local temperature range in the CFD model. The highest and lowest outlet temperature was 28.7 °C and 14.2 °C, respectively, whereas the inlet temperature of HTF was 13.95 °C. Also, it is observed in all contours that the highest temperature distribution is near the wall since the flow regime was laminar.
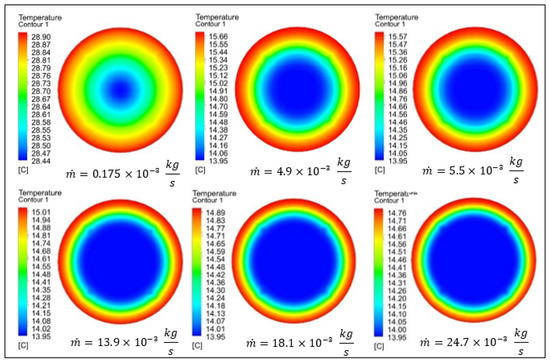
Figure 17.
Outlet temperature distribution contours at different mass flow rates.
To monitor the temperature of MJPV and avoid overheating, a thermal camera has been used. Figure 18 shows an infrared image of the MJPV cell. The temperature distribution over the cell surface is almost homogeneous, and there are no hotspots on the cell surface. Also, the image, indicates that the highest temperature of the solar cell was significantly below the maximum allowable temperature provided by the manufacturer in the datasheet. Consequently, active cooling plays a significant role in keeping the temperature of the MJPV cell low, so it has become necessary in the concentration photovoltaic systems.
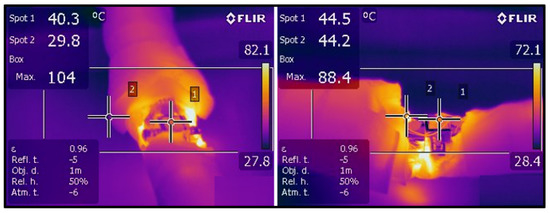
Figure 18.
Infrared image of the used MJPV solar cell.
7. Conclusions
In this research, experimental and CFD analysis allowed for the evaluation of both the thermal and electrical performance of the proposed CPVT model under a variety of parameters such as HTF flow rates, HTF inlet temperature, MJPV cell temperature, incident radiation, concentration ratio, and the optical efficiency of the Fresnel lens. The experimental tests were conducted in laboratory conditions. The experimental measurements were exported to the CFD simulation model to ensure that the results will be compared under the same conditions. The significant findings are summarized below:
- ▪
- The temperature difference decreases as the mass flow rate of HTF increases. The results reveal a slight discrepancy between the experimental and simulation results, which was attributed to the heat losses associated with the experimental model.
- ▪
- It was found that as the mass flow rate increased, both electrical and thermal efficiencies increased. The highest thermal efficiency of the experimental and CFD models was 49.5% and 55.4%, respectively, with an error percent of 10.65%. In contrast, the experimental and CFD models’ highest electrical efficiency was 36.5% and 37.1%, respectively, with an error percent of 1.35%.
- ▪
- The total efficiency was 68.7% and 73.5% for the experimental and CFD models, respectively.
- ▪
- The cell temperature decreases with increased mass flow rates. Also, the results reveal that the cell temperature directly impacts electrical efficiency.
- ▪
- As the Reynolds number increases, the heat transfer coefficient increases.
- ▪
- The study shows the thermal and electrical performance could be a key factor for realizing a more complex prototype of a CPVT system.
- ▪
- A good agreement is found between experimental results and CFD simulation. The CPVT system has an excellent possibility to be competitive with conventional power generation systems.
Author Contributions
Conceptualization, R.A.H.; methodology, R.A.H.; software, R.A.H.; validation, R.A.H.; investigation, R.A.H.; writing—original draft preparation, R.A.H.; writing—review and editing, Y.S.M. and X.D.; supervision, Y.S.M. and X.D.; funding acquisition, Y.S.M. and X.D. All authors have read and agreed to the published version of the manuscript.
Funding
This research was funded by the Natural Sciences and Engineering Research Council of Canada (NSERC) Discovery Grants for the second and third authors. The first author is also funded under the Libyan Ministry of Education grant. The authors would also like to thank the Memorial University Libraries Open Access Author Fund, which assisted with funding this paper.
Institutional Review Board Statement
Not applicable.
Informed Consent Statement
Not applicable.
Acknowledgments
The author would like to acknowledge the support from the Libyan Ministry of Education. Also, the author would like to express his gratitude to Mahmoud Hamoda for helping in calibrating some experimental equipment.
Conflicts of Interest
The authors declare no conflict of interest.
Nomenclature
| approximately universal function of Prandtl number | ||
| m2 | Fresnel lens area | |
| J/kg.K | specific heat | |
| approximately universal function of Prandtl number | ||
| Kg/s | mass flow rate | |
| Average Nusselt number taken over MJPV assuming the laminar heat transfer is dominated | ||
| average “thin-layer-solution” Nusselt number for laminar flow | ||
| average Nusselt number taken over MJPV, assuming turbulent heat transfer is dominated | ||
| W | electrical power | |
| W | conduction heat transfer rate | |
| W | amount of energy that converts to heat | |
| W | solar radiation flux that reaches the MJPV cell | |
| W/m2 | solar radiation flux emitted from the sun simulator measured above the Fresnel lens | |
| W | thermal losses | |
| W | natural convection heat transfer rate | |
| W | radiation heat-transfer rate | |
| W | thermal energy absorbed by HTF | |
| ℃ | solar cell temperature | |
| ℃ | inlet temperatures of the HTF | |
| ℃ | outlet temperatures of the HTF | |
| ℃ | solar cell reference temperature | |
| m2 | layer area | |
| Ac | m2 | solar cell area |
| m/s2 | gravitational acceleration | |
| W/m2.K | natural convection heat transfer coefficient | |
| k | W/m.K | thermal conductivity of the material of Layer |
| Lc | m | characteristic length |
| P | m | perimeter of the MJPV |
| Ra | Rayleigh number | |
| Ta | ℃ | ambient temperature |
| Ts | ℃ | surface temperature |
| Greek letters | ||
| %/K | temperature coefficient of the MJPV solar cell | |
| electrical efficiency of the system | ||
| optical efficiency | ||
| cell’s electrical efficiency at the solar cell reference temperature | ||
| cell’s electrical efficiency | ||
| thermal efficiency | ||
| overall efficiency of the CPVT system | ||
| K/m | temperature gradient | |
| m2/s | thermal diffusivity | |
| K−1 | coefficient of volumetric thermal expansion | |
| ∆T | K | temperature difference between HTF and surface |
| emissivity of the solar cell material | ||
| ρ | Kg/m3 | Density |
| W/m2.K4 | Stefan Boltzmann constant | |
| m2/s | kinematic viscosity | |
| Abbreviations | ||
| CPVT | Concentrating Photovoltaic Thermal | |
| CR | maximum concentration ratio | |
| FVM | Finite Volume Method | |
| GCR | geometrical concentration ratio | |
| HTF | heat transfer fluid | |
| GaInP/InGaAs/Ge | Gallium indium phosphate/Indium gallium arsenide/Germanium | |
| MJPV | Multi Junction Photovoltaic | |
| PFFL | Point Focus Fresnel Lens | |
References
- Sonnenenergie, D.G. Planning and Installing Solar Thermal Systems: A Guide for Installers, Architects, and Engineers, 2nd ed.; Earthscan: London, UK, 2010; ISBN 978-1-84407-760-1. [Google Scholar]
- Skoplaki, E.; Palyvos, J.A. On the Temperature Dependence of Photovoltaic Module Electrical Performance: A Review of Efficiency/Power Correlations. Sol. Energy 2009, 83, 614–624. [Google Scholar] [CrossRef]
- Research Team. Experimental and Theoretical Analysis of Microchannel Cooling for Photovoltaic Solar Cells; National Priority Research Program: Doha, Qatar, 2014; p. 35. [Google Scholar]
- Chen, W.V. InGaAsP/InP Intrastep Quantum Wells for Enhanced Solar Energy Conversio. Ph.D. Thesis, University of California, San Diego, CA, USA, 2012. [Google Scholar]
- King, R.R.; Law, D.C.; Edmondson, K.M.; Fetzer, C.M.; Kinsey, G.S.; Yoon, H.; Sherif, R.A.; Karam, N.H. 40% Efficient Metamorphic GaInP/GaInAs/Ge Multijunction Solar Cells. Appl. Phys. Lett. 2007, 90, 183516. [Google Scholar] [CrossRef] [Green Version]
- Cotal, H.; Fetzer, C.; Boisvert, J.; Kinsey, G.; King, R.; Hebert, P.; Yoon, H.; Karam, N. III–V Multijunction Solar Cells for Concentrating Photovoltaics. Energy Environ. Sci. 2009, 2, 174–192. [Google Scholar] [CrossRef]
- Dimroth, F. World Record Solar Cell with 44.7% Efficiency—Fraunhofer ISE; Fraunhofer Institute for Solar Energy Systems ISE: Freiburg, Germany, 2013. [Google Scholar]
- Dimroth, F. New World Record for Solar Cell Efficiency at 46%—Fraunhofer ISE; Fraunhofer Institute for Solar Energy Systems ISE: Freiburg, Germany, 2014; Volume 4. [Google Scholar]
- NREL Best Research-Cell Efficiency Chart. Available online: https://www.nrel.gov/pv/cell-efficiency.html (accessed on 19 May 2022).
- Sharaf, O.Z.; Orhan, M.F. Concentrated Photovoltaic Thermal (CPVT) Solar Collector Systems: Part II—Implemented Systems, Performance Assessment, and Future Directions. Renew. Sustain. Energy Rev. 2015, 50, 1566–1633. [Google Scholar] [CrossRef]
- Shanks, K.; Senthilarasu, S.; Mallick, T.K. Optics for Concentrating Photovoltaics: Trends, Limits and Opportunities for Materials and Design. Renew. Sustain. Energy Rev. 2016, 60, 394–407. [Google Scholar] [CrossRef] [Green Version]
- Past Experiences and New Challenges of PV Concentrators. In Concentrator Photovoltaics; Luque, A.L.; Viacheslav, A. (Eds.) Springer Series in Optical Sciences; Springer: Berlin/Heidelberg, Germany, 2007; Volume 130, pp. 1–23. ISBN 978-3-540-68798-6. [Google Scholar]
- Kandilli, C. Performance Analysis of a Novel Concentrating Photovoltaic Combined System. Energy Convers. Manag. 2013, 67, 186–196. [Google Scholar] [CrossRef]
- Zhao, J.; Song, Y.; Lam, W.-H.; Liu, W.; Liu, Y.; Zhang, Y.; Wang, D. Solar Radiation Transfer and Performance Analysis of an Optimum Photovoltaic/Thermal System. Energy Convers. Manag. 2011, 52, 1343–1353. [Google Scholar] [CrossRef]
- Sharaf, O.Z.; Orhan, M.F. Concentrated Photovoltaic Thermal (CPVT) Solar Collector Systems: Part I—Fundamentals, Design Considerations and Current Technologies. Renew. Sustain. Energy Rev. 2015, 50, 1500–1565. [Google Scholar] [CrossRef]
- Amanlou, Y.; Hashjin, T.T.; Ghobadian, B.; Najafi, G.; Mamat, R. A Comprehensive Review of Uniform Solar Illumination at Low Concentration Photovoltaic (LCPV) Systems. Renew. Sustain. Energy Rev. 2016, 60, 1430–1441. [Google Scholar] [CrossRef]
- Imtiaz Hussain, M.; Lee, G.H. Thermal Performance Comparison of Line- and Point-Focus Solar Concentrating Systems: Experimental and Numerical Analyses. Sol. Energy 2016, 133, 44–54. [Google Scholar] [CrossRef]
- Coventry, J.S. Performance of a Concentrating Photovoltaic/Thermal Solar Collector. Sol. Energy 2005, 78, 211–222. [Google Scholar] [CrossRef]
- Mittelman, G.; Kribus, A.; Dayan, A. Solar Cooling with Concentrating Photovoltaic/Thermal (CPVT) Systems. Energy Convers. Manag. 2007, 48, 2481–2490. [Google Scholar] [CrossRef]
- Daneshazarian, R.; Cuce, E.; Cuce, P.M.; Sher, F. Concentrating Photovoltaic Thermal (CPVT) Collectors and Systems: Theory, Performance Assessment and Applications. Renew. Sustain. Energy Rev. 2018, 81, 473–492. [Google Scholar] [CrossRef]
- Alzahrani, M.; Shanks, K.; Mallick, T.K. Advances and Limitations of Increasing Solar Irradiance for Concentrating Photovoltaics Thermal System. Renew. Sustain. Energy Rev. 2021, 138, 110517. [Google Scholar] [CrossRef]
- Xu, N.; Ji, J.; Sun, W.; Huang, W.; Jin, Z. Electrical and Thermal Performance Analysis for a Highly Concentrating Photovoltaic/Thermal System. Int. J. Photoenergy 2015, 2015, 537538. [Google Scholar] [CrossRef]
- Quaia, S.; Lughi, V.; Giacalone, M.; Vinzi, G. Technical-Economic Evaluation of a Combined Heat And Power Solar (CHAPS) Generator Based on Concentrated Photovoltaics. In Proceedings of the Automation and Motion International Symposium on Power Electronics Power Electronics, Electrical Drives, Sorrento, Italy, 20–22 June 2012; pp. 1130–1135. [Google Scholar]
- Khouya, A. Levelized Costs of Energy and Hydrogen of Wind Farms and Concentrated Photovoltaic Thermal Systems. A Case Study in Morocco. Int. J. Hydrogen Energy 2020, 45, 31632–31650. [Google Scholar] [CrossRef]
- Triple Junction Concentrated Gaas Cell Used for CPV System. Available online: https://www.gaas.fullsuns.com/GaAs/GaAs/Triple-junction-concentrated-gaas-cell-used-for-CPV-system.html (accessed on 8 October 2020).
- Aldossary, A.S. Performance Evaluation of a High Concentrator Photovoltaic Integrating a Fresnel Lens in Saudi Arabia: A Case Study. Int. J. Energy Res. 2021, 45, 5201–5213. [Google Scholar] [CrossRef]
- Renno, C.; Petito, F. Experimental and Theoretical Model of a Concentrating Photovoltaic and Thermal System. Energy Convers. Manag. 2016, 126, 516–525. [Google Scholar] [CrossRef]
- Aldossary, A.S. Development and Performance Characterisation of High Concentrating Multi-Junction PV/Thermal Technology. Ph.D. Thesis, University of Birmingham, Birmingham, UK, 2017. [Google Scholar]
- Evans, D.L.; Florschuetz, L.W. Cost Studies on Terrestrial Photovoltaic Power Systems with Sunlight Concentration. Sol. Energy 1977, 19, 255–262. [Google Scholar] [CrossRef]
- Calise, F.; Vanoli, L. Parabolic Trough Photovoltaic/Thermal Collectors: Design and Simulation Model. Energies 2012, 5, 4186–4208. [Google Scholar] [CrossRef]
- Theristis, M.; O’Donovan, T.S. Electrical-Thermal Analysis of III–V Triple-Junction Solar Cells under Variable Spectra and Ambient Temperatures. Sol. Energy 2015, 118, 533–546. [Google Scholar] [CrossRef] [Green Version]
- Rohsenow, W.M.; Hartnett, J.P.; Cho, Y.I. Natural Convection. In Handbook of Heat Transfer; McGraw-Hill Education: New York, NY, USA, 1998; ISBN 978-0-07-053555-8. [Google Scholar]
- ANSYS Inc. ANSYS Meshing User’s Guide Release 13.0; Releas 13.0.; Southpointe 275, Technology Drive; ANSYS Inc.: Canonsburg, PA, USA, 2010. [Google Scholar]
- ANSYS Inc. ANSYS Fluent Tutorial Guide Release 18.0; Southpointe 2600 ANSYS Drive; ANSYS Inc.: Canonsburg, PA, USA, 2017. [Google Scholar]
Publisher’s Note: MDPI stays neutral with regard to jurisdictional claims in published maps and institutional affiliations. |
© 2022 by the authors. Licensee MDPI, Basel, Switzerland. This article is an open access article distributed under the terms and conditions of the Creative Commons Attribution (CC BY) license (https://creativecommons.org/licenses/by/4.0/).