Abstract
Excessive water inflow in a mine poses a great threat to its operation, especially in the case of a salt mine. In 1992, a rapid outflow of water occurred in the Mina traverse in the Wieliczka Salt Mine, and a number of investigations were undertaken to assess the causes of the outflow and the condition of the rock mass, including the gravity and microgravity surveys discussed in this paper. The first of these was to investigate the rock mass with respect to its geological, hydrogeological properties and mining. The aim of study was to monitor the changes in the rock mass density and the impact of these changes on the subsidence of the ground surface. The surveys provided information on the geological structure of the study area and helped to identify possible routes for water migration. The first data confirmed density changes in the shallow parts of the rock mass, manifested by subsidence of the land surface. However, the subsequent measurements failed to show any significant density changes in the shallow parts of the rock mass, despite the subsidence of the land surface. Therefore, it can be argued that the processes in the rock mass did not cause voids in the shallow parts of the rock mass that could lead to discontinuous deformations. These processes run deep and caused only continuous deformations in the form of subsidence basins.
1. Introduction
The Wieliczka Salt Mine is one of the best known and most frequently visited historical monuments in Poland. The basic problem with the mine is the water hazard, the source of which is the waterlogged Chodenice beds bordering with the deposit from the north. All the catastrophic water inflows into the mine came from these layers and led to rescue and protection actions that lasted for many years. In order to protect the historical mine, it is vital to understand the paths of water circulation in the rock mass [1,2] and the ways in which rock material is removed from the foreground of the deposit transported with water to the excavations. The recognition of these phenomena is inextricably linked with the recognition of the shallow part of the rock mass, for which geophysical methods are used.
In order to solve hydrogeological problems, geoelectrical methods are widely applied, due to their high sensitivity to changes in water condition in the geological medium. These methods are used to track aquifers, underground water flow [3], or to detect and control underground water-bearing structures. Geoelectrical methods are widely applied to problems related to water in mines [4,5].
Other geophysical methods can also be applied to monitor groundwater migration. The microgravity method, based on density recognition of the rock mass, is one of them. It is widely applied to identify both deep [6] and shallow geological structures [7,8]. It can be used to detect voids and loosening in shallow parts of the rock mass that may pose a threat to the ground surface. In particular, such surveys can be conducted in the areas with working mines [9] as well as in post-mining areas [10]. This method can also be used to monitor the state of the rock mass in terms of the migration of voids to the surface of the terrain [11] or monitoring aquifer recharge [12]. Changes in the water saturation of the near-surface zone are possible to record by this method, which will be confirmed by survey with a highly accurate superconducting gravimeter [13].
Thus, the application of gravity methods in the studied area will allow for better recognition of both deep and shallow geological structures. Additionally, carrying out successive series of measurements will make it possible to determine density changes in the rock mass which, in turn, may be related to water migration and transport of material.
Base gravity surveys in the area of the Wieliczka town were carried out in 1992, three months after the catastrophic outflow of water in the Mina traverse [14]. Their aim was to understand the shallow geological structure and the condition of rock mass after salt extraction. Following the recognition of the rock mass, systematic gravity measurements have been carried out in the area since 1992 in order to follow density changes in the rock mass over time. In 2001, an attempt was made to associate the results obtained to the risk to building structures in the area [15]. Using the new processing tools allows for a better interpretation of the 1992 study, especially in terms of the direction of groundwater migration, authors the made the new interpretation of the time-series data. This interpretation was focused on the foreland of the Mina traverse, i.e., in the area where the largest subsidence of the ground surface was observed.
2. Materials and Methods
2.1. Geological Setting
The Wieliczka rock salt deposit belongs to the group of salt deposits stretching along the arc of the Carpathian Mountains from Upper Silesia to the Danube Gorge in Romania. It was formed in the Miocene, about 13.6 million years ago, when in the foreland of the Carpathians a trench filled with sea water was formed as a northern branch of the so-called Tethys ocean [16,17]. The process of deposit formation is related to both shallower and deeper parts of the reservoir, cyclic changes in sea level, shoreline changes and mass movements in the form of submarine runoffs and landslides. Under these conditions, salt deposits separated by overgrowths of clay rocks, mudstones and, less frequently, sandstones were formed. The deposit extends for about 10 km in a west–east direction and is about 0.5–1.5 km wide. The depth of the deposit ranges from about 30 to 350 m. A characteristic feature of the Wieliczka deposit is that it is divided into a stratified deposit and an overlying boulder deposit, which is a result of submarine landslides and tectonic movements.
The boulder deposit is composed of rock salt blocks (broken up salt seams) embedded in clay rock with halite crystals. The clay-gypsum buffer zone, which protects the deposit from groundwater inflow, is a remnant of the leached near-surface part of the deposit. The southern boundary of the deposit is marked by flysch formations of the Outer Carpathians (Figure 1). The northern boundary of the deposit is marked by the Machów Formation, whose layers that are younger than evaporites were thrust to the north as a result of tectonic movements and the deposit is partly overlain by them. These formations, referred to as the Chodenice beds, are built mainly of clay rocks interlayered with sandstones, siltstones of different binders and different compaction and occasionally marls and dolomites. Quaternary formations covering the deposit are mainly post-glacial Pleistocene clays with interbedding of sands, silts and gravels as well as weathered clays and loess. The Holocene formations are mainly fluvial and landslide deposits (Figure 1).
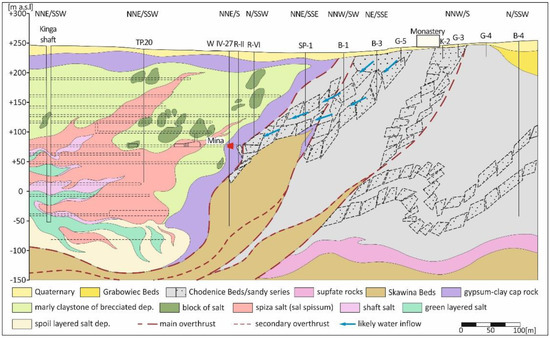
Figure 1.
The geological cross-section of the Wieliczka salt deposit (based on [18]).
2.2. Hydrological Conditions
In the area of the “Wieliczka” Salt Mine there is a quaternary aquifer and a Neogene floor, within which four aquifers are separated (Figure 1).
The oldest aquifer of the Neogene is associated with sandstones and mudstones of the Skawina layers and cracked marl clays. The formations of the Skawina layers form aquifer reservoirs of a porous-fissure nature, where pressure conditions occur, and the waters are at a pressure of 3.8–4.0 MPa. The filtration coefficients of aquifer rocks in the Skawina layer complex are usually within the range of 10−7–10−9 m/s. The abundance of this level is small, and the supply is carried out by infiltration from the higher layers and on the under Quaternary outcrops.
Very small amounts of groundwater are associated with the layers of the sulphate series at the boundaries of the evaporate salt formation. Waters occur in these formations, mainly in the clay-marl outgrowths of sandstone and within the gypsum-clay cap of the salt deposit. Gypsum rocks contain water mainly in cracks and crevices and in karst forms developed on them. The waters within the evaporative rocks are of a pressure nature, and their pressures are up to 3.0 MPa. The filtration coefficients of these rocks usually take values in the range of 10−8–10−7 m/s. Very limited recharge of these waters occurs from Quaternary formations and neighbouring Chodenice beds.
Another aquifer, in Neogene formations, occurs within the Chodenice layers, with the dominance of claystones and clay slates. The aquifer formation is a layer of fine-grained sandstones, weak and scattered, as well as inserts of fine-grained sands and mudstones. Due to the strong degree of tectonic involvement, the layer of this formation was strongly dislocated, creating significantly relocated blocks. Within the entire layer of Chodenice sandstones, there is a hydraulic connection, but aquifers in individual tectonic blocks form are isolated and subsist with not very rich water. The inflow from the Chodenice beds accounts for approx. 85% of the total water inflow to the mine workings. The waters found in sands and sandstones in the complex of Chodenice beds are of a pressure nature, and their pressures are up to 1.6 MPa. Hydrogeological studies of sandstones indicate that their filtration coefficients are within very wide ranges from 5.8 × 10⁻⁹ m/s to 6.4 × 10⁻⁶ m/s. The contact zone of the “Wieliczka” salt deposit with the watered sandstones of the Chodenice beds runs latitudinally in the northern part of the rock mass cut by the mine workings. This area is sensitive from the point of view of the water threat of the “Wieliczka” Salt Mine. All major water intrusions into the mine took place in the workings located in the northern border zone of the deposit, where the continuity of its natural clay-gypsum buffer zone was broken.
The youngest aquifer within the Neogene complex occurs within the Grabowiec beds, built predominantly of sands. This level lies directly on the Chodenice beds and has direct contact with Quaternary formations occurring on the surface and powered by atmospheric precipitation. The permeability of sands is very good and is usually contained in ridges from 2.4 × 10⁻⁵ m/s to 8.5 × 10⁻⁵ m/s.
The Quaternary aquifer in the area of the “Wieliczka” Salt Mine is associated with sands of various grain sizes, gravels and rubbles. The groundwater table in these formations is usually free and only very rarely slightly tense. The depth of the Quaternary water table is up to a maximum of several meters.
2.3. History of the Catastrophe
From the point of view of the threat to the existence of the mine the most important are the Chodenice beds mentioned above. All significant intrusions of water into the mine originated from these layers and they are responsible for approximately 85% of current water inflow into the pits. The largest identified intrusion of water into the mine took place near the Regis shaft in the amount of about 360 m3/h in the Kloski traverse on the 5th level in 1868. This intrusion was finally stopped in 1879 when the cavern in the foreground of the deposit collapsed and blocked the water inflow into the mine. The waters flowing from the Chodenice beds into the mine have been the subject of various analyses, describing in detail not only their chemical and isotopic composition but even medicinal properties, e.g., [19,20].
The best known water intrusion into the mine workings, i.e., the outflow in the Mina traverse at level IV, took place from the Chodenice beds in April 1992. Due to the low compaction of clay and siltstone, the water that flowed into the mine working had a high content of rock material. The rock material carried away from the foreground of the deposit led to voids in the rock mass which collapsed due to the poor strength parameters of the rocks. The process of leaching rock material, filling the voids and cracks, which increased the water pressure up to the level exceeding the strength of charge resulted in a pulsating outflow of water, within output of 0 to 5 m3/min. Four months after the water entered the Mina traverse, a watertight dam was built in order to limit the outflow of rock material and the water was captured by a pipe passing through the dam. An attempt to close the inflow ended in another catastrophic intrusion, which occurred when the water pressure reached 0.63 MP behind the dam. Five months after the intrusion, the formation of a subsidence basin was observed on the surface. Approximately one year after the intrusion, after an amount of sealing and reinforcement work had been carried out on the rock mass around the spillway, the rock material practically stopped being carried away. Sealing mixtures and polyurethane were injected simultaneously from holes drilled from the surface in the foreground of the traverse and from holes drilled from access shafts to the water dam. The drainage boreholes drilled through the sealed dam produced water with a significantly lower suspended solids content, ranging from several mg to several g/dm3. The water balance from 2007 showed that since 1992, 1.037 million m3 of water have flowed into the “Mina” traverse, which amounted to 64,089 Mg of silt and sand and 10,635 Mg of salt.
2.4. Microgravity Method
Gravity method, based on the Earth’s natural gravitational field, belongs to the passive methods, which means the relevant equipment does not send any signal, but only receives it. Gravity surveys are conducted to measure the change in the gravity field reflecting the changes in the distribution of masses (and thus density) in the rock mass. In fact, the value measured in the gravity method is the value of the vertical component of the Earth’s acceleration.
The method is used both in prospecting and engineering studies. In the latter case, in the microgravity version, it is used to identify the near-surface condition of a rock medium, especially to identify loosening zones and natural and anthropogenic voids. The change in gravity between measurement points is related to the density distribution in the rock mass.
The source of information on the distribution of density in the rock mass is the distribution of Bouguer anomalies. The Bouguer anomaly represents the difference between the measured value of gravity and the Bouguer reduction to a reference level and the normal value of gravity calculated at that level, also known as latitude correction.
Δg = g + δgF + δgB + δgT − gN
The Bouguer reduction is used to eliminate from the observed gravity values the unwanted influence of changes in the topography of the terrain surface. The reduction consists of three corrections: terrain correction δgT, free-air correction δgF and Bouguer correction δgB. After their introduction, the measured value of gravity, at each measurement point, is given the value as if the measurements were at one level. In urban areas, it is sometimes necessary to introduce an additional correction (building correction) for the gravitational influence of buildings [21].
The latitude correction is calculated on the basis of the International Gravity Formula for the Earth model of the Geodetic Reference System 1980 [22].
The Bouguer anomaly is the sum of gravitational effects originating from all natural and anthropogenic elements present in the rock medium: it is the sum of the so-called regional and local anomalies. From the point of view of engineering studies, the most interesting are the local anomalies which are related to changes in density distribution in the most near-surface part of the rock medium. There are several different ways in which the distribution of residual anomalies, which is a mathematical approximation of local anomalies, is calculated from the Bouguer anomaly distribution. One way is to approximate the regional anomaly distribution with the selected analytical method and then subtract it from the Bouguer anomaly.
The authors of this paper have used two methods to calculate regional anomalies, i.e., low-pass Butterworth and Gauss filtering regional field approximation. The filtering methods are used in the wavenumber domain by first transforming the Bouguer anomalies with fast Fourier transformation. The transformation allows for the calculation of a power spectrum, which is used to determine wavelengths representing regional and residual anomalies. The wavelength depends on the depth of the source of each anomaly and the size of the bodies, and it provides the basis for filtering methods. In gravimetry, the Butterworth and Gauss filter is most commonly used to separate both types of anomalies.
Similar filtering procedures using high pass filters are also applied to remove noise from the observed gravity values. Such noises are most often related to vibrations of the measuring device caused by various natural (e.g., wind, car traffic) and anthropogenic factors (e.g., working machinery).
Microgravimetric survey was carried out in an irregular grid of points distant from each other by 50–100 m on average (Figure 2). The points were located at such a distance from buildings so as to avoid the need for building correction eliminating the gravitational influence of buildings.
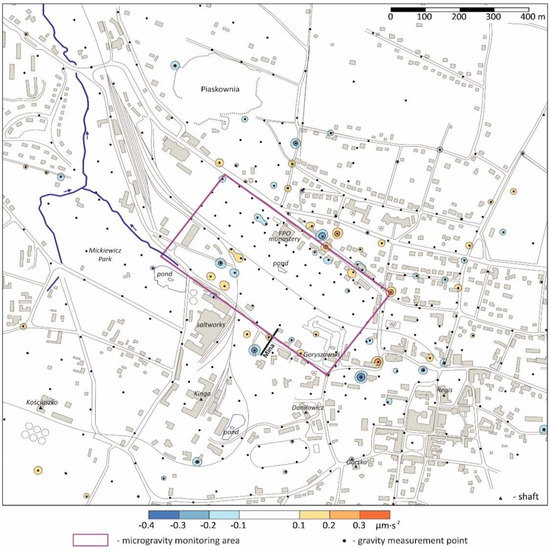
Figure 2.
Microgravity survey location, and noise distribution.
On the basis of the obtained results, Bouguer anomaly values were calculated. Due to the fact that the study area was urbanized, the results were affected by random noise of different origin. Therefore, the distribution of Bouguer anomalies was subjected to high-pass filtering with the assumption of low value of wavenumber. As Figure 2 shows, the noise range is in the range of −0.4–0.4 µm·s−2. It can be easily observed that the points with the highest noise values are often located along traffic routes, where the main vibrations are generated by vehicle traffic.
Microgravity surveys are also used to monitor the state of a rock medium in terms of density changes over time. This refers to changes in density within one or more elements of a rock medium, which can be related to, e.g., propagation of voids towards the surface, leaching of rock material by surface and underground water, seepage of post-mining voids, etc.
Gravity observations in such an approach are carried out on a cyclical basis, on points located exactly in the same place, and preferably permanently stabilized. Subsequently, by analysing changes in the value of gravity force at each point in relation to the base series, it is possible to draw conclusions whether changes have taken place in the rock mass and to what extent they pose a threat to the ground surface as well as underground anthropogenic objects.
For the task described in this paper, the region north of the Mina traverse, marked with a red rectangle in Figure 2, was selected as the gravimetric monitoring field. The microgravimetric observations were carried out in the years 1992–2007, in nine measurement series. The first six series were made in short time intervals, which was related to the significant water inflow to the traverse The interval measured by the remaining three was longer. It coincided with a certain calming of the situation in the mine.
All series of microgravity measurements were made on points located in the same place but only in the case of series III and subsequent series they were made on permanently stabilised points. Therefore, the changes in gravity values were analysed assuming two base series. Initially, series I and then series III were considered as the base series.
At the same time, as microgravity observations, geodetic measurements of land surface height were made. These values were also subjected to interpretation with the assumptions of the same base series as for the gravity data.
3. Results
Following the catastrophic outflow of water in the Mina transverse in 1992, a number of studies were carried out to identify the causes of the outflow and to develop ways of stopping it. Among these, gravity surveys were carried out with the primary aim of identifying the shallow geological structure in the area. Subsequently, a number of repeat series of these surveys were carried out to monitor the density changes taking place in the rock mass.
3.1. General Gravity Survey
The baseline gravity surveys were carried out in July 1992, i.e., about three months after the water outflow started. The Bouguer anomaly values devoid of high-frequency noise were used as a basis for the interpretation and further prediction, and their distribution is presented in Figure 3. The distribution of Bouguer anomalies clearly shows a nearly meridional course of the isolines, with the anomaly values increasing from west to east. Such a general distribution of anomalies should be associated with a regional factor, originating from the Jurassic basement. In the south-eastern part of the study area, a change in the course of the isolines is clearly visible and it is connected with the existence of the Wieliczka deposit of rock salt of the west–east continuum. Small irregularities in the distribution of the isoline originate from smaller shallowly located anomalous bodies, and it was precisely their identification that was the aim of the conducted gravity survey.
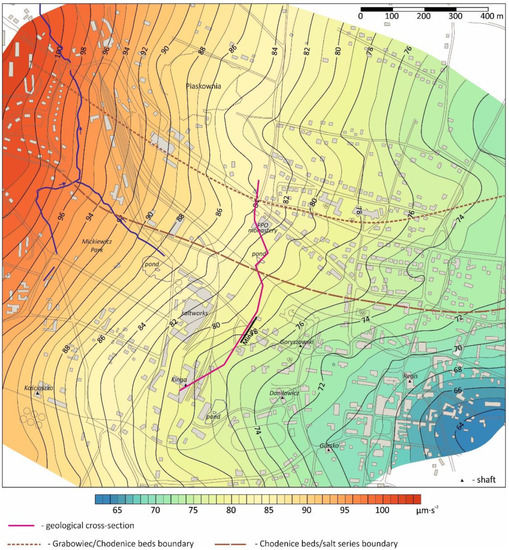
Figure 3.
Distribution of Bouguer anomalies.
In order to separate the gravitational effect originating from these small disturbing bodies, the Bouguer anomaly values were filtered with a high-pass Gauss filter of wavenumber 750 m. The filtering resulted in residual anomalies, which are a mathematical reflection of the real local anomalies (Figure 4).
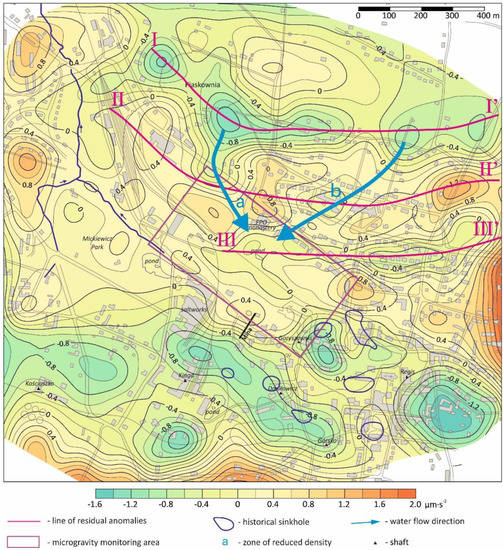
Figure 4.
Distribution of gravity residual anomalies.
In the northern part of the study area, there is a visible sequence of negative residual anomalies (marked by line I–I’ in Figure 4), which generally runs in the west–east direction. It should be associated with Quaternary trough structure in the Grabowice beds [23]. The Grabowice beds are built mainly of sands and are a natural water reservoir. South of the trough, there is a border between the Grabowice beds and the Chodenice beds built of sandstones, often fractured, especially on the borders of overthrusts. At the boundary between the two layers, the Quaternary overthrust is the least thick, and the Chodenice beds are close to the ground surface. This boundary is visible as a sequence of positive anomalies marked in Figure 4 by line II–II’. To the south of both anomalous sequences, a shorter sequence of negative anomalies is visible (line III–III’), the sources of which are located in the Chodenice beds. It seems that this sequence of negative anomalies, illustrating the zone of decreased density within the Chodenice beds, may be related to location where water penetrated into deeper parts of the rock mass (Figure 1). The anomalous zone is located over fractured sandstones, which lie in the immediate vicinity of the overthrust.
The analysis of residual anomalies shows in the line II–II’ two regions of decreased density marked with letters ‘a’ and ‘b’. Based on this information, it can be stated that they are related to the inflow of water from the reservoir in sands of Grabowice beds and Quaternary formations to Chodenice beds. Probable direction of the flow, determined on the base of microgravity survey, was marked with blue arrows in Figure 4. This is particularly noticeable in the case of region ‘a’, where the negative residual anomaly from the line I–I’ branches towards the south, i.e., the Chodenice beds. It should be noted that the weathered and fractured Chodenice sandstones visible in the geological cross-section (Figure 1) at the boundary with the Grabowice beds are well-collapsed, since no negative residual anomaly that would indicate lower density than the surrounding rocks is observed there.
Numerous negative anomalies over a large area and of high amplitudes have been observed to the south of the residual anomalies described above. They are located over the central region of the Wieliczka Salt Mine, which is the region of the oldest mining works dating back to the 13th century. Very little is known about the beginnings of mining, due to the lack of mining maps and archival records. Only the end of the 16th century and later periods are better documented. Therefore, there is no doubt that these anomalies are the result of many centuries of salt exploitation.
The archival materials of the mine contain, among others, descriptions of subsurface collapses of mining chambers located mainly on the first level of the Mine. The oldest described surface deformation connected with the collapse of the Gmińskie chamber dates back to 1579. Some of them are marked on Figure 4, and their horizontal extent indicates that the recorded anomalous areas cannot originate from former sinkholes.
3.2. Microgravity Monitoring
The microgravity surveys carried out in a given area at time intervals make it possible to track density changes in the rock mass. Such changes may be caused by, among other things, suffosion processes, which result in the creation of voids or loosenings, i.e., changes in density. The resulting changes in the rock mass lead in turn, in the near or distant future, to continuous or discontinuous deformations of the ground surface. Thus, thanks to the microgravity method, it is possible to predict the occurrence of surface deformations. It should also be mentioned that suffosion can also cause a slight increase in density, which can be measured.
In the present case, microgravity method was used to trace the shallow parts of the rock mass after the catastrophic outflow of water in the Mina traverse and the emergence of surface deformation. The paper focuses on changes in the rock mass in the area north of the end of the Mina traverse flow, i.e., the area where surface deformations occurred. This area is marked by a rectangle on the distribution of residual anomalies (Figure 4), and an enlarged fragment of the area with location of points and control and backfilling boreholes is shown in Figure 5.
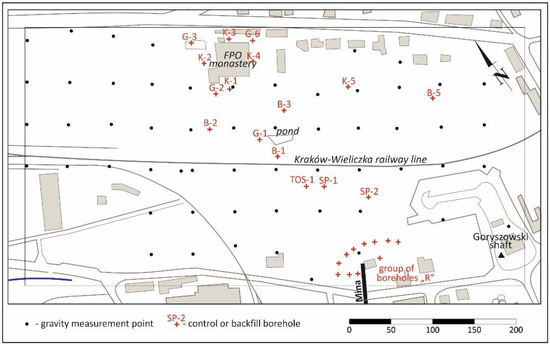
Figure 5.
Location of microgravity monitoring.
The microgravity measurement points were at the same time permanently stabilised geodetic points in a regular grid with a step of 50 m. In this area, there is a negative anomaly described in the previous section, indicating a deficiency of masses in the rock mass in relation to the surroundings (Figure 4).
As mentioned before, base measurements were made in July 1992, and subsequently in September and October 1992. In September 1992, drilling of group R boreholes (Figure 5) started and backfilling material was injected in two of these boreholes. Figure 6a,c presents distributions of differential anomalies Diff(2-1) and Diff(3-1), i.e., differences between values obtained in the second and third series and the first (baseline) series.
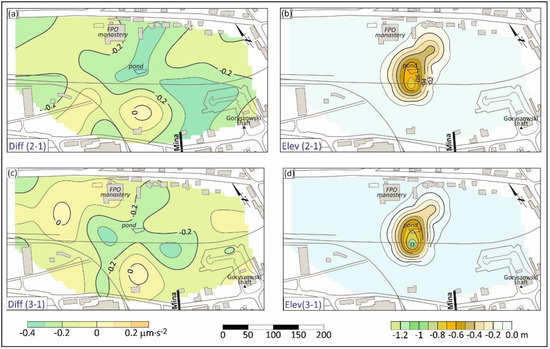
Figure 6.
Differential microgravity anomalies (a,c) (Diff) and surface subsidence (b,d) (Elev) between series: 2-1 and 3-1.
The distribution of differential anomalies Diff(2-1) indicates mass loss in the formations, which should be attributed to suffosion. The mass loss led to subsidence of the ground surface, i.e., continuous deformation, confirmed by differential geodetic measurements Elev (2-1) (Figure 6b). It is worth mentioning that the monitored area included the monastery and the Krakow–Wieliczka railway line, which was closed due to subsidence of the ground surface. Between the second and third series, significant water outflows appeared in the Mina traverse. However, they had no significant effect on density changes in shallow parts of the rock mass. Microgravity studies (Figure 6c) showed only minor changes in gravity. No major subsidence of the ground surface Elev(3-1) was observed (Figure 6d).
Prior to series 3 measurements, a grid of permanent measurement points was constructed as part of the geodetic work in order to better track the changes in ground surface elevation. Due to the reconstruction of the geodetic network in the further interpretation, the third series was treated as the base series. The permanent stabilisation of measurement points significantly reduces the possibility of errors.
In 1993, reconnaissance work continued in the form of surface drilling and sealing of the rock mass around the dam separating the Mina traverse from the mine. In that year, three series of measurements were made and the obtained distributions of differential anomalies Diff(4-3), Diff(5-3) and Diff(6-3) are very similar (Figure 7a,c,e).
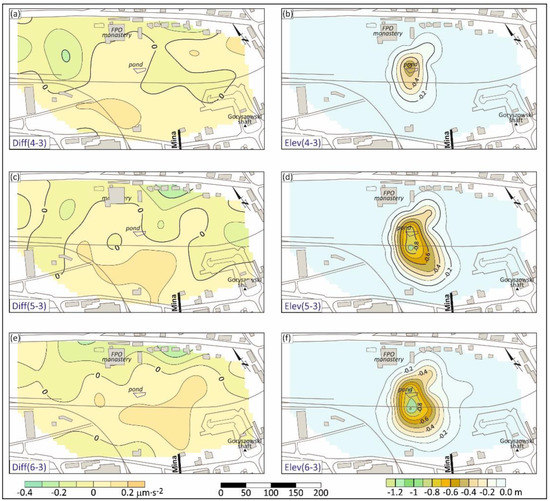
Figure 7.
Differential microgravity anomalies (a,c,e) (Diff) and surface subsidence (b,d,f) (Elev) between series: 4-3, 5-3 and 6-3.
In the northern part of the area, in the vicinity of the monastery, slight decreases in the differential anomaly values are visible, while in the remaining area, a slight increase in the values is observed. The process of land surface subsidence, which continued in the central part of the area, is different. Decreases between series 4 and 3 are small (Figure 7b), whereas their area significantly increased between series 5 and 4 (Figure 7d). Between series 6 and 5, the changes in ground surface are already small (Figure 7e). The absence of correlation between gravity and geodetic surveys is interesting. The surveys indicate that in the shallow part of the rock mass, despite surface subsidence, no significant changes in density took place. Thus, no major cavities were formed, but rather fissures through which water containing loose material flew on a regular basis. It should be noted that during this period there was a continuous outflow of water in the traverse, reaching up to 20 m3/min. Thus, the outflow was at a depth which did not make it possible to detect it with the microgravity method. Only a small part of the near-surface material was carried deep into the rock mass, which resulted in a slight lowering of the ground surface.
In May 1994, another series of surveys was carried out, which show density stabilisation of the shallow parts of the rock mass (Figure 8a). It is also confirmed by the subsidence of ground surface Elev(7-3) (Figure 8b). Differential anomalies Diff(7-3) indicate density recovery of the shallow part of the rock mass to the state of series 3.
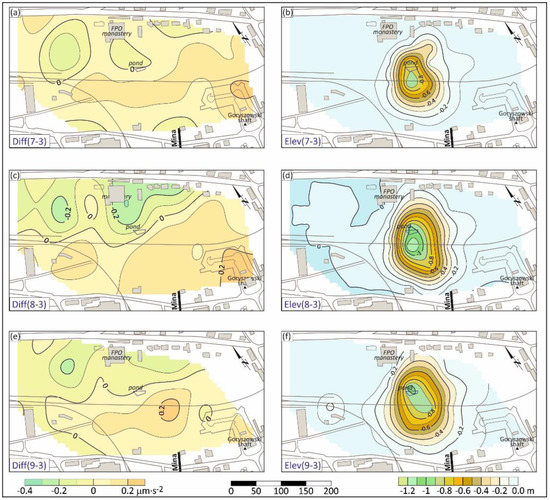
Figure 8.
Differential microgravity anomalies (a,c,e) (Diff) and surface subsidence (b,d,f) (Elev) between series: 7-3, 8-3 and 9-3.
In June 1993, the backfilling of the region of the largest subsidence of the ground surface started. In the next series of surveys, performed in September 1995, a decrease in density was observed again in the northern part of the Diff(8-3) area (Figure 8c), which extended to the Monastery region. This negative differential anomaly indicates a more intense southward flow of water and transport of loose material to the south. The absence of negative differential anomalies in the study area and the increased subsidence of the ground surface indicate that particle transfer and slow subsidence occurred simultaneously, but there were no changes in the average density of this rock mass.
Further microgravity measurements were made only in 2007 (Figure 8e,f). Unfortunately, as a result of works carried out to protect the rock mass, some of the geodetic points, and thus also microgravity ones, were destroyed. This made it necessary to remove from the distribution of differential anomalies the observations at the renewed points, as the values measured at these points differed significantly from the previous ones.
Generally, no significant density changes were observed in the rock mass. The analysis of the distribution of differential anomalies Diff(9-3) indicates a gradual, dense rebuilding of the rock mass. The subsidence Elev(9-3) also shows stabilisation, and even a very slight increase in height was noticed in the place of previous subsidence. Thus, it can be safely stated that the microgravity and geodetic methods do not indicate the presence of hazards.
4. Discussion and Conclusions
Increased water inflows into the mine pose a thread of which is particularly dangerous in the case of salt mines. Thus, after increased water inflow into Wieliczka salt mine was detected in 1992, many protective works accompanied by investigations into the causes of the inflows were carried out. In one of them, gravimetric method was applied, as it allows investigators to determine the density of the rock mass.
As expected, it was possible to correlate the distribution of measured anomalies with the well-recognized geological structures. The negative residual gravity anomalies observed in the northern part of the study area testify to decreased density of rocks within the Grabowice beds. This indicates that they may be water reservoirs. Negative residual anomalies are also present in the foreland of the Mina traverse, which should be associated with the reduced density of the sandy series within the Grebowice beds. This confirms the prediction that water migrates from the north, from the reservoir rocks of the Grabowice beds, to the south and enters the transgression through this sandy series. A similar geological setting is present at the northern boundary of the Grabowice beds, but gravity surveys did not show any decrease in density between the sandy series and the surrounding area. Therefore, it should be concluded that sandy series in this area are not the source of water inflow to the mine. The distribution of residual anomalies indicated possible pathways and direction of subsurface water flow from the reservoir rock areas in the north towards the south, i.e., the Mina post-mining area.
The analysis of microgravimetric measurements in the foreground of the Mina traverse showed significant density changes in the shallow part of the rock mass only immediately after the catastrophic outflow in 1992. It should be noted that despite the absence of density changes in the shallow part of the rock mass, subsidence of the ground surface continued. There was also no correlation between subsidence and changes in gravity values at the site of the former salt mine in Marston, United Kingdom [24]. It should be noted that only continuous deformations were observed in the foreground of the Mina traverse, which indicates that the inflow of water to the traverse did not cause the formation of voids or significant loosenings in the near-surface part of the rock mass.
Geodetic measurements show the very slow uplift of the surface in this area currently [25], which may indicate the storage of sediments carried by groundwater. It is planned to perform another series of microgravity research to determine the current density state of the rock mass.
Author Contributions
Conceptualization, S.P. and M.L.; methodology, S.P. and M.L.; validation, S.P., M.L. and K.d.; formal analysis, S.P., M.L. and K.d.; resources, S.P., M.L. and K.d.; data curation, S.P., M.L. and K.d; writing—original draft preparation, S.P., M.L. and K.d.; writing—review and editing, S.P., M.L. and K.d.; visualization, S.P., M.L. and K.d.; supervision, S.P. and M.L.; funding acquisition, S.P., M.L. All authors have read and agreed to the published version of the manuscript.
Funding
This paper was financially supported from the research subsidy No. 16.16.140.315 at the Faculty of Geology Geophysics and Environmental Protection of the AGH University of Science and Technology, Krakow, Poland, 2022.
Institutional Review Board Statement
Not applicable.
Informed Consent Statement
Not applicable.
Data Availability Statement
Not applicable.
Conflicts of Interest
The authors declare no conflict of interest.
Abbreviations
| ρ | bulk density, Mg·m−3 |
| gM | measurement value of gravity, nm·s−2 |
| δgF | free-air correction, nm·s−2 |
| δgB | Bouguer correction, nm·s−2 |
| gN | latitude correction, nm·s−2 |
| δgT | terrain correction, nm·s−2 |
| δgG | mining correction, nm·s−2 |
| g | gravity value with corrections, nm·s−2 |
References
- Xu, Y.; Ma, L.; Yu, Y. Water Preservation and Conservation above Coal Mines Using an Innovative Approach: A Case Study. Energies 2020, 13, 2818. [Google Scholar] [CrossRef]
- Staniszewski, R.; Cais-Sokolińska, D.; Kaczyński, Ł.K.; Bielska, P. Use of Bioluminescence for Monitoring Brown Coal Mine Waters from Deep and Surface Drainage. Energies 2021, 14, 3558. [Google Scholar] [CrossRef]
- Li, S.; Liu, B.; Nie, L.; Liu, Z.; Tian, M.; Wang, S.; Su, M.; Guo, Q. Detecting and monitoring of water inrush in tunnels and coal mines using direct current resistivity method: A review. J. Rock Mech. Geotech. Eng. 2015, 7, 469–478. [Google Scholar] [CrossRef]
- Liang, Q. Water Disaster Investigation and Control in Coal Mine of Southern China. In Proceedings of the 3rd International Symposium on Mine Safety Science and Engineering, Montreal, QC, Canada, 13–19 August 2016; pp. 254–257. [Google Scholar]
- Cui, F.; Wu, Q.; Lin, Y.; Zeng, Y.; Zhang, K. Damage Features and Formation Mechanism of the Strong Water Inrush Disaster at the Daxing Co Mine, Guangdong Province, China. Mine Water Environ. 2018, 37, 346–350. [Google Scholar] [CrossRef]
- Stepancikova, P.; Dohnal, J.; Panek, T.; Łój, M.; Smolkova, V.; Slihan, K. The application of electrical resistivity tomography and gravimetric survey as useful tools in an active tectonics study of the Sudetic Marginal Fault (Bohemian Massif, central Europe). J. Appl. Geophys. 2011, 74, 69–80. [Google Scholar] [CrossRef]
- Porzucek, S.; Madej, J. Recognition of geological structures at Starunia palaeontological site and vicinity (Carpathian region, Ukraine) based on gravity surveys. Ann. Soc. Geol. Pol. 2009, 79, 357–363. [Google Scholar]
- Porzucek, S.; Madej, J. Detection of near-surface geological heterogeneity at Starunia palaeontological site and vicinity (Carpathian region, Ukraine) based on microgravity survey. Ann. Soc. Geol. Pol. 2009, 79, 365–374. [Google Scholar]
- Porzucek, S.; Loj, M. Microgravity Survey to Detect Voids and Loosening Zones in the Vicinity of the Mine Shaft. Energies 2021, 14, 3021. [Google Scholar] [CrossRef]
- Łój, M. Microgravity monitoring discontinuous terrain deformation in a selected area of shallow coal extraction. In Proceedings of the SGEM2014, Albena, Bulgaria, 17–26 June 2014; Volume 1, pp. 521–528. [Google Scholar]
- Davis, K.; Li, Y.; Batzle, M. Time-lapse gravity monitoring: A systematic 4D approach with application to aquifer storage and recovery. Geophysics 2008, 73, WA61–WA69. [Google Scholar] [CrossRef]
- Chapman, D.S.; Sahm, E.; Gettings, P. Monitoring aquifer recharge using repeated high-precision gravity measurements: A pilot study in South Weber, Utah. Geophysics 2008, 73, WA83–WA93. [Google Scholar] [CrossRef][Green Version]
- Creutzfeldt, B.; Güntner, A.; Klügel, T.; Wziontek, H. Simulating the influence of water storage changes on the superconducting gravimeter of the Geodetic Observatory Wettzell, Germany. Geophysics 2008, 73, WA95–WA104. [Google Scholar] [CrossRef]
- Madej, J.; Porzucek, S.; Jakiel, K. Water hazard of the northern border of the Wieliczka Salt Mine area in the light of temporal gravity changes. Geologia 2008, 34, 321–334. [Google Scholar]
- Brudnik, K.; Jakiel, K.; Madej, J.; Porzucek, S. Zagrożenie zabudowy miejskiej Wieliczki ze strony struktur antropogenicznych w świetle badań grawimetrycznych. In Proceedings of the Sympozjum Warsztaty’2001, Przywracanie wartooeci u¿ytkowych terenom górniczym”, Wieliczka, Poland, 29 May–1 June 2001; pp. 423–432. [Google Scholar]
- Oszczypko, N.; Krzywiec, P.; Popadyuk, I.; Peryt, T. Carpathian Foredeep Basin (Poland and Ukraine)–its sedimentary, structural and geodynamic evolution. Am. Ass. Petrol. Geol. Mem. 2006, 84, 293–350. [Google Scholar]
- Czapowski, G.; Bukowski, K. Geology and resources of salt deposits in Poland: The state of the art. Geol. Quart. 2010, 54, 509–518. [Google Scholar]
- Szybist, A. Przekrój geologiczny A–A (bezpośrednie otoczenie poprzeczni Mina) Skala 1:200. In Proceedings of the Projekt Techniczny Likwidacji Poprzeczni Mina na Odcinku od Tamy Wodnej do Tamy T-4 w Kopalni Soli “Wieliczka”, Akademia Górniczo-Hutnicza, Wydział Wiertnictwa, Nafty i Gazu. Kraków, Poland, 26 October 2011. [Google Scholar]
- D’Obyrn, K.; Postawa, A. Selected hydrochemical ratios of waters from inflows at level VI in “Wieliczka” Salt Mine. Geology Geophys. Environ. 2013, 39, 163–174. [Google Scholar]
- D’Obyrn, K.; Postawa, A. Assessment of the qualitative and quantitative stability of “Wieliczka” Salt Mine (Poland) brines and of their possible use for medicinal purposes. Geol. Quart. 2014, 58, 459–464. [Google Scholar] [CrossRef][Green Version]
- Loj, M.; Porzucek, S. Detailed analysis of the gravitational effects caused by the buildings in microgravity survey. Acta Geophys. 2019, 67, 1799–1807. [Google Scholar] [CrossRef]
- Moritz, H. Geodetic Reference System 1980. Bull. Geod. 1984, 58, 388–398. [Google Scholar] [CrossRef]
- Brudnik, K.; Jakiel, K.; Przybyło, J. Charakterystyka hydrogeologiczna górotworu północnego przedpola poprzeczni Mina. In Proceedings of the III Spotkania Polskiego Stowarzyszenia Górnictwa Solnego, Wieliczka, Poland, 18–19 September 1995; pp. 107–108. [Google Scholar]
- Pringle, J.K.; Styles, P.; Howell, C.P.; Branston, M.W.; Furner, R.; Toon, S.M. Long-term time-lapse microgravity and geotechnical monitoring of relict salt mines, Marston, Cheshire, UK. Geophysics 2008, 77, B287–B294. [Google Scholar] [CrossRef]
- Maj, A.; Kortas, G.; Ulmaniec, P. Ground uplift after the closure of water leaks in the Mina drift of the Wieliczka Salt Mine. Geol. Geophys. Environ. 2012, 38, 9–22. [Google Scholar] [CrossRef][Green Version]
Publisher’s Note: MDPI stays neutral with regard to jurisdictional claims in published maps and institutional affiliations. |
© 2022 by the authors. Licensee MDPI, Basel, Switzerland. This article is an open access article distributed under the terms and conditions of the Creative Commons Attribution (CC BY) license (https://creativecommons.org/licenses/by/4.0/).