Article

Quantitative Analysis of Cenozoic Extension in the Qiongdongnan Basin, South China Sea: Insight on Tectonic Control for Hydrocarbon Reservoir Accumulation and Formation

1
Guangzhou Marine Geological Survey, National Engineering Research Center for Gas Hydrate Exploration and Development, Guangzhou 511458, China
2
Southern Marine Science and Engineering Guangdong Laboratory (Guangzhou), Guangzhou 511458, China
3
Beijing Institute of Research, China National Offshore Oil Corporation (CNOOC) Limited, Beijing 571000, China
4
Institute of Deep-Sea Science and Engineering, Chinese Academy of Sciences, Sanya 572000, China
5
Hainan Branch of China National Offshore Oil Corporation (CNOOC) Limited, Haikou 571000, China
*
Author to whom correspondence should be addressed.
Energies 2022, 15(11), 4011; https://doi.org/10.3390/en15114011
Submission received: 7 April 2022 / Revised: 10 May 2022 / Accepted: 20 May 2022 / Published: 30 May 2022
(This article belongs to the Special Issue Natural Gas Hydrate and Deep-Water Hydrocarbon Exploration)

Abstract

:
Cenozoic extension rates were calculated based on 20 seismic profiles across the Qiongdongnan Basin, South China Sea. The results confirmed that the Cenozoic rifting in the Qiongdongnan Basin exhibited multistage extension and spatiotemporal variation. In terms of the N–S striking seismic profiles, the structural forms of the northern and southern sags of the basin were characterized by narrow half grabens, while the structure at the center sag of the basin was characterized by wide and gentle grabens. The fault strikes in the west of the basin were mainly northeast–southwest trending, whereas those in the east of the basin changed from northeast–southwest trending to nearly east–west trending. The extension rate in the east sag was higher than that in the west area. The extension rate in the middle part was lower relative to the east and west sags. This was because the rifting was controlled by the distribution of the main boundary fault along the basin. Temporally, the Cenozoic extension could be divided into three periods: Eocene, Oligocene, and Miocene. The amount of stretching in the three extension stages was unevenly distributed in the entire basin. The maximum was mainly in the Oligocene Lingshui and Yacheng Formations. The Oligocene extension occurred in the entire basin, and the Eocene extension was limited to the Ledong and Changchang sags. Significant fault activity could be observed during the deposition period of the Yacheng and Lingshui Formations and could be attributed to strong extensional activity. The rifting tectonics controlled the distribution of source rocks and oil-generating window as well as hydrocarbon generation, reservoir formation, and accumulation.

1. Introduction

In recent years, mathematical methods have been applied in petroleum geology. Quantitative calculation data play an increasingly important role in petroleum systems [1,2]. Studies on petroleum geology are conducted using complete data models [3,4]. A complete data model is typically adopted to contrast between petroleum geological data. Although the volume of data reported herein does not reach the standards of mass (significant amounts of data), the data are nonetheless geological big data (focus on the whole, on efficiency, and on the correlation). The conventional method is based on causality, whereas the method of big data studies correlations [5]. Typically, reasoning involves human factors, and the result of reasoning may be incorrect when analyzing causes and results. However, petroleum geology data are objective and are not affected by human factors. Human factors are involved only when a causal relationship is explored. Big data research can aid conventional data research and thus promote the progress of science and technology [6]. The transformation from conventional data research to big data research and from theory-driven models to data-driven models represents a significant change in research methods and ideas, paving the way for new scientific innovations in the field of petroleum geology [6].
The fault system in the Qiongdongnan Basin can be divided into three groups based on the strikes: NE-trending, NE-trending, and nearly EW-trending faults (Figure 1). The NE-trending faults are dominant. The fault strikes in the western part are mainly NNE trending, while those in the eastern part are mainly EW trending. Seismic data have shown a decrease in the fault activity since the Middle Miocene. Spatially, the fault strikes are mainly east trending in the north of the west area and nearly east–west trending in the east area (Figure 2 and Figure 3). Currently, the Qiongdongnan Basin has a wide exploration area with various datasets including massive amounts of geological, geophysical, drilling well, logging, cutting, and on-site observation data [7,8,9,10,11]. Such data are not only expected to open new directions for the study area, but can also promote the interdisciplinary field of mathematical geology and petroleum geology [12].
Basin extension is an important parameter in quantitative extensional basin modeling, which describes the relationship between lithospheric dynamics and basin structural characteristics, and how to determine the basin extension is an important link [13,14]. Generally, when the restoration of balance is carried out, only the extension of the master fault caused by the Earth’s crust is calculated, and small faults are often ignored, particularly unrecognized faults that are difficult to identify from the seismic wave profile. Previous studies have shown that the cumulative extension of small faults that are difficult to identify at the seismic section can be as high as 30% of the basin extension [15]. If these small faults are ignored, the calculated basin extension can have considerable errors, which can affect the analysis results of the tectonic evolution of the entire basin. Therefore, it is necessary to calculate the amount of displacement of small faults.
In this study, the Cenozoic extension rates were calculated based on 20 seismic profiles across the Qiongdongnan Basin, South China Sea. The fractal stretching quantity calculation method was used to estimate the cumulative extension of the small faults in this region. Additionally, we discuss the contribution of the rifting tectonics to the distribution of source rocks and oil-generating window as well as the accumulation and formation of hydrocarbon reservoirs in the basin.

2. Geological Background

The Qiongdongnan Basin is a Cenozoic rift basin that developed above the pre-Paleogene basement and experienced syn-rifting and post-rifting thermal subsidence [7,14,16,17,18]. Generally, it is shown as the east–west structural zone. The sags in the two sides of this basin mainly comprise half grabens, e.g., the Yabei sag and Beijiao sag. However, some sags in the central part of the basin can be characterized by graben structures (Figure 1 and Figure 2). In the east–west direction, the western basin is dominated by half grabens, whereas the eastern part has graben structures [3,4,19]. Four first-order structural units are the northern depression belt, the central uplift zone, the central depression zone, and the southern uplift zone from north to south, respectively (Figure 1, Figure 2 and Figure 3).
The formation and evolution of the Qiongdongnan Basin are affected by regional tectonics such as the Indo–Eurasian plate collision, south China continental margin rift, and South China Sea spreading. An initial rift developed in the northern margin since the Eocene, mainly distributed in the NNE–NE direction [20,21,22]. In the early Oligocene, the subsidence of the Qiongdongnan Basin was intensified by the Indo–Eurasian plate rotary extrusion and Indochina extrusion [23,24,25]. In the late Oligocene, the fault activity gradually diminished, mainly in the NW direction. The eastern region was affected by the expansion effect of the South China Sea, the mantle uplift was significant, and magmatic intrusion activity increased [9,26]. The Neogene entered the post-rift depression period, and the early basin underwent regional subsidence. Since the late Miocene, the concave boundary fault (No. 2 fault) in the northern part of the early fault accelerated the activities, which contributed to the development of a deepwater continental slope and the formation of a typical continental shelf-slope sedimentary system. The central depression belt and the southern uplift area became deepwater areas [27].
The Lower Miocene Sanya Formation and Middle Miocene Meishan Formation were mainly shallow sea deposits (Figure 4). However, the Upper Miocene Huangliu Formation in most of the basin formed a typical continental shelf-slope system and developed deepwater continental slope deposits. The central canyon in the middle part of the depression was in the peak developmental period; the turbidite channel sand and mass flow were widely distributed. The Pliocene–Quaternary Yinggehai Formation formed semi-deep-sea deposits, and large submarine fans were developed locally in the Yinggehai Formation [28].
In the past ten years, significant progress has been made in the basic research of basin tectonic evolution, basin formation, hydrocarbon generation, and reservoir formation [29,30,31]. New seismic data verified that the deep detachment in the northern continental margin of the South China Sea controls the formation of large-scale basin groups, and large-scale detachment leads to strong thinning of the crust and uplift of the asthenosphere. Thereafter, the faults lead to crustal thinning and high heat flow in deepwater areas [8,18,31], and there is large-scale rapid hydrocarbon generation from source rocks [11]. Significant breakthroughs have been made in basin exploration and large- and medium-size gas fields; for example, Lingshui 17-A and 25-B gas fields have been discovered, with exploration in the Qiongdongnan Basin entering a fast developmental period. However, the drilling results over the past two years have been rather unsatisfactory. The Lingshui 18-C medium-size gas field was discovered around the central canyon and its surrounding deepwater areas. In addition, the Songtao 34-D gas-bearing structure was discovered in the Songtao uplift north of the Songnan sag in a shallow water area. Despite the achievements made, for further breakthroughs in exploration, it is necessary to re-study the basic geological conditions of the basin and summarize and reflect the conditions and scenarios of hydrocarbon accumulation. Studying the structure and regional difference is key to hydrocarbon generation, reservoir formation, and accumulation as well as being an important factor for oil and gas exploration in the basin.

3. Data and Methods

3.1. Dataset

The NW–SE striking seismic profiles across the Qiongdongnan Basin were acquired from the CNOOC Zhanjiang Branch. Two-dimensional seismic data corresponding to an area of 36,670 km2 in combination with 3D seismic data were used in the calculation and discussion. The bin spacing of the 3D volumes was 12.5 m in the in-line direction and 25 m in the cross-line direction. Prestacked time-offset 2D seismic profiles with densities ranging from 1 km × 1 km to 3 km × 8 km were collected at the edge of the depression without 3D seismic data coverage. The parameters for the 2D line acquisition were as follows: 7.5 km long streamer, 12.5 m track distance, 2 ms sampling interval, and record length of 12 s in TWT. All the seismic data are displayed with zero phase, prestack depth migration, and SEG positive polarity, and the acoustic impedance increases downward [32].
Based on the latest drilling data from the deep waters east and west of the Qiongdongnan Basin, a comparative analysis of the oil and gas indicators, namely methane, ethane, propane, n-butane, isobutane, n-pentane, isopentane, equilibrium ratio, characteristic ratio, micromigration index, heavy hydrocarbon, light hydrocarbon to heavy hydrocarbon ratio, and drying ratio, in these waters was conducted. This was conducted to indicate the difference in hydrocarbon accumulation between the east and west.

3.2. Methods

3.2.1. Calculation of the Amount of Extension

The Move software has been widely used in structural evolution analyses. The balanced profile recovery [33] typically adopts a 2D module in the Move software, and the selected profile must be in the vertical direction toward the regional tectonic line to calculate the basin extension.
Parameters, such as the extension amount, rate of extension, and extension rate, are typically used to characterize the horizontal extension amount of the extensional basin. The profile length before deformation is denoted by L0, the length after extensional tectonic deformation is denoted by L1, and the profile length changes from L0 to L1 [34].
The formulae for the amount, rate, and rate of elongation are as follows:
ΔLi = L1iL0i
Ri = ΔLiL
ri = ΔLi/L0i
vi = ΔLiti
where ΔLi is the extension of the layer i, L1i and L0i are the length of the section after the extension and the original section length, respectively, ΔL is the total extension, Ri is the proportion of the extension rate of layer i to the total extension, Ri is the extension rate of layer i, vi is the average stretching rate of layer i, and ti is the stretching time of layer I [12].

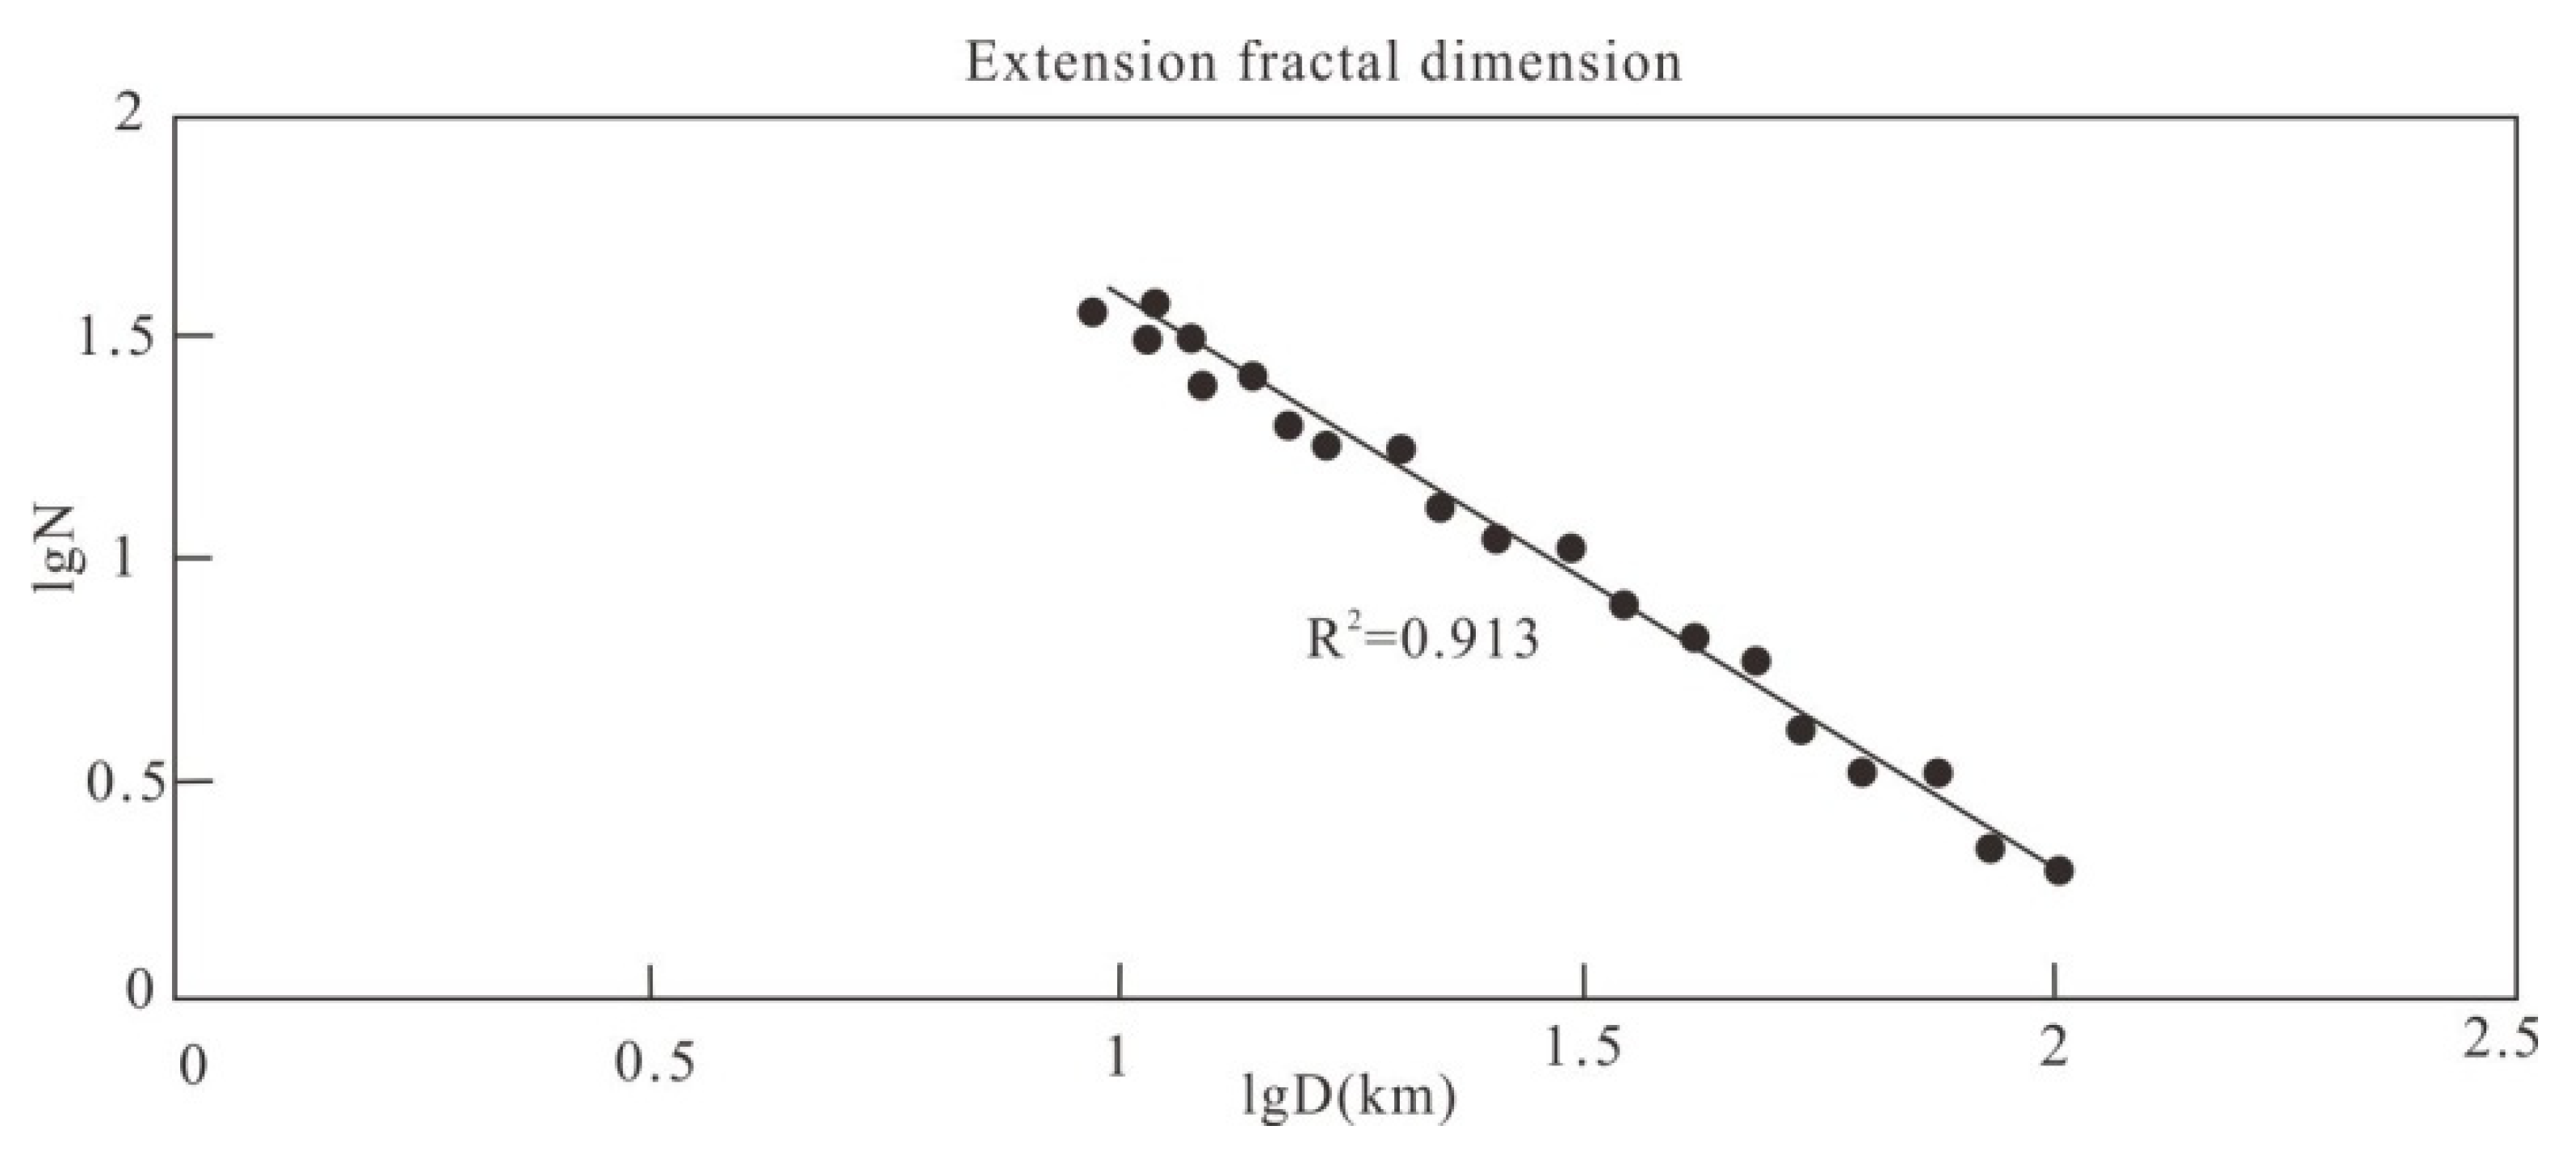
3.2.2. Fractal Computing

Basin extension is calculated using three methods: basin geothermal subsidence analysis, crustal thickness change measurement, and fault equilibrium restoration [35]. The first two methods provide results close to the actual extension. Because the third method involves producing the seismic profile, it is simple and therefore often used. The lack of consideration of the cumulative extension of small faults that cannot be resolved using seismic data is the main reason for the errors [36]. Previous studies have shown that the cumulative extension of small faults that cannot be determined by the reflected seismic data can reach 30–40% of the actual extension of the basin [15]. Therefore, the extension of these small faults cannot be ignored. As such, the method proposed by [36] was used, and the fractal theory was applied to calculate the extension amount with one survey line in the Qiongdongnan Basin as an example, yielding good results.
The number of faults and the distribution of fault moments obey the power exponential law, and they have a scale invariance; in other words, they have statistical fractal characteristics [12,37,38]:
N(D) ∝ D−C
In Equation (5), the cumulative number of faults is represented by N(D), and C is the fractal dimension.
The horizontal direction is sorted from small to large, the horizontal direction is displayed on the horizontal coordinate, and the ordinate is the corresponding serial number. A logarithmic coordinate system was established, the least squares method was used for fitting, and the negative value of the slope is the C value [3,4,39].
The fractal dimension was calculated based on the scale invariance of the fault moment distribution.
Based on the identified large faults, a fractal analysis was conducted to determine the amount of extension due to the unrecognized small faults in the reflection seismic section.
ΔL = h1 + h2 + h3 + ……+ hN = εhi
he = hN[C/(1 − C)](N + 1)[N/N + 1)]1/C
Dtotal = εhi + he
where ΔL is the cumulative slip, its unit is m, hN is the horizontal offset of the Nth major fault in the section, its unit is m, and N is the fault label value, dimensionless.

4. Results

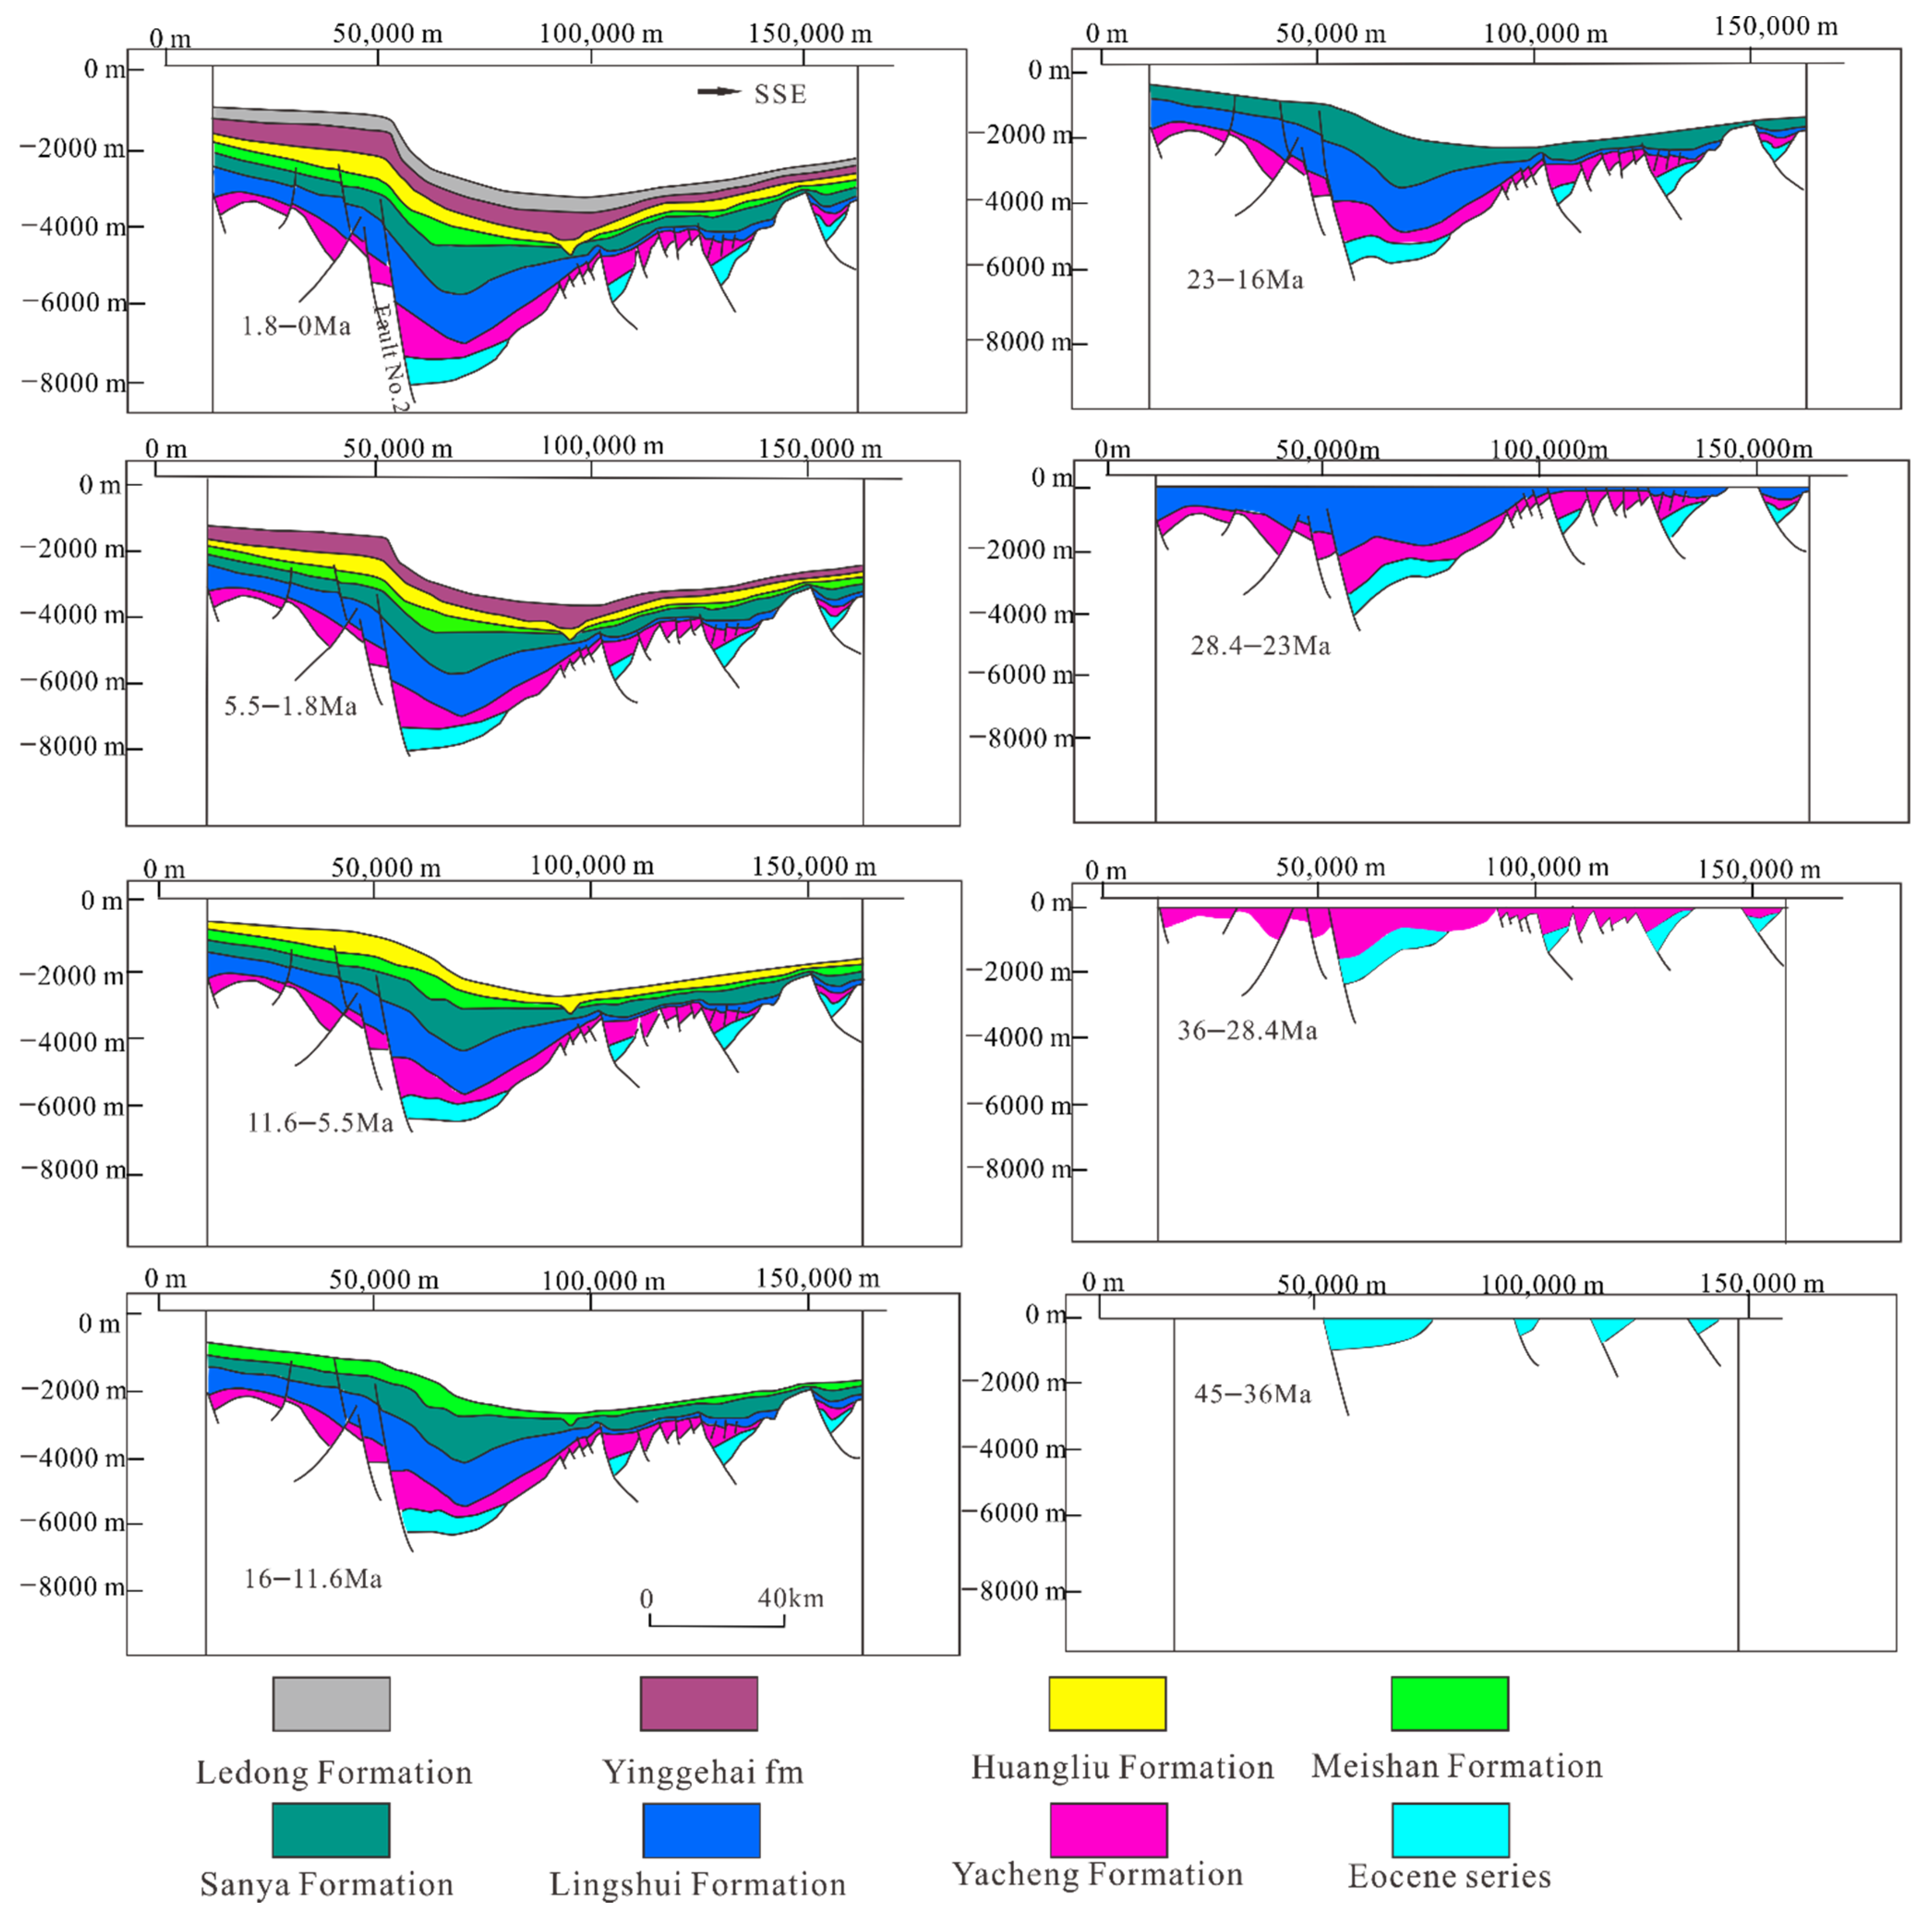
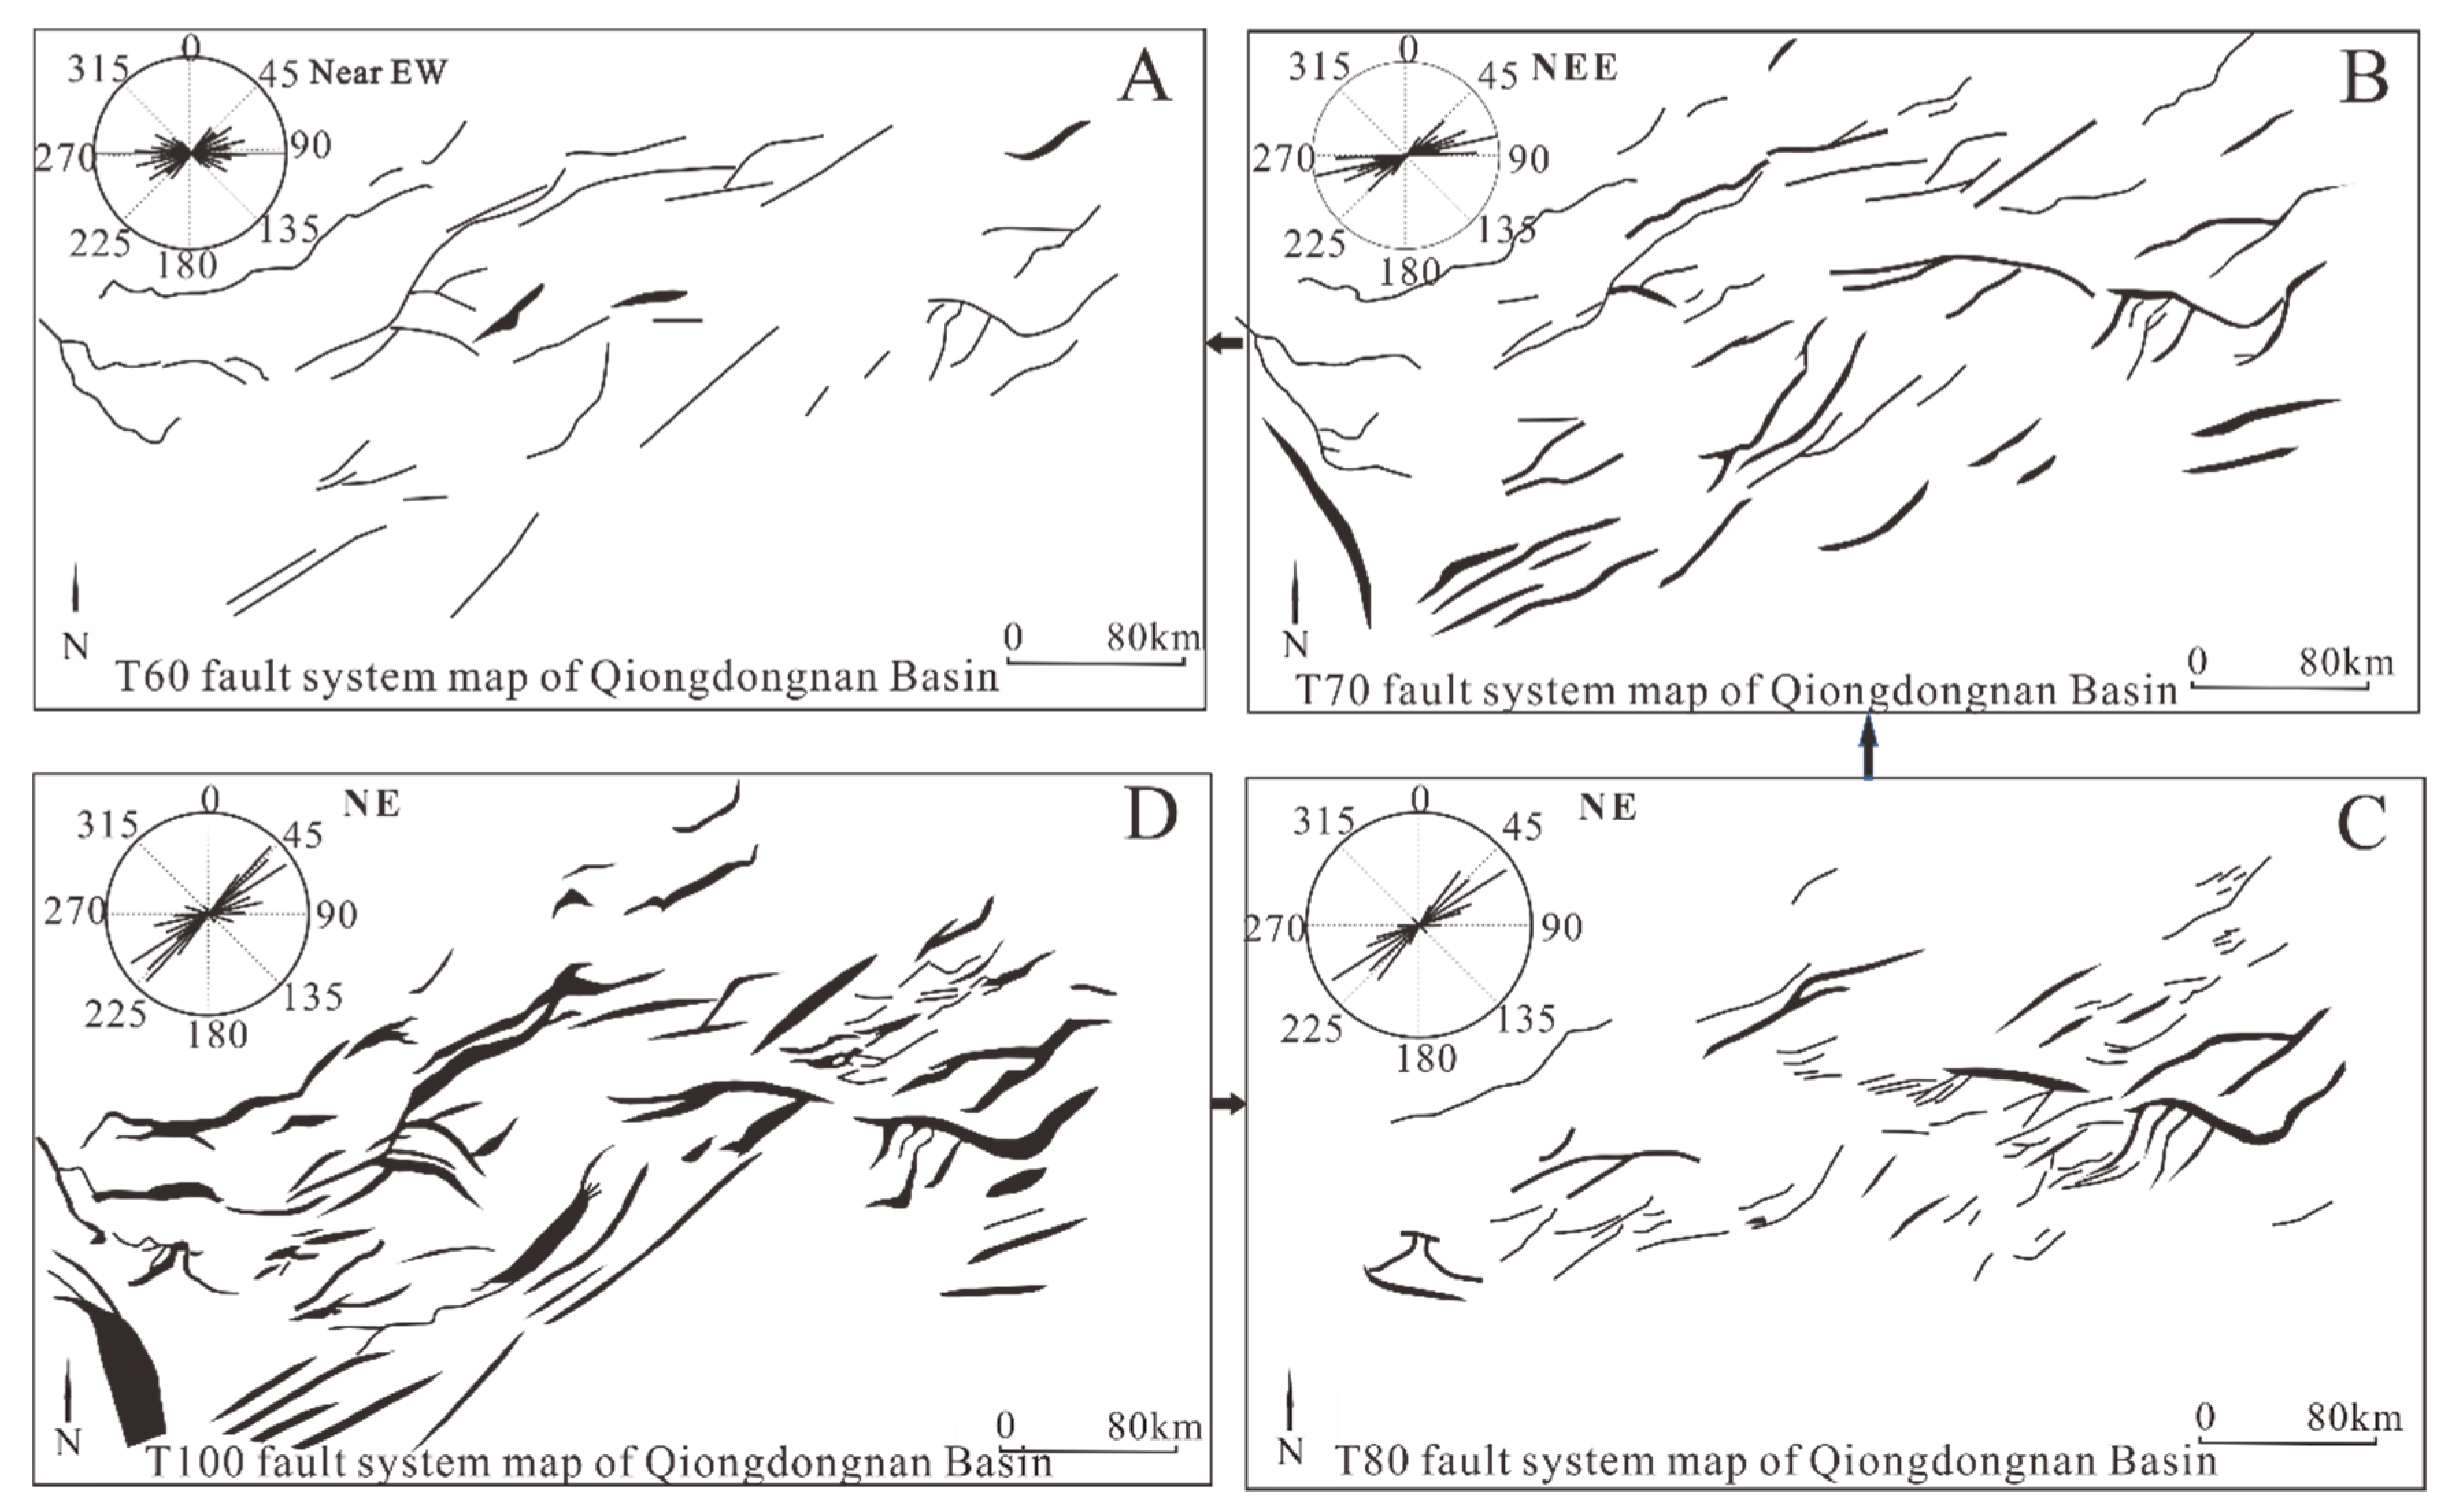
4.1. Cenozoic Nonuniform Extension in the Qiongdongnan Basin

Based on the results of the seismic section, main fractures such as fault No. 2, 5, and 11 were mainly developed in the Qiongdongnan Basin. Fault No. 2 could be divided into three segments: Ledong member, Lingshui member, and Baodao-Changchang member. As the main fault running through the Qiongdongnan Basin, from the Ledong sag in the west to the Changchang sag in the east, it is one of the most important faults in the basin. The fault began to move in the Eocene and reached its maximum rate in the Oligocene. The maximum activity rate of the fault in the Ledong sag and the Baodao-Changchang sag reached 300 m/Ma. The calculation results showed that, during 28.4–23 Ma, the extension rate was 3.02%, and the extension rate was 0.82 mm/a; during 36–28.4 Ma, the extension rate was 12.27%, and the extension rate was 2.106 mm/a, reaching the maximum; and during 45–36 Ma, the extension rate was 4.35%, and the extension rate was 0.604 mm/a (Figure 5).
The seismic sections through the Songdong sag–Baodao–Songnan low uplift–Changchang sag D–southern uplift revealed the geometry of the fractures and basin type. Vertically, the strata of the Qiongdongnan Basin could be divided into four layers from bottom to top: Eocene fault sag structure, Oligocene depression structure, Lower Miocene fault sag structure, and Middle Miocene quaternary depression structure. In the Eocene, there was a half graben structure with a fault in the north and overrunning in the south. In the Oligocene, the sag presented a recalcitration fault structure. In the late Miocene, it presented a butterfly depression structure (Figure 4 and Figure 6).
The fractal dimension of one of the survey lines in the Baodao sag was 1.3 (Figure 7). The extension was calculated to be 51.19 km (Table 1). Compared with the result (46.58 km) calculated using the Move software (Figure 6), it was found that the cumulative extension of small faults that cannot be determined by the seismic data was 9% of the actual extension; the error was within the controllable range [40]. This showed that the Move software is generally capable of modeling the extensional tectonics of the Qiongdongnan Basin [37].

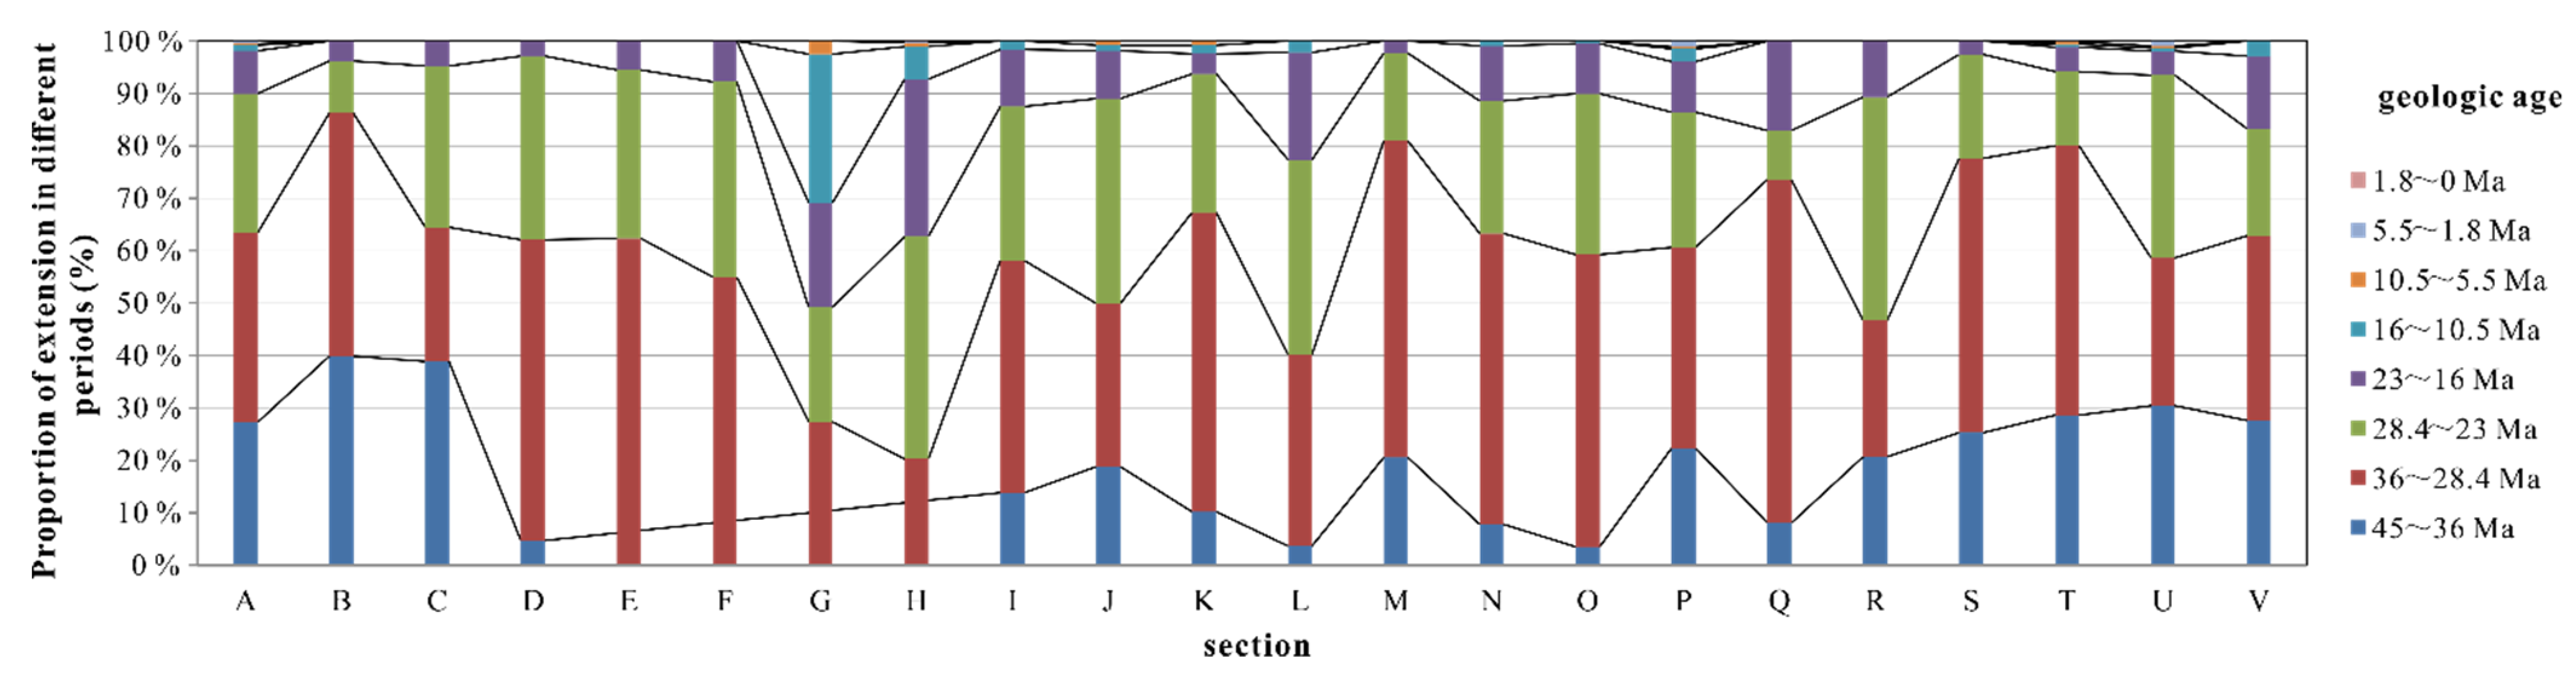
4.2. Multistage Extension of Qiongdongnan Basin

An analysis of the Cenozoic cumulative extension amount curve of the Qiongdongnan basin (Figure 8) showed that the evolution of the Cenozoic basin occurred in four stages: collapse period, depression period, fault-depression period, and passive continental margin [18]. From the Paleocene to the Eocene, the subduction direction of the Pacific plate shifted from northwest to west, which reduced the convergence rate to the Eurasian plate and formed the south China continental margin in the NW–SE extensional stress field. Under this stress field, the Qiongdongnan Basin began to crack in the Eocene to form a series of NE-trending faults, and basement faults, such as No. 2 and 5, were activated in the basin. A series of fault lacustrine basins with NE-trending grabens and half grabens developed. The lacustrine deposits formed during this period are important source rocks in the basin [27].
In the Oligocene, under the control of the regional stress field, the basin rifting scope was further expanded, and the basin turned into a depression fault structure. At the end of the Middle Eocene (approximately 42.5 Ma), the Indian plate collided completely and gradually wedged into the Eurasian plate [41]. The Indosinian block rotated and extruded to form a large-scale escape structure. As the western fault of the Qiongdongnan Basin, the red river fault exhibited a strike-slip, forming multiple extension and compression zones along both the sides of the strike-slip fault. In addition to the extensional stress field, the west area of the Qiongdongnan Basin was subjected to the tensile effect induced by the left-lateral strike-slip of the red river fault. The stress action in these two regions was mainly along the NW–SE direction, and the overall structure of the basin moved along the NE–SW direction; therefore, the extension amount of the west area along the No. 1 fault was much greater than those of the central and eastern regions. The expansion of the north–west sub-basin mainly affected the eastern part of the Qiongdongnan Basin. Several nearly EW-trending faults were developed in the eastern part of the Lingshui Formation.
In the early Miocene, the spread center of the South China Sea transited from the northwest sub-basin to the southwest sub-basin, resulting in sea movement and causing regional regression [42].
Based on the proportion diagram of the extension in different periods corresponding to each section (Figure 8), the maximum extension periods were 36–28.4 Ma and 28.4–23 Ma. Studies have shown that the period from 45 to 23 Ma was the main period of extension and deformation in the study area, and there were significant differences in the extension and deformation of the different blocks in the basin (Figure 8). Based on the proportion of extension in each period, the cumulative extension in 36–23 Ma was the highest, and it was mainly located in the Baodao-Changchang sag.

4.3. Migration of Subsidence Center in Qiongdongnan Basin

The depositional depressions in the Qiongdongnan Basin migrated regularly and spatially over time [43], and the lateral migration in each period shifted from east to west, controlling the migration of the subsidence center.
The Qiongdongnan Basin was under the control of the NE-trending active faults and NW-trending prior faults in the Changchang sag during the Eocene. The tectonic activity in the basin during the depression period was still extremely active, and a rapid subsidence occurred, particularly in the early Oligocene. Taking the subsidence analysis of the Y19 well area as an example (Figure 9), under the control of the regional stress field, the range of basin rifting was further expanded, and some areas became depression structures.
Because the spread center of the South China Sea migrated from the northwest subbasin to the southwest sub-basin in the early Miocene, the basin entered a transition period from syn-rift to thermal subsidence. The tectonic activity in the basin weakened, the thermal subsidence strengthened, the number of faults decreased, the development of the depression was uncontrolled, and the water depth rapidly increased.
In the early Oligocene, influenced by the expansion of the South China Sea, seawater entered the basin and formed a marine sedimentary environment. At this time, the basin entered the depression stage, and the fracture still played a major role in controlling the basin development. The sag fracture distribution was controlled, and each sag was relatively independent in the Oligocene. The sedimentary center was mainly located near the main fault of each sag. The basin was surrounded by Hainan uplift, Zhongjian uplift, Xisha uplift, and Shenhu uplift. The four major provenance supplies were sufficient, and thick marine–continental transitional facies and marine strata were formed in the basin. After the Miocene, the basin entered the stage of fault depression–depression, where the depression was further enhanced, the sea level increased further, and the basin was integrated. Since the Xisha uplift and Shenhu uplift gradually failed to enter the water, the supply of provenance in the south and east weakened, whereas the Hainan uplift in the north and Kunsong uplift in the west continued to provide sufficient provenance, resulting in the continuous advancement of the shelf-slope break to the southeast and the deposition of thick Miocene strata in the west of the basin. In comparison, the Miocene strata in the east gradually weakened, i.e., the sedimentary center moved to the west of the basin after the Miocene.
This migration of the sedimentary center led to a difference in the stratigraphic thickness between the eastern and western regions. In the plane, there was no significant difference in the thickness of the strata in the Paleogene at the center of each sag in the eastern and western regions of the central depression, and the strata in the Neogene were thick in the west and thin in the east. Vertically, the strata in the eastern area were thick in the Paleogene and thin in the Neogene. The thickness of the strata in the western area was not significantly different from that observed in the Paleogene.

5. Discussion

5.1. Mechanism of Uneven Distribution of the Extensional Capacity within the Qiongdongnan Basin

The rifting in the Qiongdongnan Basin was reflected in the uneven temporal and spatial distributions of the extensional amount. We inferred that the reason for the anomalous development of rifting was the varying crust thickness, and the fact that the Moho surface in the west was low, while it was high in the east [33,44,45]. The pre-existing faults in the basin also controlled the extension of the fractures.
The regional tectonic stress field deviated from the basin structure during the Cenozoic (Figure 2 and Figure 6).
An anomalous crustal structure existed between the eastern and western parts of the Qiongdongnan Basin. The upper crust layer was thin in the east and thick in the west. The low Moho surface in the west and high Moho surface in the east resulted in a difference in the basement properties between the east and west of the basin, and the difference in the basement properties led to an evident difference in the fracture structure morphologies between the east and west sags of the basin in the Paleogene. At the section, the eastern depression was V-shaped with a large number of faults, small fault spacing, and narrow depressions, while the western depression was W-shaped with a small number of faults, large scale of faults and related folds, and broad depressions. The basic reason for this difference lies in the nature of the basement and the difference in the pre-existing faults. The crust was thick in the west and thin in the east, the Moho plane was low in the west and high in the east, and the pre-existing fault was NE trending in the west and EW trending in the east. As a result, the basement lithology was rigid in the west, ductile in the east, W-shaped in the west, V-shaped in the east, and more faults were present in the east. The magmatic activity was weak in the west and strong in the east, and the heat flow field was cold in the west and hot in the east. Carbon dioxide risk was low in the west and high in the east.
No. 2 fault is a basin-controlling first-order fault running through the Qiongdongnan Basin. The activity rate map (Figure 10) shows evident differences in the activities of the faults. No. 2 fault could be divided into Ledong, Lingshui, Songnan, and Baodao-Changchang sections. The maximum activity rate of the fault in the west of the Ledong sag and the middle of the Baodao-Changchang sag was 300 m/Ma, which is conducive to the deposition of marine source rocks. The high activity rate of No. 2 fault may be related to the strike-slip of the red river fault in the west and high extension strength in the east.
The east–west block pattern in the southern part of the basin was closely related to the differences between the pre-existing faults and basement properties. In addition to the differences on the plane, there were differences longitudinally. Affected by the Shenhu movement, the Pearl–Qiong movement, the South China Sea movement, and the neotectonic movement, the basin experienced four evolution stages: collapse period, depression period, fault-depression period, and passive continental margin. This led to the formation of four different structural strata in the basin. The tectonic evolution process and regional tectonic events in the basin had a profound impact on hydrocarbon generation, reservoir formation, and accumulation.

5.2. Tectonic Control on Hydrocarbon Source, Reservoir Accumulation, and Formation in Qiongdongnan Basin

The uneven distribution of the Cenozoic extension in the Qiongdongnan Basin has a certain influence on hydrocarbon reservoir, which includes the oil source, reservoir, migration, and accumulation.
First, notably, the tectonics controlling the hydrocarbon source rocks reflected temporal and spatial characteristics (Figure 6). Temporally, the tectonic evolution of the basin controlled the development sequence of three source rocks in the basin. Affected by the Pacific plate subduction and retreat and the Indo–Eurasian plate collision, a NW–SE-trending regional tensile stress field was formed along the continental margin of south China since the Paleogene. Under the action of this stress field, the basin began to collapse in the Mesozoic basement, a series of NE–SW faults were formed in the continental margin, and the Eocene lacustrine source rocks were developed in the basin controlled by the rifting faults. Although there has been no drilling to reveal the formation, the seismic and oil and gas data indicate its existence. Seismic data showed a set of low-frequency, medium-continuous, and strong reflection strata on the basement of the basin, consistent with the seismic characteristics of the middle-deep lacustrine facies of the Eocene in the Qiongdongnan Basin. Crude oil rich in C30-4 methyl steranes and large amounts of oil-type gases with an ethane carbon isotope distribution between −28‰ and −33‰ were found in several wells in the northern and southern basins, confirming the existence of source rocks (Figure 2).
Spatially, the tectonic effect manifested in the control of the structure on the distribution and types of source rocks. The development of two groups of pre-existing faults could be seen in the basin, and they struck nearly EW in the east area and NE–SW in the west area. During the fault depression period, the basin was affected by the NW–SE-trending tensile stress field, and the pre-existing fault strike in the western region was perpendicular to the main stress field, thus forming a NE–SW-trending fault system. This system controlled the NE–SW distribution of the Eocene lacustrine source rocks in the western region, and the maximum deposit center of the source rocks was located near the fault. The strike of the pre-existing fault in the eastern region obliquely intersected with the main stress field; hence, the distribution of the lacustrine source rocks in the Eocene did not show a NE–SW pattern; however, the thickness center was mostly near the fault. On the other hand, because of the weak basement and earlier and stronger extension in the eastern region, the Eocene source rocks were more widely distributed in the eastern region. Therefore, in the fault-depression period, this control effect was mainly reflected in the distribution of the lacustrine source rocks by fault differential activities. In the depression period, this controlling effect was mainly reflected the control of the structure on the distribution and type of source rocks. In the early Oligocene, influenced by the expansion of the South China Sea, seawater entered the Qiongdongnan Basin from the east of the Xisha trough, which was bound to cause the development of marine source rocks in the eastern basin earlier than that in the western basin. In addition to this regional tectonic event, the difference in the fault activity in the basin had a profound impact on the development of hydrocarbon sources. For example, fault No. 2 and 11 in the early Oligocene continued to exhibit strong activity, resulting in a significant uplift and erosion of the central low uplift area. Here, fault No. 2 was active in the southeast part of Songnan, fault No. 11 was more active in the middle part than at both sides, and fault No. 11 had a stronger activity than fault No. 2 in Songnan. This led to a greater uplift of the west side of the Songnan low uplift than the east side, and the uplift of the south side was higher than that of the north side, i.e., the southwest was high, and the northeast was low. The southwest was uplifted and eroded more strongly. Several land sources were transported to the northeast along the slope, and seven (fan) deltas and coastal clastic sedimentary bodies were formed in the northeast. Terrigenous organic matter was also transported to the Songnan–Baodao sag by the river delta, forming a high-quality terrigenous marine hydrocarbon source.
Second, the four-stage tectonic forms had a controlled hydrocarbon reservoir model (Figure 11). The four types of reservoirs are as follows: (i) buried hill reservoirs above the basement high, such as Yongle 8 area of the Songnan low uplift and Yacheng uplift; (ii) fan delta reservoir at the center of the fault basin, such as the southern slope belt of the Songxi sag; (iii) turbidite channel-submarine fan reservoir; and (iv) carbonate reservoir at the basement uplift or seamounts in the south uplift. Tectonic uplifts controlled the occurrence of the buried hill and fracture system and carbonate platform development. The tectonic subsidence in the sag could control the submarine fan delta reservoir. The Neogene turbidite channel system had been limited by the west–east fracture structures [9].
Third, oil and gas migration has been considered a key factor for reservoir oil and gas migration in the Qiongdongnan Basin (Figure 11). The fluid potential field is the energy field controlling underground fluid migration, and the structure is an important factor controlling the fluid potential. The Cenozoic multistage tectonic movement controlled the formation and re-regulation of the pore fluid pressure inside the system, thereby changing the elastic energy and fluid potential difference. The center of the depression was a high-elastic-energy area. The low-potential area was the slope-low bulge–bulge area. The opening and closing of the faults and the continuity in the sand body distribution manifested in the varying interface energy due to the change in the pore throat, and finally, the fluid potential in the system varied. The Songnan low uplift was a relatively weak area of diagenesis in the region, and it was also a low potential area for the interfacial energy. Multistage tectonic movement controls the formation and transformation of the topography in deepwater areas, resulting in an elevation difference between the source and the circle, and the fluid between them has a gravitational potential energy. Under the control of the Cenozoic tectonic movement, the basin system witnessed the formation of a fault-sand body-tectonic ridge, other transport channels, and various transport system frameworks, indirectly controlling the spatial form of the fluid potential.

6. Conclusions

The rifting of the Qiongdongnan Basin had been in a continuous extension process during the Cenozoic, with different extension rates. The period of 45–23 Ma was the main period of extension deformation in the study area, and there was an extension peak during 36–23 Ma, after which the extension and extension rate gradually decreased. Up to 23 Ma, the fault activity was weak, the strength of the extension deformation was low, the extension and extension rate were low, and there was little difference between the different regions. Since the Miocene (10.5 Ma), the evolution of the entire basin had entered a new stage, where the slow thermal subsidence after cracking was different and the basin sedimentation rate suddenly accelerated; in particular, the shelf-slope broke into deep waters, and the basin settlement evidently accelerated, accommodating more space; however, because of the influence of the source factors, the sedimentary strata in the southern part of the basin were relatively thin.
The spatiotemporal distribution of the Cenozoic extension in the Qiongdongnan Basin was uneven. Spatially, the extension rate in the west depression was higher than that in the east depression, mainly due to the fault displacement of the main boundary of the basin, and the extension corresponding to the larger displacement of the main boundary fault was high. The horizontal stretching movement could be divided into three periods: Eocene, Oligocene, and Miocene.
The displacement distribution of the faults had a self-similar structure, called the fractal feature. This feature provides the fractal dimension method for calculating the extensional amount of extensional basins, outlining the total contribution of small faults, and compensating for the difference in the results of the equilibrium restoration method. Some structural factors affected the source rock, accumulation, and reservoir model in the Qiongdongnan basin.

Author Contributions

Conceptualization, L.Z. and J.Z. (Jie Zhou); methodology, Y.Z.; software, Y.Z.; validation, Y.Z., S.W. and L.M.; formal analysis, X.L.; investigation, J.Z. (Jitian Zhu) and X.X.; resources, L.T.; data curation, J.Z. (Jie Zhou); writing—original draft preparation, Y.Z.; writing—review and editing, Y.Z.; visualization, Y.Z.; supervision, L.Z. and L.M.; project administration, L.Z.; funding acquisition, L.Z. All authors have read and agreed to the published version of the manuscript.

Funding

This study was financially supported by the Natural Science Foundation of China (U1701245), the China Geological Survey Project South China Sea Oil and Gas Resources Survey (DD20190213), the China Geological Survey Projects (DD20221700, DD20221705, DD20221708, and DD20220224), Key Special Project for Introduced Talents Team of Southern Marine Science and Engineering Guangdong Laboratory (Guangzhou) (grant number GML2019ZD0102), Key-Area Research and Development Program of Guangdong Province (2020B1111030003), and the National Science and Technology Project (2016ZX05026-002). The first author gives her thanks to the Hainan branch of CNOOC for permission to release the seismic data.

Institutional Review Board Statement

Not applicable.

Informed Consent Statement

Not applicable.

Data Availability Statement

Not applicable.

Conflicts of Interest

The authors declared that they have no conflict of interest to this work. We declare that we do not have any commercial or associative interest that represents a conflict of interest in connection with the work submitted.

References

  1. Jiao, S.T.; Zhou, Y.Z.; Zhang, Q.; Jin, W.J.; Liu, Y.P.; Wang, J. Study on intelligent discrimination of tectonic settings based on global gabbro data from GEOROC. Acta Petrol. Sin. 2018, 34, 3189–3194. (In Chinese) [Google Scholar]
  2. Zuo, R.G.; Xia, Q.L.; Wang, H.C. Compositional data analysis in the study of integrated geochemical anomalies associated with mineralization. Appl. Geochem. 2013, 28, 202–211. [Google Scholar] [CrossRef]
  3. Zhou, Y.Z.; Chen, S.; Zhang, Q.; Xiao, F.; Wang, S.G.; Liu, Y.P.; Jiao, S.T. Advances and prospects of big data and mathematical geoscience. Acta Petrol. Sin. 2018, 34, 255–263. (In Chinese) [Google Scholar]
  4. Zhou, Y.Z.; Wang, J.; Zuo, R.G.; Xiao, F.; Shen, W.J.; Wang, S.G. Machine learning, deep learning and Python language in field of geology. Acta Petrol. Sin. 2018, 34, 3173–3178. (In Chinese) [Google Scholar]
  5. Luo, Z.J.; Xiong, Y.H.; Zuo, R.G. Recognition of geochemical anomalies using a deep variational autoencoder network. Appl. Geochem. 2020, 122, 104710. [Google Scholar] [CrossRef]
  6. Xiong, Y.H.; Zuo, R.G. Recognizing multivariate geochemical anomalies for mineral exploration by combining deep learning and one-class support vector machine. Comput. Geosci. 2020, 140, 1044484. [Google Scholar] [CrossRef]
  7. He, C.; Long, G.Y.; Wu, S.M. Esimation of the stretching factors of the Qiongdongnan Basin and domino-style fault model. Geotecton. Et Metallog. 2012, 36, 204–208. (In Chinese) [Google Scholar]
  8. Shi, X.; Jiang, H.; Yang, J.; Yang, X.; Xu, H. Models of the rapid post-rift subsidence in the eastern Qiongdongnan Basin. South China Sea: Implications for the development of the deep thermal anomaly. Basin Res. 2017, 29, 340–362. [Google Scholar] [CrossRef]
  9. Sun, Z.; Wang, Z.; Sun, Z.P.; Wang, Z.W.; Zhang, W.; He, L.J. Structure and kinematic analysis of the deepwater area of the Qiongdongnan Basin through a seismic interpretation and analogue modeling experiments. Acta Oceanol. Sin. 2015, 34, 32–40. [Google Scholar] [CrossRef]
  10. Zhu, W.L.; Zhong, K.; Li, Y.C. Characteristics of hydrocarbon accumulation and exploration potential of the northern South China Sea deepwater basins. Chin. Sci. Bull 2012, 57, 3121–3129. [Google Scholar] [CrossRef] [Green Version]
  11. Zhu, W.L.; Xie, X.N.; Wang, Z.F.; Zhang, D.J.; Zhang, C.L.; Cao, L.C.; Shao, L. New insights on the origin of the basement of the Xisha Uplift, South China Sea. China Earth Sci. 2017, 60, 2214–2222. [Google Scholar] [CrossRef]
  12. Zhang, Y.; Pei, J.X.; Zhou, Y.Z.; Zhu, J.T.; Chen, Y. The application of nonlinear technique in provenance analysis and reservoir parameter prediction at the Lingshui17-2 gas field of Qiongdongnan Basin. Acta Geol. Sin. 2016, 90, 559–568. (In Chinese) [Google Scholar]
  13. Xie, X.N.; Müller, R.D.; Li, S.T.; Gong, Z.; Steinberger, B. Origin of anomalous subsidence along the northern South China Sea margin and its relationship to dynamic topography. Mar. Pet. Geol. 2006, 23, 745–765. [Google Scholar] [CrossRef]
  14. Zhao, Z.; Sun, Z.; Liu, J.; Pérez-Gussinyé, M.; Zhuo, H. The continental extension discrepancy and anomalous subsidence pattern in the western Qiongdongnan Basin, South China Sea. Earth Planet. Sci. Lett. 2018, 501, 180–191. [Google Scholar] [CrossRef]
  15. Walsh, J.; Watterson, J.; Yielding, G. The importance of smallscale faulting in regional extension. Nature 1991, 351, 391–393. [Google Scholar] [CrossRef]
  16. Ding, W.W.; Schnabel, M.; Franke, D.; Aiguo, R.; Wu, Z. Crustal structure across the northwest margin of South China Sea: Evidence for magma-poor rifting from wide-angle seismic profile. Acta Geol. Sin. 2012, 86, 854–866. [Google Scholar]
  17. Morley, C.K. Major unconformities/termination of extension events and associated surfaces in the South China Seas: Review and implications for tectonic development. J. Asian Earth Sci. 2016, 120, 62–86. [Google Scholar] [CrossRef]
  18. Zhang, Y.Z.; Xu, X.D.; Gan, J.; Zhu, J.T.; Guo, X.X.; He, X.H. Study on the geological characteristics, accumulation model and exploration direction of the giant deepwater gas field in the Qiongdongnan Basin. Acta Geol. Sin. 2017, 91, 1620–1633. (In Chinese) [Google Scholar]
  19. Hu, B.; Wang, L.; Yan, W.; Liu, S.; Cai, D.; Zhang, G.; Zhong, K.; Pei, J.; Sun, B. The tectonic evolution of the Qiongdongnan Basin in the northern margin of the South China Sea. J. Asian Earth Sci. 2013, 77, 163–182. [Google Scholar] [CrossRef]
  20. Briais, A.; Patriat, P.; Tapponier, P. Updated interpretation of margnetic anomalies and seafloor spreading stages inthe South China Sea: Implications for the tertiary tectonics of Southeast Asia. J. Geophys. Res. 1993, 98, 6299–6328. [Google Scholar] [CrossRef] [Green Version]
  21. Taylor, B.; Hayes, D.E. The tectonic evolution of the South China Basin. In The Tectonic and Geologic Evolution of Southeast Asian Seas and Islands: Part 2; Hayes, D.E., Ed.; Geophysical Monograph Series 27; American Geophysical Union: Washington, DC, USA, 1983; pp. 23–56. [Google Scholar]
  22. Yang, J.; Cheng, Q.M. A comparative study of independent component analysis with principal component analysis in geological objects identification. Part II: A case study of Pinghe District, Fujian, China. J. Geochem. Explor. 2015, 149, 136–146. [Google Scholar] [CrossRef]
  23. Pellegrino, A.G.; Zhang, B.; Speranza, F.; Maniscalco, R.; Yin, C.; Moreno, H.C.; Winkler, A. Tectonics and Paleomagnetic Rotation Pattern of Yunnan (24° N–25° N, China): Gaoligong Fault Shear Versus Megablock Drift. Tectonics 2018, 37, 1524–1551. [Google Scholar] [CrossRef]
  24. Speranza, F.; Pellegrino, A.G.; Zhang, B.; Maniscalco, R.; Chen, S.; Moreno, C.H. Paleomagnetic Evidence for 25–15 Ma Crust Fragmentation of North Indochina (23–26° N): Consequence of Collision With Greater India NE Corner? Geochem. Geophys. Geosyst. 2019, 20, 5425–5448. [Google Scholar] [CrossRef]
  25. Tapponnier, P.; Peltzer, G.; Dain, A.Y.L.; Armijo, R. Propagating extrusion tectonics in Asia: New insights from simple experiments with plasticine. Geology 1982, 10, 611–616. [Google Scholar] [CrossRef]
  26. Xia, S.; Zhao, F.; Zhao, D.; Fan, C.; Wu, S.; Mi, L.; Sun, J.; Cao, J.; Wan, K. Crustal pluming system of post-rift magmatism in the northern margin of the South China Sea: New insight from intergrated seismology. Tectonopysics 2018, 744, 227–238. [Google Scholar] [CrossRef]
  27. Wu, S.G.; Yuang, S.Q.; Zhang, G.C.; Ma, Y.B.; Mi, L.J.; Xu, N. Seismic characteristics of a reef carbonate reservoir and implications for hydrocarbon exploration in deepwater of the Qiongdongnan Basin, northern South China Sea. Mar. Pet. Geol. 2009, 26, 817–823. [Google Scholar] [CrossRef]
  28. Zhao, Z.; Sun, Z.; Wang, Z.; Sun, Z.; Liu, J.; Zhang, C. The high resolution sedimentary filling in Qiongdongnan Basin, Northern South China Sea. Mar. Geol. 2015, 361, 11–24. [Google Scholar] [CrossRef]
  29. Franke, D.; Savva, D.; Pubellier, M.; Steuer, S.; Mouly, B.; Auxietre, J.L.; Meresse, F.; Chamot-Rooke, N. The final rifting evolution in the South China Sea. Mar. Pet. Geol. 2013, 58, 704–720. [Google Scholar] [CrossRef]
  30. Savva, D.; Pubellier, M.; Franke, D.; Chamot-Rooke, N.; Meresse, F.; Steuer, S.; Auxietre, J.L. Different expression of rifting the South China sea margins. Mar. Pet. Geol. 2014, 58, 579–598. [Google Scholar] [CrossRef]
  31. Zhao, Z. The deep mantle upwelling beneath the northwestern South China Sea: Insights from the time-varying residual subsidence in the Qiongdongnan Basin. Geosci. Front. 2021, 12, 101246. [Google Scholar] [CrossRef]
  32. Wang, L.J.; Sun, Z.; Yang, J.H.; Sun, Z.P.; Zhu, J.T.; Zhuo, H.T.; Stock, J. Seismic characteristics and evolution of post-rift igneous complexes and hydrothermal vents in the Lingshui sag (Qiongdongnan basin), northwestern South China Sea. Mar. Geol. 2019, 418, 106043. [Google Scholar] [CrossRef]
  33. Schonborn, G. Balancing cross sections with kinematic constrains: The dolomites (northern Italy). Tectonics 1999, 18, 527–545. [Google Scholar] [CrossRef]
  34. Qi, J.F.; Lu, K.Z.; Zhang, Y.W.; Yang, Q.; Liu, G.C.; Li, J.Z. The formation and evolution of kongdian high in huaghua Basin. Acta Pet. Sin. 1994, 15, 27–33. (In Chinese) [Google Scholar]
  35. Allen, P.A.; Allen, J.R. Basin Analysis: Principles & Application; Blackwell Scientific Publications: Oxford, UK, 1992; pp. 90–92. [Google Scholar]
  36. Marrett, R. Amount of extension on “small” faults: An example from the Viking graben. Geology 1992, 20, 47–50. [Google Scholar] [CrossRef]
  37. Li, T.; Zuo, R.G.; Chen, G.X. Investigating fluid-rock interaction at the hand-specimen scale via ITRAX. J. Geochem. Explor. 2019, 204, 57–65. [Google Scholar] [CrossRef]
  38. Ma, J.Y.; Xie, S.Y.; Tang, H.Y.; Ma, M.; Carranza, E.J.M.; Han, J.; He, Z.L.; Jiao, C.L.; Zhang, H. Evolution Mechanisms of Carbonate Reservoirs Based on Dissolution Rates and Multifractal Analysis of Microscopic Morphology. Nat. Resour. Res. 2020, 29, 2843–2865. [Google Scholar] [CrossRef]
  39. Cheng, Q.M. Fractal Calculus and Analysis for Characterizing Geoanomalies caused by singular Geological processes. J. Earth Sci. 2021, 32, 276–278. [Google Scholar] [CrossRef]
  40. Liu, S.W.; Wang, L.S.; Liu, B. Fractal Analysis of Extensional Quantity of the Extensional Basin. Geol. Rev. 2001, 47, 229–233. [Google Scholar]
  41. Yao, B.C.; Wan, L.; Liu, Z.H. Tectonic dynamics of Cenozoic sedimentary basins and hydrocarbon resources in the South China Sea. Earth Sci. J. China Univ. Geosci. 2004, 29, 543–549. [Google Scholar]
  42. Li, C.F.; Shi, X.; Zhou, Z.; Li, J.; Geng, J.; Chen, B. Depths to the magnetic layer bottom in the South China Sea area and their tectonic implications. Geophys. J. Int. 2010, 182, 1229–1247. [Google Scholar] [CrossRef]
  43. Kang, B. Cenozoic Subsidence and Thermal History Modelling of Qiongdongnan Basin. Ph.D. Thesis, China University of Geosciences, Wuhan, China, 2014; pp. 1–87. (In Chinese). [Google Scholar]
  44. Clift, P.; Lin, J.; Barckhausen, U. Evidence of low flexural rigidity and low viscosity lower continental crust during continental break-up in the South China Sea. Mar. Pet. Geol. 2002, 19, 951–970. [Google Scholar] [CrossRef]
  45. Qiu, X.L.; Ye, S.Y.; Wu, S.M.; Shi, X.B.; Zhou, D.; Xia, K.Y.; Flueh, E.R. Crustal structure across the Xisha trough, northwest South China Sea. Tectonophysics 2001, 341, 179–193. [Google Scholar] [CrossRef]
Figure 1. Tectonic unit of the Qiongdongnan Basin and 20 seismic track lines mentioned in the discussion (A to V indicate the section direction in sequence). Coarse line is given in Figure 2.
Energies 15 04011 g001
Figure 2. Seismic profiles across the Qiongdongnan Basin. Upper: seismic section across the Songtao bulge, Songnan sag, Yanan low uplift, Songnan low uplift, and Beijiao sag; down: seismic section across the Yabei sag, Lingshui low uplift, Lingshui sag, and Lingnan low uplift. See position in Figure 1. (The three sections from top to bottom correspond to the three lines K, N, and G, respectively, in Figure 1).
Energies 15 04011 g002
Figure 3. Interpretation of seismic profiles across the Qiongdongnan Basin. (A) Seismic section across the Yanan sag, Yanan low uplift, Ledong sag, and Lingnan low uplift, (B) seismic section across the Yabei sag, Lingshui low uplift, Lingshui sag, and Lingnan low uplift, (C) seismic section across the Songxi sag, Songtao bulge, Lingshui low uplift, Lingshui sag, Lingnan low uplift, and Ganquan sag, (D) seismic section across the Songdong sag, Songtao bulge, Songnan sag, Songnan low uplift, and Beijiao sag, and (E) seismic section across the Songdong sag, Baodao sag, Songnan low uplift, Beijiao bulge, and south uplift. (F) Seismic section across the Changchang sag, and south uplift. See position in Figure 1.
Energies 15 04011 g003
Figure 4. Cenozoic sequence framework in the Qiongdongnan Basin (blue represents mudstone, and yellow represents sandstone. Interface means the stratum interface. Sequence stratigraphy is divided into first-order, second-order, and third-order sequences. Levels 1, 2, and 3 represent the first-order, second-order, and third-order sequences, respectively.).
Energies 15 04011 g004
Figure 5. Cenozoic tectonic evolution of the Yabei–Lingshui sag–Lingnan low uplift in Qiongdongnan Basin.
Energies 15 04011 g005
Figure 6. Fracture system diagram of each tectonic layer in Qiongdongnan Basin. The faults could be divided into three groups: NE-trending, NE-trending, and nearly EW-trending faults. (A) T60 fault strikes were mainly east–west; (B) T70 strikes were nearly NEE; (C) fault T80 strikes were nearly NE; and (D) fault T100 strikes were nearly NE.
Energies 15 04011 g006
Figure 7. Logarithm plot of the horizontal fault distance D of Line 07e31033 fault vs. cumulative fault number N.
Energies 15 04011 g007
Figure 8. Extension amounts from different times and different sections in the Qiongdongnan Basin.
Energies 15 04011 g008
Figure 9. Subsidence history in Well Y19.
Energies 15 04011 g009
Figure 10. Activity analysis of No. 2 fault (No. 2 fault: as the main fault running through the Qiongdongnan Basin, No. 2 fault is one of the most important faults, running from Ledong sag in the west to Songnan-Baodao sag in the east. The fault started to be active in the Eocene and reached its maximum activity rate in the Oligocene).
Energies 15 04011 g010
Figure 11. Hydrocarbon reservoir model and fluid migration in the Qiongdongnan Basin. (a) Source rock, fluid flow and hydrocarbon reservoir in the Qiongdongnan basin. (b) Reservoir model of the QDN central channel and buried Mesozoic granite hill.
Energies 15 04011 g011aEnergies 15 04011 g011b
Table 1. Basin extension comparison based on the fractal method.
Survey LineCurrent Length of Line (km)Horizontal GraphN (km)Ԑhi (km)he (km)Calculation of Total Elongation by Fractal Method (km)Calculation of Total Extension by Equilibrium Recovery Method (km)
07e31033198.531.747.283.9151.1946.58
Publisher’s Note: MDPI stays neutral with regard to jurisdictional claims in published maps and institutional affiliations.

