1. Introduction
At the end of COP21, the Paris Agreement codified the aspiration to keep the increase in global average temperature to well below 2 °C above pre-industrial levels and to continue efforts to limit the temperature rise to 1.5 °C. It was adopted by 196 parties at COP21 in Paris on 12 December 2015, although it went into effect on 4 November 2016 [
1].
As stated by the IPCC scientists: “human activities are estimated to have caused approximately 1.0 °C of global warming above pre-industrial levels. Global warming is likely to reach 1.5 °C between 2030 and 2052 if it continues to increase at the current rate” [
2]. Around 40 billion tons of CO
2 are emitted worldwide every year (including deforestation). About half of these emissions are accumulated in the atmosphere and contribute to global warming. To stabilize Earth’s temperature, climate science climatology indicates that global greenhouse gas emissions must be first reduced and then eliminated completely. In particular, in emission scenarios compatible with the 1.5 °C target, net global CO
2 emissions reach zero around 2050, and a balance must be achieved between the absorptions and emissions of all GHGs in the second half of the century [
3,
4,
5].
Therefore, the Paris Agreement is the global political response to the evidence illustrated by the IPCC. To better frame the efforts towards this long-term goal, Article 4 of the Paris Agreement invites countries to update their nationally determined contributions (NDCs) and elaborate long-term low greenhouse gas emission development strategies (LTS) [
1].
In November 2018, the European Commission put forward its goal of a climate-neutral Europe by 2050, in line with the Governance Regulation [
6]. Both the European Parliament and the European Council approved this proposal, and in March 2020, the European Union communicated its long-term strategy and the EU target of net zero emissions by 2050 to the UNFCCC [
7]. At the same time, the European Commission has put forward a legislative proposal that aims to make the climate neutrality goal of 2050 legally binding within the EU (“European climate law” [
8]). The proposal was amended in September 2020, in line with the European Green Deal, by adding an interim climate target consisting of a reduction of net emissions of at least 55% from 1990 levels by 2030, including removals from the LULUCF sector [
9]. In December 2020, the European Union communicated its updated NDC to the UNFCCC, including the target of −55% on all greenhouse gases by 2030 [
10].
In this context, the Energy Union and Climate Action Governance Regulation established a process for the preparation of national decarbonization strategies by 2050 of member states, and an update every 10 years thereafter, consistent with member states’ integrated national energy and climate plans for the period 2021–2030 [
11].
In January 2021, the Italian government published the Italian
Long-Term Strategy (I-LTS)
on Reducing Greenhouse Gas Emissions. This process was promoted by several Italian Ministries such as the Ministry of the Environment, Land and Sea; the Ministry of Economic Development; the Ministry of Infrastructure and Transport; and the Ministry of Agricultural, Food and Forestry Policies, and involved many actors from research centers and academia with a crucial role [
12]. In fact, the I-LTS is based on studies and analyses of a technical working group made up by RSE (Ricerca sul Sistema Energetico), ISPRA (Istituto superiore per la protezione e la ricerca ambientale), GSE (Gestore Servizi Energetici), Politecnico di Milano, ENEA (Agenzia nazionale per le nuove tecnologie, l’energia e lo sviluppo economico sostenibile) and CMCC (Centro euro-Mediterraneo sui Cambiamenti Climatici). Each subject contributed its own tools and skills to the study, analyzing all the correlations, synergies and implications of the strategy.
This paper describes the studies carried out by RSE underpinning the Italian government’s LTS. The energy pathways towards 2050 Italian carbon neutrality presented in this paper are based on a sensitivity quantitative analysis performed on the different availabilities of low carbon options in the long-term. In particular, these scenarios try to grasp the impact of decreasing levels of fossil fuel consumption, from a partial to an almost complete phase-out, according to different hypotheses on the future availability of technological options (i.e., CCS, hydrogen in steel industry), renewable resource potential in the national territory (i.e., photovoltaics development) and possible behavioral changes. A predominantly renewable-based energy mix (at least 80–90% by 2050) is essential to decarbonize most of the final energy consumption, while the residual consumption of fossil fuels must be accompanied by CO2 capture. However, the strong increase of non-programmable renewable sources requires a completely different electricity system from the current one in terms of both generation mix and system management. Particular attention is therefore given to aspects such as sector coupling and the modeling of new forms of flexibility, like Power-to-X. The change in the energy paradigm of a carbon neutral scenario also highlights the spread of new zero emissions synthetic fuels like hydrogen and other renewable fuels of non-biological origin, which will be essential for decarbonizing the hard-to-abate sectors.
Many decarbonization scenarios in line with the Paris Agreement have been analyzed in recent years, providing very important guidelines [
13,
14].
The scenarios described in this paper identify the correlations among the main pillars required for the shift of the energy paradigm towards net emissions by 2050 in the Italian context and allowed us to draw lessons and principles which are valid and applicable to many other contexts. The main results of this research will also be presented at a Long-term-Scenarios for the Energy Transition (LTES) event by the IRENA [
15]. The challenge was to understand how an energy system almost completely devoid of fossil sources could function, what important changes are needed and what kind of technological and renewable source developments can be expected. From a modeling perspective, the main challenge was to understand how to model new forms of flexibility while solving any critical issues deriving from the system and technological innovations introduced.
2. Materials and Methods
2.1. Scenario Analysis
The decarbonization process is characterized by multiple factors and uncertainties that make it difficult to identify a univocal evolution of the system itself, especially with medium–long term time horizons. However, the scenario analysis allows us to explore different possible paths to reach a condition of “climate neutrality” by 2050 by analyzing trajectories based on alternative assumptions. This approach allows to identify main actions, objectives and sectors with more potential for decarbonization interventions and provide indications on infrastructural and technological needs. Scenario analysis enables the decision makers to orient themselves through this extreme complexity and uncertainty thanks to a quantitative assessment of the impacts of energy–environmental objectives and policies, the evidence of any overlaps, indications on the most promising sectors of intervention and infrastructural and technological needs.
Scenarios are not forecasts but alternative pictures of how the future could unfold and can be constrained by specific objectives to be achieved. A scenario is a coherent, internally consistent, and reasonable description of how the future might develop. It is based on a coherent and consistent set of assumptions about the key relationships and driving variables (e.g., fuel prices, technology evolution) [
16].
A scenario can represent a vision of the future towards which to strive and which therefore represents an objective. In this case, the scenario is useful for understanding the conditions (and their timing) that allow to realize a new future. This makes it possible to clarify the conditions that must occur in each stage of the time trajectory considered in order to achieve that result.
2.2. Energy and Power System Model Used
Quantitative scenarios require the use of models, i.e., a formal and mathematical representation of an energy system.
To carry out the scenario analyses of this study, we used the TIMES_RSE model, an energy model of the Markal TIMES family [
17]. TIMES (The Integrated MARKAL-EFOM System) is a model generator developed within the IEA-ETSAP (Energy Technology Systems Analysis Program), an international research network using energy scenarios modeling to carry out detailed energy and environmental analyses [
18]. In this framework, RSE has developed the TIMES_RSE model, which represents the entire Italian energy system.
TIMES_RSE is a technology rich, bottom-up model of intertemporal optimization that minimizes the total cost for the whole energy system over the entire time horizon of satisfying given demands for energy services, subject to environmental and technological or policy constraints. The equilibrium solution is found using linear programming techniques. The objective function is to minimize the global cost (more accurately, the minimum loss of surplus) required to supply a given amount of energy services. In addition to the 5 end-use sectors (agriculture, industry, residential, commercial and transport), TIMES also explicitly considers two intermediate sectors (refinery and power sector). The time horizon covered goes up to 2060. The model is used to explore the alternative evolution paths of the energy system under different technological, economic, environmental or policy assumptions and to evaluate the effectiveness of environmental and energy policies and their impact on the energy system [
19].
Using the TIMES_RSE model, we identified the best mix of energy sources and technologies that allows to meet the projected demand for energy services over the entire time horizon, and to achieve the goal of a complete decarbonization by 2050 at a minimum system cost. A predominantly renewable-based energy mix is essential to decarbonize most of the final energy consumption. However, the strong increase of non-programmable renewable sources requires particular attention to power system management and new flexibility resources.
The TIMES_RSE model only considers 12 time slices within a year, a time resolution not sufficient to describe the operability of the power system and the production variability of renewable sources over days and seasons. Therefore, this work followed a two-step approach: first, the scenario analysis for the overall Italian energy system developed with the TIMES_RSE national energy model set out the total electricity demand and indicative generation mix; then, outputs and constraints from the national model were used as inputs for a detailed study of the impact on the Italian power system, and its specific requirements were carried out with a dedicated simulation model, the sMTSIM [
20,
21,
22].
The sMTSIM (Stochastic Medium Term SIMulator developed by RSE) is a power market simulator detailed on the national market zones (north, center-north, center-south, south, Sardinia, Sicily). It determines the generation set hourly dispatch and the zonal clearing prices of the day ahead market over an annual time horizon. The solution is found by calculating the hourly marginal price for each market zone, the fuel consumption and cost for each thermal power unit, emissions of CO2 (and other pollutants) and related costs for emission allowances, revenues, variable profits and market shares of the modelled generation companies, as well as the power flows on the interconnections between market zones. The sMTSIM can also provide information about the level of inter-zonal congestion, the overgeneration amount, energy not supplied and the lack of available reserve capacity.
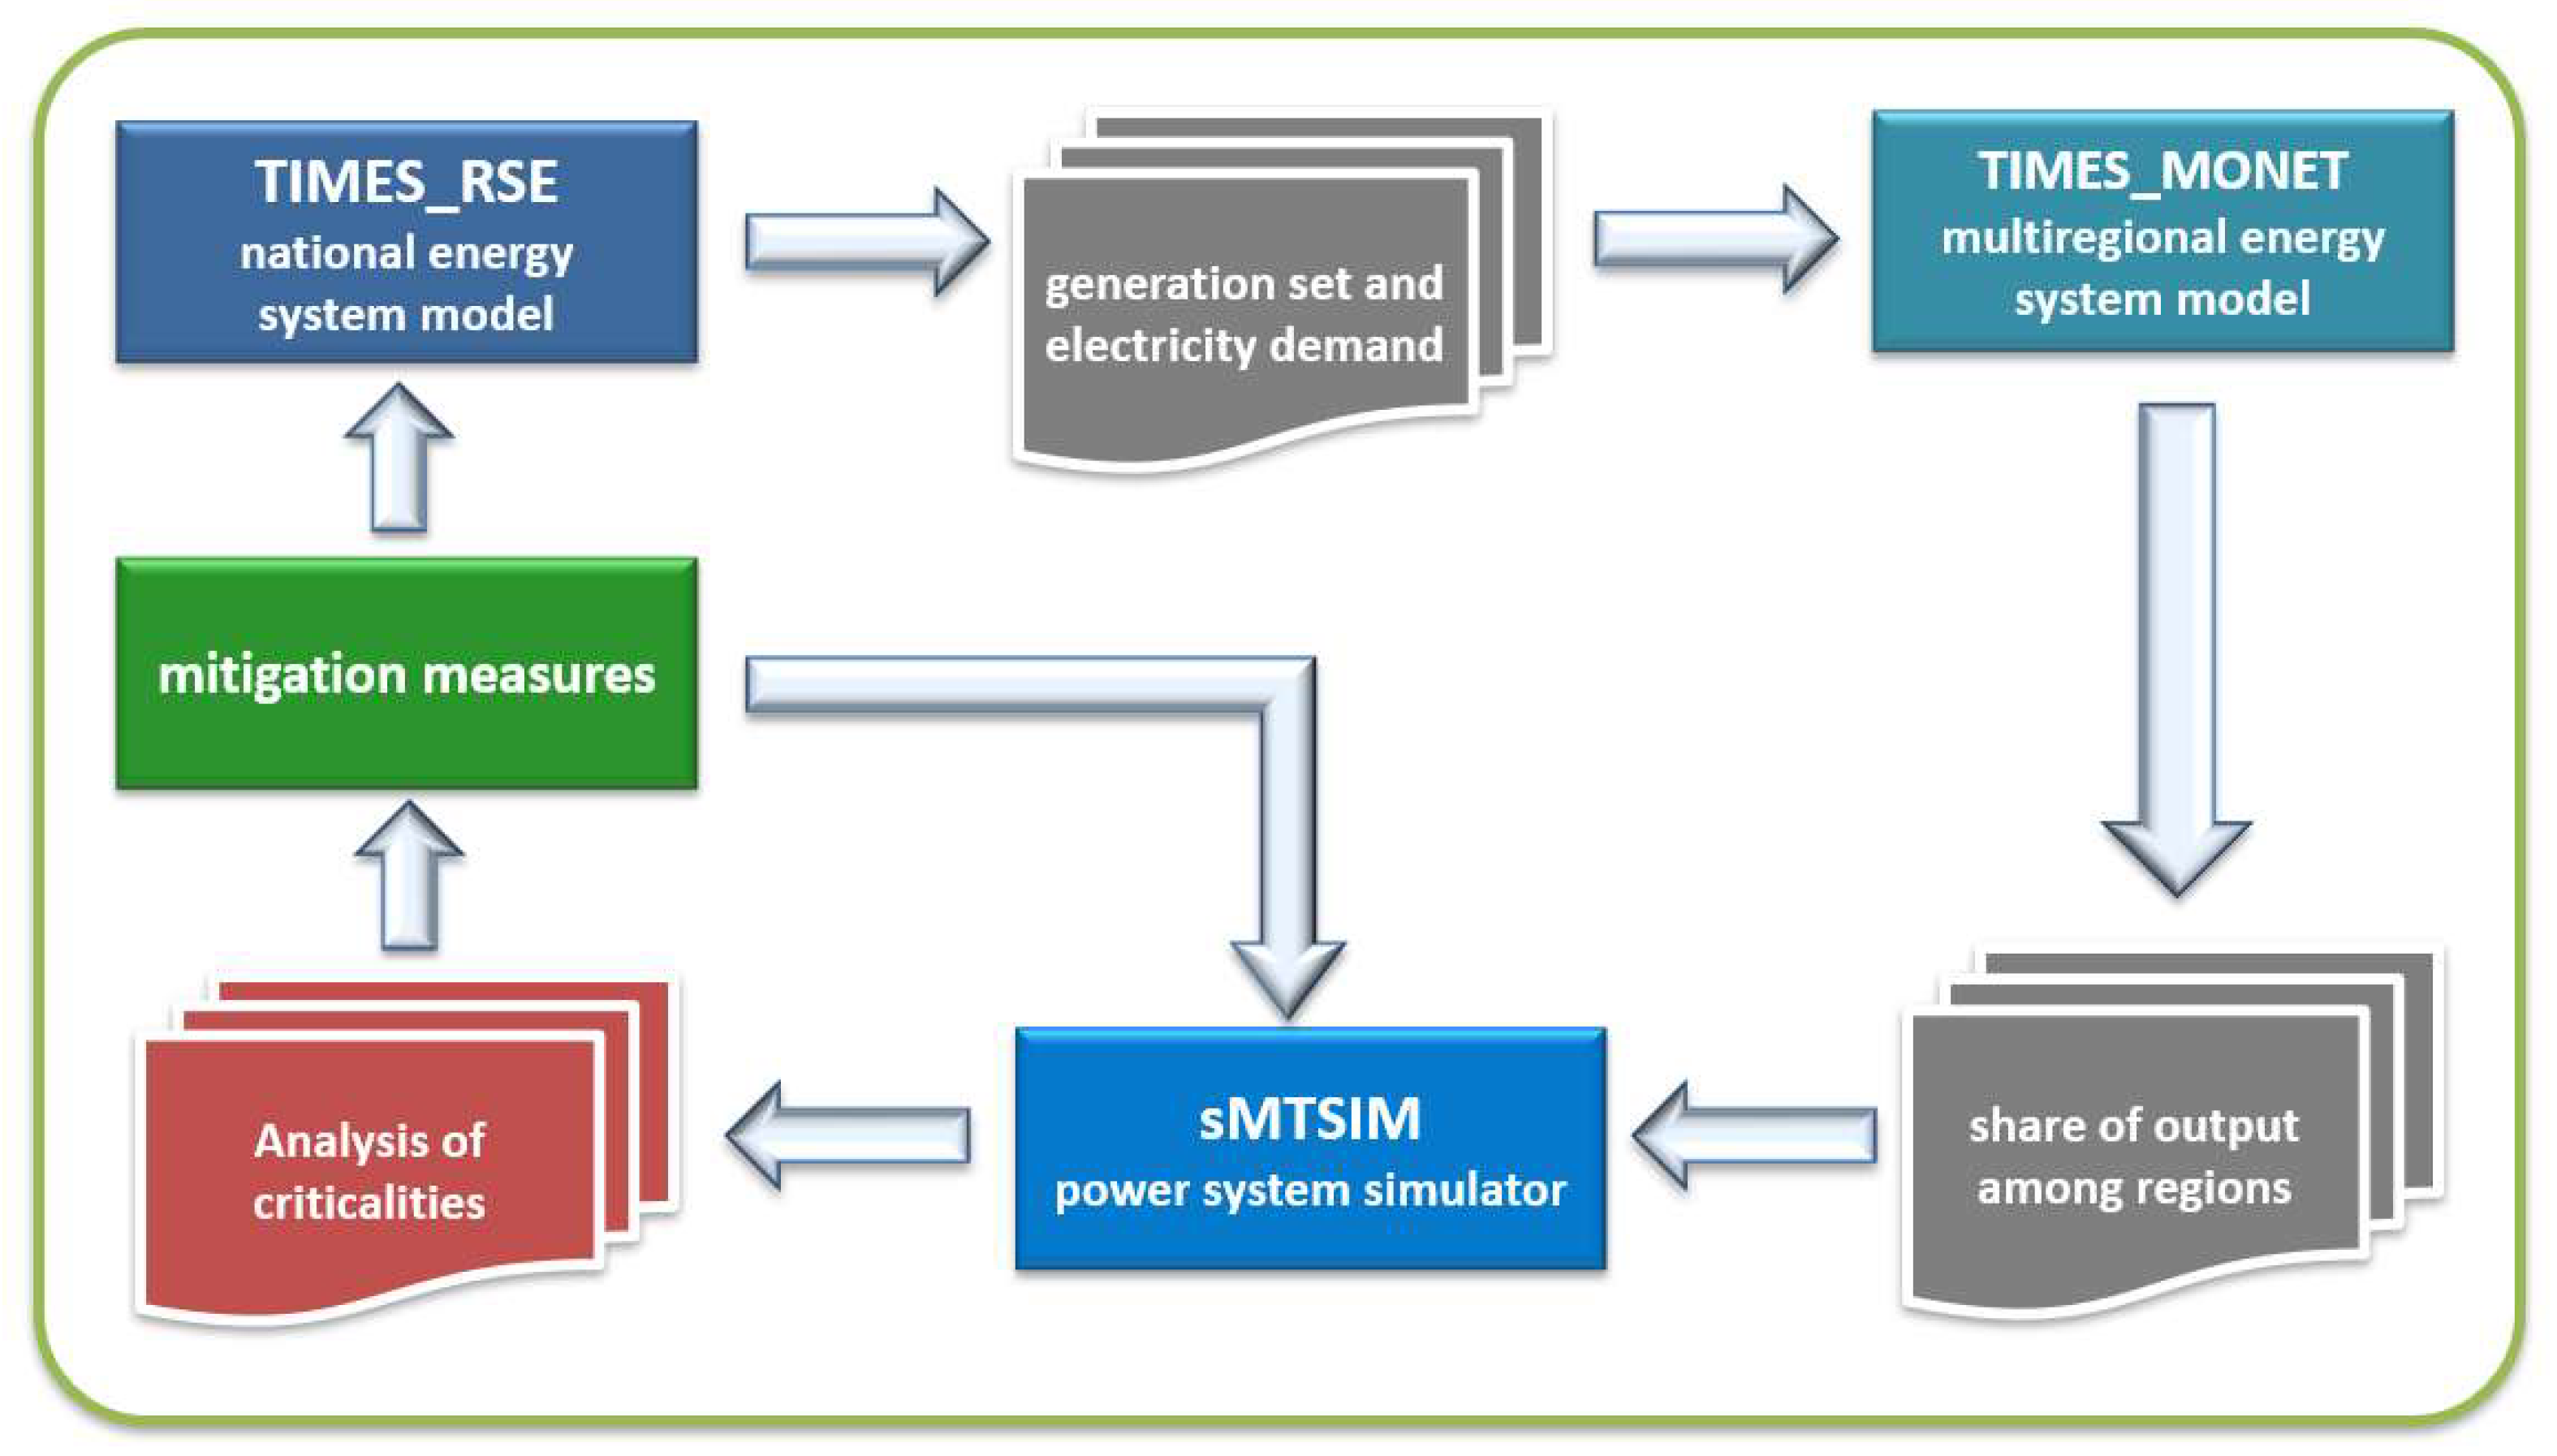
The impact analysis on the power system follows this flow path/loop (see
Figure 1):
We start from the generation capacity by sources, electricity demand by sectors and Power-to-X capacity from energy scenario by the national TIMES model;
We regionalize the national scenario with a multi-regional TIMES model, MONET [
23];
The sMTSIM runs a power system hourly simulation. In this simulation the system resources (including storage plants and P2X) are dispatched;
The emerging criticalities of the simulation results are assessed (congestion, inability to cover load peaks, excess production of variable renewables, lack of reserve margins, etc.);
Through appropriate further simulations, the effectiveness of possible interventions capable of mitigating the criticalities detected is assessed;
The optimal set of criticality mitigation interventions is selected, and the final electrical scenario is determined, including the estimate of related investments;
The main results of the final power scenario (as plant operation hours, new additional flexible capacity, electricity import variation, storage and infrastructure needs) are reported in the TIMES models for the elaboration of the overall final energy scenario.
Figure 1.
Methodology for analyzing the impact of energy scenarios on power system.
Figure 1.
Methodology for analyzing the impact of energy scenarios on power system.
2.3. Key Variables and Main Drivers
Various carbon neutral scenarios have been created by RSE with the following purpose:
Outlining a strategic path that, with a system vision, takes into consideration aspects of economic and social sustainability, efficiency, and the rational, fair and sustainable use of natural resources;
Identify the pillars of decarbonization by 2050.
TIMES model, starting from exogenous inputs on the evolution of “main drivers” affecting the evolution of the energy system, is able to determine the optimal combination (i.e., minimum cost) of energy sources and technologies that can satisfy a predetermined demand for energy services (heating/cooling, process heat, motive power, lighting, etc.). The optimization is, of course, bound by the availability of certain resources (technical potentials, capacity of the import infrastructure, natural resources, etc.) whose limits are specified ex ante.
The main assumptions underlying the energy scenario elaborated in this study concern the future trends of some key variables, or drivers, that quantitatively guide the evolution of the system and the energy service demands. The main ones are:
Demographic dynamics (population and number of families);
Economic development (evolution of GDP and sectoral added values);
The cost of energy (international prices of fossil fuels);
Lifestyle and behaviors.
The development of the system is also influenced by the national and EU political framework, especially in the medium-term, and by the possible technological evolution in terms of efficiency and costs.
To create the scenarios underlying the I-LTS, the drivers in line with the most recent national and international forecasts were used, in particular the drivers of the POTEnCIA Central scenario developed by JRC [
24]:
- -
Demographic growth, the Italian population decreasing in the long-term (
Table 1). A gradual population reduction was assumed that would bring the total population below 60 million from 2040. Reducing the members per unit, the number of households would register a slight increase in the projection period 2018–2050, in line with what has been observed in the last few years, reaching an average of 2.2 inhabitants per family in 2050.
- -
GDP and added values, consistent with demographic growth with less pronounced growth than in recent years, international fuel prices, CO
2 price of ETS price. GDP and sectoral added values are considered a proxy of production activity and therefore are the variables that drive the energy demand of the industrial, service and freight transport sectors. Overall, at the national aggregate level, GDP grows at an average annual rate of 0.70% in the 2018–2050 projection period (
Table 2 and
Table 3).
- -
Transport activity, the hypotheses on the evolution of the demand for passenger and freight mobility are particularly significant for the definition of a scenario and come from the POTEnCIA Central scenario developed by JRC—Joint Research Center. The projection of the demand for mobility services (passenger mobility and goods handling) is projected over the years according to different rates and depends on variables such as gross domestic product (GDP), population and oil prices. The scenario also contemplates travel containment measures (smart working, teleworking, videoconferencing) and shared transport measures (car sharing/pooling) which reduce the demand for passenger transport (−27% of journeys by car, +60% of journeys by train and increased use of buses in public transport) (
Table 4). All these measures, together with population decline projections, lead to a 40% reduction in the number of cars on the roads compared to current levels. Rail transport is also intensifying for goods, which helps to partially contain the increase in demand for goods transported by road and by ship.
2.4. Scenario Definition
The main binding target of the Italian Long Term Strategy, which characterized all the scenarios analyzed, is: “Net zero greenhouse gas emissions by 2050”. Three different scenarios (with the TIMES_RSE model) and a sensitivity were built with this target to analyze the impact of the increasingly challenging assumptions in terms of available alternative energies, increasing photovoltaic (PV) potential and the introduction of new synthetic zero-emissions fuels in the industry sector. The energy scenarios analyzed in this paper are:
LTS A: This first scenario envisages a cap on the PV equal to 200 GW. Fossil fuels continue to be used in power generation and in certain industrial productions thanks to the carbon capture and storage (CCS) technologies (e.g., coal for steel and oil in petrochemicals).
LTS B: This scenario considers a maximum photovoltaic capacity up to 250 GW and reduces the possibility of using petroleum products and waste for energy generation, thanks to a greater use of circular economy. Industry is also experiencing an important evolution, with the use of natural gas instead of coal in the production of integrated steel and oil products in cement.
LTS C: This scenario further increases the potential of PV (275 GW), but the main differences are in the industry where the use of petroleum products is severely limited; in particular, coal is completely eliminated and hydrogen is introduced for steel mills and some other industries (such as glass, chemicals and ceramics).
LTS Cs—sensitivity: The sensitivity of the LTS C scenario to test even more challenging assumptions for the electricity system and evaluate its resilience: 100% generation from RES with higher PV penetration (up to 300 GW), no generation from fossil gas (even if with CCS) and a reduction of imported e-fuels.
The analysis carried out shows how all these scenarios achieve climate neutrality with an energy system in equilibrium, despite the profound transformations required, especially in the electricity system, in line with the in-depth analysis of the European Commission [
14]. However, each presents its challenges in terms of costs, construction difficulties, uncertainty about the necessary technologies and the sectors most affected by the transformation.
These scenarios were created trying to satisfy the Italian energy needs without resorting to an increase in the import of energy sources compared to current levels. No analyses have been made on the future prices of commodities in neighboring countries (for example, electricity or hydrogen import from North Africa).
3. Scenario Results
In this paragraph, the results of the TIMES-RSE, TIMES-MONET and the sMTSIM optimization loop are presented. The optimization of the Italian energy system is assessed under the binding constrains presented in
Section 2.2, pursuing a minimum system cost objective function. The main outputs of the three models’ elaborations are here presented: the carbon emissions trends and energy consumption by fuel and sector; the main technologies deployed; the penetration of electricity and renewables; the evolution of the power sector in terms of technological capacity and production; the development of hydrogen and other green fuels in terms of production and consumption from end-use sectors. Some of the data presented were obtained from further elaborations outside the modeling suite (e.g., energy intensity indexes).
3.1. Carbon Emissions Pathways
By extending the virtuous energy–environmental dynamics envisaged by the National Integrated Energy and Climate Plan (I-NECP) to 2050 [
25], Italian GHG emissions can be reduced by about 60% compared to 1990 levels. In 2050, there are around 220 Mton CO
2 eq remaining which, when taking into account the removal of the LULUCF sector, fall just below 200 Mton (net) CO
2 eq. Of these residual emissions in 2050, about 70% comes from “energy uses”. Looking at “non-energy uses” covering the remaining 30%, it emerges, as already noted in the I-NECP, that it is substantially difficult to compress emissions from agriculture/livestock and industrial processes [
12].
Climate neutrality in 2050 will be a tough challenge for Italy: there will be incompressible residual emissions deriving mostly from industrial processes, the use of solvents and F-gases, waste and the agricultural and livestock sector, the so-called “hard-to-abate sectors”. The residual emissions can be offset with CO
2 sequestration and the absorption of “natural sinks” [
14]. However, policies to combat fires and sustainable soil management will have to be implemented to maintain and increment the absorption capacity of these sinks [
26].
The analysis carried out in support of the I-LTS shows that climate neutrality by 2050 is only possible with a change in the energy paradigm.
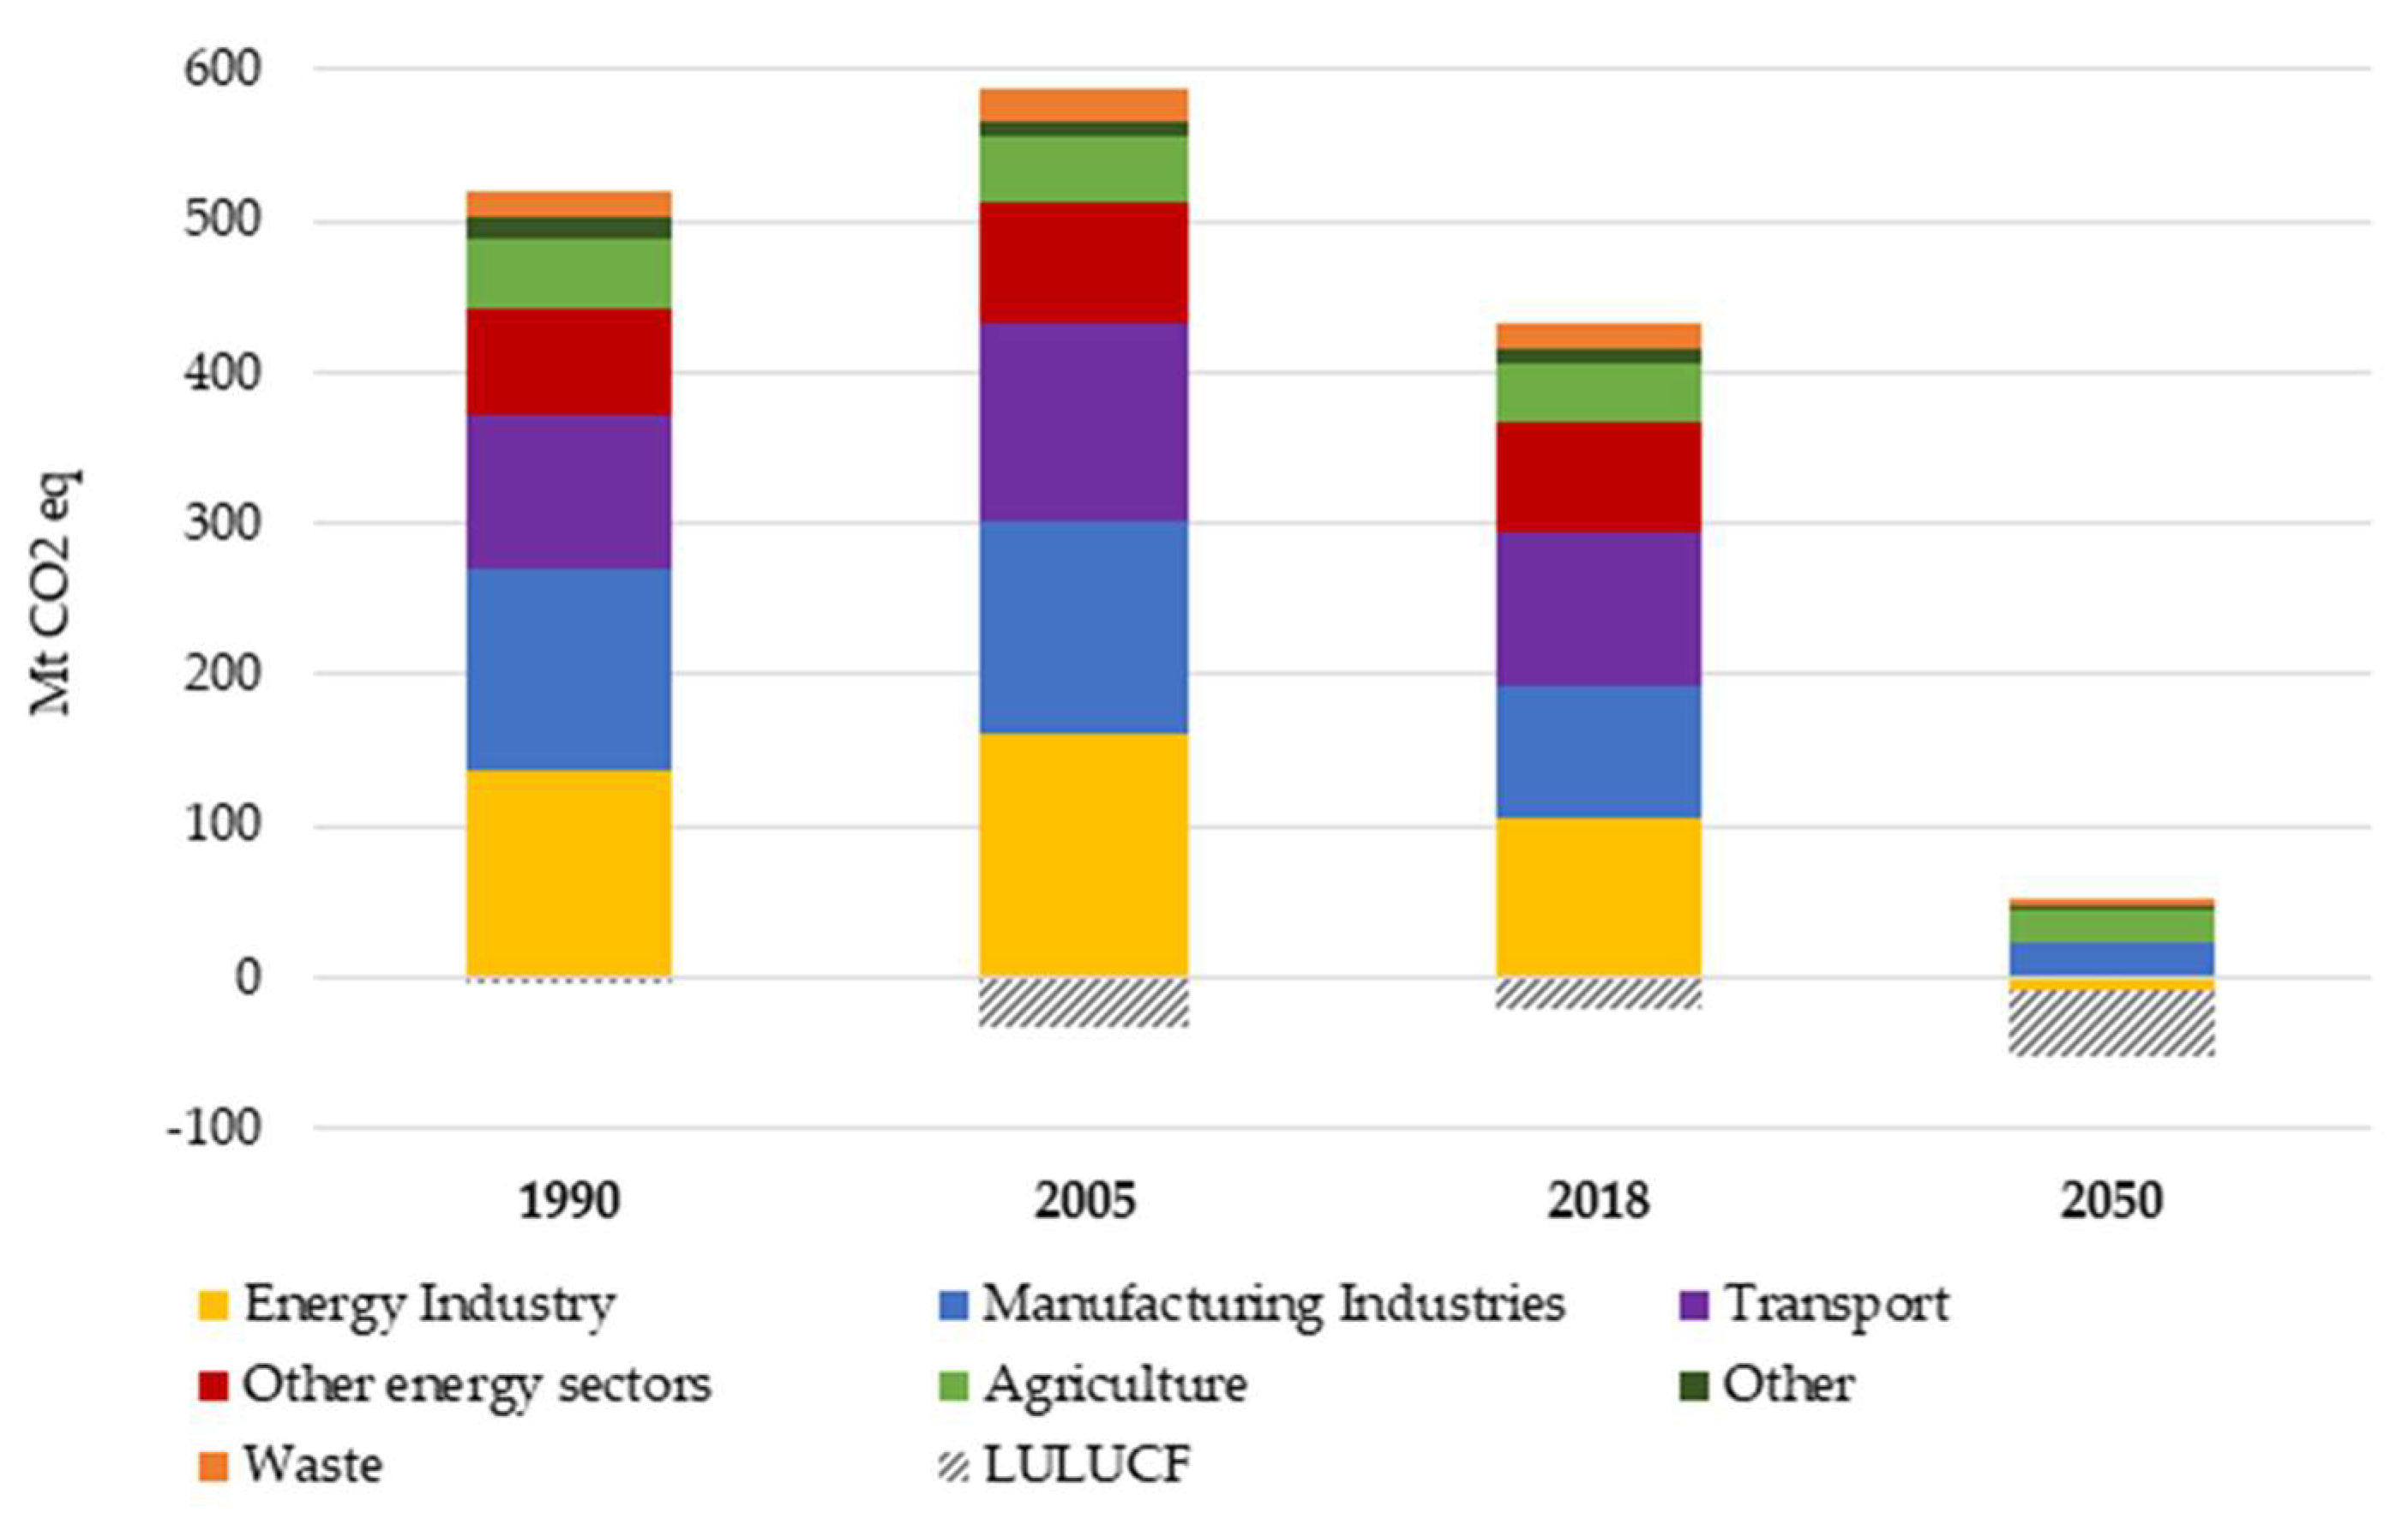
From the scenarios carried out, it emerges that each sector will have to contribute to the emission reduction according to its own peculiarities (
Figure 2), in particular:
The energy industry, in particular the power sector, has the potential to eliminate its own emissions; indeed, it can even contribute to climate neutrality with negative emissions, in line with [
27];
The manufacturing industry can contract its emissions. It needs alternative fuels and CCS for emissions deriving from industrial “processes”, but it is difficult to achieve net zero emissions, in line with [
28];
Transport and other energy sectors will necessarily have to eliminate their emissions by resorting to all possible options (efficiency, electrification, renewables and green fuels), in line with [
29,
30];
Agriculture will be the most difficult sector to decarbonize, and there will be residual emissions to be compensated with sinks [
31];
The waste sector will be able to reduce emissions by resorting to forms of circular economy [
32];
The analysis carried out by the I-LTS working group (in particular ISPRA) considers that, with adequate policies to combat fires and sustainable management of the soil, the emission removal capacity of the LULUCF sector can be brought back to an all-time high of 45 Mton CO
2 eq [
12];
CCS will be a necessary technology to offset the atmospheric emissions from hard-to-abate sectors [
28]. The amount of CO
2 captured to CCS will obviously depend on the production methods, the emergence of new technological solutions and changes in the lifestyle of citizens. In the I-LTS, a variable quantity of 20–40 Mton CO
2 eq captured to CCS has been estimated (analysis carried out by ISPRA).
Figure 2.
Greenhouse gas emissions and removal in I-LTS; Mt CO
2 eq [
25].
Figure 2.
Greenhouse gas emissions and removal in I-LTS; Mt CO
2 eq [
25].
In this emissions framework, the role of the energy sector is undoubtedly very important [
14]. Starting from the residual emission gap identified within the framework of the extended I-NECP scenario, several simulations were conducted to identify the combinations, synergies and critical issues of the potential levers to achieve climate neutrality by 2050. Reductions in net emissions can be achieved through different portfolios of the mitigation measures, in accordance with the scenarios of the European Long term strategy and illustrated in
Figure 3.
To achieve climate neutrality by 2050, the system will have to resort to fundamental levers with strong synergies between them:
Energy efficiency (in full consistency with the European “energy efficiency first” principle) accompanied by behavioral changes (more public passenger mobility and consumption awareness in residential buildings) and a circular economy [
7];
A new energy mix consisting of renewable sources and carbon-free energy carriers such as hydrogen, but also all synthetic fuels derived from hydrogen and electricity (Power-to-X);
Complete power sector decarbonization with renewable sources, but also the use of carbon capture and storage and use (CCS/CCUS) associated with biomass plants (BECCS) to achieve negative emissions;
A significant electrification of up to 55% of final consumption: in particular, electrification increases in buildings, especially for heating and cooking, and in the transport sector, driven by the high penetration of electric vehicles for cars and buses.
3.2. The Role of Energy Efficiency in a Carbon Neutral Italy
Rational energy use is a paradigm that must necessarily underpin any initiative towards carbon neutrality, as is widely documented in the literature [
33,
34,
35]. The European Commission itself has made the energy efficiency first principle a solid foundation on which the 2050 decarbonization scenarios for the European Union were built [
14].
In fact, the current energy consumption trends would be unsustainable in the future, as they could deplete the natural, technical and economic potential of energy resources, thus leading to disastrous consequences for the economy. Hence, the reduction of energy demand becomes a tool to protect the national energy system from future uncertainty (e.g., energy price volatility, geopolitical crises), which is a key aspect in the Italian context where energy dependance reaches 80%.
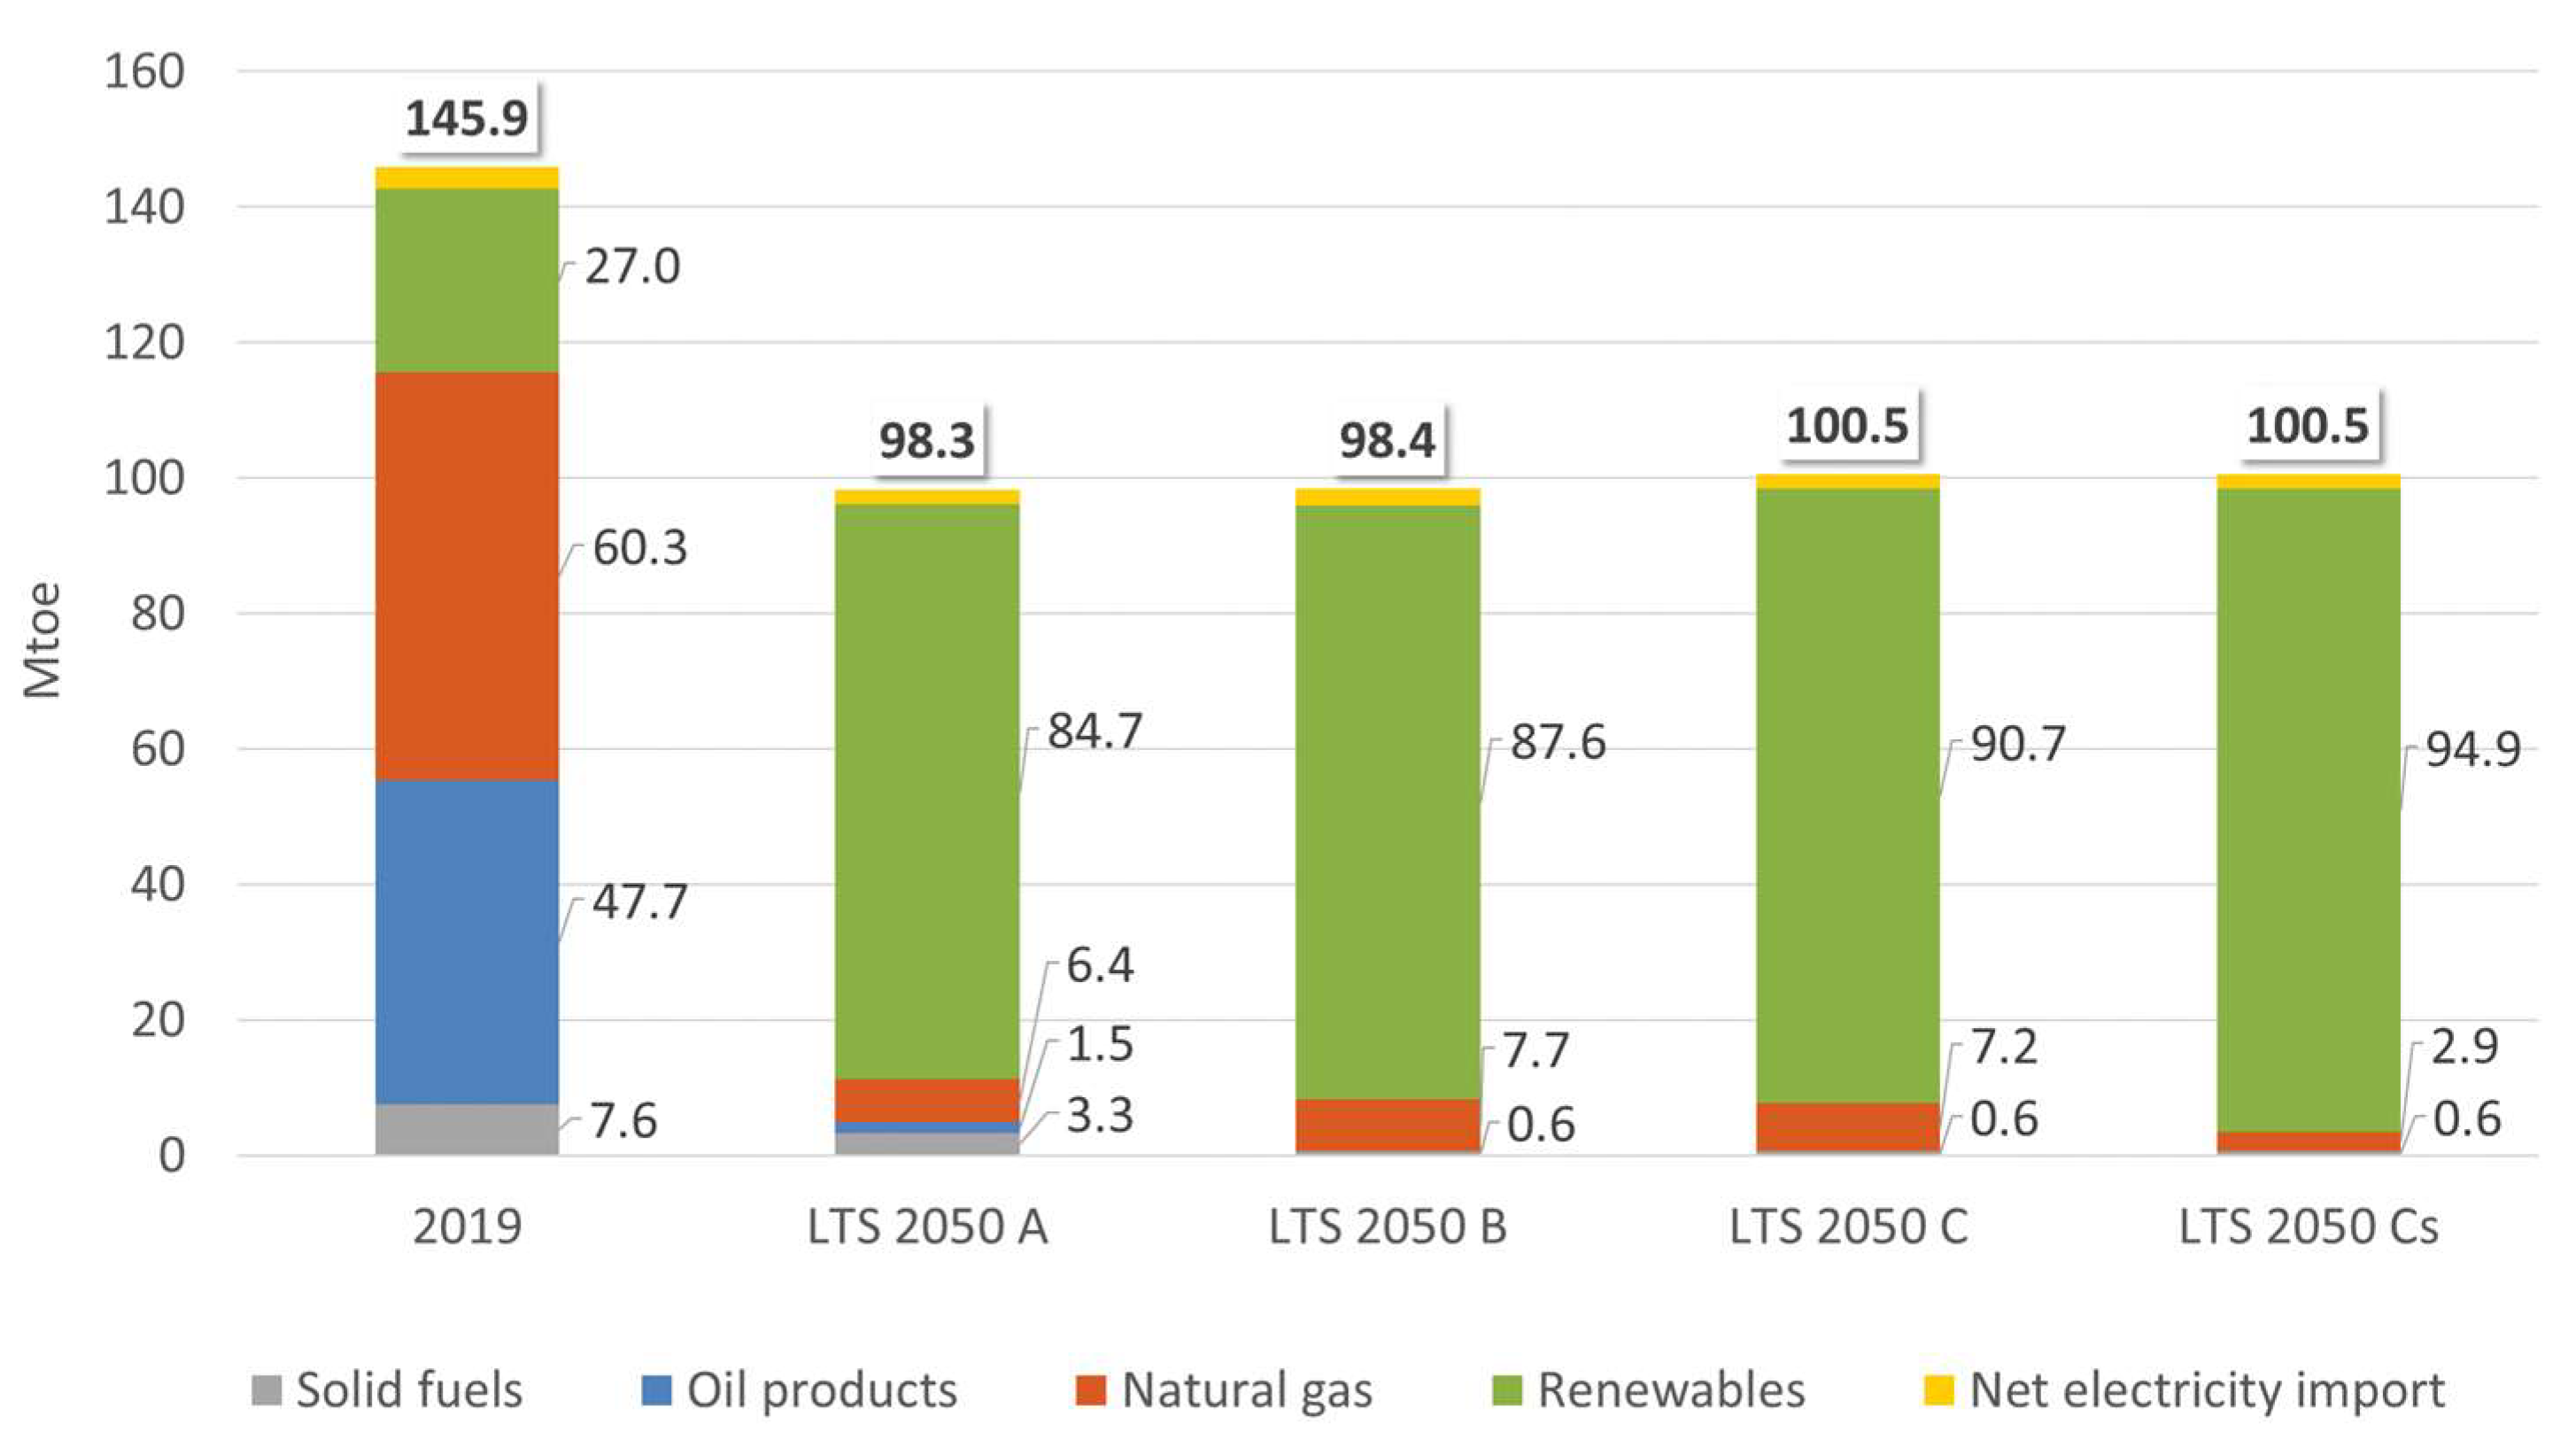
The expected evolution of the Italian primary energy consumption is shown in
Figure 4, where the current situation is compared to the optimization results from the TIMES-RSE model. In the 2050 scenarios, primary energy consumption is reduced to 90–101 Mtoe, which represents a cut of over 30% compared to 2019 levels [
36]. One could have expected an even steeper reduction of primary energy given the ambitious decarbonization goals. However, with the expansion of the power sector, the unprecedented growth of carbon-free fuels (e.g., hydrogen, biomethane) generates new streams of energy consumption and transformation (see
Section 3.4).
Compared with today, the 2050 primary energy mix appears completely transformed. The share of fossil fuels is drastically reduced from 79% in 2019 to less than 13% in the LTS scenarios. In such scenarios, the consumption of solid fuels is minimized to 0.6–3 Mtoe, depending on whether the scenarios explore a complete phase-out of coal and its replacement with solid fuels obtained from circular economy measures (the LTS B, LTS C and LTS Cs scenarios) or whether some industrial processes (steel, petrochemical) continue to use fossil fuels combined with CCS technologies (the LTS A scenario). As regards oil products, the LTS B, LTS C and LTS Cs scenarios assume they are eliminated from energy use, while the LTS A scenario considers a marginal use in industry. Natural gas follows a declining path as well, after playing a crucial role in the energy transition towards the Italian 2030 targets [
25]. The primary energy consumption of this commodity is reduced by 87–95% compared to 2019, with the highest reduction corresponding to a complete phase-out from the power sector.
Renewables become the backbone of the Italian energy system with a share of 86–94% in the primary energy mix. Such contribution is tripled compared to 2019 and results from the growing penetration of wind and photovoltaic technologies to meet the accelerating electrification of energy demand. These findings are supported in the research by a strong general agreement that renewables will play a key role in decarbonization pathways. According to a study on the future electrification of the Italian energy system, by 2050, more than 80–90% of the electricity will be provided by RES, with the highest shares related to the deployment of emission reduction measures such as a CO
2 price [
37]. Another study indicates that in 2050, Italy can potentially achieve approximately 86% penetration of RES in its electricity supply [
38]. Our results are also consistent with the general context of EU decarbonization pathways. In the EU Long Term Strategy [
14], a new energy system dominated by renewables emerges (51–62% of gross inland consumption), moving away from fossil fuels.
The role of bioenergy (biogas, biomethane and biomass) is also significant. They are used not only for the decarbonization of final thermal energy use, but especially in power generation, where their combination with CCS and CCU technologies generates negative emissions, a crucial element to reach the carbon neutrality target. The importance of carbon capture technologies is also highlighted in the 1.5TECH scenario for EU decarbonization [
14], where by 2050 CCS is expected to represent 5% of the total net electricity generation and to be mostly associated with biomass power generation to generate negative emissions. However, as highlighted by Fajardi and Mac Dowell [
39], a whole-systems analysis for the value chain of bioenergy with CO
2 capture and storage (BECCS) is needed (from cultivation to transport and energy conversion). In fact, BECCS could lead to both positive and negative carbon emissions depending on the conditions of its deployment [
40,
41,
42].
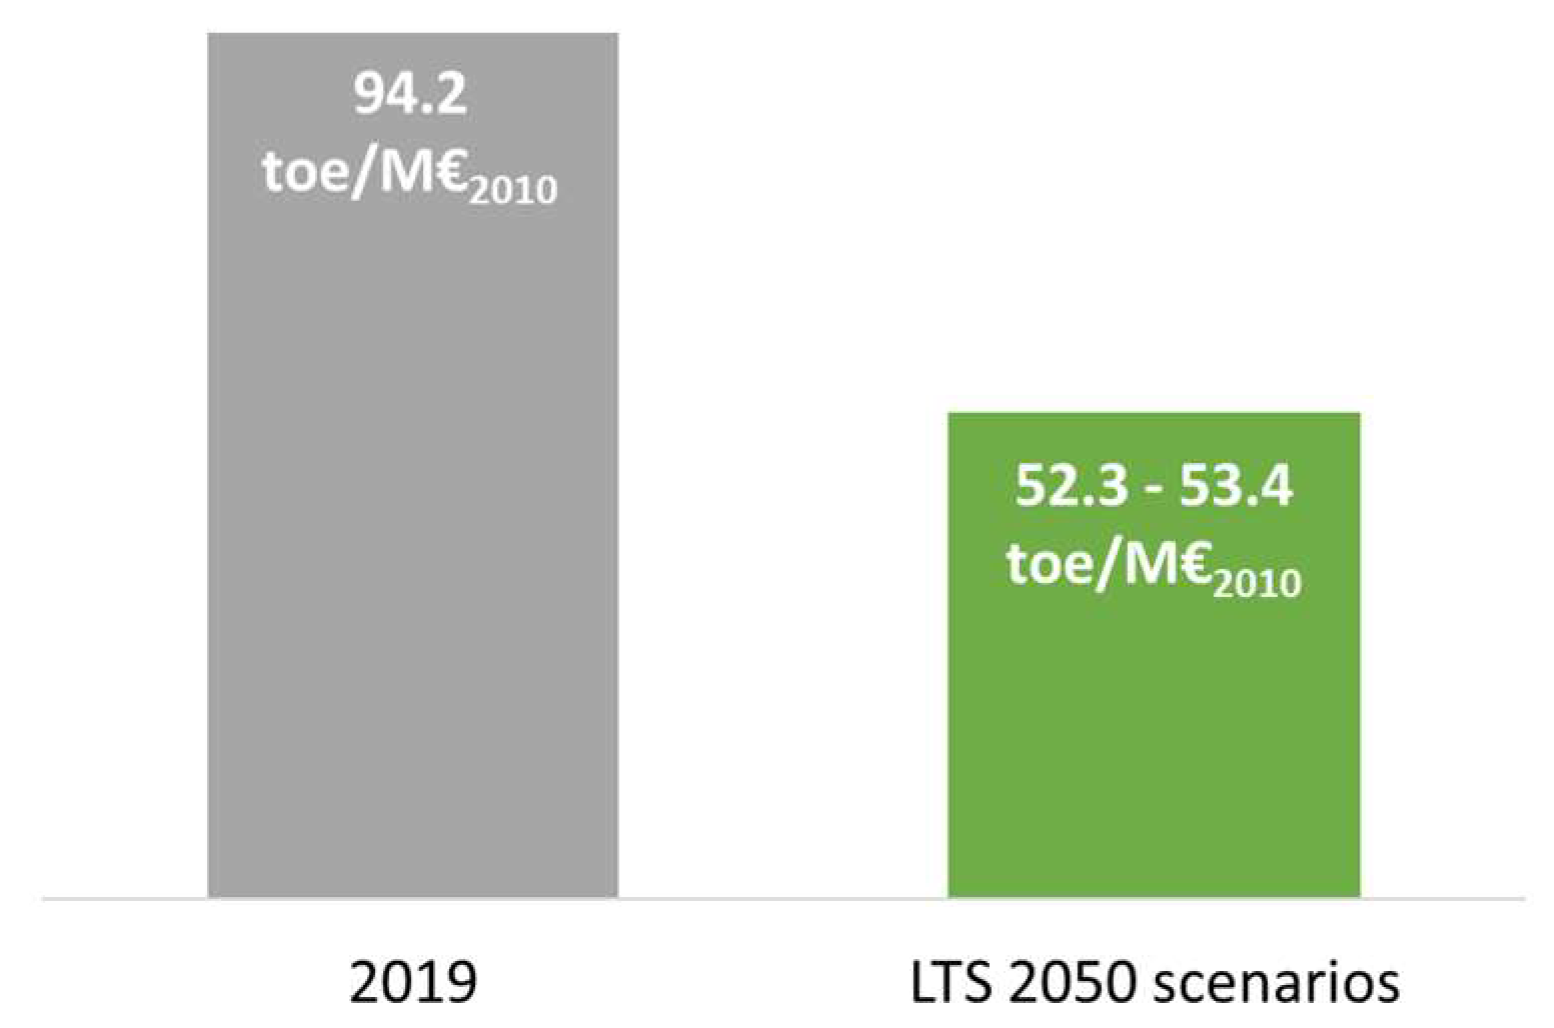
The contraction in primary energy consumption directly affects the national energy intensity indicator (
Figure 5). Compared to 2019, the LTS scenarios reduce energy intensity by an average of 44% because of both energy efficiency and the effect of the expected economic growth.
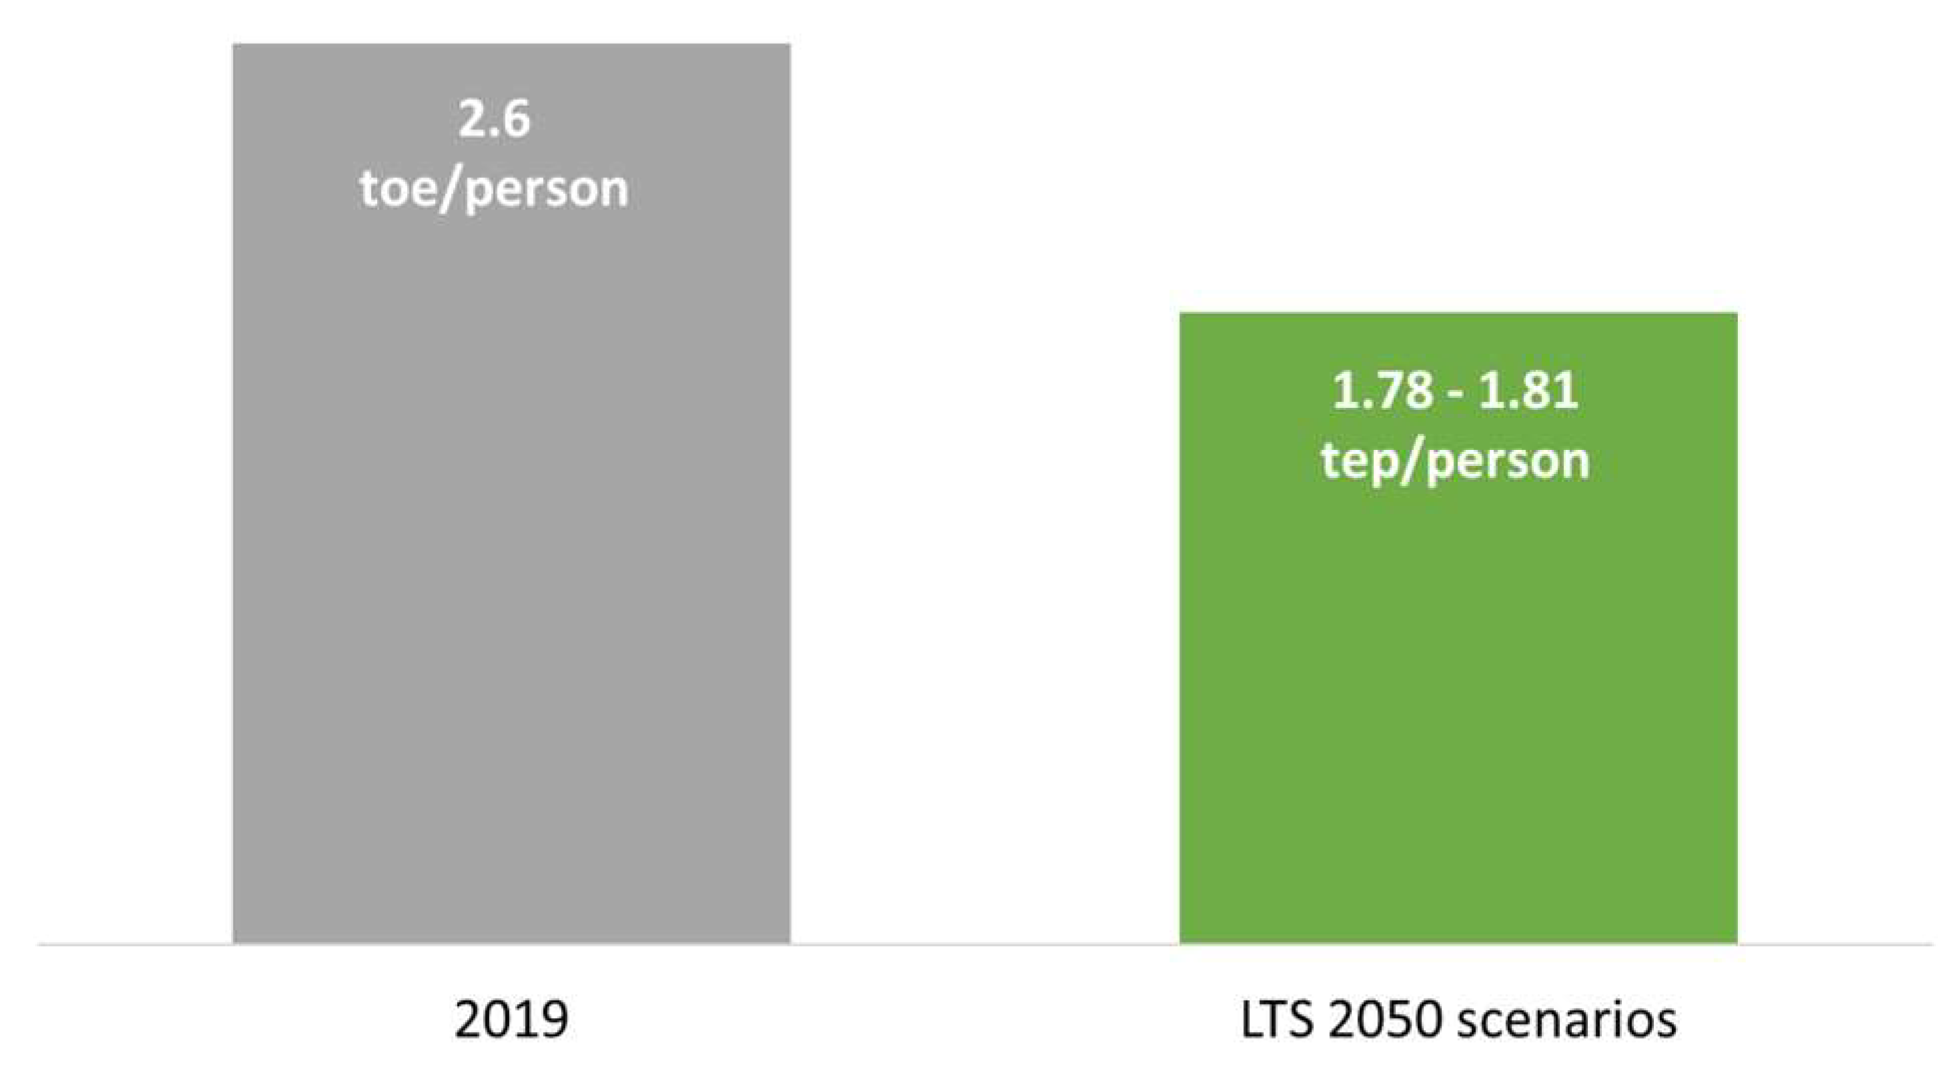
The gross inland consumption to population ratio also decreases significantly (
Figure 6). The reduction of gross inland consumption is over 10 times higher than the expected population decline rate, thus generating a 30% cut in per capita energy demand.
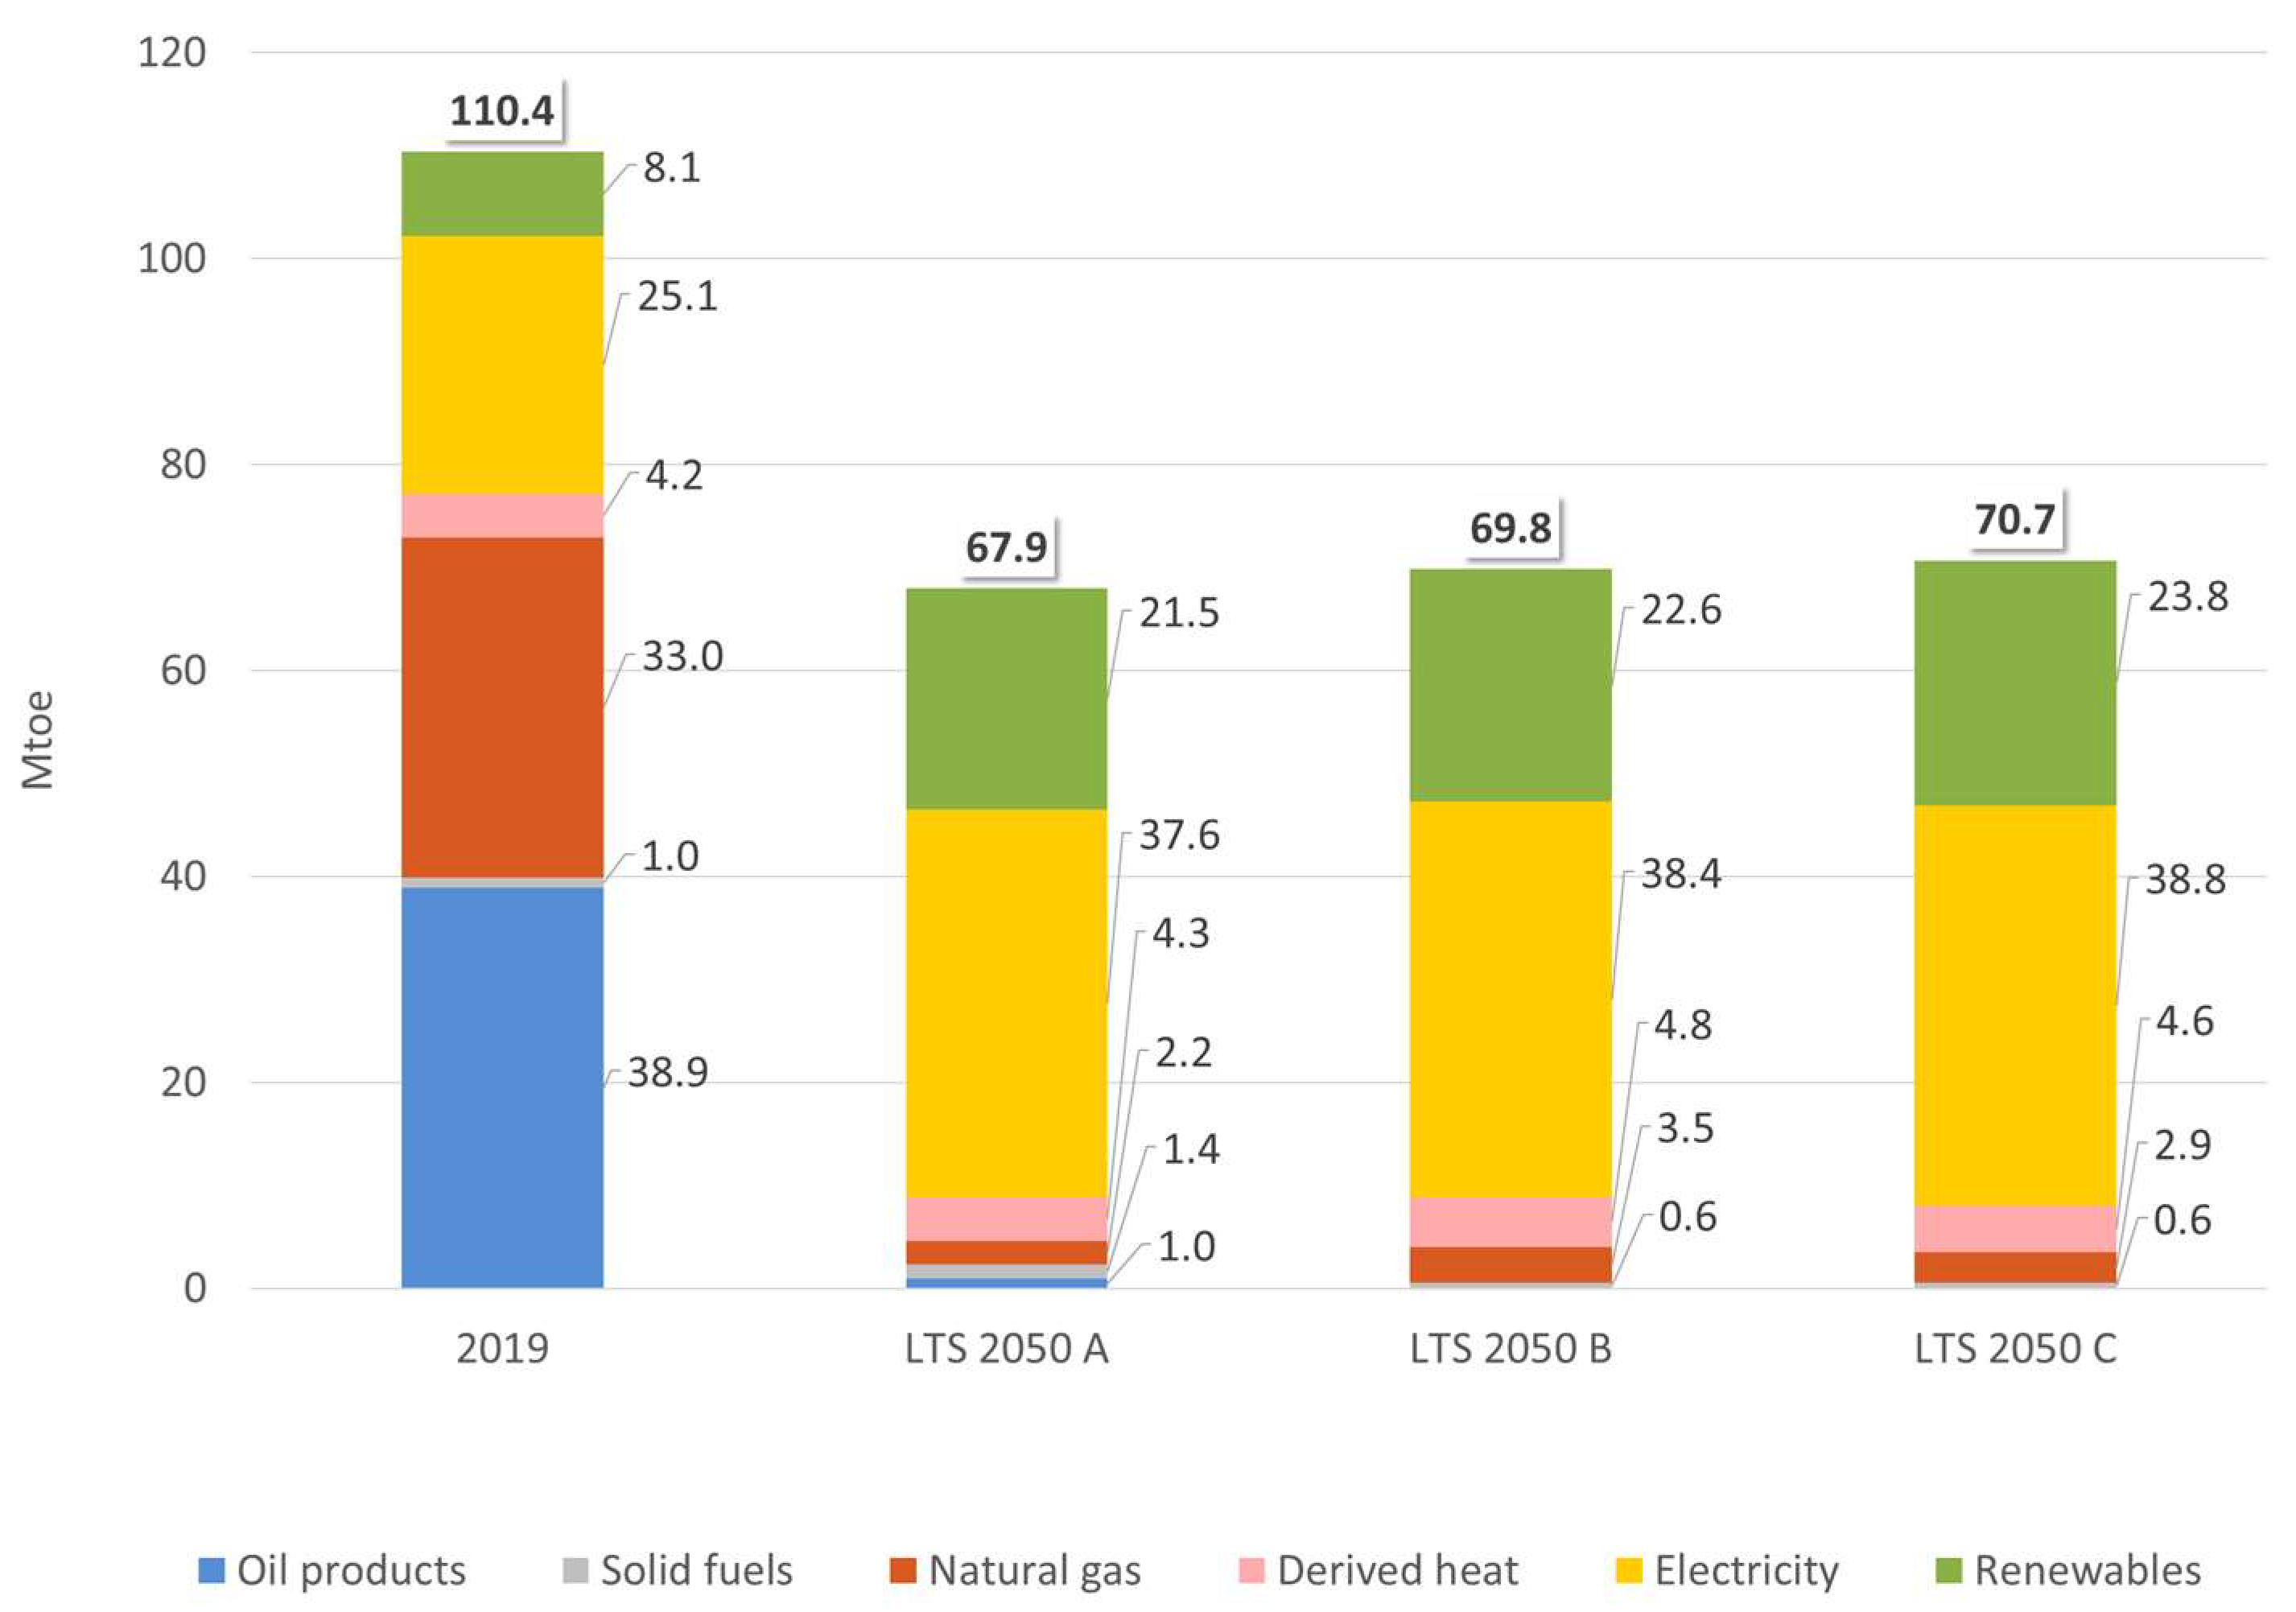
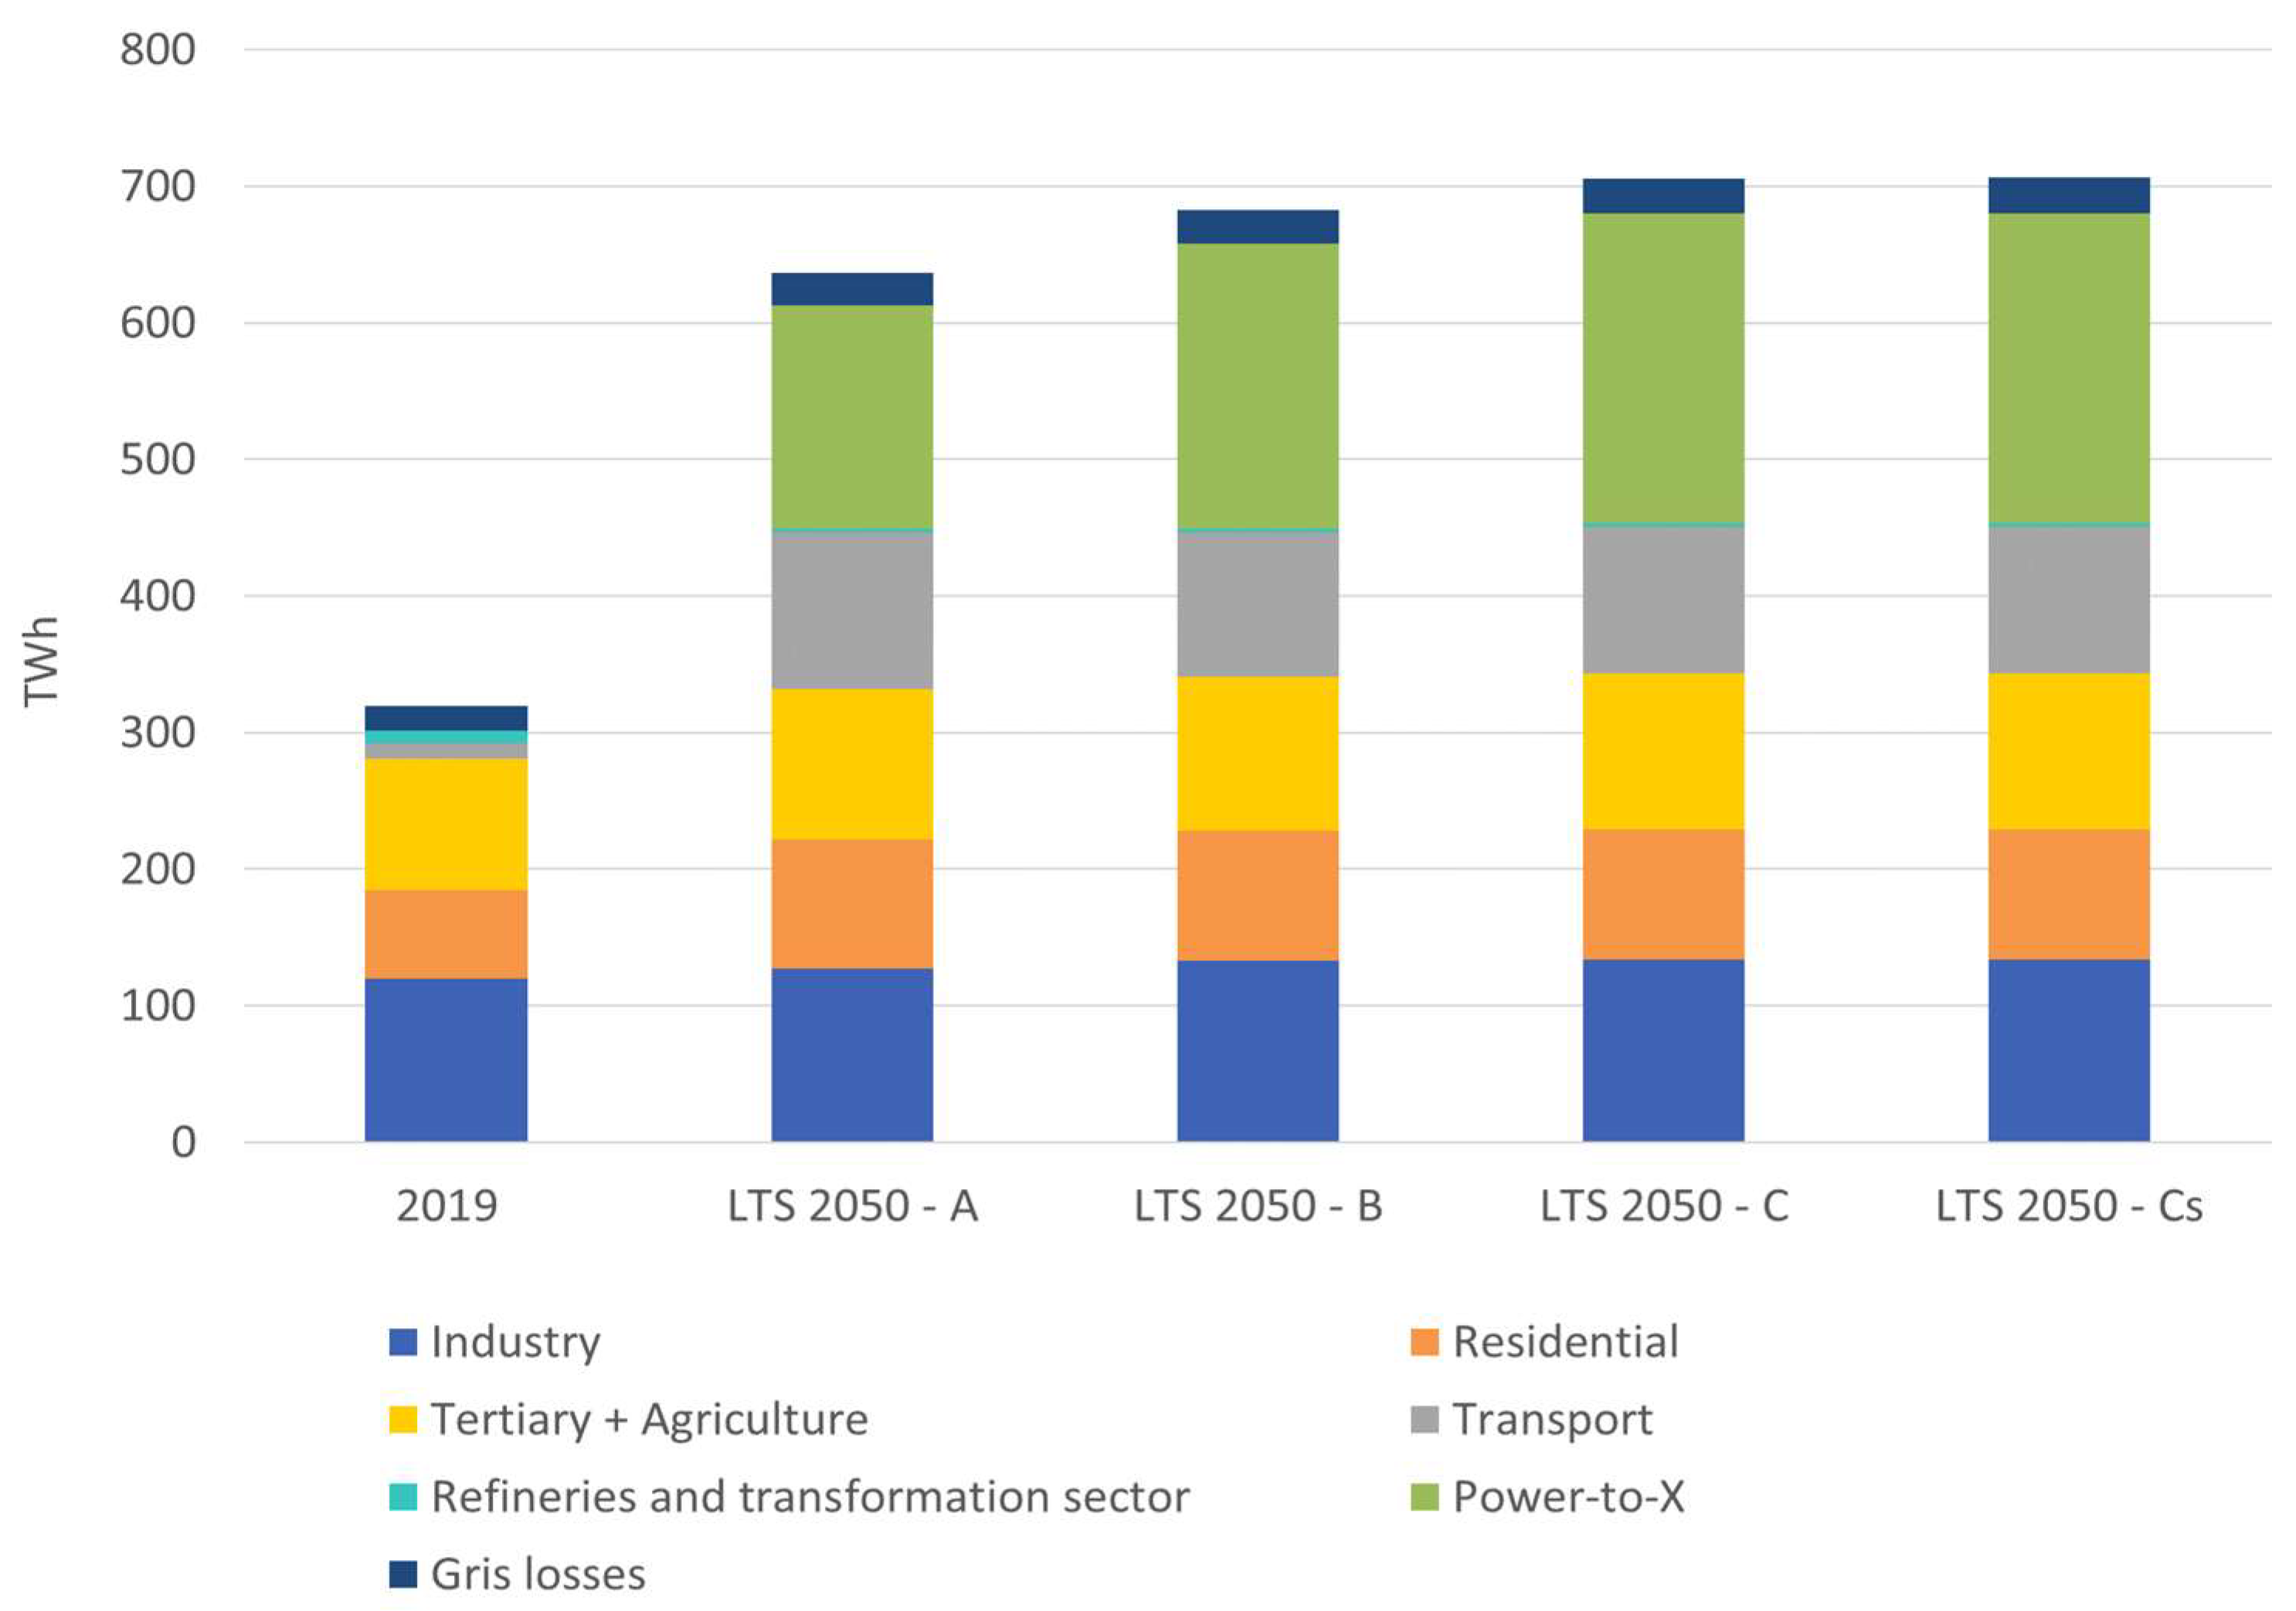
Even greater changes in the structure of Italian energy demand can also be seen in the evolution of final energy consumption (
Figure 7).
In the LTS scenarios, the structure and size of final consumption in all these sectors undergo profound transformations to pursue the goal of decarbonizing the entire economy. In these scenarios, final consumption is reduced to 68–71 Mtoe, a contraction of about 40% compared to the situation in 2019. The electricity vector displaces fossil fuels, becoming the main source of final energy consumption by an amount between 37 and 39 Mtoe, more than 50% higher than in 2019. The intense electrification of consumption is accompanied by an extraordinary growth of renewable sources, whose penetration in end-uses reaches 21–24 Mtoe. In detail, the contribution of renewable sources has almost tripled compared to 2019.
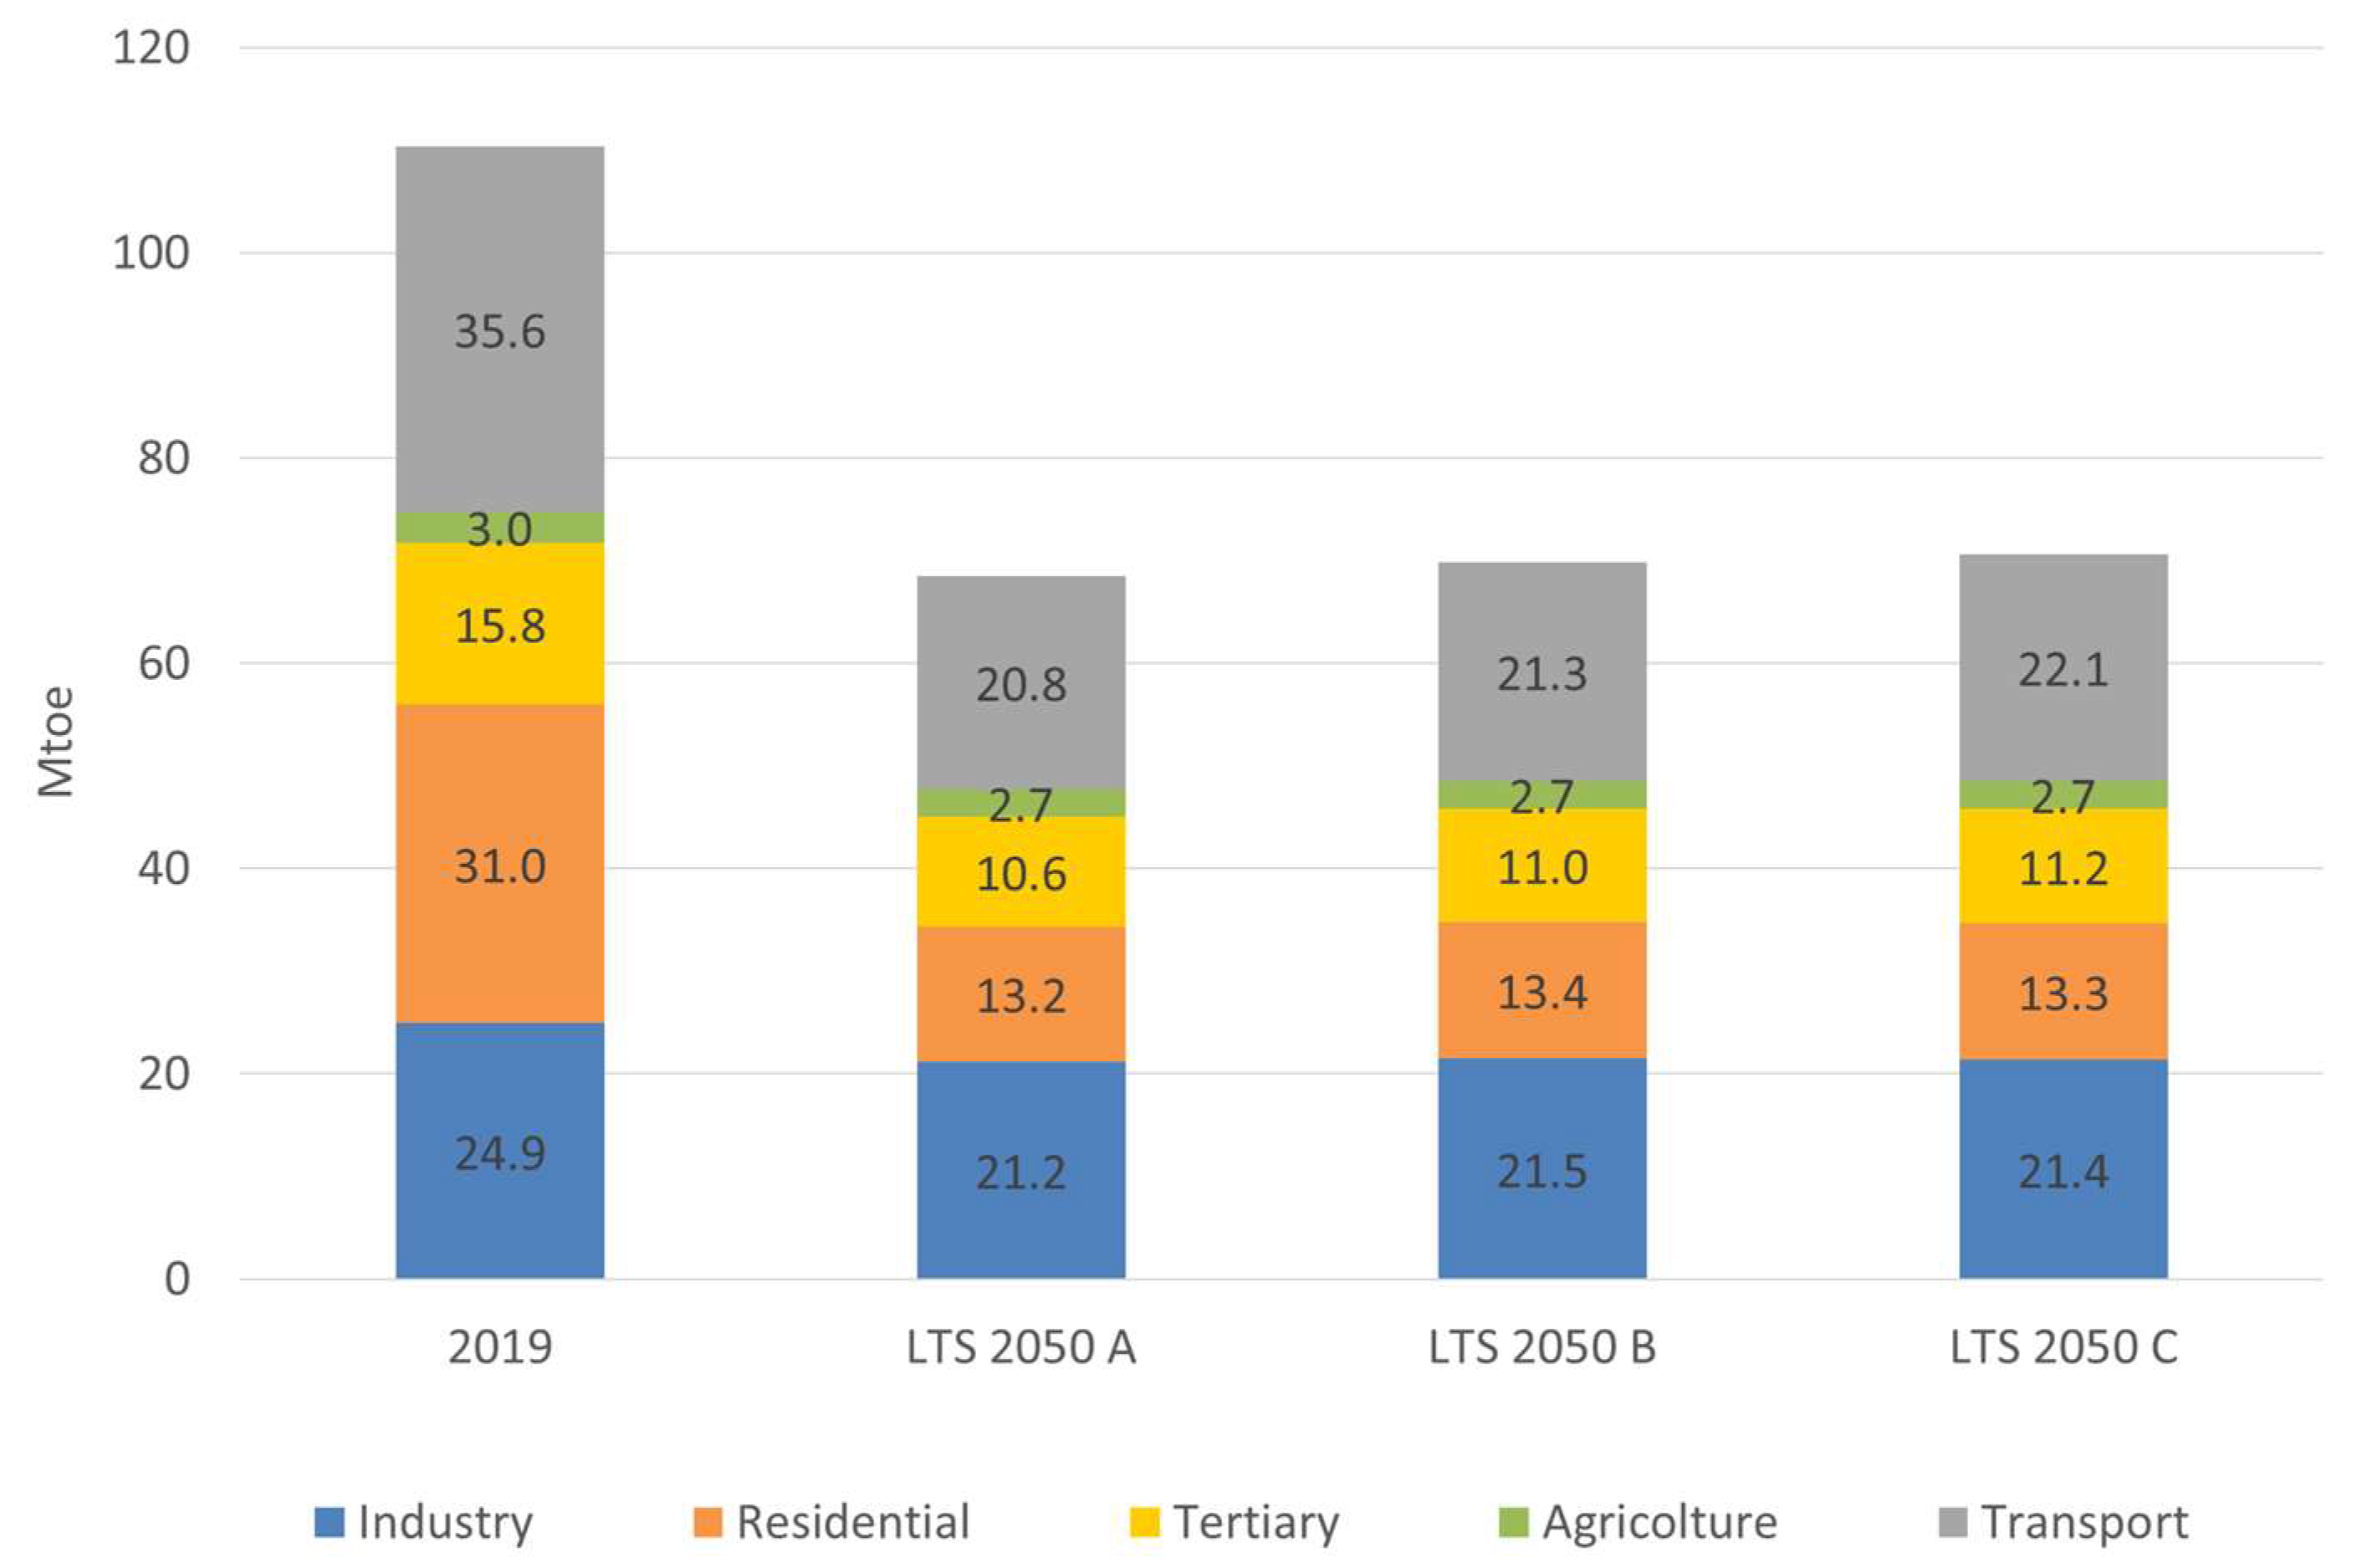
Such a transformation of final energy consumption results from the different decarbonization pathways experienced by transport, industry, residential, tertiary and agricultural sectors (
Figure 8).
In the LTS scenarios, the energy consumption of transport amounts to 21–22 Mtoe, almost half compared to 2019. A major role is played by measures aiming at reducing private car use and ownership, such as smart working, car sharing and the modal shift towards public transport and soft mobility (cycling, walking). Addressing the demand of freight transport is also important: measures such as the optimization of logistic chains and the minimization of empty runs are compelling under the 2050 scenarios. However, profound transformations in the transport sector can also be found on the supply side in terms of innovation and technological change. The penetration of electricity contributes to increase the energy efficiency of the vehicle stock. Meanwhile, hydrogen and other electricity-based synthetic fuels (e-fuels) are required to replace fossil fuels in those transport segments where technical and economic barriers of a direct electrification exist, including aviation and marine transport.
The agricultural sector is characterized by a reduction in the consumption of petroleum products, which are replaced by electricity and renewable sources, whose consumption doubles compared to 2019. The combination of these effects leads to a 10% reduction of energy consumption in the sector.
As regards industry, the contribution of fossil fuels is drastically reduced and replaced by a dramatic electrification and thermal energy produced by renewable cogeneration and the direct use of biomass, biomethane and hydrogen. The combination of these factors allows for significant gains in terms of energy efficiency, with an average 15% energy savings in 2050 compared to 2019.
Energy consumption in the residential sector stands at 13 Mtoe, which represents a 58% cut compared to 2019. These enormous energy savings are explained by the high renovation rates of Italian residential buildings, which are currently characterized by mediocre energy performance on average. In fact, 52% of the residential building stock was built before 1970, which exacerbates the energy intensity of the sector, especially with regards to space heating. A 2% yearly renovation rate is required in residential buildings to achieve the 2050 targets, 80% of which is identifiable as deep renovation. This represents a challenging effort if compared to the 0.9–1% rate evaluated in the Italian NECP.
Similar results can be found in the energy scenarios supporting the European Long Term Strategy [
14], where the projected yearly renovation rates in the residential sector range between 1.7–1.8%, depending on the decarbonization ambition of the different scenarios. In fact, old buildings are peculiar not only to Italy but to many other countries in the European Union, where on average about 35% of residential and tertiary buildings are over 50 years old and almost 75% were built before energy performance standards were established. Another key element in the decarbonization of the residential sector is electrification, which increases by about 45% compared to 2019 thanks to the adoption of heat pumps in heating and domestic hot water, the two most energy intensive services for dwellings.
Moreover, in the tertiary sector, energy efficiency leads to the phase-out of oil products and natural gas (replaced mainly by renewable sources and secondly by electricity). These effects are visible in the containment of the otherwise rampant energy consumption of services, driven by the economic growth of the sector: the reduction in energy consumption in the sector is on average 30% compared to 2019.
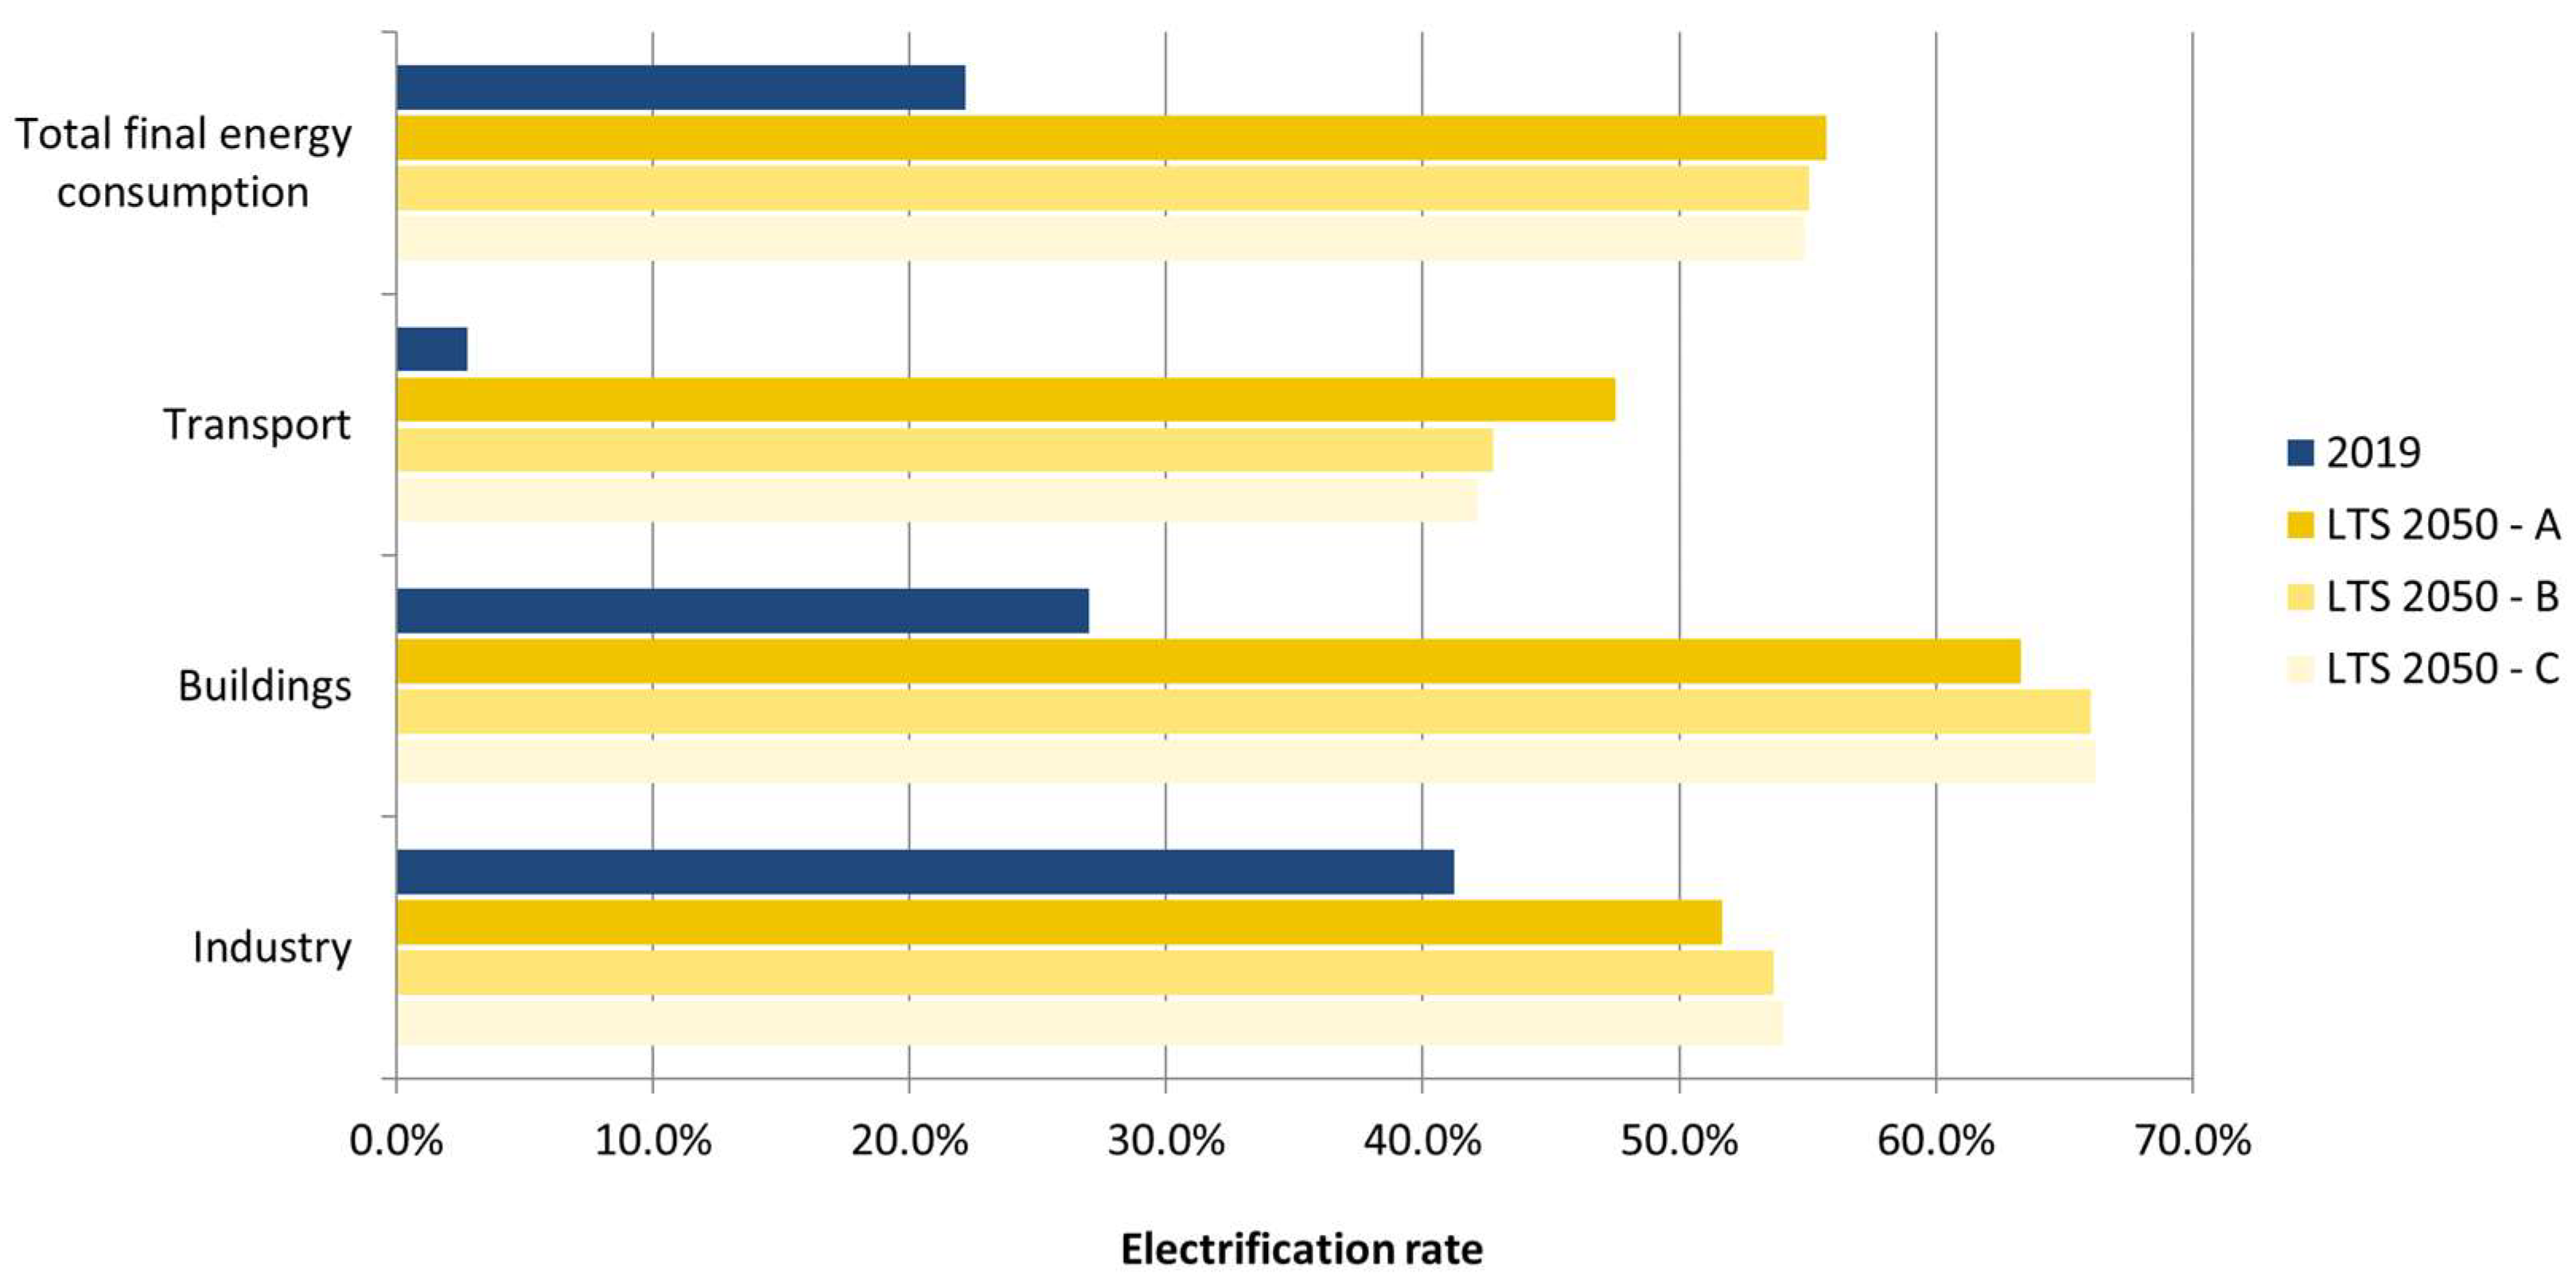
3.3. Electrification as a Pillar of Decarbonization Pathways
To achieve climate neutrality by 2050, besides a radical transformation of energy consumption, a need for the significant electrification of end-uses emerges as well (
Figure 9). By 2050, electricity will have a central role in the energy system, growing from a 22% share of final consumption in 2019 to almost 55%. Electricity will play a key role across all sectors, though with different patterns and specific challenges.
Transport is the sector where electricity is expected to bring the greatest change. Electrification will increase in 30 years from 3% (2019) to over 40% (2050), thus becoming the main energy carrier in the sector. Mostly cars will be affected by this huge transformation, leading to around 20 million battery electric vehicles in 2050 (
Table 5).
As regards heavy-duty vehicles, electrification is hindered by technical and economic barriers which inevitably prompt the deployment of alternative fuels to reach the decarbonization goals. In fact, traveling long distances while transporting large amounts of goods requires high capacity batteries to satisfy the extensive autonomy and power demand of heavy-duty vehicles, which, however, is detrimental to investments costs.
The buildings sector experiences a significant increase in electricity penetration as well. While energy consumption in the tertiary sector has been historically dominated by electricity, it is in the residential sector that the greatest electrification occurs. The energy service most affected by this transformation is undoubtedly space heating, which nowadays is mainly provided by natural gas boilers. In the decarbonization scenarios, fossil fuel-fired heat generators are replaced by reversible electric heat pumps, which operate throughout the year, providing space heating and cooling as well as domestic hot water. It is estimated that around 70% of residential households will use electric heat pumps in 2050.
Furthermore, in the residential sector, electricity also replaces natural gas in cooking systems, where most meals will be prepared using induction hobs.
Electrification also reaches agriculture, where electric farm machinery is introduced after the phase-out of oil products.
In the industrial sector, electrification increases up to 54% of energy consumption. Electricity penetration is significant not only in less energy intensive sectors, but also in steel production via direct reduced iron. Options such as electric arc furnaces, robotization, digitalization and additive manufacturing contribute to increasing the demand for electricity in the sector.
Alongside the more traditional end-use sectors, the growth of electricity consumption also affects innovative and flexible loads (
Figure 10). These mainly consist of Power-to-X plants that produce a variety of new fuels and energy carriers, including biomethane, hydrogen and liquid synthetic fuels, as well as heat. Electricity consumed by Power-to-X amounts to 160–230 TWh, which makes these facilities the largest contributor to the increase in electricity demand in 2050.
3.4. The New Challenges of the Power System
In the decarbonized scenarios, the power system undergoes a deep revolution both in its operating mode and in its role within the energy system. In fact, if in recent years electrification has mainly represented a way to improve the energy efficiency, in the 2050 scenarios it takes a more prominent role in the decarbonization of all the other sectors as well. More precisely, the power sector will have to substantially contribute to all these goals:
Further electrification of energy uses in order to obtain more efficiency and emissions reduction in all the sectors;
Synthetic fuel generation without CO
2 emissions (according to the European Hydrogen Strategy [
43], EU industry is taking up the challenge and has developed an ambitious plan to reach 2 × 40 GW of electrolyzers by 2030);
Direct heat generation without accounting CO2;
Opportunity of CO2 capture from some huge emission source;
Removal of CO2 from the atmosphere using the non-dispatchable renewable overgeneration of electricity.
3.4.1. Renewables to Decarbonize the Power System and the Power System Flexibility Issue
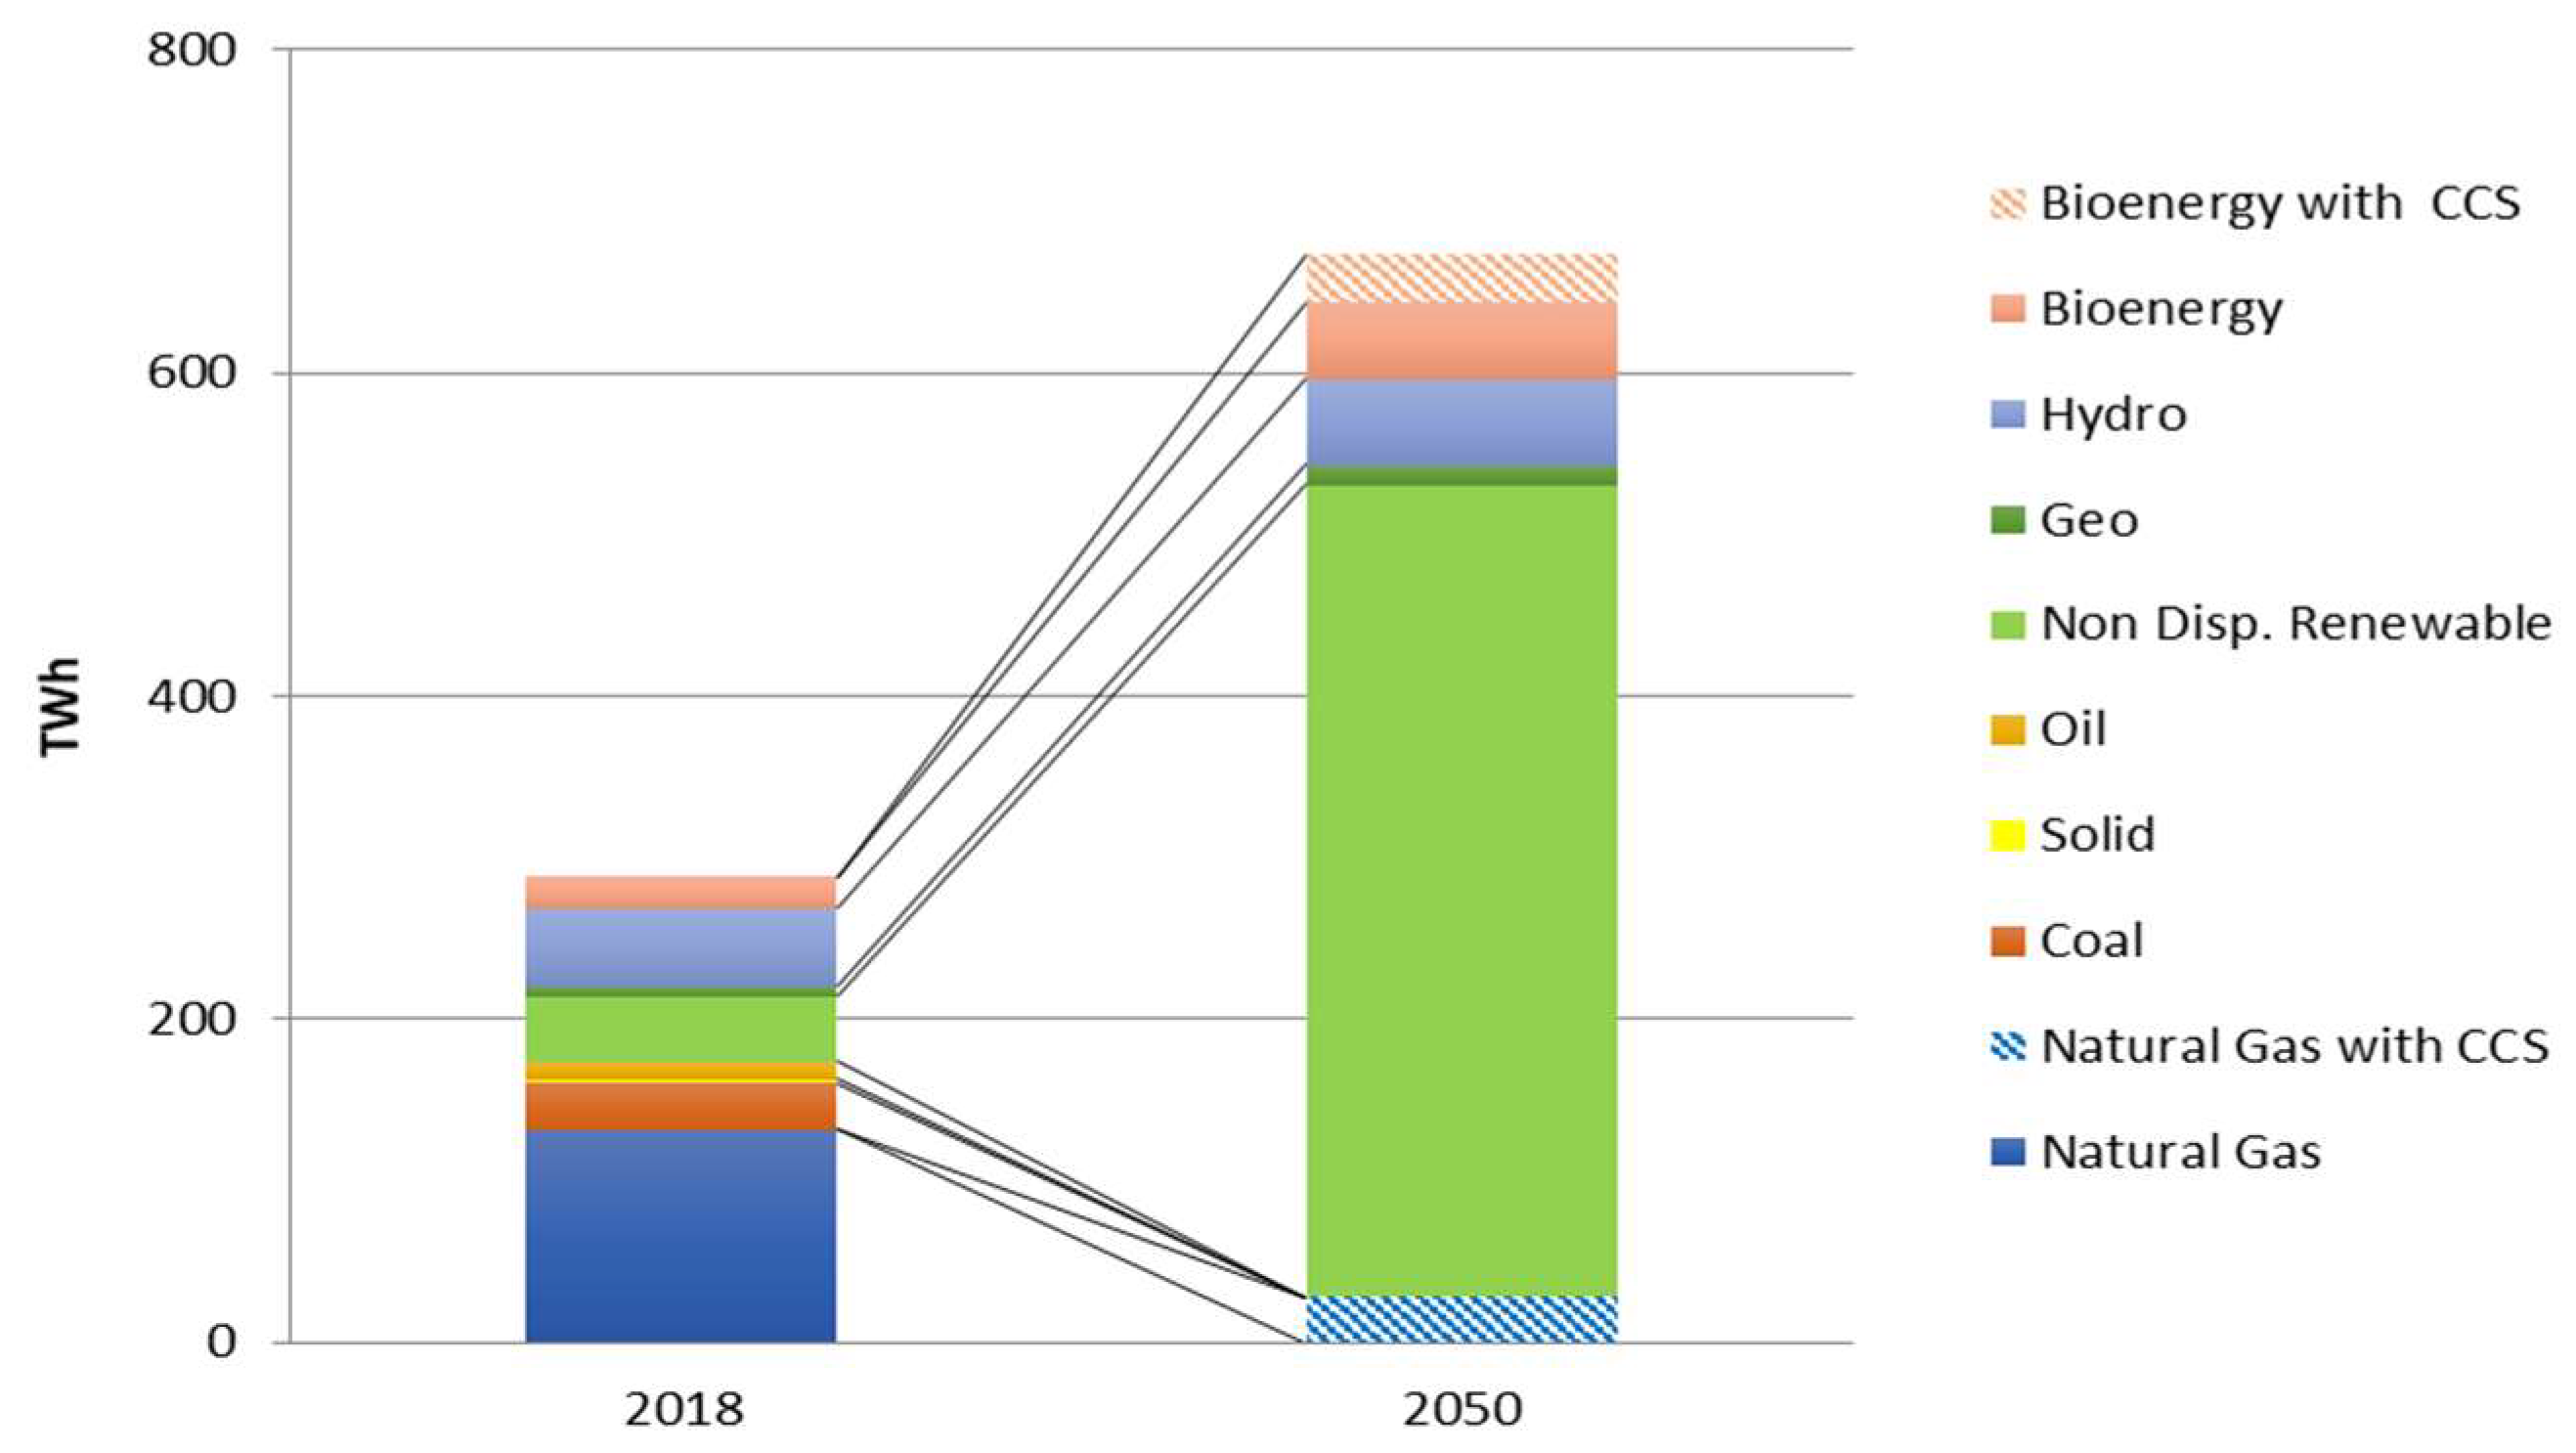
In order to reach the decarbonization goal and exploit the decarbonization potential of electrification of final uses, the energy model indicates that the energy system needs, first of all, to have a decarbonized power generation. As our scenarios conclude, by 2050 all the scenarios foresee a renewable generation exceeding 95% of total production, split among the following sources:
Mainly solar source—between 200 and 300 GW;
A strong expansion of wind generation—50 GW, of which 16–17 GW is offshore (medium and high deep water);
New sources like waves and tides—1.5 GW;
The traditional hydro-, geo-thermal and bio-energies are maintained or developed up to a total of 43 GW.
The flexible fossil fuel production will be limited under 30 TWh (worst case) and always with CCS. In order to reach the decarbonization target, the energy system will need a significant amount of electric renewable generation for both the direct consumption of electricity and indirect use for the production of e-fuels. Generation from solar and wind sources could therefore reach between 440 and 550 TWh (
Figure 11).
This new configuration of the electrical system leads to the installation of a high storage capacity for the electrical system, with hydro-pumped storage and batteries both on the network and distributed. They have several uses: moving renewable production surpluses into hours with higher demand, or also by P2X plants, and providing huge amounts of power for flexibility and fast backup services.
For pumped storage plants, a potential of approximately 10 GW, inclusive of marine plants, could be developed in addition to the 7 GW existing today. For batteries, the installation varies between 28 GW and 38 GW.
The flexibility of the power system, i.e., the ability to keep production and consumption always safely balanced, even in case of unexpected shocks, is indeed a critical issue to addresses for the evolution of a power system with a high penetration of renewable sources. In a traditional power system setting, flexibility needs were covered, in all their dimensions, by dispatchable thermoelectric and hydroelectric plants. Those plants were perfectly capable of providing all the desired flexibility (classified by various delivery speeds and durations). The need for flexibility is, in fact, an articulated set of specific needs from the intra-hourly time scale (driven by the uncertainty of renewable production forecasts) to the annual scale (driven by the seasonal variation of demand and PV potential generation).
Therefore, a huge flexible consumption capacity and storage capacity will be required. The flexible loads (flexible demand) are mainly from P2X plants transforming electricity into other energy carriers such as green methane, hydrogen and liquid fuels, as well as heat. These are responsible for the electricity consumption, in 2050, of between 160 and 230 TWh (depending on the different scenarios considered), which doubles the total electric demand from current levels (up to 600–700 TWh).
As the installed capacity of non-programmable electric renewables, characterized by intermittent generation, increases, there will be many hours in the year in which electricity production will exceed demand. After granting the daily hourly balance of final electricity consumption (e.g., via batteries and pumped storage), further overgeneration can be transformed into heat or into hydrogen and subsequently into synthetic fuels based on hydrogen and CO2. The simulations of the power system carried out for the year 2050 based on the decarbonization scenarios show that, in order to give the necessary flexibility to the electricity system, P2X plants cannot operate as basic plants, but only during hours of excess production from intermittent renewables; consequently, they reach a load factor of only approximately 2000 equivalent hours per year.
Another important element of flexibility, on the demand side, will be the recharging of electric vehicles with systems capable of modulating the recharge in the most suitable hours, and even exploiting the car batteries for network services (the so-called “vehicle-to-grid”).
Finally, new potential for flexible use of electricity can be realized through seasonal heat storage systems applied to district heating networks. In this way, the heat produced by the surplus of PV production during spring or summer will be accumulated to the supply of heat in the winter season (power-to-heat technology). This system provides additional useful flexibility for the electrical system, and it contributes to the decarbonization of the building sector.
As regards the network infrastructures, there are clear criticalities due to the doubling of electricity consumption compared to today, and even more so due to the quadrupling of the installed, largely non-programmable, power capacity. Therefore, important investments will be necessary, which will have to accompany the development of the system. Even more important will be the planning and location of the P2X plants. The coupling with the gas network will allow to overcome both the transport limits of the national grid and the limited storage capacity of the electricity system, opening up to the much higher potential for energy storage on a daily scale and the possibility of the seasonal accumulation of the gas system.
3.4.2. Sector Coupling and the Role of P2X
The presence of significant quantities of electrolyzers or other P2X systems provides many advantages to the entire energy system, but only if they are correctly located and if their functioning is driven by the needs of the power system. In fact, electrolyzers have a value that goes beyond their pivotal role in the sector coupling (i.e., the joint point for transferring renewable energy from the electricity system to other sectors of consumption). The production of hydrogen obtained solely from the surpluses of renewable electricity production has many advantages: (1) It enables a greater electricity production from renewable sources (supporting the installation of new renewable capacity even in situations otherwise not convenient); (2) It guarantees electric energy at very low marginal cost for the production of H2 (which would be produced with lower variable costs than methane reforming); (3) It reduces the investments required for the power system, including a lower need for batteries.
In addition to these, the flexibility and the speed in the load ramp rate of the electrolyzers (rapid loading ramp and start up speed, unlimited duration), as well as the significance of the power levels involved, makes them particularly interesting for the supply of FRR (frequency restoration reserve) and RR (replacement reserve) services for the grid frequency control. Some initiatives for large scale demonstration have been started in the H2020 context with the H2Future project [
44], and in other initiatives (i.e., the HyBalance project, Denmark, [
45]). Moreover, ENTSO-E considers this topic in its
Development and Innovation (RDI) Implementation Report 2021–2025 [
46] as a guiding instrument for the collaborative research program of transmission system operators (TSOs) in the coming five years. The plants can be made available to switch on to provide a downward reserve or to prepare to increase the upward reserve margins, or they can reduce the load when in operation to participate in the upward reserve. An even more interesting point is that the electrolyzers can provide such regulation services with very competitive variable costs with respect to both more flexible final consumption and non-programmable renewable production, and often even with respect to traditional generation (especially on the upward services). Finally, participation in such services would allow to increase the economic returns of the electrolyzers, boosting the investment case to profitable levels or, in the worst case, allowing a lower need for economic support for this technology.
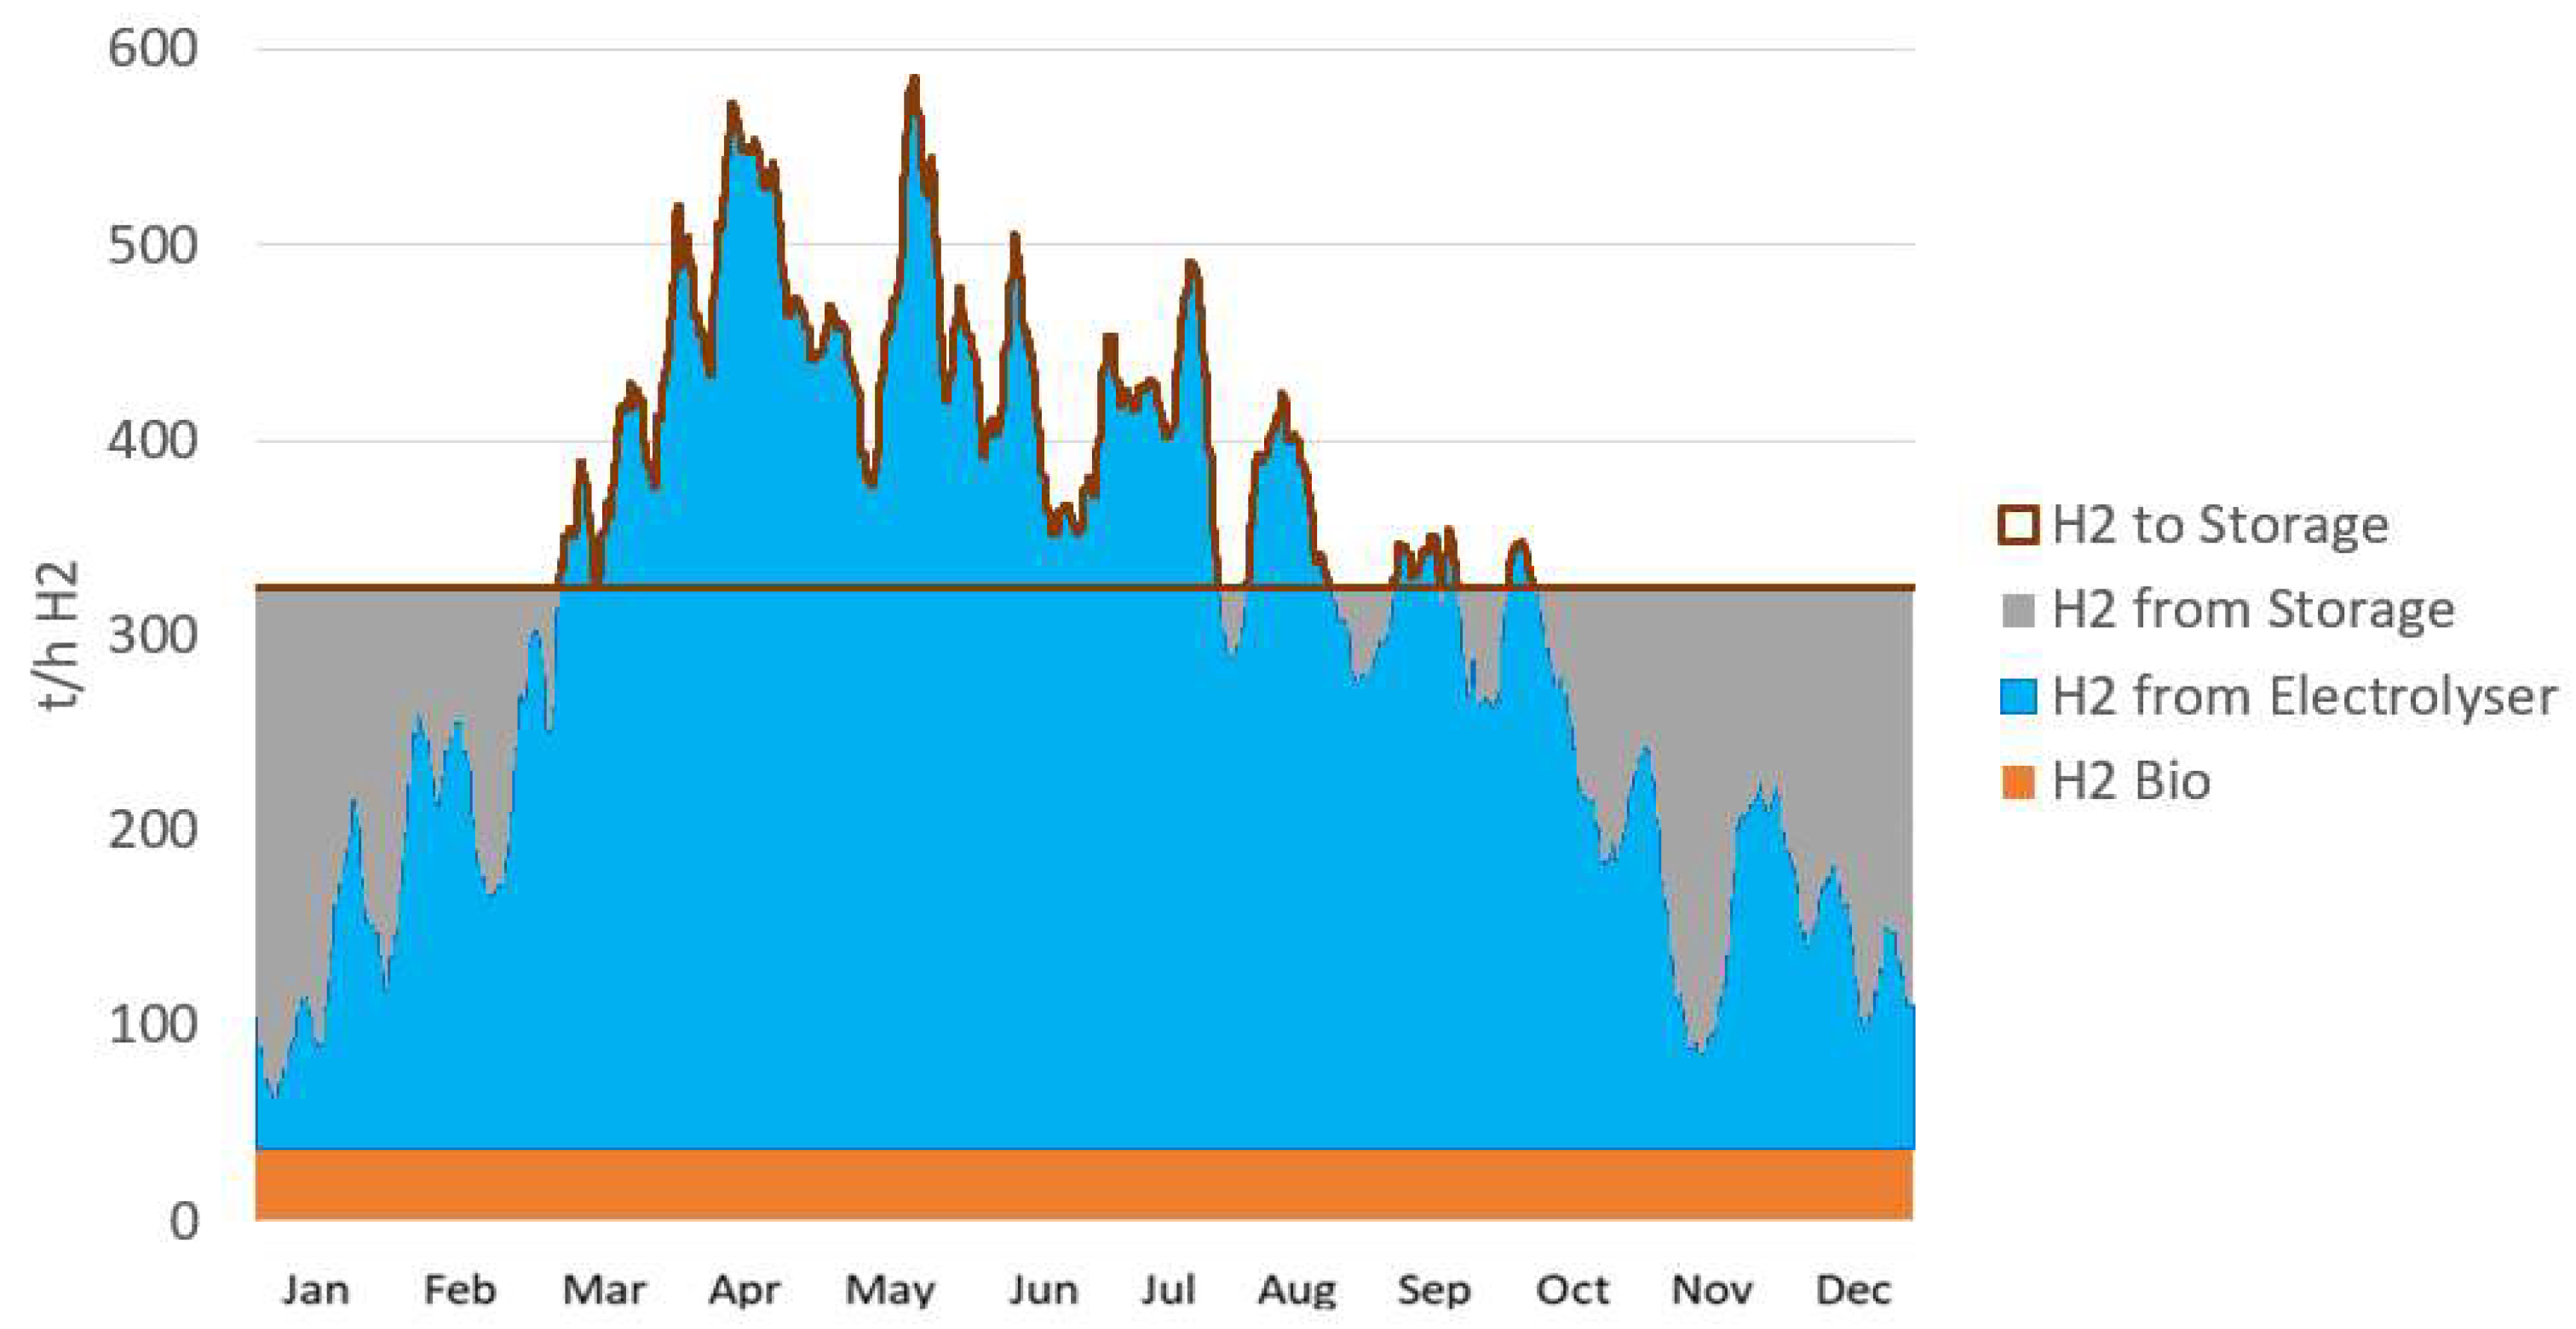
On the other hand, the production of hydrogen concentrated in few hours and, even worse, in some seasons, causes greater problems in the supply of hydrogen to end users; in fact, expensive hydrogen storage solutions will be needed both in the short term (days) to deal with days of scarce renewable electricity generation, and in the medium term, in seasons with generally poor production (winter and autumn) needing to resort to seasonal storage or other energy carriers. The feasibility (technical and economic) of seasonal storage, such as geological storage, is highly uncertain at the moment. It is necessary to arrange transport to and from the storage site, with energy costs and the need for infrastructures, and it also introduces losses both in energy, by compression and decompression, and in part of the gas itself introduced into the storage, which would no longer be recoverable.
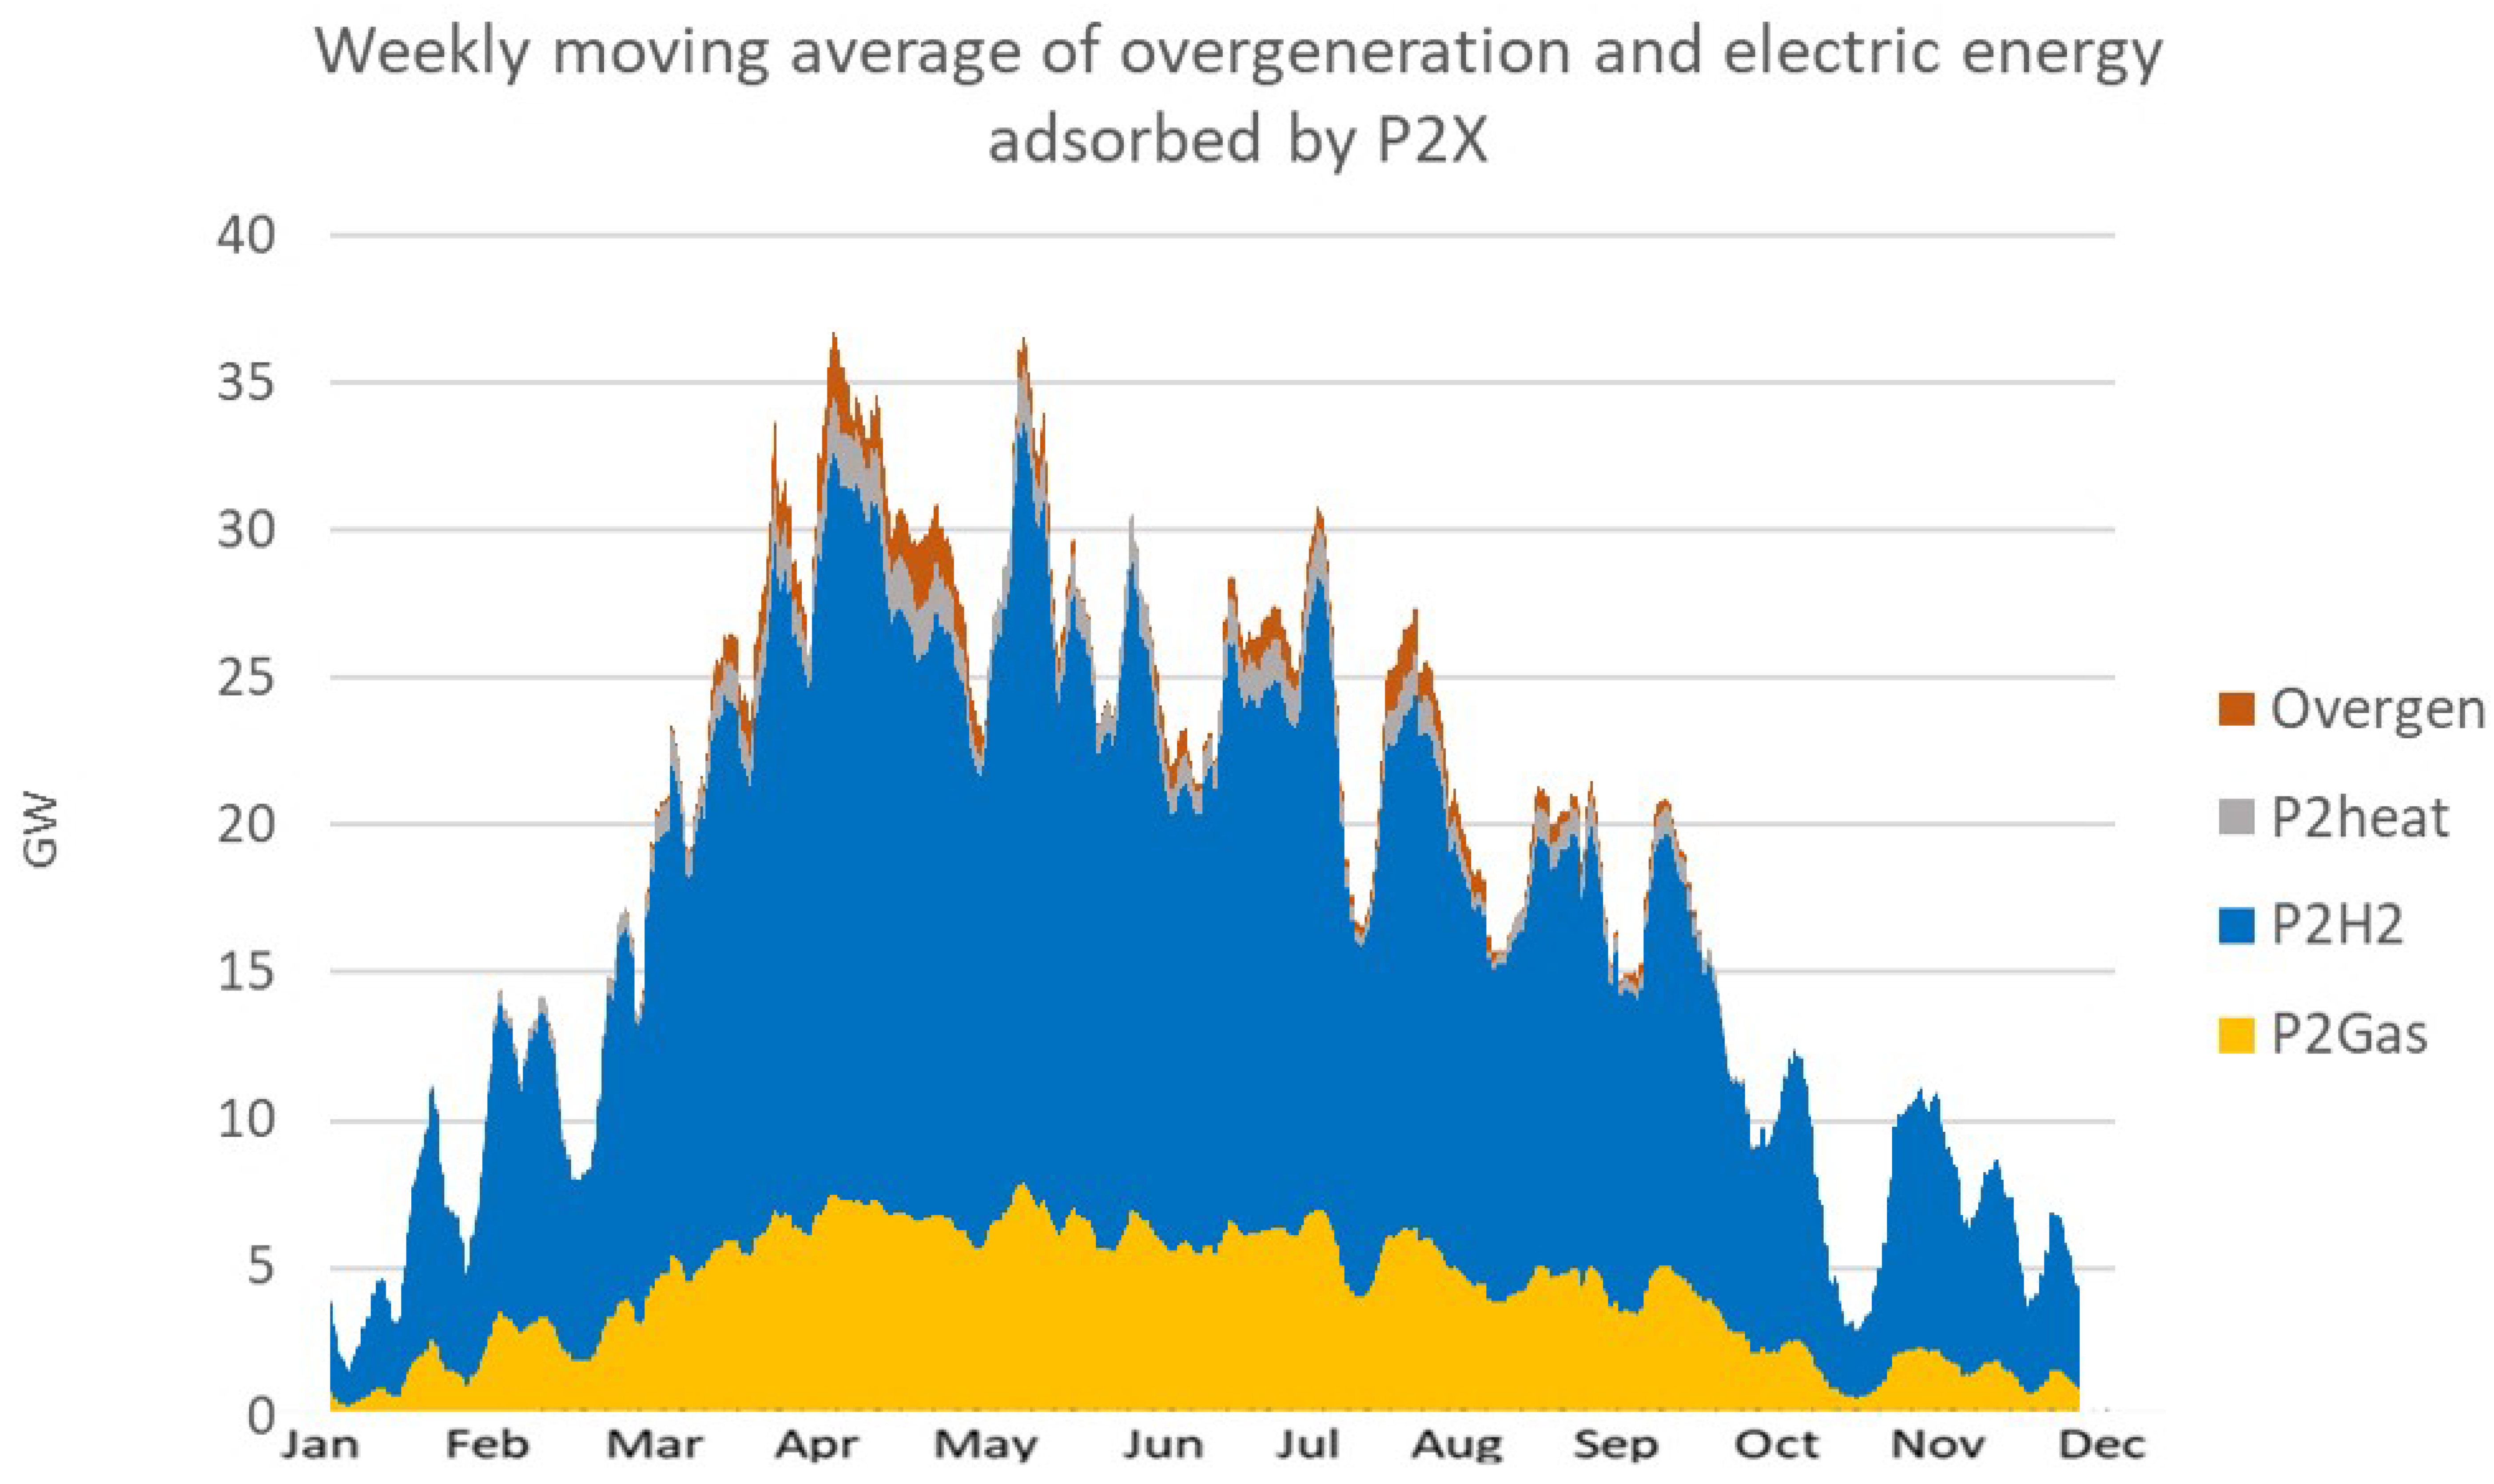
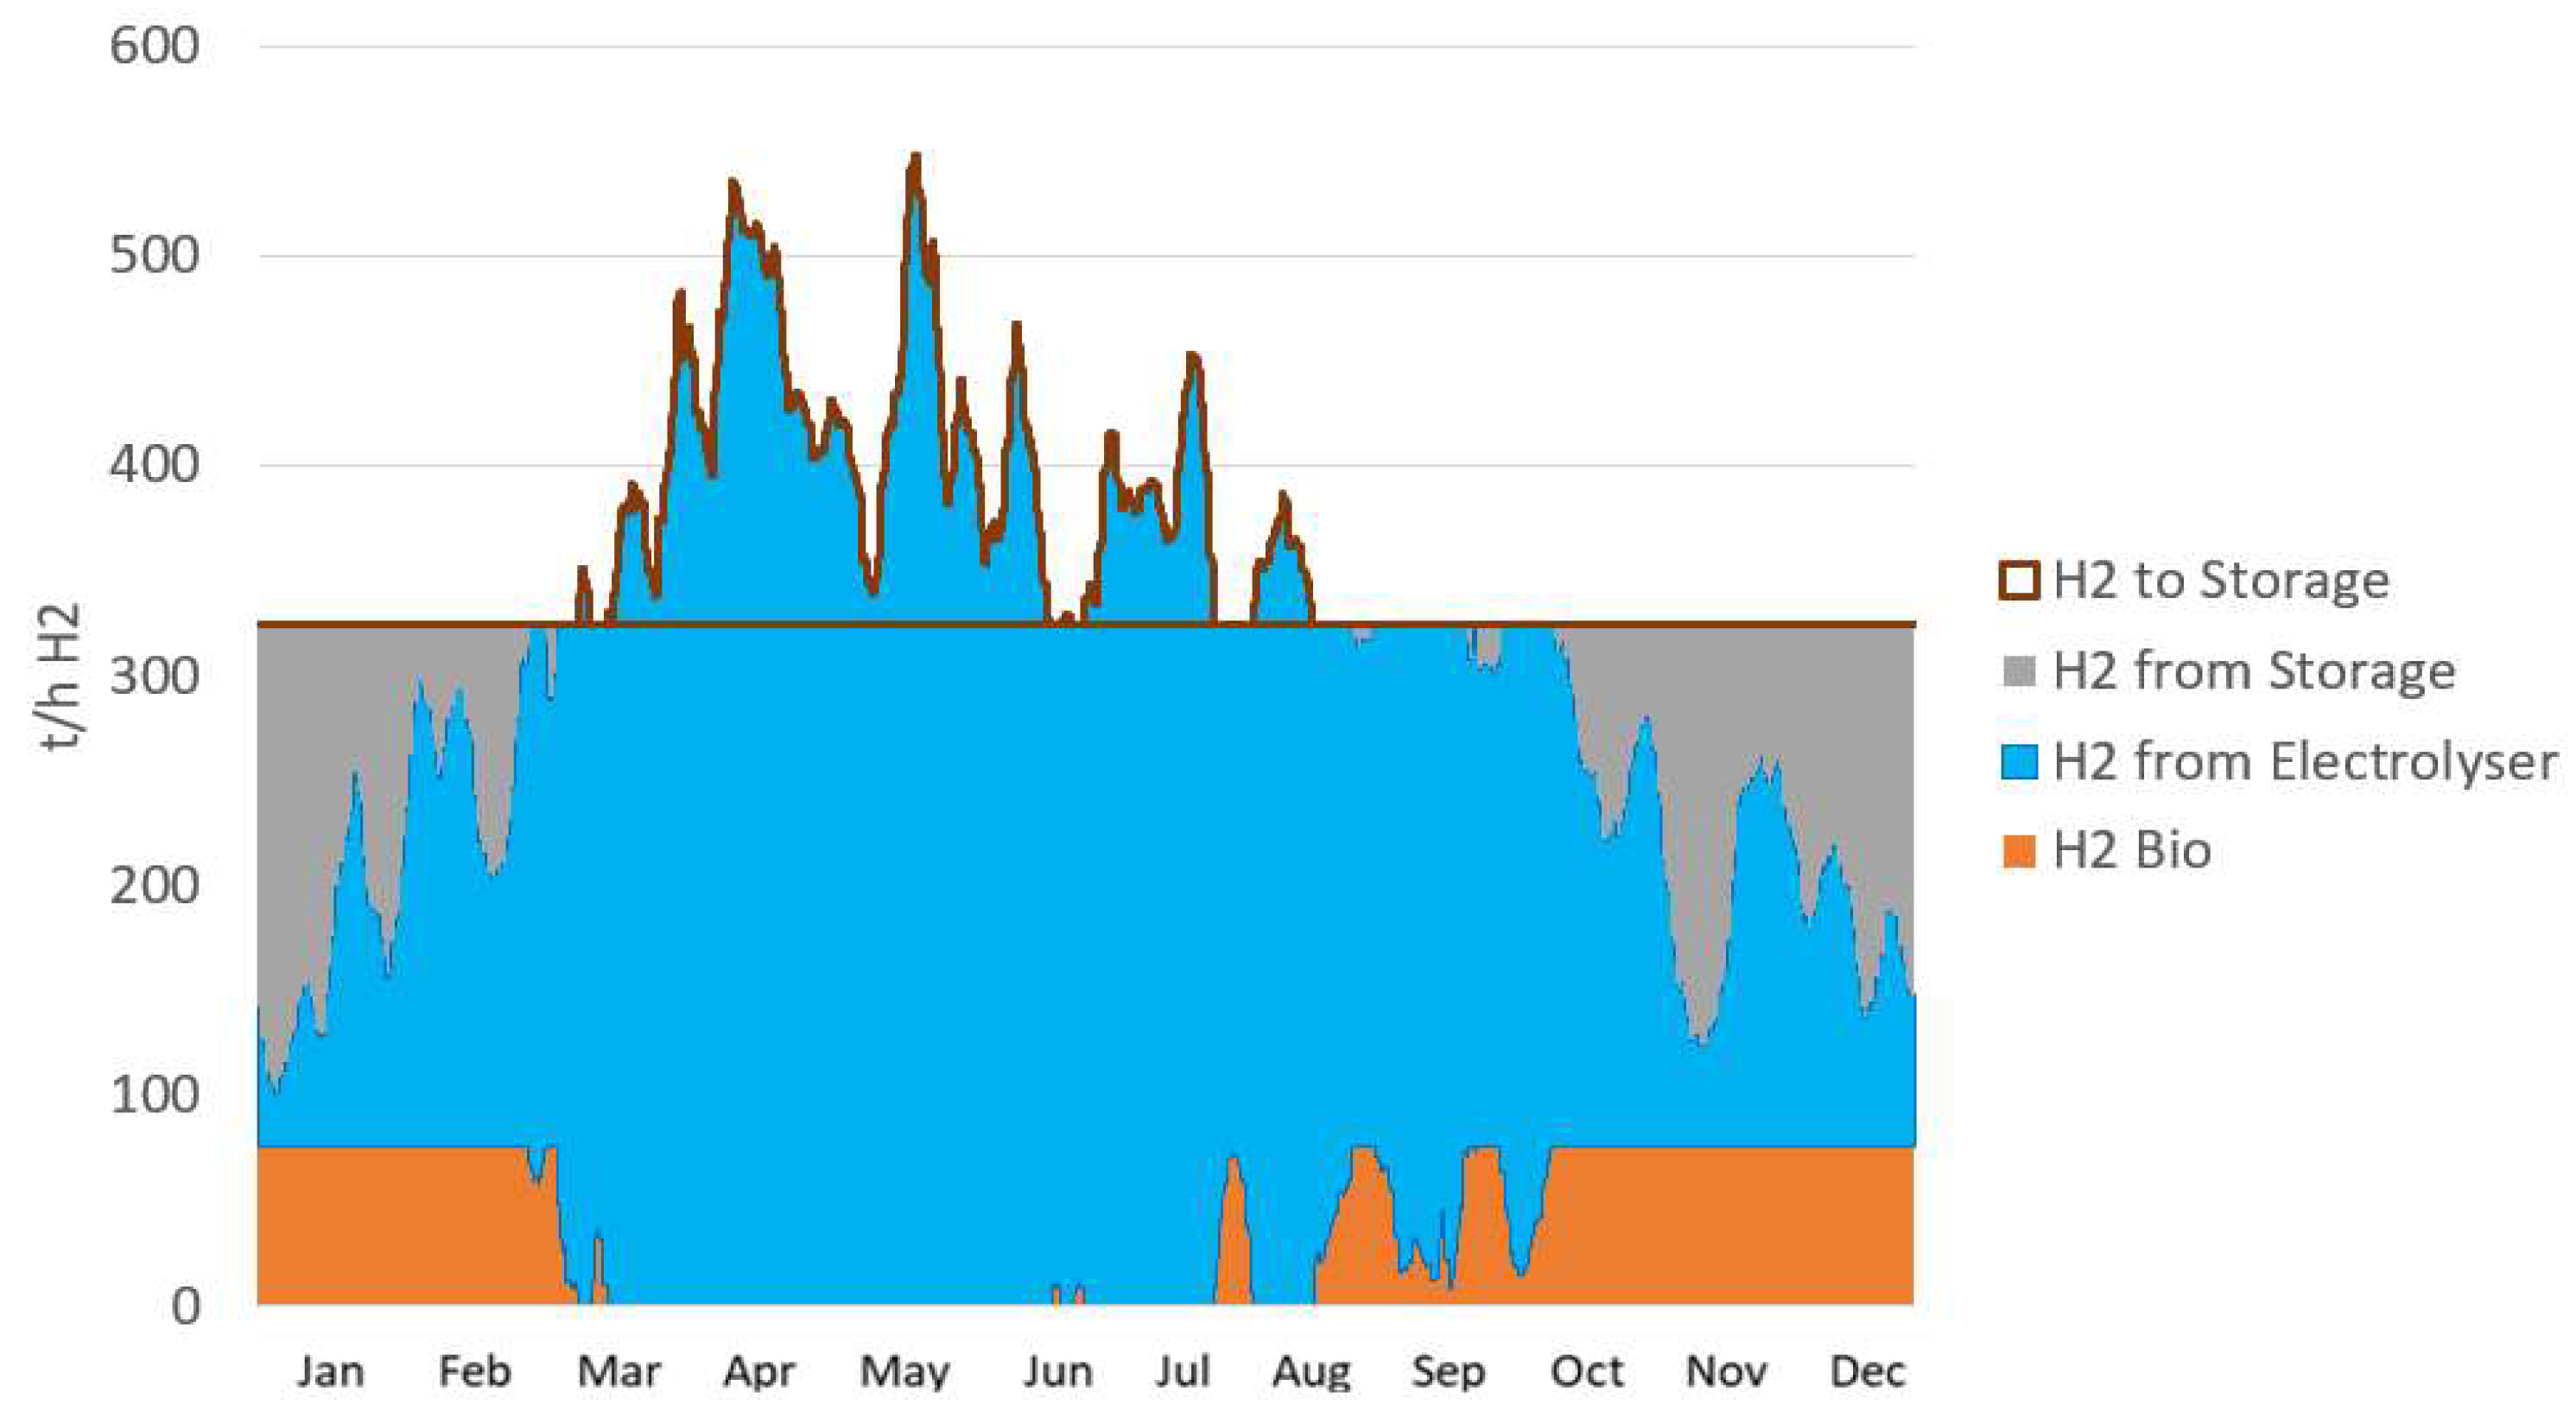
In order to have a first quantification of the H2 seasonal storage capacity the system needs, we compare the H2 production profile with the H2 demand profile during the year. In
Figure 12 are shown the weekly average profiles (moving average) of the exceedance in electric renewable generation which is used by the P2X plant and the unused overgeneration. In
Figure 13 is shown the weekly average profile of H2 production from electrolyzers and biomass gasification plants, and the area corresponding to the seasonal storage capacity needed to meet the H2 final users’ demand is indicated. In the scenarios analyzed in 2050, considering a best case of a very flexible use of H2 from biomass gasification, the minimum hydrogen storage capacity should be slightly more than 1 Mtep (380 kt H2). In the worst case of an inflexible and flat H2 bio production, the storage capacity rises to 1.6 Mtep (
Figure 14).
3.5. Hydrogen and Synthetic Fuels: A Disruptive Force
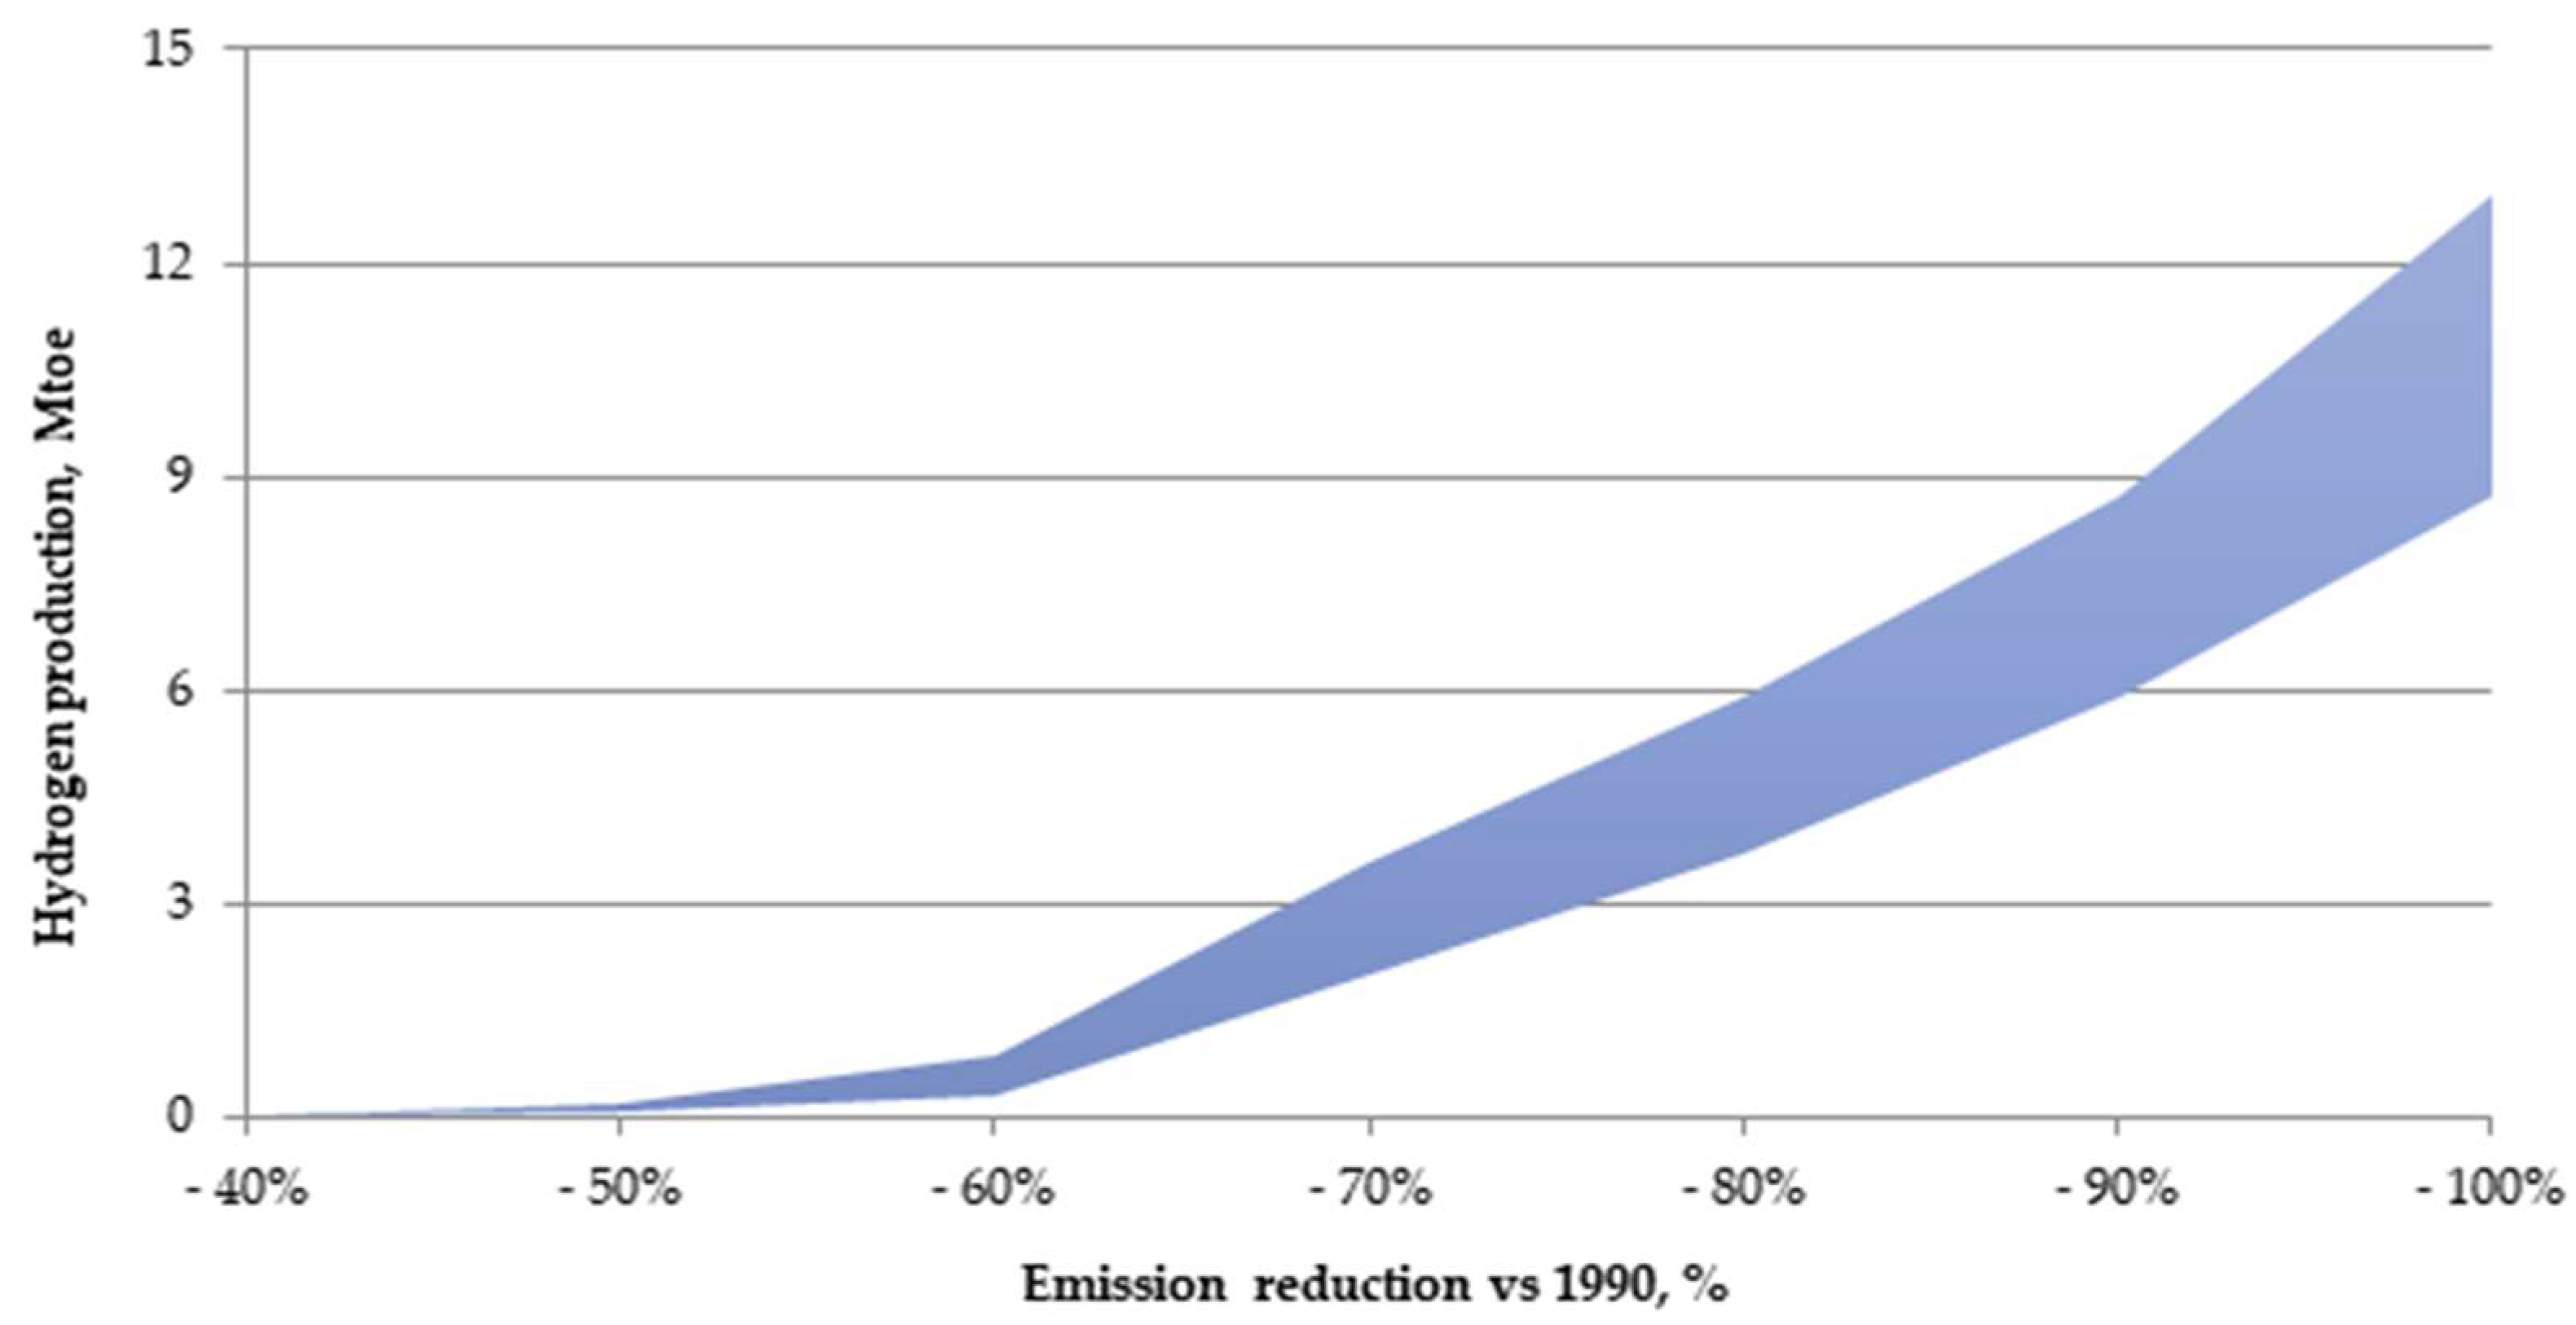
In the LTS scenarios elaborated with the TIMES_RSE model, renewable electricity generation will decarbonize most of the energy consumption by 2050, but not all fossil fuels can be replaced with electricity. Hydrogen has a real potential to fill part of this gap as a vector for the storage and exploitation of renewable electricity, in accordance with [
43]. It can be used directly for the decarbonization of non-electrical uses, or it can be transformed into alternative zero-emission fuels in combination with carbon deriving from zero-emission biogenic forms. In our study, we have considered a sensitivity by raising the emission reduction objective. The hydrogen role in the energy sector is strictly linked to the level of the climate-altering emissions reduction objective: an emission target of at least 50% reduction compared to 1990 is needed to promote the diffusion of the hydrogen vector from a few pilot plants and experimental applications at more extensive levels of use (
Figure 15).
The hydrogen development is closely symbiotic and integrated with the growth and spread of non-programmable renewable electricity sources. Deeper decarbonization of the energy system requires an increasingly green power system in order to electrify end-uses with a zero-emission vector [
38]. The presence of significant overgeneration resulting from intermittent renewables production, together with the expected cost reduction of electrolyzers, make green hydrogen economically competitive between 2030 and 2040. Hydrogen development is therefore boosted by an increasing share of non-programmable generation sources and their cost reduction, together with decreasing electrolyzer costs and improved supply chain logistics [
43]. The large-scale adoption of hydrogen (or hydrogen-derived fuels and products), as in full decarbonization scenarios, can in turn fuel a significant increase in the demand for renewable energy generation [
47]. On the other hand, stringent emission constraints make hydrogen convenient if not even necessary for those applications that cannot be electrified (hard-to-abate).
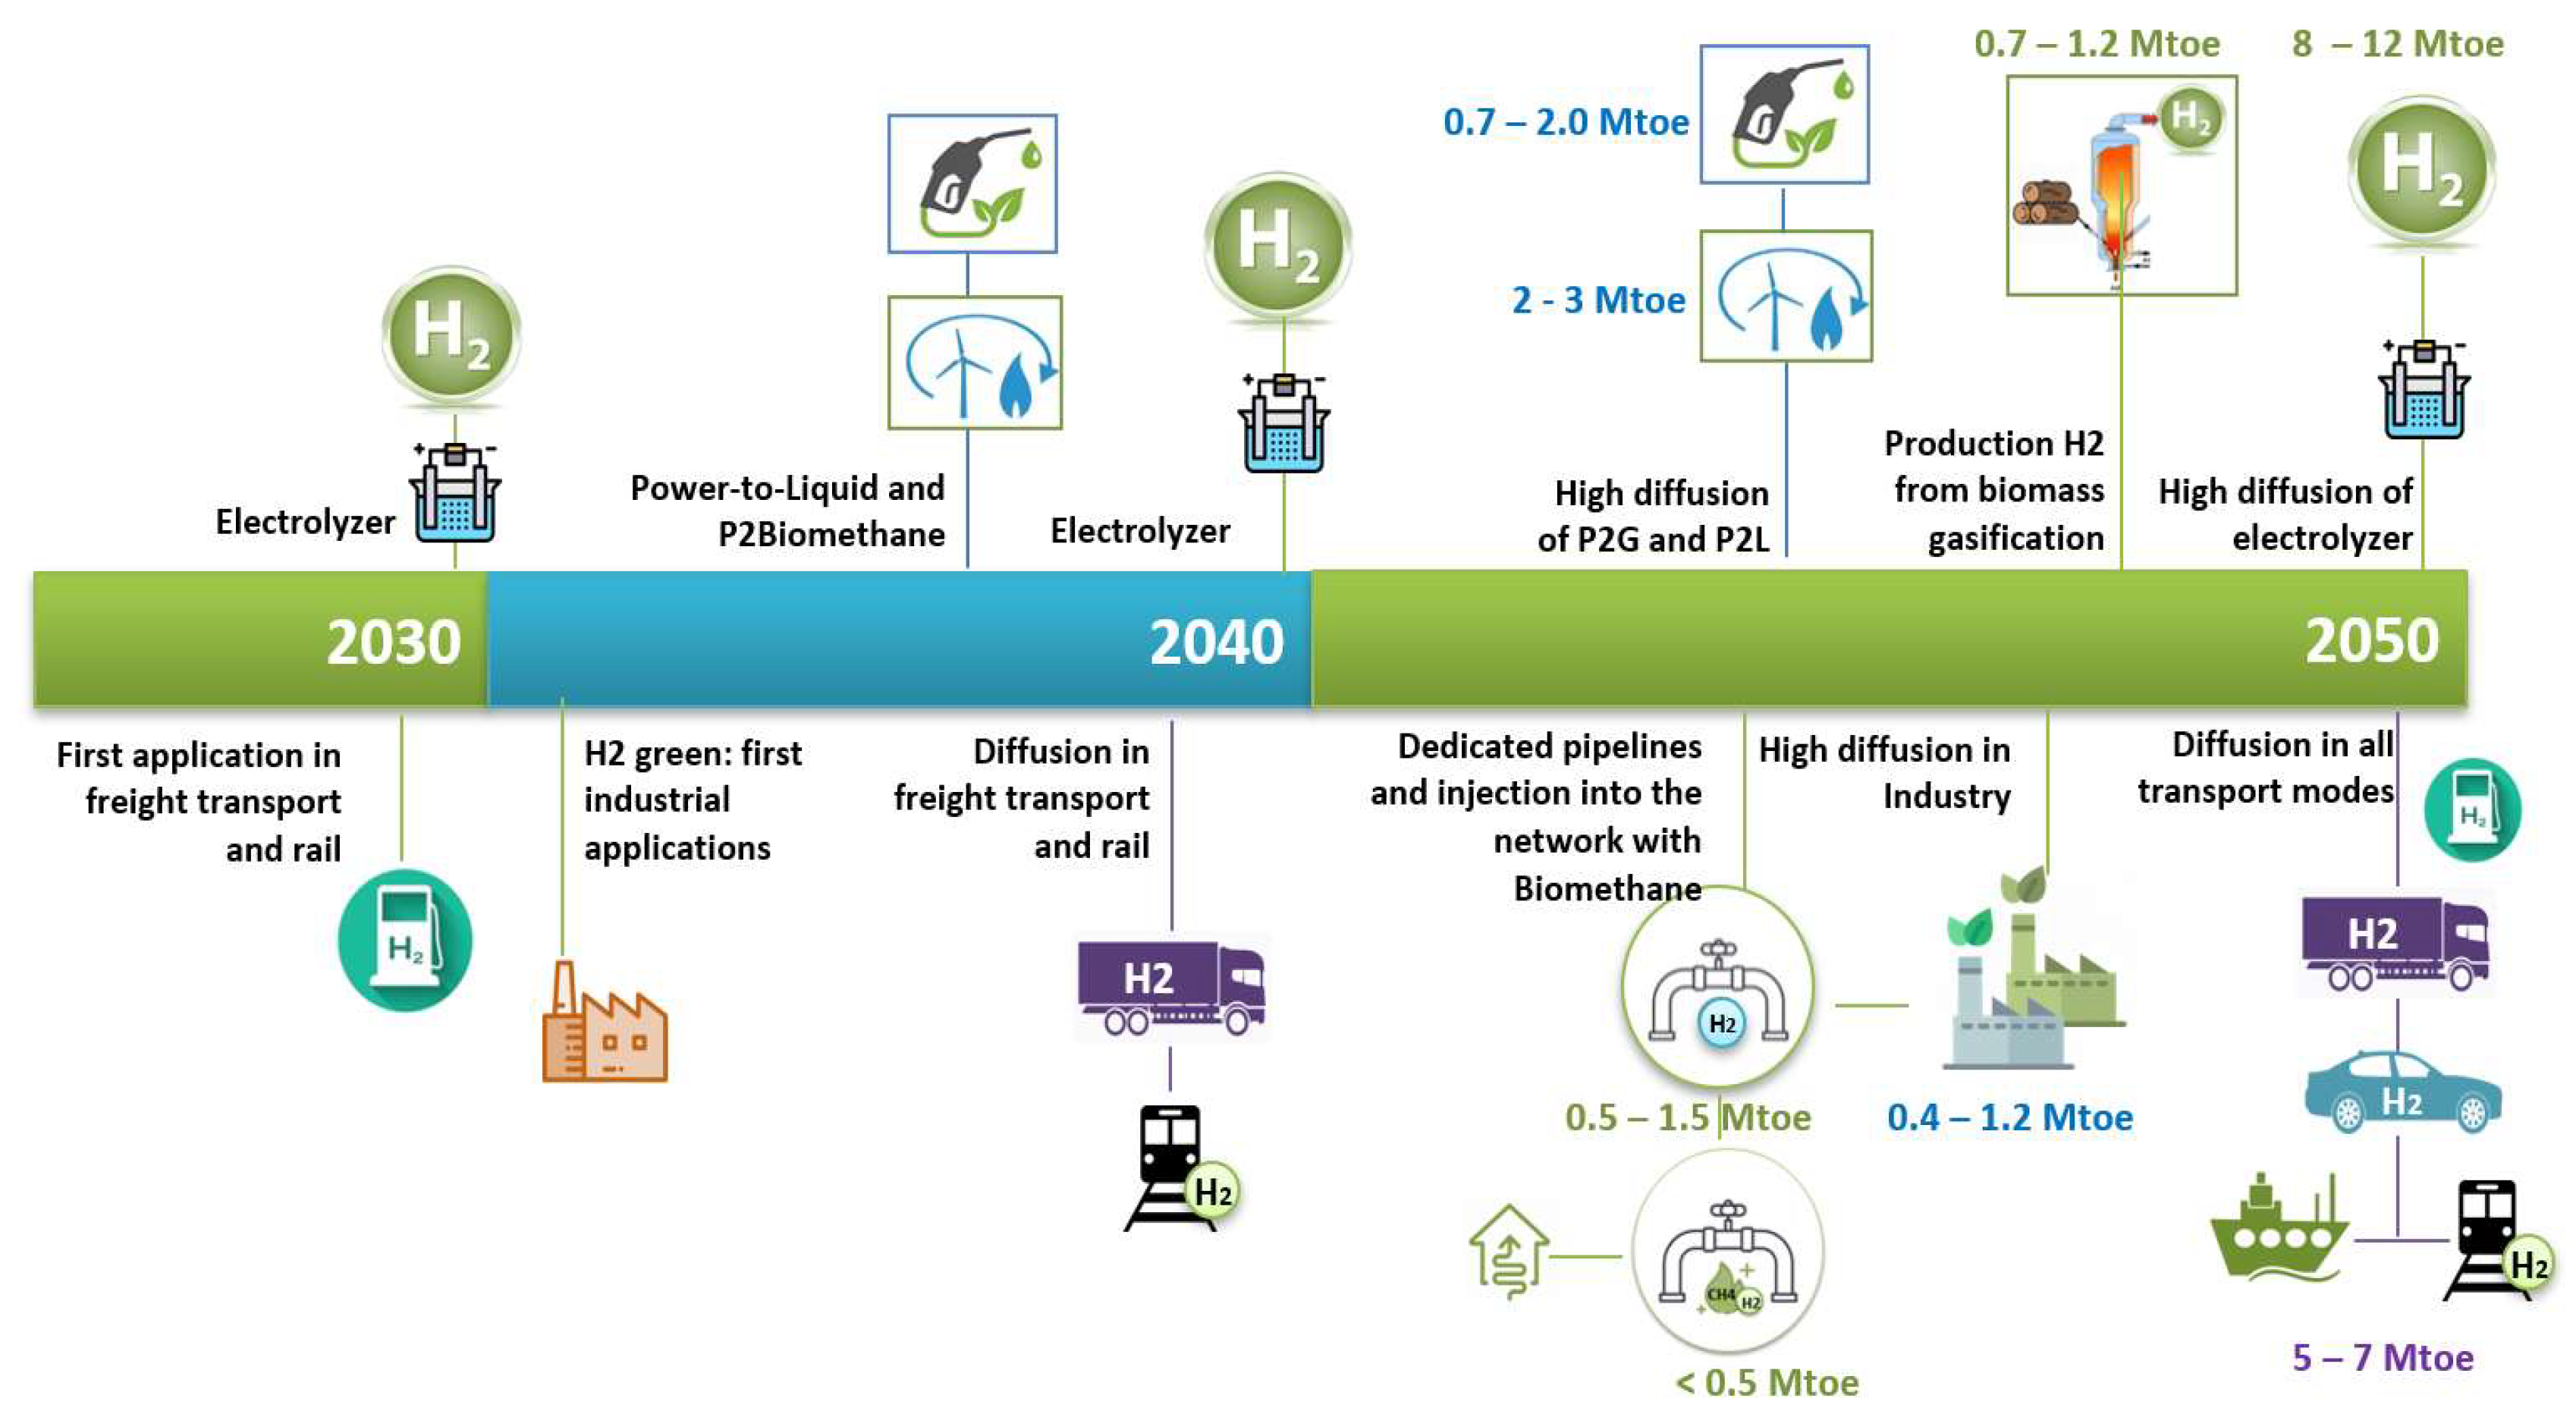
In all the scenarios analyzed, the first commercial application of hydrogen is, together with certain industrial applications, in heavy road transport and trains in the decade 2030–2040, while passenger mobility, mainly cars, decarbonizes through electrification. By 2050, the use of hydrogen in the transport sector becomes significant in our scenarios due to the expected decrease in the costs of the technologies. In the decade 2030–2040, the Power-to-X (P2X) technologies appear for the transformation of electricity into hydrogen and subsequently into synthetic fuels based on hydrogen and CO
2, with an initial greater diffusion of P2L (power-to-liquid) compared to P2G (power-to-gas) (
Figure 16).
Driving the initial promotion of P2L is the increased demand for decarbonization options for the freight sector, and liquid e-fuels are produced with similar characteristics to gasoline, diesel, naphtha or jet fuel. These types of e-fuels have a simpler storage of hydrogen and an easier integration with the existing logistics infrastructures (such as refueling infrastructures, tanks, etc.) so that the product management phase is more convenient than hydrogen as it is, at least until the necessary infrastructures for hydrogen transport are created.
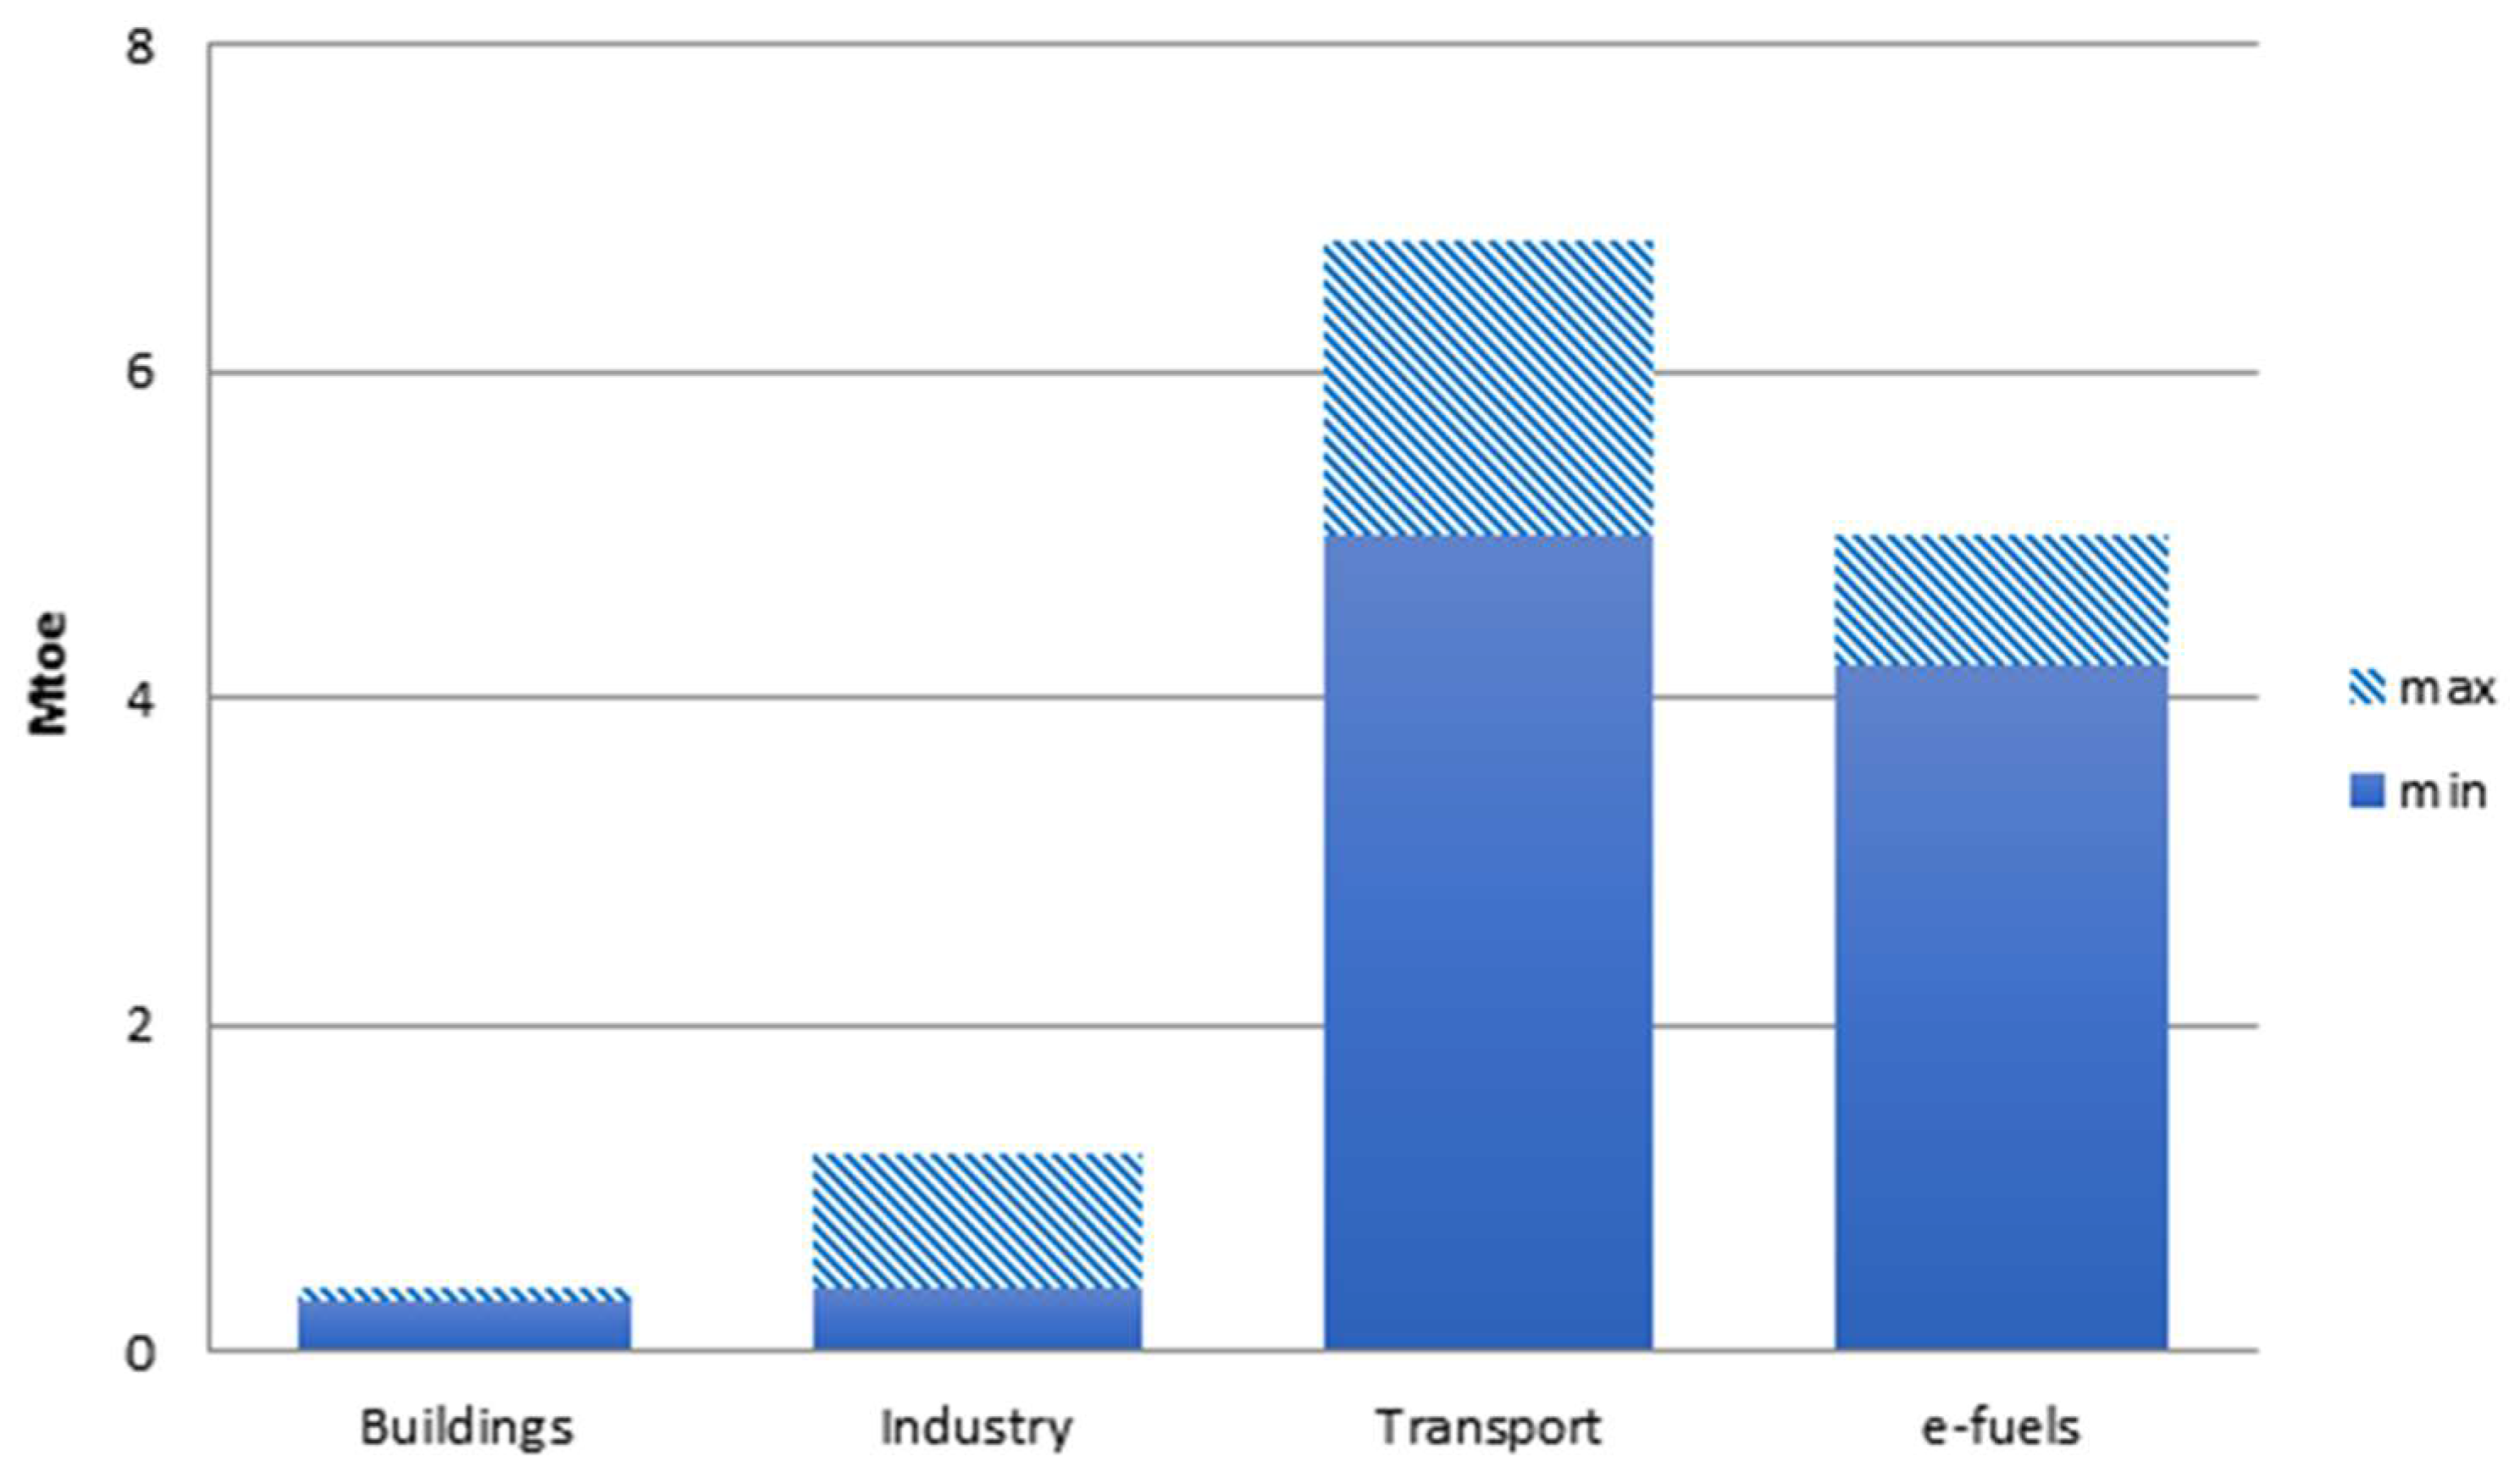
Figure 17 shows the range of use of hydrogen by sector in the various complete decarbonization paths analyzed.
4. Discussion of Decarbonization Challenges
This paper presents the energy scenarios developed by RSE to support the Italian government in outlining a national plan for a complete decarbonization by 2050, in accordance with the Paris Agreement. The TIMES-RSE model was used to represent and optimize the Italian energy system, as well as to investigate the role of different sectors, technological evolutions, innovative energy carriers and the paradigm shifts needed. Moreover, future challenges and technical and social criticalities are highlighted.
The following elements and trends emerge from the four energy scenarios analyzed:
The power sector has the potential not only to achieve carbon neutrality, but even to generate negative emissions when biomass power plants are associated with CO2 capture and storage technologies;
Transport, buildings and agriculture sectors can completely abate their emissions by 2050 as a result of massive energy savings, electrification and the deployment of green fuels such as hydrogen, biomethane and methanol;
The industrial sector can greatly reduce its combustion emissions thanks to energy efficiency, electrification, alternative fuels and carbon capture technologies, but difficulties remain with the emissions deriving from industrial processes;
The residual emissions from industrial hard-to-abate sectors, agriculture and livestock can be offset with the absorption of natural wells.
Given these premises, to achieve climate neutrality by 2050 the Italian energy system will have to resort to the following elements that are strongly interlinked:
The drastic change in the energy mix in favor of carbon-free sources;
Energy efficiency accompanied by behavioral changes that affect passenger, mobility and energy consumption in the buildings sector;
A significant electrification of end-uses.
The scenarios are built upon the fundamental energy efficiency first principle, whereby energy savings play a key role in Italian decarbonization. The reduction of energy consumption is expected to reach −30% and −40% for primary and final energy consumption, respectively, with respect to the 2019 situation. However, the expansion of the transportation sector and the energy demand for the production of new alternative carbon-free fuels (hydrogen, e-fuels) reduce the energy saving potentials for primary energy consumption.
Another fundamental aspect to tackle climate neutrality is a significant electrification of end-use sectors. Electricity becomes the main energy carrier in all sectors, especially in transport, where electric vehicles rank first in the share of cars and buses.
Where electrification encounters technical and economic barriers, alternative fuels are needed not only in transport but also in some industrial sectors.
Renewables are crucial for the decarbonization of the energy sector. By 2050, renewable energies are expected to make up to 80–90% of primary energy consumption, thus completely overcoming fossil fuels. The latter will still have a marginal role in hard-to-abate sectors, but their use will necessarily be paired with carbon capture technologies. The RES-e generation by solar and wind sources will reach values between 440 and 550 TWh. This unprecedented renewable generation will need to be assessed from different perspectives, such as the natural and technical potential of wind and solar resources on the national territory, as well as the impact of renewable plants on the environment and landscape, but also the consumption of the raw materials necessary for their construction [
48].
In addition to the technological and environmental aspects, it is necessary to solve the problem of power systems balancing, which becomes extraordinarily complex in the scenarios analyzed. In the power system, the electricity production doubles, the renewable capacity installed increases tenfold and the power peak production is four times the historical levels. An extremely complex and smart management of the electricity system will therefore be required, based on the best possible coordination of all flexible resources. It is necessary that all potential flexible resources (both production and consumption) will provide flexibility, contributing according to their own characteristics. Obviously, an important upgrade of transmission and distribution networks and the use of an expensive system of batteries is also indispensable.
A large share of the new generation capacity installed will be directly connected to the distribution grids, which therefore will have to be significantly reinforced [
49]; however, more importantly, distribution grids have to evolve in order to manage the greater distributed generation sources and loads compared to today.
Among the various forms of flexibility required by the electricity system, the need for seasonal storage, to transfer summer and spring excess production from photovoltaics to the winter months, is growing enormously. This problem cannot reach a solution within the border of the power system (only the few largest hydroelectric reservoirs could provide some seasonal accumulations of water while pumping, and batteries only work in the short term). The solution suggested here is to use the excesses of renewable electricity production, especially in the seasons with greater producibility, for the production of other energy commodities such as green hydrogen, liquid fuels of renewable origin, synthetic methane and heat for district heating systems with seasonal heat storage.
These uses (generically referred to as P2X) provide several benefits: the power system benefits take advantage of their flexibility, especially seasonal; on the other hand, the receiving energy system obtains a contribution for its decarbonization. It follows that, in order to provide the required flexibility, the P2X plants will have a limited operation, constrained in the hours of excess renewable generation (approximately around 2000 equivalent hours per year). Therefore, the commodity generated must have a transport and storage system adequate to a production concentrated in certain periods of the day/year. At the moment, this is doable for synthetic methane, for instance, or other liquid e-fuels. On the other hand, hydrogen faces greater difficulties for both transport (which has higher costs than other fuels) and storage (which has very high costs for short-term storage facilities and limited availability of seasonal storage, and which is also very concentrated).
Finally, in addition to the criticalities highlighted so far, of an energy system which is so radically different from the current one, the main challenge of the decarbonization process is probably the rapid pace required for the transition. It surely represents a challenge in terms of the industrial investments required, the infrastructure development and the risk of stranded costs, as well as the possible decommissioning or repurposing of some parts of the natural gas distribution network due to the electrification of heating systems, for instance.
However, let us not forget that the challenges become opportunities to reach the net zero goal. Analyzing scenarios of profound decarbonization helps governments and key stakeholders to understand where to turn their efforts, and where to invest in the research and development of technologies. With our analyses, we have seen an important role for hydrogen and its derivatives, and this has allowed us to open a debate in the world of research on the role that this vector could have in Italy. These analyses, and the challenges that are highlighted, allow us to understand which sectors will have a fundamental role, and for the public decision-maker, it is important to understand where to direct the main incentives or reforms for decarbonization.
The high amount of variable renewable sources in the power system allows us to think about how to change or upgrade infrastructure or market rules well in advance, without being caught unprepared by a transition that is becoming ever faster.
The decarbonization scenarios represent a future of the national energy system with a totally different framework from the current one. Such a deep revolution of the energy system raises several questions about its actual implementation feasibility. The challenges are not only technological, but, above all, they are related to the amount of investments required, to the complexity of the system that is going to be built, to the life habit changes that it entails, to the phase-out of some energy commodities or energy infrastructures and the possible consequences that may affect both the energy system itself and other systems.
So, research and innovation (e.g., better and more efficient storage systems and cheaper hydrogen generation) is very important to reduce the costs. The TIMES model can also estimate the system costs and investments necessary for decarbonization. Those costs are an important criterion for choosing between the scenarios and to understand the real impacts of the different decarbonization pathways. In this paper, there are no estimates of the order of magnitude of the additional costs because we plan to investigate all the economic dimensions, from technological investments to macroeconomic impacts, in a future study.
These questions may not find a complete answer today; instead, they must become a starting point, and the reference for current research themes. In fact, the work on long-term scenarios will proceed well beyond this study, as the Italian Long-Term Strategy will have to be officially updated in 2025. However, other energy and environmental policy documents (such as the Italian Green Deal, NECP and Hydrogen Strategy) will also be revised in order to achieve the 2050 objectives. New results of studies on innovative technologies and alternative fuels will be the basis for further and future sensitivities on the complete decarbonization scenarios.
These types of studies and analyses are, in fact, always updated, as the overall objectives and sub-targets established at the international level for the pursuit of decarbonization and the containment of temperature rise continues to evolve.


