Article

Inorganic Geochemistry of Crude Oils of Northern Eurasia after ICP-MS Data as Clear Evidence for Their Deep Origin

by
Kirill Svyatoslavich Ivanov
,
Yuriy Viktorovich Erokhin
and
Daniil Aleksandrovich Kudryavtsev
*
The Zavaritsky Institute of Geology and Geochemistry, Ural Branch (UB) of the Russian Academy of Sciences (RAS) Russia, Akademika Vonsovskogo Street, 15, 620016 Yekaterinburg, Russia
*
Author to whom correspondence should be addressed.
Energies 2022, 15(1), 48; https://doi.org/10.3390/en15010048
Submission received: 9 November 2021 / Revised: 12 December 2021 / Accepted: 19 December 2021 / Published: 22 December 2021
(This article belongs to the Special Issue Hydrocarbons in Global Energy)

Abstract

:
The emergence of mass-spectroscopy with inductively-coupled plasma (ICP-MS) made it possible to study the microelement composition of crude oil and its derivatives with the limit of detection (LOD) at the ppt level. We have studied the crudes from West Siberian (Shaimsky, Sredneobsky and Oktyabrsky regions) and Tatarstan Romashinskoye oilfields with the ICP-MS method to detect 50 rare, rare-earth, and other microelements. The elemental composition is reasonably comparable to their concentrations in ultrabasites whereas the contents of most of the elements are low to the limit. On the diagrams of rare-earth elements, one can see the prevalence of light lanthanides and positive europium anomaly. Increased content of platinoids was found in Tatar oils; in some cases, the concentration of ruthenium reaches 0.06 g/t. The study shows that studied crudes have a specific microelement composition. Based on the elevated contents of transit elements and platinoids, a conclusion was made about the “ultrabasic” geochemical–metallogenic specialization of studied petroleum systems and the assumption about its origin was proposed.

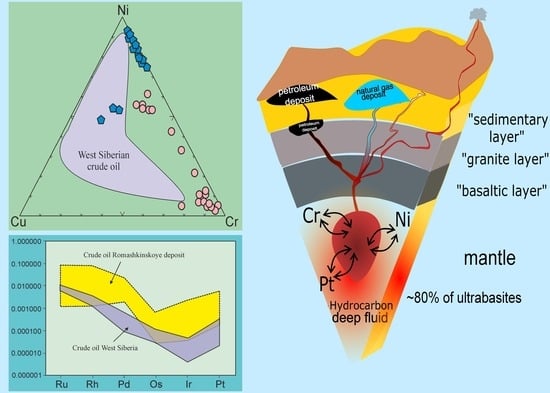
Graphical Abstract

1. Introduction

The growing development of analytical instruments brings geochemical research to a qualitatively new level [1,2,3,4,5,6]. With the introduction of inductively coupled plasma mass spectrometry (ICP-MS), it became possible to study the trace element composition not only of rocks but also of such complex mixtures as crude oil and other petroleum systems [7,8,9,10,11,12]. ICP-MS is one of the most advanced mass spectroscopy techniques due to its high sensitivity and the ability to perform multielement determination in a single analysis [13,14,15,16]. During the present study, we were able to investigate the trace element composition of various crude oils by the ICP-MS method for a wide range (more than 50) of rare, rare-earth, and other elements. The crude oil samples were taken from different regions of the two main Russian oil-producing provinces—Western Siberia (the fields of Shaimsky, Sredneobsky, and Oktyabrsky regions) and Tatarstan.
According to modern concepts (for example, [17,18,19]), the analysis of the distribution of rare and rare earth elements in crude oils makes it possible to identify the sources and characteristics of naphthide-forming fluids. Thus, in [19], it was suggested that the presence of a sharply positive Eu anomaly in crude oils (and this significantly distinguishes crude oil from the supposed source rocks with their rather narrow negative values of Eu/Eu* and from extracted bitumoids) indicates sources other than sedimentary in organic matter source of (at least) rare earth elements in the crude oil.
Since the crude oils from many provinces have very pronounced positive europium anomalies, then, according to [17,18,19], REE sources are predominantly deep rocks (i.e., ultramafic rocks) and (or) fluids. Based on the features of the distribution of REE in crude oil, crude oil source rocks, and bitumoids, it was concluded that deep fluids are one of the possible sources that determine the trace element composition of crude oil [17,18,19].
Well-founded ideas are also developing [20,21] about several sources of trace elements in oils: inherited from biogenic matter, borrowed from oil-bearing sedimentary rocks, and stratal waters and introduced through permeable zones from deep parts of bark and possibly mantle. Thus, the complex of impurity elements present in crude oils and their resinous–asphaltene fractions is polygenic; in terms of REE, it is likely to be an indicator of the input of some part of the oil components from subcrustal horizons.
A statistical analysis of the values of the correlation between the microelement composition of caustobioliths (crudes, coals, combustible, and black shales) with the composition of the upper and lower continental crust and the living matter was carried out [21]. It is shown that the content of the trace element composition of coals and oil shale correlates better with the chemical composition of the upper crust, while the correlation of the concentration of trace element composition in oils is higher with the composition of the lower continental crust. The correlation between the trace element composition of oils and living matter is statistically significant but weaker than with the composition of the lower crust. The calculation results also confirm the closeness of the trace element composition of oils within the same oil and gas basin and its difference in different basins. It has been shown that there are several “characteristic” elements (Cs, Rb, K, U, V, Cr, and Ni), the analysis of the concentration of which makes it possible to steadily assess the contribution of the influence of the upper and lower continental crust to the trace element composition of oils [21].
ICP-MS does not show in which compounds the microelements occurred, but with the evidence of [7,22] we could assume that most of the trace elements are part of the organometallic compounds—metalloporphyrins (V, Ni), salts of organic acids (Cu, Zn, Ge, Au), as well as colloidal (V, Fe, NaCl) and real (Cu, Fe, Pb, U) solutions adsorbed on the active oil/water surface (Zn, Cu, Ni, U, Ca, Mg, Fe, V). Metalloporphyrin complexes are concentrated in resinous–asphaltene fractions and heavy oil residues [14].

2. Materials and Methods

The inorganic petroleum geochemistry has been actively studied since the beginning of the 20th century due to the discovery of nickel, vanadium, and other metals in crude oil’s ash. Around 100 years ago, silicon, vanadium, nickel, tin, lead, calcium, magnesium, iron, aluminium, sodium, titanium, and gold were discovered in Mexican crude oil [23]. Almost immediately, wide variations in the content of nickel and vanadium were found in crudes from different regions of the world [24,25,26]. All these studies were carried out using the method of wet chemistry. The disadvantage of this method is its insufficient sensitivity; therefore, only elements with relatively high contents were determined in petroleum systems.
Later 1960-70x the methods of wet chemistry were replaced by methods of spectrometry, which made it possible to cover a larger spectrum of elements and to detect lower concentrations. Polarography [27], neutron activation [28], high-performance liquid chromatography [29], atomic absorption spectrophotometry [30], ICP-MS with inductively coupled plasma [31], and electrothermal evaporation treatment [32] are widely used in the petroleum industry. However, the ICP-MS method with inductively coupled plasma has the largest coverage in terms of the number of elements and concentrations.
The analysis was carried out using an ELEMENT 2 high-resolution mass spectrometer according to the methodology developed at the IGG UB RAS (Institute of geology and geochemistry, Ural branch of Russian Academy of Sciences) by Yu.L. Ronkin scientific group [12].
The decomposition of crude oil was carried out with a mixture of high-purity acids (HNO3, HCl) and hydrogen peroxide H2O2 in a Multiwave 3000 microwave oven manufactured by Anton Paar GmbH (Austria) with an 8XQ80 rotor (8 quartz reaction vessels, 80 mL each), which makes it possible to implement quite severe experimental conditions (maximum temperature and pressure—at 300 °C and 120 atm respectively). The chemical preparation of the samples was carried out in a “clean” room and the water for the experiments was additionally purified twice by the “subboiling” method [33]. Contamination levels were assessed for each reagent and monitored during analysis.
Determination of the 59 chemical elements’ mass fraction in the analyzed samples was carried out using a high-resolution sector tandem mass spectrometer with ionization in inductively coupled plasma HRICP-MS Element2 manufactured by ThermoScientific, Bremen, Germany. The measurements employed the following parameters: (1) spray gas flow—0.80 L/min; (2) plasma-forming flow—0.85 L/min; (3) cooling flow—16 L/min; (4) high-frequency power of the plasma generator—1050 W; (5) voltage on a two-stage (with automatic calibration of analog and counting components) detector—2500 V. The measurement technique involved daily verification of the instrument’s sensitivity, establishing a calibration dependence for the entire mass scale using six solutions certified for the content of elements: (1) U, Th; (2) Y, Zr, Sc, La, Ce, Pr, Nd, Sm, Eu, Gd, Tb, Dy, Ho, Er, Tm, Yb, Hf; (3) Be, Mg, Al, Ca, V, Cr, Mn, Fe, Ni, Cu, Zn, Ga, As, Se, Sr, Cd, In, Ba, Tl, Pb, Bi; (4) B, P, Ti, Go, Nb, Mo, Ta, W, Re; (5) Na, K, Rb, Cs; (6) Ag.
Based on the results of the standard solutions measured intensities using the MS standard software, the dependences were plotted in the coordinates “signal intensity-concentration”. These dependencies were further used to calculate the concentrations of elements in real samples. Double accounting of possible errors allows analysis of 59 elements with an accuracy ±(8–10)%. It is important to note that only the instrumental error is meant here. Errors were associated with possible contamination of the sample during the sampling process, “under-decomposition” of the sample (typical, for example, for Cr) or with the non-representativeness of the sample. An internal standard (Rh) was used to account for the interelement and sample matrix effects. The influence of spectral overlays in the mass spectrometric determination of elements was taken into account by the software method of mathematical correction. After measuring the next 10 analyzed samples, the calibration solution was measured and, in case of significant deviations from the previous calibration, a complete re-calibration was performed. Quality control of the obtained results was carried out employing parallel analyzes of internal verification samples and a multielement standard sample Conostan S-21 (Conostan, Ponca City, OK, USA, www.conostan.com, accessed on 11 October 2021), intended for measuring the mass fraction of metals in crude oil and crude oil derivatives.
This is one of the most compact and sensitive mass spectrometric systems, allowing detection limits at the ppt level [34]. The widest range of the detector makes it possible to analyze the matrix and microimpurities which differ from each other by up to 10 orders of magnitude in the same sample.

3. Results and Discussion

This section may be divided by subheadings. It should provide a concise and precise description of the experimental results, their interpretation, and the experimental conclusions that can be drawn.

3.1. Inorganic Geochemistry of West-Siberian Oil and Gas Megabasin

3.1.1. Shaimsky District

Information about the geology and oil-bearing capacity of the area has been published in various works [1,4,9,11]. In the Shaim oil and gas region, we have analyzed petroleum systems from wells in eight areas—Severo-Danilovskaya, Danilovskaya, Dorozhnaya, Ust-Teterevskaya, Ubinskaya, Lovinskaya, Tolumskaya, and Mortymya-Teterevskaya. The results are shown in Table 1.
The main geochemical feature of Shaim crude oil, as well as crude oils from other regions, is the extremely low content of elements. Thus, when normalized to the primitive mantle, the ultrabasites (“ultramafics”) depleted in most trace elements give a distribution in the region of 0.1 relative units and crude oil in the region of 0.001 (Figure 1). On the other hand, the contents of trace elements in the Triassic basalts of Western Siberia exceed the contents in the primitive mantle by a factor of 10 (see Figure 1), and these basalts are from the same Shaimsky region, where the crude oil we have analyzed was taken.
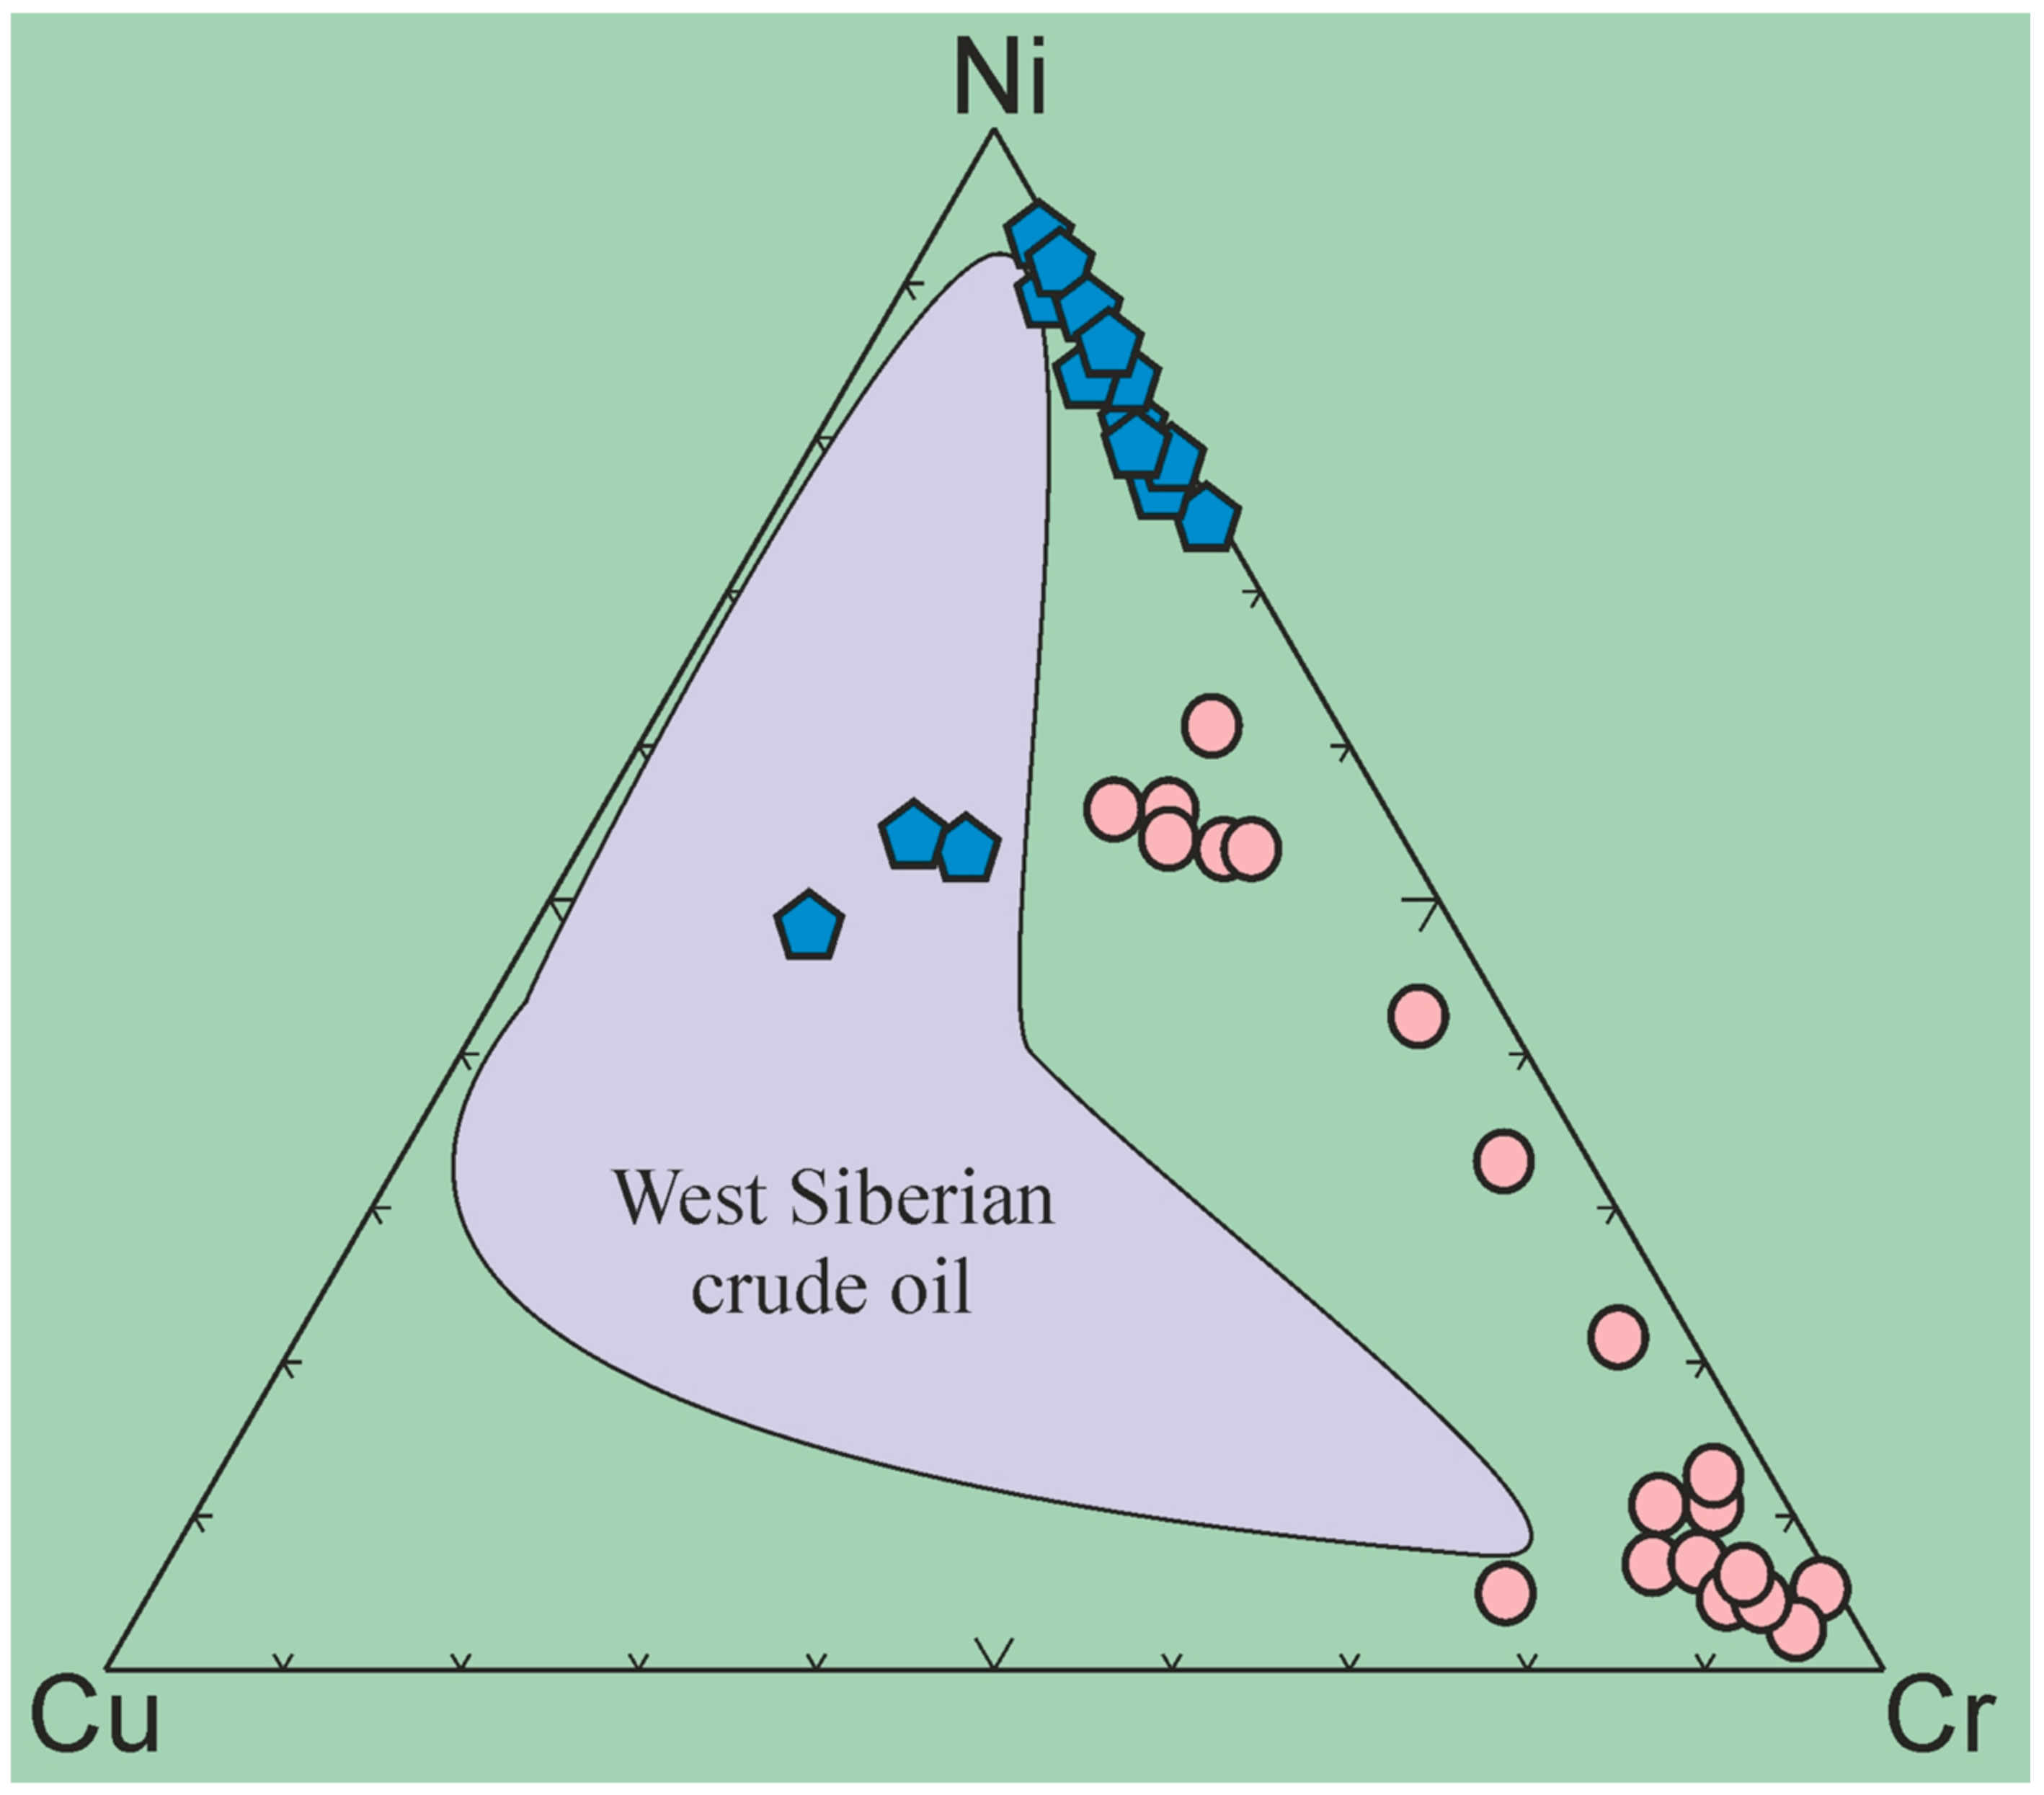
In the crude oil of the Shaim region, a certain group of trace elements is distinguished by relatively high contents (more than 1 ppm; see Table 1), mainly petrogenic components (Mg, Al, Fe, Na, Ti) and transit elements (Cr, V, Ni, Cu, Zn). On the Ni-Cu-Cr diagram (for resinous–asphaltene fractions) proposed by A.A. Marakushev and colleagues [6], Shaim oil belongs to the chromium type (see Figure 2), falling on the continuation of the trend outlined by these authors of the West Siberian province. The rest of the trace elements in the crude oils of the Shaim region are characterized by <1 ppm contents (see Table 1) but often higher than in some rocks. For individual components (cesium, rubidium, strontium, zirconium), the content of elements in crude oils is quite comparable with their content in ultrabasites. At the same time, the concentration of uranium in crude oils is significantly higher than in ultrabasites, chondrites, and intermediate rocks (according to [3]). The appearance of such an amount of uranium in crude oils can be explained by the reducing conditions of the environment and by the presence of a geochemical barrier for U-containing solutions which appears due to the dramatic change of the pH-value. As a result, high content of lead (comparing with chondrites) is also recorded in hydrocarbons (up to 0.3 ppm). The silver content in the Shaim oil was up to 0.1 ppm, and the amount of gold was no more than 0.002 ppm.
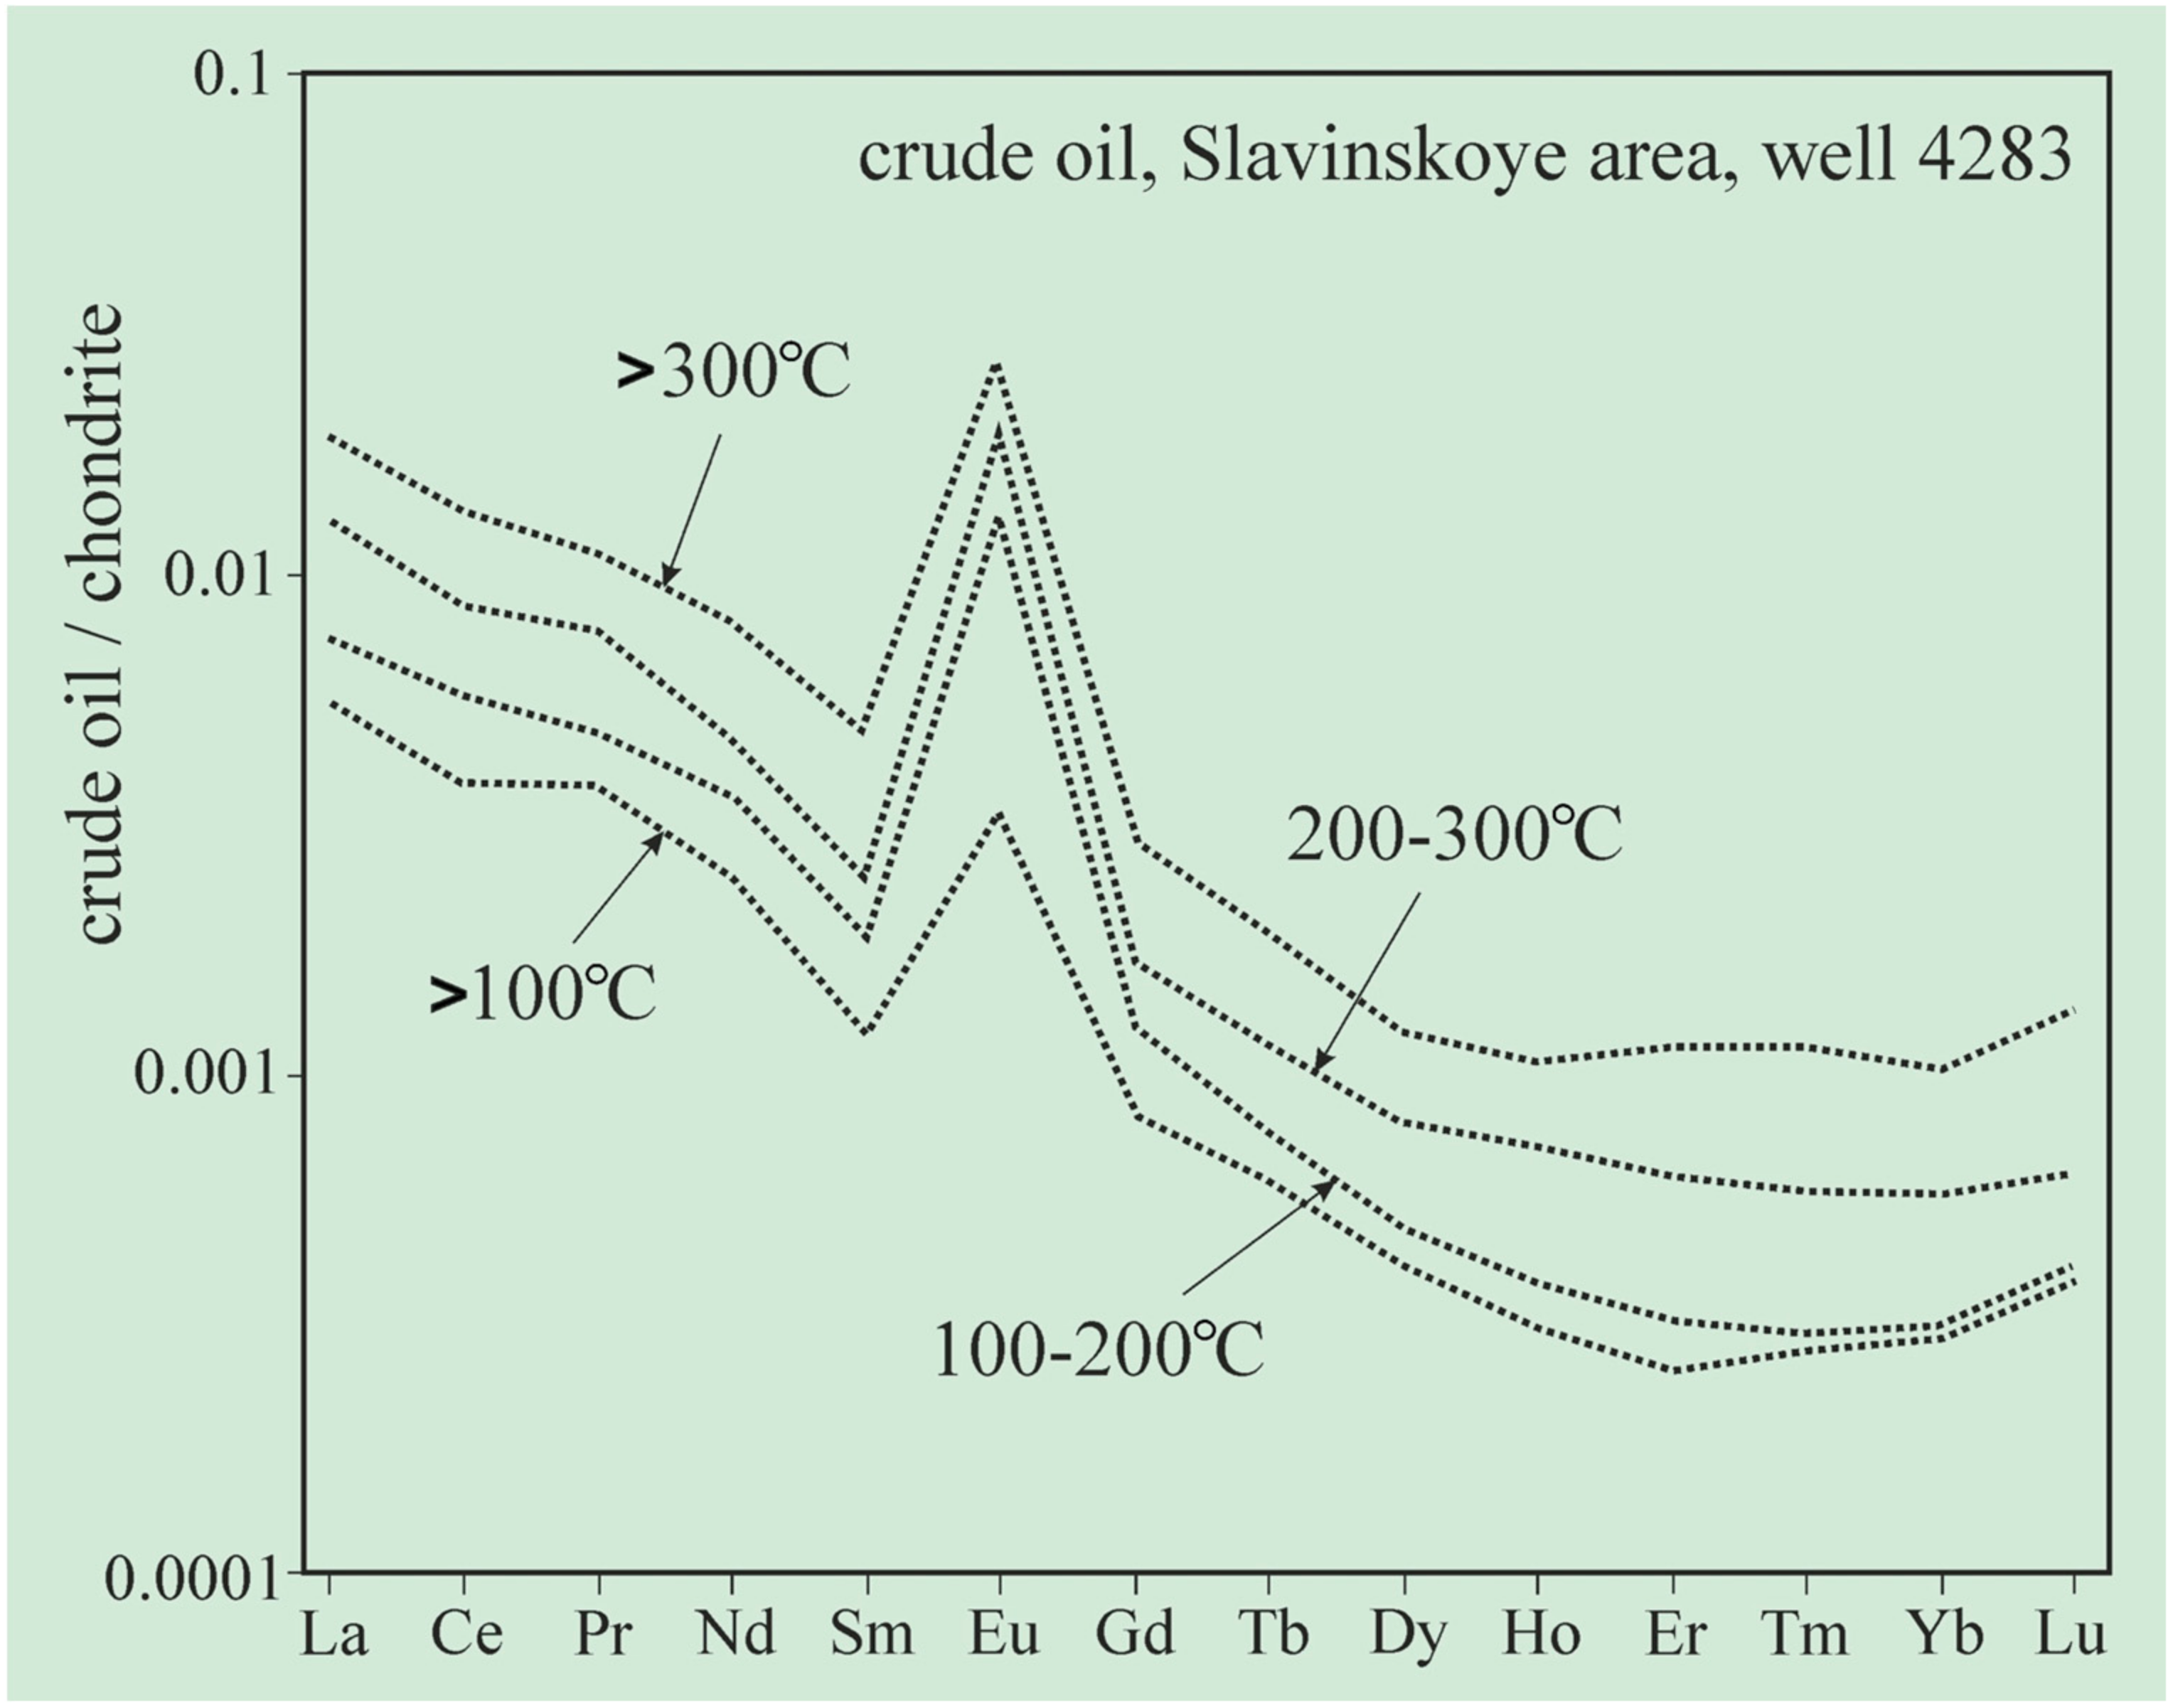
When normalizing the contents of trace elements in hydrocarbons to the contents in the primitive mantle (according to [16]), positive anomalies for uranium, strontium, titanium, yttrium, and zirconium, as well as negative anomalies for samarium, hafnium, thorium, niobium, and neodymium are established in the distribution (see Figure 1). Among them, crude oils from different areas of the Shaim region follow a unified geochemical trend. This is especially well observed for rare and trace elements, while significant differences are already noted in the contents of rare earth elements. Rare earth elements in Shaim oils, normalized to chondrite [16], show one type of trend with a gradual enrichment of light lanthanides. The REE distribution spectrum is characterized by a La/Yb ratio of 16–19 relative units with the presence of a sharply positive europium anomaly and a weak negative one for samarium (for example, the Slavinskoe deposit; see Figure 3). In addition, the composition of REE in different fractions was studied for the same crude oils. Here the heaviest fractions of hydrocarbons are characterized by higher concentrations of lanthanides, while the configuration of the trends remains practically unchanged (Figure 3).
In general (Figure 3), the europium ratio is an indicator of reducing conditions; often a positive europium anomaly characterizes a reducing environment, which is known to be typical for hydrocarbons as well. The geochemical peculiarity of europium is that its valence is variable. Under the conditions of the earth’s surface, with free access of oxygen, it is trivalent (like other REE), but in the heated depths of the Earth, in the absence of free oxygen, europium is reduced to a bivalent state and becomes more mobile, passing into hydrothermal solutions circulating along the cracks of rocks. According to the most representative work ([18]; as well as the data of other researchers) on the distribution of rare earth elements in the section of the earth’s crust, a positive europium anomaly could be characteristic of deep formations.

3.1.2. Sredneobsky District

Deposits of the Sredneobsky region are located in the central part of the Khanty-Mansi Autonomous Okrug in the vicinity of Kogalym town. In total, crude oils from three different sites were analyzed. The results of measurements are shown in Table 2 (1–3). In crude oils of the Sredneobsky region, a certain group of trace elements is distinguished by relatively high content (more than 1 ppm), mainly petrogenic components (Na, Mg, Al, Fe) and transit elements (Cr, V, Ni, Co, Cu, Zn). The number of light elements (Li, Be, B) in the studied samples usually does not exceed 0.1 ppm. Thus, the content of lithium reaches 0.008 ppm, beryllium reaches 0.0009 ppm, and boron reaches 0.13 ppm (see Table 2).
During the normalization of trace elements in petroleum systems to the primitive mantle (according to [16]), the trends are very similar to the distribution in crude oils of the Shaim region (see Figure 1). On the Ni-Cu-Cr diagram proposed by A.A. Marakushev et al. [6] for resinous–asphaltene fractions, this crude oil belongs to the nickel-chromium type (see Figure 2), falling into an intermediate region between the two types. Rare earth elements in the crude oils of the Sredneobsky region show the same distribution spectra as the hydrocarbons of the Shaim region—a gradual increase in light lanthanides, as well as the presence of a sharp positive europium anomaly and a weak negative one for samarium.

3.1.3. Oktyabrsky District

During the presented research we studied the oils of the Serginsky area. The crude oil deposit is located 16 km north of the city of Nyagan within the Oktyabrsky district of the Khanty-Mansi Autonomous Okrug. In total, five crude oils from various wells of the field were examined. The results of measurements are shown in Table 2 (4–8). In the crude oil of the Oktyabrsky district, the group of trace elements is distinguished by relatively high contents (more than 1 ppm) of petrogenic components (Mg, Al, Fe, Na, Ti, P, Ca) and transit elements (Cr, Ni, Zn). On the Ni-Cu-Cr diagram, this crude oil is of the nickel type (see Figure 2).
The rest of the trace elements in the crude oils of the Oktyabrsky district are less than 1 ppm (see Table 2), but these amounts are higher than in some rocks. For individual components (Ba, Sr, Zr, etc.), the content of elements in crude oils is quite comparable with their contents in ultrabasites. The amount of silver in the crude oil was lower than in the Shaim region (up to 0.05 ppm), and the amount of gold was significantly higher (no more than 0.025 ppm). Crude oil in the Oktyabrsky district has approximately the same PGE content, except for the rhodium content, where there is a large scatter of contents (by an order of magnitude) and in some wells in the contents of palladium and iridium, which differ by a factor of 10 or more. It is important to mention that the trends in the distribution of platinoids in crude oils of Western Siberia have similar features and are usually characterized by the predominance of low-melting elements over refractory elements.
Rare earth elements in the crude oils of the Oktyabrsky region show the same distribution spectra as the hydrocarbons of the Shaimsky and Sredneobsky regions—a gradual increase in light lanthanides and the presence of a sharp positive europium anomaly.

3.2. Inorganic Geochemistry of Tatarstan Crude Oils

We studied the crude oils of the Romashkinskoye oil field (Abdurakhmanovskaya and Berezovskaya areas) of the Republic of Tatarstan [5,8,10], while sampling of the crude oils was carried out under the guidance of Dr. G.P. Kayukova from the Institute of Organic and Physical Chemistry (Kazan, Tatarstan, Russia).
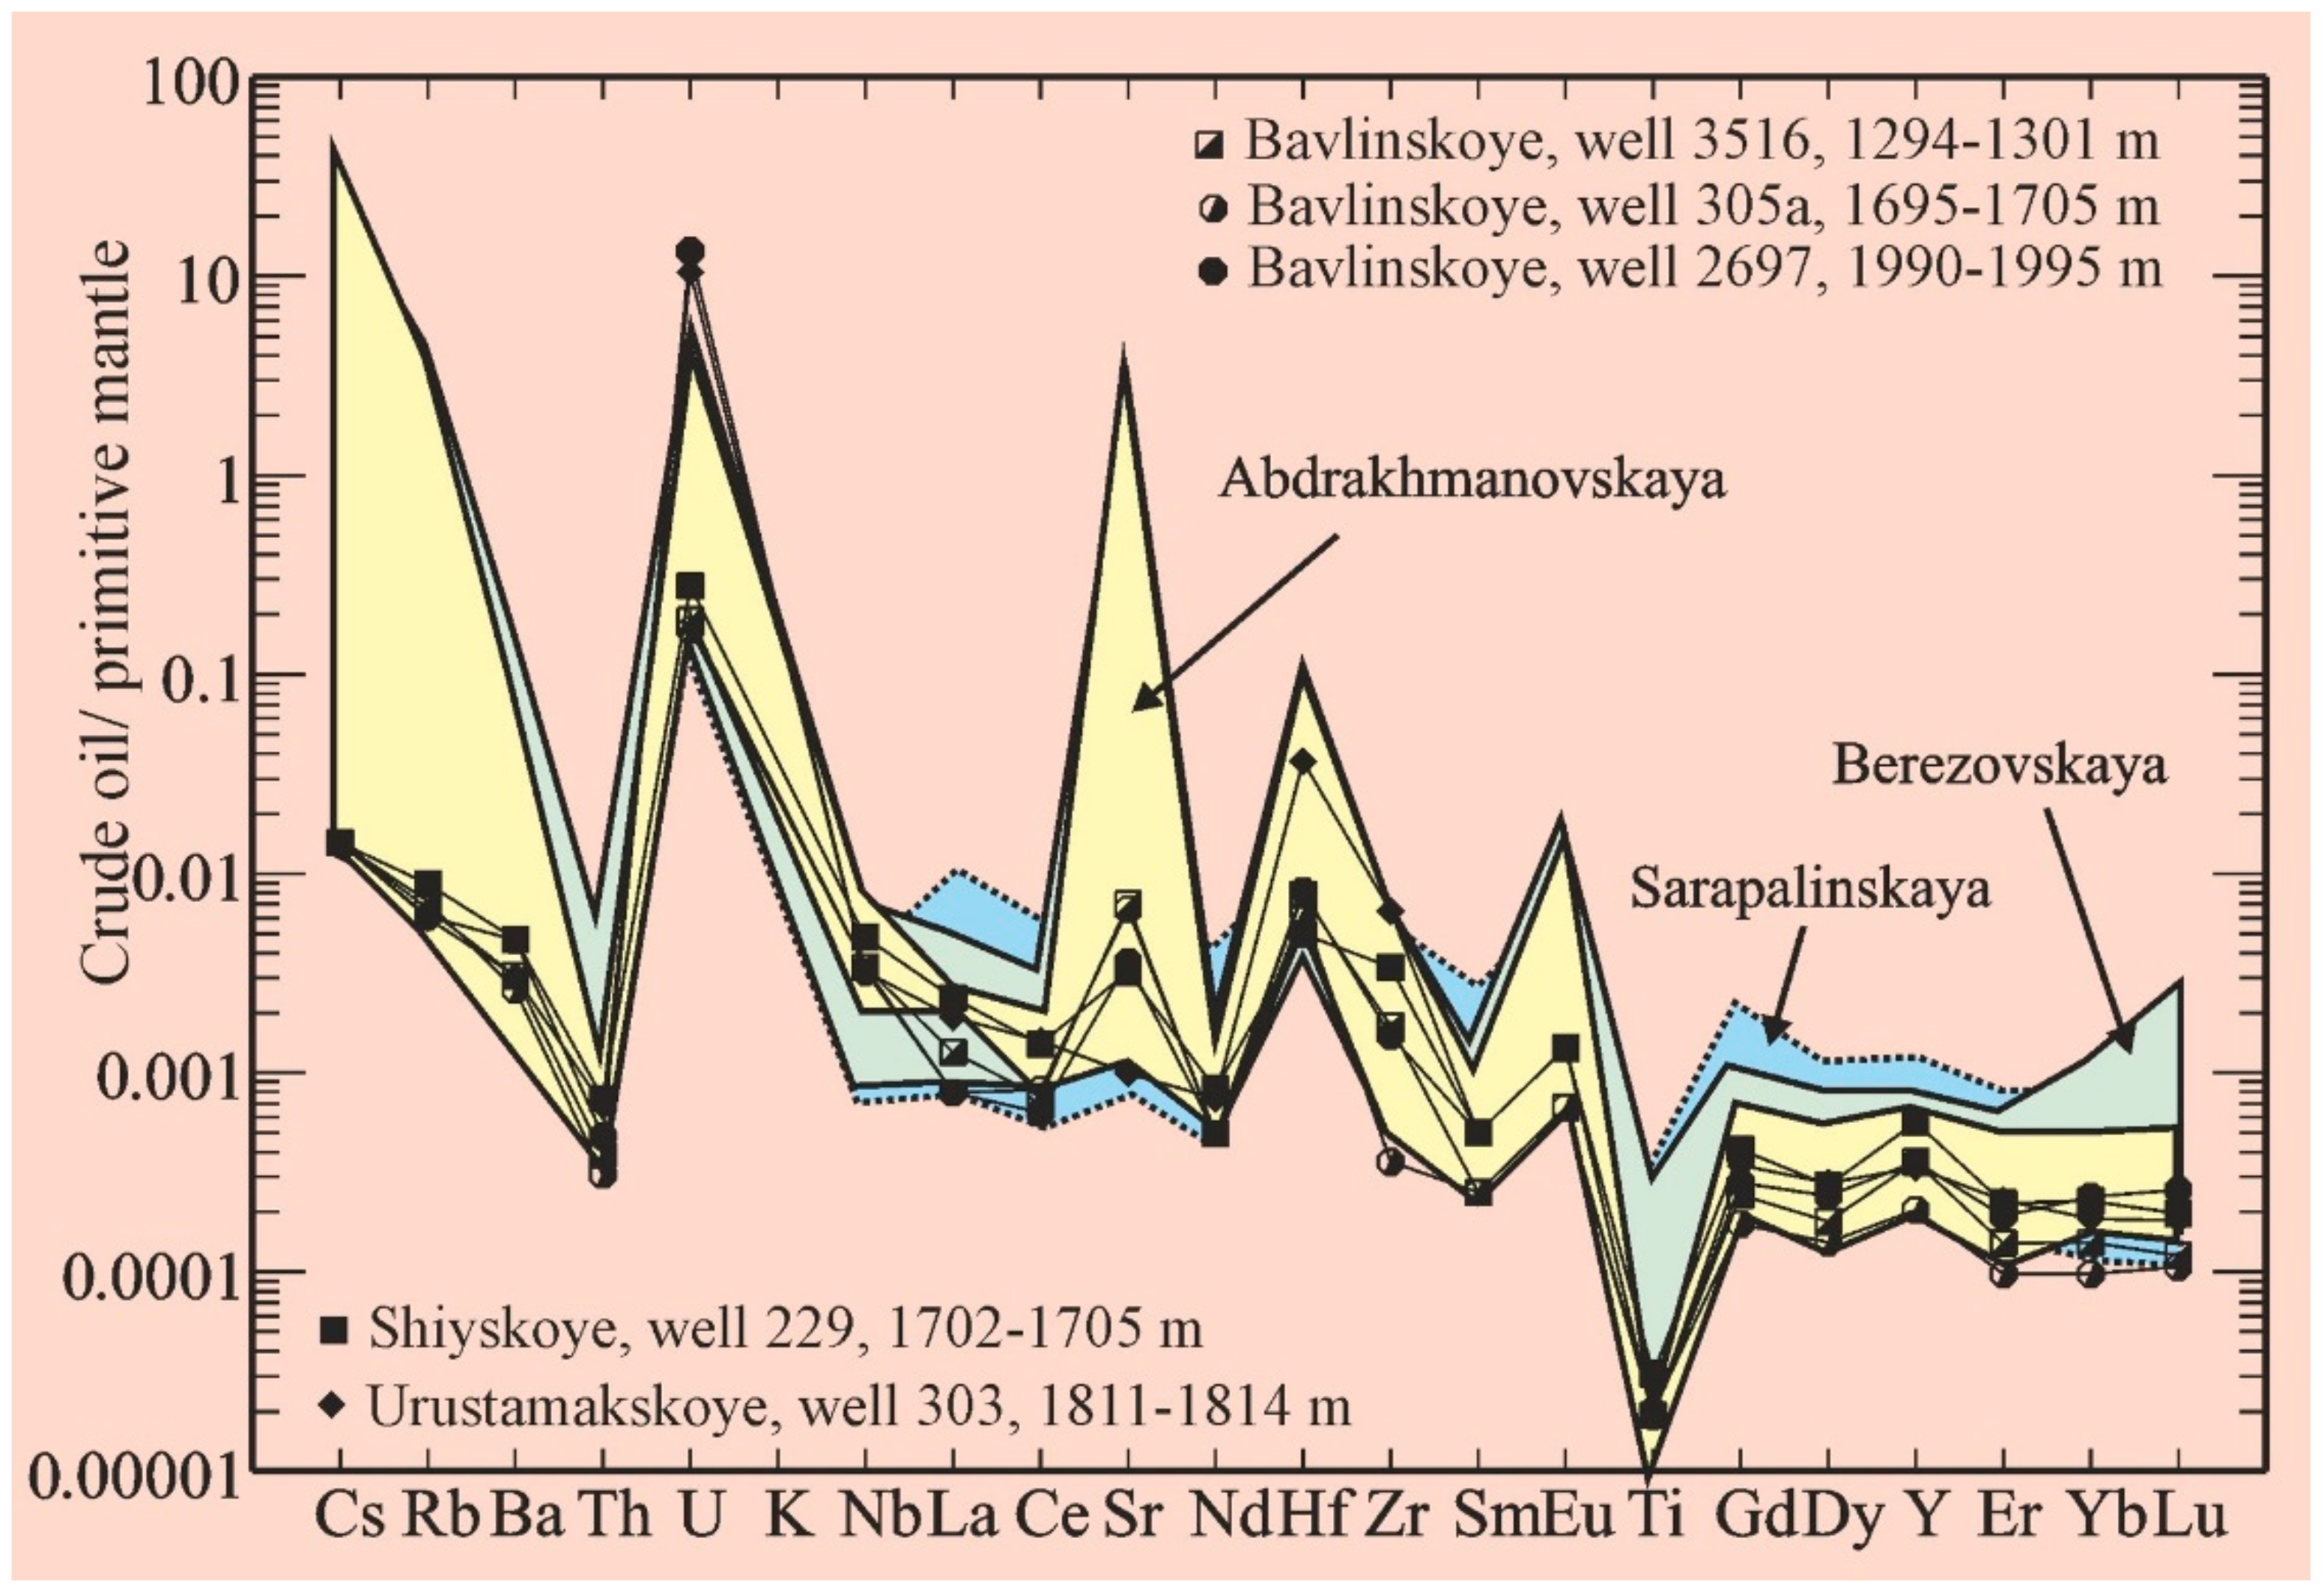
The content of elements in the crude oils of Tatarstan is extremely low (while comparing to the West-Siberian crudes), except for certain components (V, Ni, Cr, Ca, Sr, Na, Rb, Cs, etc.). The general trend of trace elements is about two to three times below the level of the primitive mantle or chondrite. Table 3 and Table 4 show the contents of trace elements in the oils of the Romashkinskoye oil field, Abdrakhmanovskaya, and Berezovskaya areas, respectively. Crude oils of both areas are characterized by a single geochemical trend, differing in the contents of individual elements. For example, we have isolated high-strontium hydrocarbons with anomalous Sr content up to 55–63 ppm [5]. These hydrocarbons are confined to the reservoirs of the Upper Devonian deposits (wells Abd 13,813, depth 1784–1798 m; Ber 21,549, depth 1769–1773 m; Ber 21,726, depth 1780.3–1782.2 m). These crude oils were in contact with gypsum-containing (sulfate) strata with a high content of celestine. This assumption is supported by the fact that, along with strontium, hydrocarbons are abnormally enriched in calcium (from 90 to 160 ppm). The rest of the crude oil samples are distinguished by strontium contents from 0.3 ppm and below. In some cases, positive anomalies for rubidium, barium, and cesium appear but only for high-strontium oils. In absolute concentrations, the concentrations for rubidium reach 2–2.5 ppm, for cesium 0.1–0.3 ppm, and for barium up to 1.1 ppm. These are truly abnormal characteristics because the average content in crude oils (in ppm) is cesium 0.0043 and rubidium 0.015. At the same time, the rest of the hydrocarbons are distinguished by lower concentrations of these elements in comparison with the average content. Since rubidium, barium, and cesium form a direct dependence on strontium, we assume the presence of these components in crude oil in the form of a mechanical suspension of celestine or as a result of its dissolution.
In addition, the oils of the Abdrakhmanovskaya and Berezovskaya areas show increased concentrations of petrogenic elements such as Ca, Al, Fe, Mn, Na, and Mg. We have also mentioned calcium in connection with high-strontium crude oils, in which the Ca content increases abnormally up to 160 ppm (with the usual variation from 1 to 13 ppm). However, in the same crude oils, the concentration of sodium (from 700 to 2000 ppm) and magnesium (from 50 to 70 ppm) increases sharply. The amount of these elements usually varies from 0.5 to 90 ppm and from 0.2 to 0.6 ppm. As mentioned above, such a difference in grade may be since high-strontium crude oil was produced from sulfate-containing strata. The rest of the petrogenic components are characterized by lower contents—Fe (up to 10 ppm), Mn (up to 0.6 ppm), and Al (up to 2 ppm). For example, West Siberian crude oils are distinguished by even lower concentrations of manganese (up to 0.4 ppm) but high iron (up to 100 ppm) and aluminum (up to 9 ppm) concentrations. This observation confirms the influence of the composition of reservoir rocks on the trace element composition of crude oil. In Western Siberia, the reservoirs are represented by terrigenous sediments and in Tatarstan by carbonates.
The contents of rare earth elements in the crude oils of the Abdrakhmanovskaya and Berezovskaya areas of the Romashkinskoye oil field, normalized to chondrite, show one type of trend with a gradual enrichment of light lanthanides (see Figure 4). The REE distribution spectrum is characterized by a La/Yb ratio of up to 20 relative units with a positive or sharply positive europium anomaly. A sharp positive europium anomaly is characteristic of high-strontium crude oils from the Romashkinskoye field. In these samples, the europium content reaches 0.003 ppm, while in the rest it is no more than 0.001 ppm. The average content of this element in oil is defined as 0.00094 ppm, which is consistent with our experiments. Lanthanides form a direct relationship with each other and an inverse relationship with europium, which reflects the geochemical anomaly of europium on the general REE trend. The spectrum of lanthanides in the studied petroleum systems is in good agreement with the data on the content of REE in asphaltenes from crude oils of the South Tatar arch, for which weak positive anomalies for europium were also established [2]. The positive europium anomaly was recorded in all samples. This, to some extent, confirms the prospects for the crude oil and gas content of the Tatar basement (see [10]), since, according to other researchers, such anomalies are not characteristic of the upper crust formations and may indicate a deep (possibly mantle) origin of oil [6,25].
For West-Siberian crude oil, we have indicated a similar distribution of lanthanides with a positive anomaly for europium and a weak negative anomaly for samarium. In general, the trends in the distribution of elements in West-Siberian naphthides are very similar to the spectra of crude oils from the Romashkinskoye field, even though they have significant differences [13].
Crude oils from different areas of Tatarstan form an almost unified geochemical trend (Figure 5). Three types of distribution are observed for strontium in hydrocarbons-high-strontium (Sr content 55–63 ppm), medium-strontium (0.1–55 ppm), and normal-strontium (no anomalies, <0.1 ppm). The first type is found only at the Romashkinskoye field in the Upper Devonian deposits (Abdrakhmanovskaya 13,813, depth 1784–1798 m; Berezovskaya 21,549, depth 1769–1773 m; Berezovskaya 21,726, depth 1780.3–1782.2 m). These crude oils were produced from gypsum (sulfate) strata with a high content of celestine, since, along with strontium, hydrocarbons are abnormally enriched in calcium (from 90 to 160 ppm). The third type of oils is typical for Urustamak (well 303, 1811–1814 m), Romashkinskiy (Abdrakhmanovskaya—well 9189, 1624–1665 m and well 9161 m, 1691–1716 m), and Sarapalinskiy (well 2896 m, Kizelovskiy horizon; well 2907 m, Kizelovsky horizon; well 3016 m, Bobrikovsky horizon) fields. They contain less than 0.06 ppm of Sr. The rest of the oil we analyzed (most of the analyzes) belongs to the second type with Sr content up to 0.3 ppm. The abnormal strontium and calcium contents in oil can be explained by the presence of a mechanical suspension of celestine and gypsum since these elements form a direct relationship with each other.
The nickel content in the studied crude oils, despite the absence of a geochemical anomaly, reaches 30 ppm, which is quite comparable with other data on the deposits of Tatarstan and the whole world [17,18,20]. For example, the metal content in the crude oils of Canada does not exceed 9 ppm, and in Libya—50 ppm (in the same West Siberian deposits, the amount of nickel reaches 17 ppm) [17,18,19]. Thus, on the Ni-Cu-Cr diagram for the resinous–asphaltene fractions, the Tatarstan oil belongs to the nickel type (see Figure 2), while the West Siberian oil belongs to the chromium type.
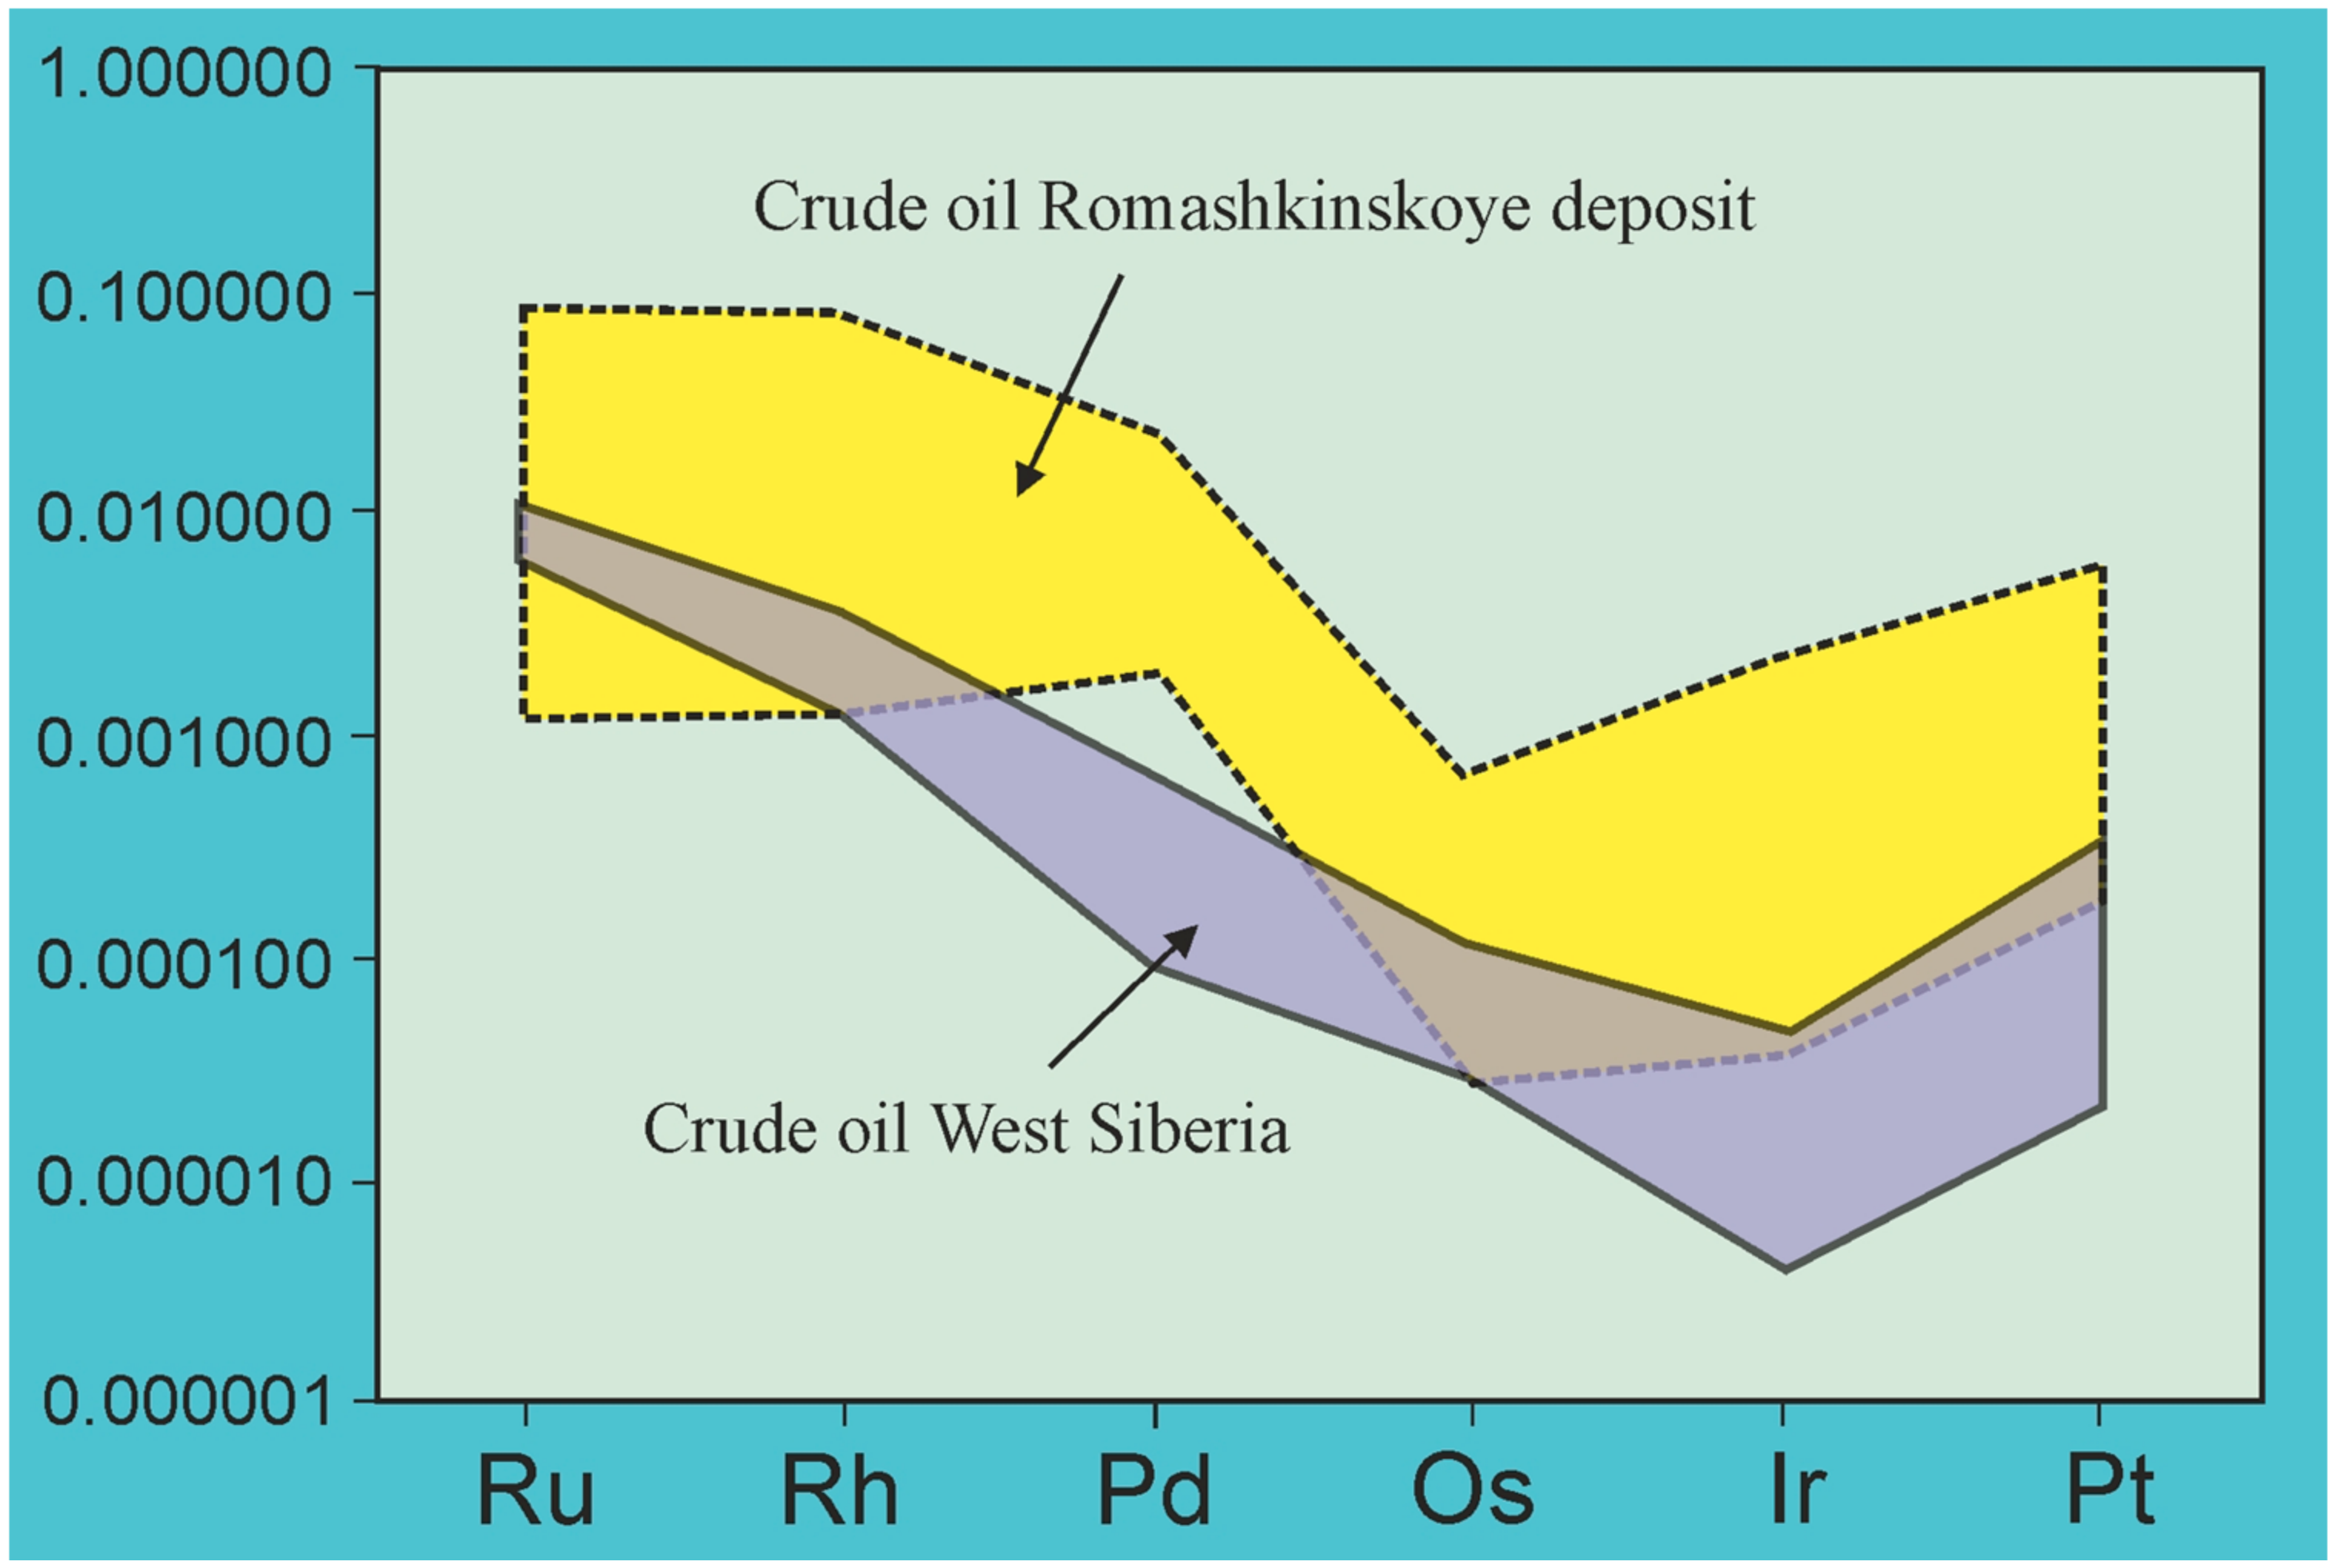
An interesting and rather unexpected fact was the significant presence of platinoids (Pt, Ir, Os, Ru, Rh, Pd) in the oils of the Romashkinskoye field, especially ruthenium and rhodium. In total, their amount varies from 0.01 to 0.08 ppm (the concentration of ruthenium sometimes reaches 0.06 ppm), which is slightly lower than in meteorites but higher than in many rocks of the Earth (according to [3]). For example, in West Siberian oils, the total amount of platinoids is much lower (they do not exceed 0.01 ppm). When normalized to chondrite [15], the distribution of platinoids shows a smooth decrease from ruthenium to platinum with a negative anomaly in the region of iridium and osmium; ruthenium-rhodium specialization is established for oil from the Romashkinskoye field (see Figure 6). For example, West Siberian oils are characterized by palladium specialization with a negative anomaly in the iridium area. In general, the trend of the content of platinoids in crude oils is quite different from that of the resinous–asphaltene fractions, according to [6], but it is quite comparable in terms of the concentration level. For the elements of the palladium group, similar contents are still noted, and for the platinoids, lower concentrations are observed in oil.
Taking into consideration the elevated amount of transition elements (Ni, Co, Cr, V, etc.) and platinoids, it was previously observed [6,17,18,19] that the “ultrabasic” geochemical–metallogenic specialization of crude oil could be connected with the issue of petroleum’s mantle origin. The revealed geochemical features of crude oils can also be explained by the biogenic hypothesis of its origin, according to which crude oil and hydrocarbons in the Earth’s crust are formed from organic substances—kerogen and bitumoids. The catalysts of this process, most likely, are the host rocks (mainly clays), as well as some metals such as Ni or Pt. In other words, the geochemical specialization of oil is strongly influenced by the catalytic and/or solubilized metals that could be accumulated in the hydrocarbon systems. Noting the special features of petroleum in organic geochemistry, recently it was shown that geochemistry of crude oils could be dual—there are both traces of its deep origin and its interaction with sedimentary rocks [21,35].
The presented study is pioneering in many ways; the conclusions obtained are based on a relatively small amount of data so far (the total number of our ICP-MS analysis of crude oils is around a hundred). The study of inorganic geochemistry of crude oils by the ICP-MS method should be continued, especially bearing in mind the difficulties arisen, associated with very low contents and (in some cases) insufficiently good reproducibility of single analyses. Similar ICP-Ms studies were carried out by many scientific groups with different purposes—some of them aimed to improve the methodology [36,37,38,39,40,41] and others tried to assess the geochemical specialization of crudes [42,43,44,45].
It is always important to consider the analytical error; in our case this error is ±8–10% and every point in our accompanying figures is in reality a field that also increases the error probability.
Our interpretations are based on a solid foundation of high-resolution data. Importantly, the ICP-MS method and the accompanying inorganic geochemistry are key ingredients to better understand the genesis of crude oil. The high sensitivity of the method, which is achieved by the implication of high-resolution mass spectrometers with double-focusing, made it possible to increase the number of elements determined directly in crude oil up to 70 (instead of the traditional 15–20).

4. Conclusions

The study of the inorganic geochemistry of West-Siberian and Tatarstan crude oils using the most modern equipment shows that crude oils (at least from these two provinces, and, apparently, others) have an extremely specific microelement composition with no comparisons.
The main geochemical feature of crude oil is the extremely low content of most trace elements. Thus, when normalized to the primitive mantle, the ultrabasites depleted in most trace elements give a distribution in the region of 0.1 units and crude oil in the region of 0.001 units. On the other hand, the contents of trace elements in the Triassic basalts of Western Siberia are 10 times higher than the contents in the primitive mantle, and these basalts are from the same Shaim region. At the same time, the concentration of uranium in oils reaches the content of this element in basaltoids and is much higher than in ultrabasites, chondrites, and intermediate rocks. The appearance of such an amount of uranium in crudes can be explained by the reducing conditions and by the presence of a geochemical barrier. As a result, high lead contents in hydrocarbons could also be explained by the occurrence of reducing conditions.
The second geochemical feature of crude oil is a constant and pronounced positive europium anomaly which is sometimes associated with deep genesis of the crude oil formed in the lower parts of the Earth’s crust and below [26]. Europium anomaly is an indicator of reducing conditions, and positive europium anomaly could mean the occurrence of a reducing environment which is a necessity for hydrocarbon generation. The excess europium is found not only in crudes but also, for example, in modern phosphorites [36,37]. According to [36,37], the reason for such an unusual behavior of europium in phosphorites is the sharply reducing environment of their formation in diatom ooze enriched by organic matter. The geochemical peculiarity of europium is that its valence is variable. Under the conditions of the Earth’s surface, with free access of oxygen, it is trivalent (like other REE), but in the heated depths of the Earth, in the absence of free oxygen, europium is reduced to a bivalent state and becomes more mobile, passing into hydrothermal solutions circulating along the cracks of rocks, which is more intense than the rest of the REE. The data given in [46,47] indicates that europium can pass into a bivalent state not only in the depths of the Earth but also during the diagenesis of marine sediments, passing under reducing conditions, accumulating in the neoplasms that form in this case. It can be assumed that a similar mechanism of europium accumulation could also work for hydrocarbons. However, we note that, according to the authors’ data, europium deficiency is characteristic of terrigenous rocks, the formation of which took place under both reducing and oxidizing conditions. This finding can serve as an argument in favor of its hydrothermal genesis in hydrocarbon systems.
A quiet, unexpected result for us was the discovery of a significant amount of platinoids in the studied oils (especially of the Romashkino field), mainly ruthenium and rhodium. Their total amount varies from 0.01 to 0.08 ppm, which is slightly lower than in meteorites but higher than in many rocks of the Earth. Moreover, for crudes from the Romashkinskoye field, ruthenium–rhodium specialization is established, and for West Siberian oils, palladium specialization is characterized with a negative anomaly in the iridium area. Ultrabasites, being the major components of the Earth, are also the richest systems by platinoids.

Author Contributions

Conceptualization, K.S.I.; Methodology, K.S.I. and Y.V.E.; Software, Y.V.E. and D.A.K.; Validation, K.S.I., Y.V.E. and D.A.K.; Formal Analysis, K.S.I., Y.V.E. and D.A.K.; Investigation, K.S.I. and Y.V.E.; Resources, K.S.I.; Data Curation, K.S.I. and Y.V.E.; Writing—Original Draft Preparation, K.S.I. and Y.V.E.; Writing—Review and Editing, D.A.K.; Visualization, Y.V.E. and D.A.K.; Supervision, K.S.I.; Project Administration, K.S.I.; Funding Acquisition, K.S.I. All authors have read and agreed to the published version of the manuscript.

Funding

These studies were carried out within the framework of the state budgetary theme of the Institute of Geology and Geochemistry of the Ural Branch (registration number AAAA-A18-118052590032-6).

Acknowledgments

For substantial help and discussion of the results, we express our gratitude to Yu.N. Fedorov, K.Sh. Biglov, O.P. Lepikhina, G.P. Kayukova, I.N. Plotnikova, Yu.L. Ronkin, L.I. Svechnikov, and M.R. Yakupov.

Conflicts of Interest

The authors declare no conflict of interest.

References

  1. Alekseev, V.P.; Fedorov, Y.N.; Gazaleev, S.S.; Russian, V.I.; Svechnikov, L.I.; Khakimov, A.F. History of the Formation of Deposits of the Tyumen Suite of the Shaim Oil and Gas Region Geologiya Ugol’nykh Depositov-Geology of Coal Deposits; Publishing House of USMU: Yekaterinburg, Russia, 2004; pp. 130–139. [Google Scholar]
  2. Vinokurov, S.F.; Gottikh, R.P.; Pisotsky, B.I. Complex analysis of the distribution of lanthanides in aphaltenes, waters and rocks to clarify the conditions for the formation of oil fields. Dokl. Akad. Nauk. Rep. Acad. Sci. 2000, 370, 83–86. [Google Scholar]
  3. Voitkevich, G.V.; Miroshnikov, A.E.; Povarenykh, A.S.; Prokhorov, V.G. A Short Guide to Geochemistry; Nedra: Moscow, Russia, 1970; 280p. [Google Scholar]
  4. Ivanov, K.S.; Kormiltsev, V.V.; Fedorov, Y.N. The main features of the structure of the pre-Jurassic basement of the Shaim oil and gas region—Ways of Realization of Oil and Gas Potential of Khanty-Mansi Autonomous Okrug. In Proceedings of the Scientific and Practical Conference, Khanty-Mansiysk, Russia, 19 December 2003; Volume 1, pp. 102–113. [Google Scholar]
  5. Ivanov, K.S.; Erokhin, Y.V.; Ronkin, Y.L.; Plotnikova, I.N.; Kayukova, G.P. Inorganic geochemistry of oil from the Romashkinskoye field—The first results of research using the ICP-MS method. In Hydrocarbon Potential of the Basement of Young and Ancient Platforms; KazGU Publishing House: Kazan, Russia, 2006; pp. 100–103. [Google Scholar]
  6. Marakushev, A.A.; Pisotsky, B.I.; Paneyakh, N.A.; Gottikh, R.P. Geochemical specificity of oil and the origin of its deposits. Dokl. Akad. Nauk. Rep. Acad. Sci. 2004, 398, 795–799. [Google Scholar]
  7. Nadirov, N.K.; Kotova, A.V.; Kamyanov, V.F. New oils of Kazakhstan and their use: Metals in oils. Alma Ata Sci. 1984, 1, 448. (In Russian) [Google Scholar]
  8. Adbulmazitov, R.G.; Ananiev, V.V.; Voitovich, E.D.; Gatiyatullin, N.S.; Mironova, L.M.; Muslimov, R.K.; Plotnikova, I.N.; Smelkov, V.M.; Tukhvatullin, R.K.; Uspensky, B.V.; et al. Oil and Gas Potential of the Republic of Tatarstan. Geology and Development of Oil Fields; Muslimov, R.K., Ed.; Publishing House “Feng” of the Academy of Sciences of the Republic of Tatarstan: Kazan, Russia, 2007; Volume 1. (In Russian) [Google Scholar]
  9. Pecherkin, M.; Veremko, H.A.; Guzeev, B.B.; Kumin, Y.A. Features of the Geological Structure and Development of Deposits in the Shaim Oil and Gas Region; Lukoil: Moscow, Russia, 2002; 283p. (In Russian) [Google Scholar]
  10. Plotnikova, I.N. Geological-Geophysical and Geochemical Preconditions for the Oil and Gas Potential of the Crystalline Basement of Tatarstan; Nedra: Saint Petersburg, Russia, 2004; 146p. [Google Scholar]
  11. Fedorov, Y.N.; Alekseev, V.P.; Ivanov, K.S.; Pecherkin, M.F.; Svechnikov, L.I. New geological data and prospects for the growth of active oil reserves in the Shaim region. Oil Ind. 2004, 6, 22–25. [Google Scholar]
  12. Fedorov, Y.N.; Ivanov, K.S.; Erokhin, Y.V.; Ronkin, Y.L. Inorganic oil geochemistry of the Shaim region (West Siberian oil and gas megabasin). Collective Ways of Realization Oil Gas Potential Khanty-Mansi Autonomous Okrug-Yugra. In Proceedings of the Ninth Scientific and Practical Conference, Khanty-Mansiysk, Russia, 7–9 June 2006; Volume 1, pp. 306–314. [Google Scholar]
  13. Fedorov, Y.N.; Ivanov, K.S.; Erokhin, Y.V.; Ronkin, Y.L. Inorganic geochemistry of oil in Western Siberia (the first results of the study by the ICP-MS method). Dokl. Akad. Nauk. Rep. Acad. Sci. 2007, 414, 385–388. [Google Scholar]
  14. Fish, R.M.; Komlenic, J.J. Molecular characterization and profile identification of vanadil compounds in heavy crude petroleum’s by liquid chromatography/graphite furnace atomic absorption spectrometry. Anal. Chem. 1984, 56, 2452–2460. [Google Scholar] [CrossRef]
  15. Naldrett, A.J.; Duke, J.M. Platinum metals in magmatic sulfide ores. Science 1980, 208, 1417–1424. [Google Scholar] [CrossRef]
  16. Nakamura, N. Determination of REE, Ba, Fe, Mg, Na and K in carbonaceous and ordinary chondrities. Geochim. Cosmochim. Acta 1974, 38, 757–775. [Google Scholar] [CrossRef]
  17. Marakushev, A.A.; Pisotskii, B.I.; Paneyakh, N.A.; Gottikh, R.P. Geochemical features of oil and the origin of oil fields. Dokl. Earth Sci. 2004, 399, 1120–1124. [Google Scholar]
  18. Ivanov, K.S.; Kucherov, V.G.; Fedorov, Y.N. On the Question of the Deep Origin of Oil STATE, Trends and Problems of Development of Oil and Gas Potential of Western Siberia. Materials of the International Academic Conference; ZapSibNIIGG: Tyumen, Russia, 2008; pp. 160–173. [Google Scholar]
  19. Gottikh, R.P.; Vinokurov, S.F.; Pisotskii, B.I. Rare-earth elements as geochemical criteria of endogenous sources of microelements contained in oil. Dokl. Earth Sci. 2009, 425, 325–329. [Google Scholar] [CrossRef]
  20. Punanova, S.A. Trace elements in naphthides and their application to the development of oil and gas condensate fields. Neftekhimiya 2001, 41, 165–193. [Google Scholar]
  21. Rodkin, M.V.; Rundkvist, D.V.; Punanova, S.A. The relative role of lower and upper crustal processes in the formation of trace element compositions of oils. Geochem. Int. 2016, 54, 989–995. [Google Scholar] [CrossRef]
  22. Pearcon, C.D.; Green, J.B. Comparison of processing characteristics of Magan and Wilmington heavy residues. Characterization of vanadium and nickel complexes in acid-base-neutral fractions. Fuel 1989, 68, 465–468. [Google Scholar] [CrossRef]
  23. Hackford, J.E. The significance of the interpretation of the chemical analyses of seepages. J. Inst. Petrol. Tech. 1922, 8, 193–213. [Google Scholar]
  24. Guthrie, W.A. Heavy grade Egyptian crude oil. J. Inst. Petrol. Tech. 1923, 9, 212–248. [Google Scholar]
  25. Ramsay, W. The significance of nickel in petroleum. J. Inst. Petrol. Tech. 1924, 10, 87–91. [Google Scholar]
  26. De Golyer, E. The occurrence of vanadium and nickel in petroleum. Econ. Geol. 1924, 19, 550–558. [Google Scholar]
  27. Bakirova, S.F.; Kotova, A.V.; Yagyayeva, S.; Fedorova, N.; Nadirov, N.K. Structural features of vanadyl porphyrins of petroleum of West Kazakhstan. Pet. Chem. USSR 1984, 24, 196–202. [Google Scholar] [CrossRef]
  28. Chai, C.; Ding, Z.; Fu, J.; Sheng, G. Determination of trace elements in crude oils and organic materials extracted from oil-forming source rocks in China by INAA. J. Radio Anal. Nucl. Chem. 2005, 151, 177–184. [Google Scholar]
  29. Tadayon, F.; Massoumi, A.; Eslami, M. Determination of vanadium, nickel, and iron in crude oil by High-Performance Liquid Chromatography. J. Chromatogr. Sci. 1999, 37, 371–374. [Google Scholar] [CrossRef] [Green Version]
  30. Sebor, G.; Lang, I.; Vavrecka, P.; Sychra, V.; Weisser, O. The determination o metals in petroleum samples by Atomic Absorption Spectrometry, part I. The determination of Vanadium. Anal. Chim. Acta 1975, 78, 99–106. [Google Scholar] [CrossRef]
  31. Botto, R.I. Matrix interferences in the analysis of organic solutions by Inductively Coupled Plasma-Atomic Emission Spectrometry. Spectrochim. Acta Part B 1987, 42, 181–199. [Google Scholar] [CrossRef]
  32. Saint’Pierre, T.; Dias, L.F.; Pozebon, D.; Aucelio, R.Q.; Curtius, A.J.; Welz, B. Determination of Cu, Mn, Ni and Sn in gasoline by Electrothermal Vaporization Inductively Coupled Plasma Mass Spectrometry, and Emulsion Sample Introduction. Spectrochim. Acta Part B 2002, 57, 1991–2001. [Google Scholar] [CrossRef]
  33. Mattinson, J.M. Preparation of hydrofluoric, hydrochloric, and nitric acids at ultralow lead levels. Anal. Chem. 1972, 44, 1715–1716. [Google Scholar] [CrossRef]
  34. Gießmann, U.; Greb, U. High-resolution ICP-MS—A new concept for elemental mass spectrometry. Fresenius J. Anal. Chem. 1994, 350, 186–193. [Google Scholar] [CrossRef]
  35. Taylor, S.R.; McLennan, S.M. The Continental Crust: Its Composition and Evolution; Blackwell: Oxford, UK, 1985; 312p. [Google Scholar]
  36. Botto, R.I. Applications of ultrasonic nebulization in the analysis of petroleum and petrochemicals by Inductively Coupled Plasma atomic emission spectrometry. J. Anal. Atom. Spectrom. 1993, 8, 51–57. [Google Scholar] [CrossRef]
  37. Botto, R.I. Trace element analysis of petroleum naphtas and tars using direct injection ICP-MS. Can. J. Anal. Sci. Spect. 2002, 47, 1–13. [Google Scholar]
  38. Dreyfus, S.; Pecheyran, C.; Magnier, C.; Prinzhofer, A.; Lienemann, C.P.; Donard, O.F.X. Direct trace and ultra-trace metals determination in crude oil and fractions by inductively coupled plasma mass spectrometry. J. ASTM Int. 2005, 2, 1–8. [Google Scholar] [CrossRef]
  39. Duyck, C.; Miekeley, N.; Porto da Silveira, C.L.; Szatmari, P. Trace element determination in crude oil and its fractions by Inductively Coupled Plasma Mass Spectrometry using ultrasonic nebulization of toluene solutions. Spectrochim. Acta B 2002, 57, 1979–1990. [Google Scholar] [CrossRef]
  40. Lienemann, C.P.; Dreyfus, S.; Pecheyran, C.; Donard, O.F.X. Trace metal analysis in petroleum products: Sample introduction evaluation in ICP-OES and comparison with an ICP-MS approach. Oil Gas Sci. Technol. 2007, 62, 69–77. [Google Scholar] [CrossRef]
  41. Poirier, L.; Nelson, J.; Leong, D.; Berhane, L.; Hajdu, P.; Lopez-Linares, F. Application of ICP-MS and ICP-OES on the determination of nickel, vanadium, iron, and calcium in petroleum crude oils via direct dilution. Energy Fuels 2016, 30, 3783–3790. [Google Scholar] [CrossRef]
  42. Agyingi, C.M.; Abanda, P.A.; Fozao, K.F.; Njoh, O.A.; Epanty, A.F.; Tangko, N.C.; Kwangkam, F.N.; Eseme, E. Geochemistry of seep and produced oil samples from Southern Cameroon. J. Pet. Geol. 2019, 42, 193–206. [Google Scholar] [CrossRef]
  43. Al-Swaidan, H.M. The determination of lead, nickel and vanadium in Saudi Arabian crude oil by sequential injection analysis/Inductively-Coupled Plasma Mass Spectrometry. Talanta 1996, 43, 1313–1319. [Google Scholar] [CrossRef]
  44. Lopez, L.; Mynaco, S.L. Geochemical implications of trace elements and sulfur in the saturate, aromatic and resin fractions of crude oil from the Mara and Mara Oeste fields, Venezuela. Fuel 2004, 83, 365–374. [Google Scholar] [CrossRef]
  45. Rabbani, A.R. Geochemistry of crude oil samples from the Iranian sector of the Persian Gulf. J. Pet. Geol. 2008, 31, 303–316. [Google Scholar] [CrossRef]
  46. Baturin, G.N. Phosphogenesis hypotheses and oceanic environment. Lithol. Useful Miner. 1999, 5, 451–472. [Google Scholar]
  47. Baturin, G.N. Europium anomaly in oceanic phosphorites. Geochemistry 2001, 379, 647–650. [Google Scholar]
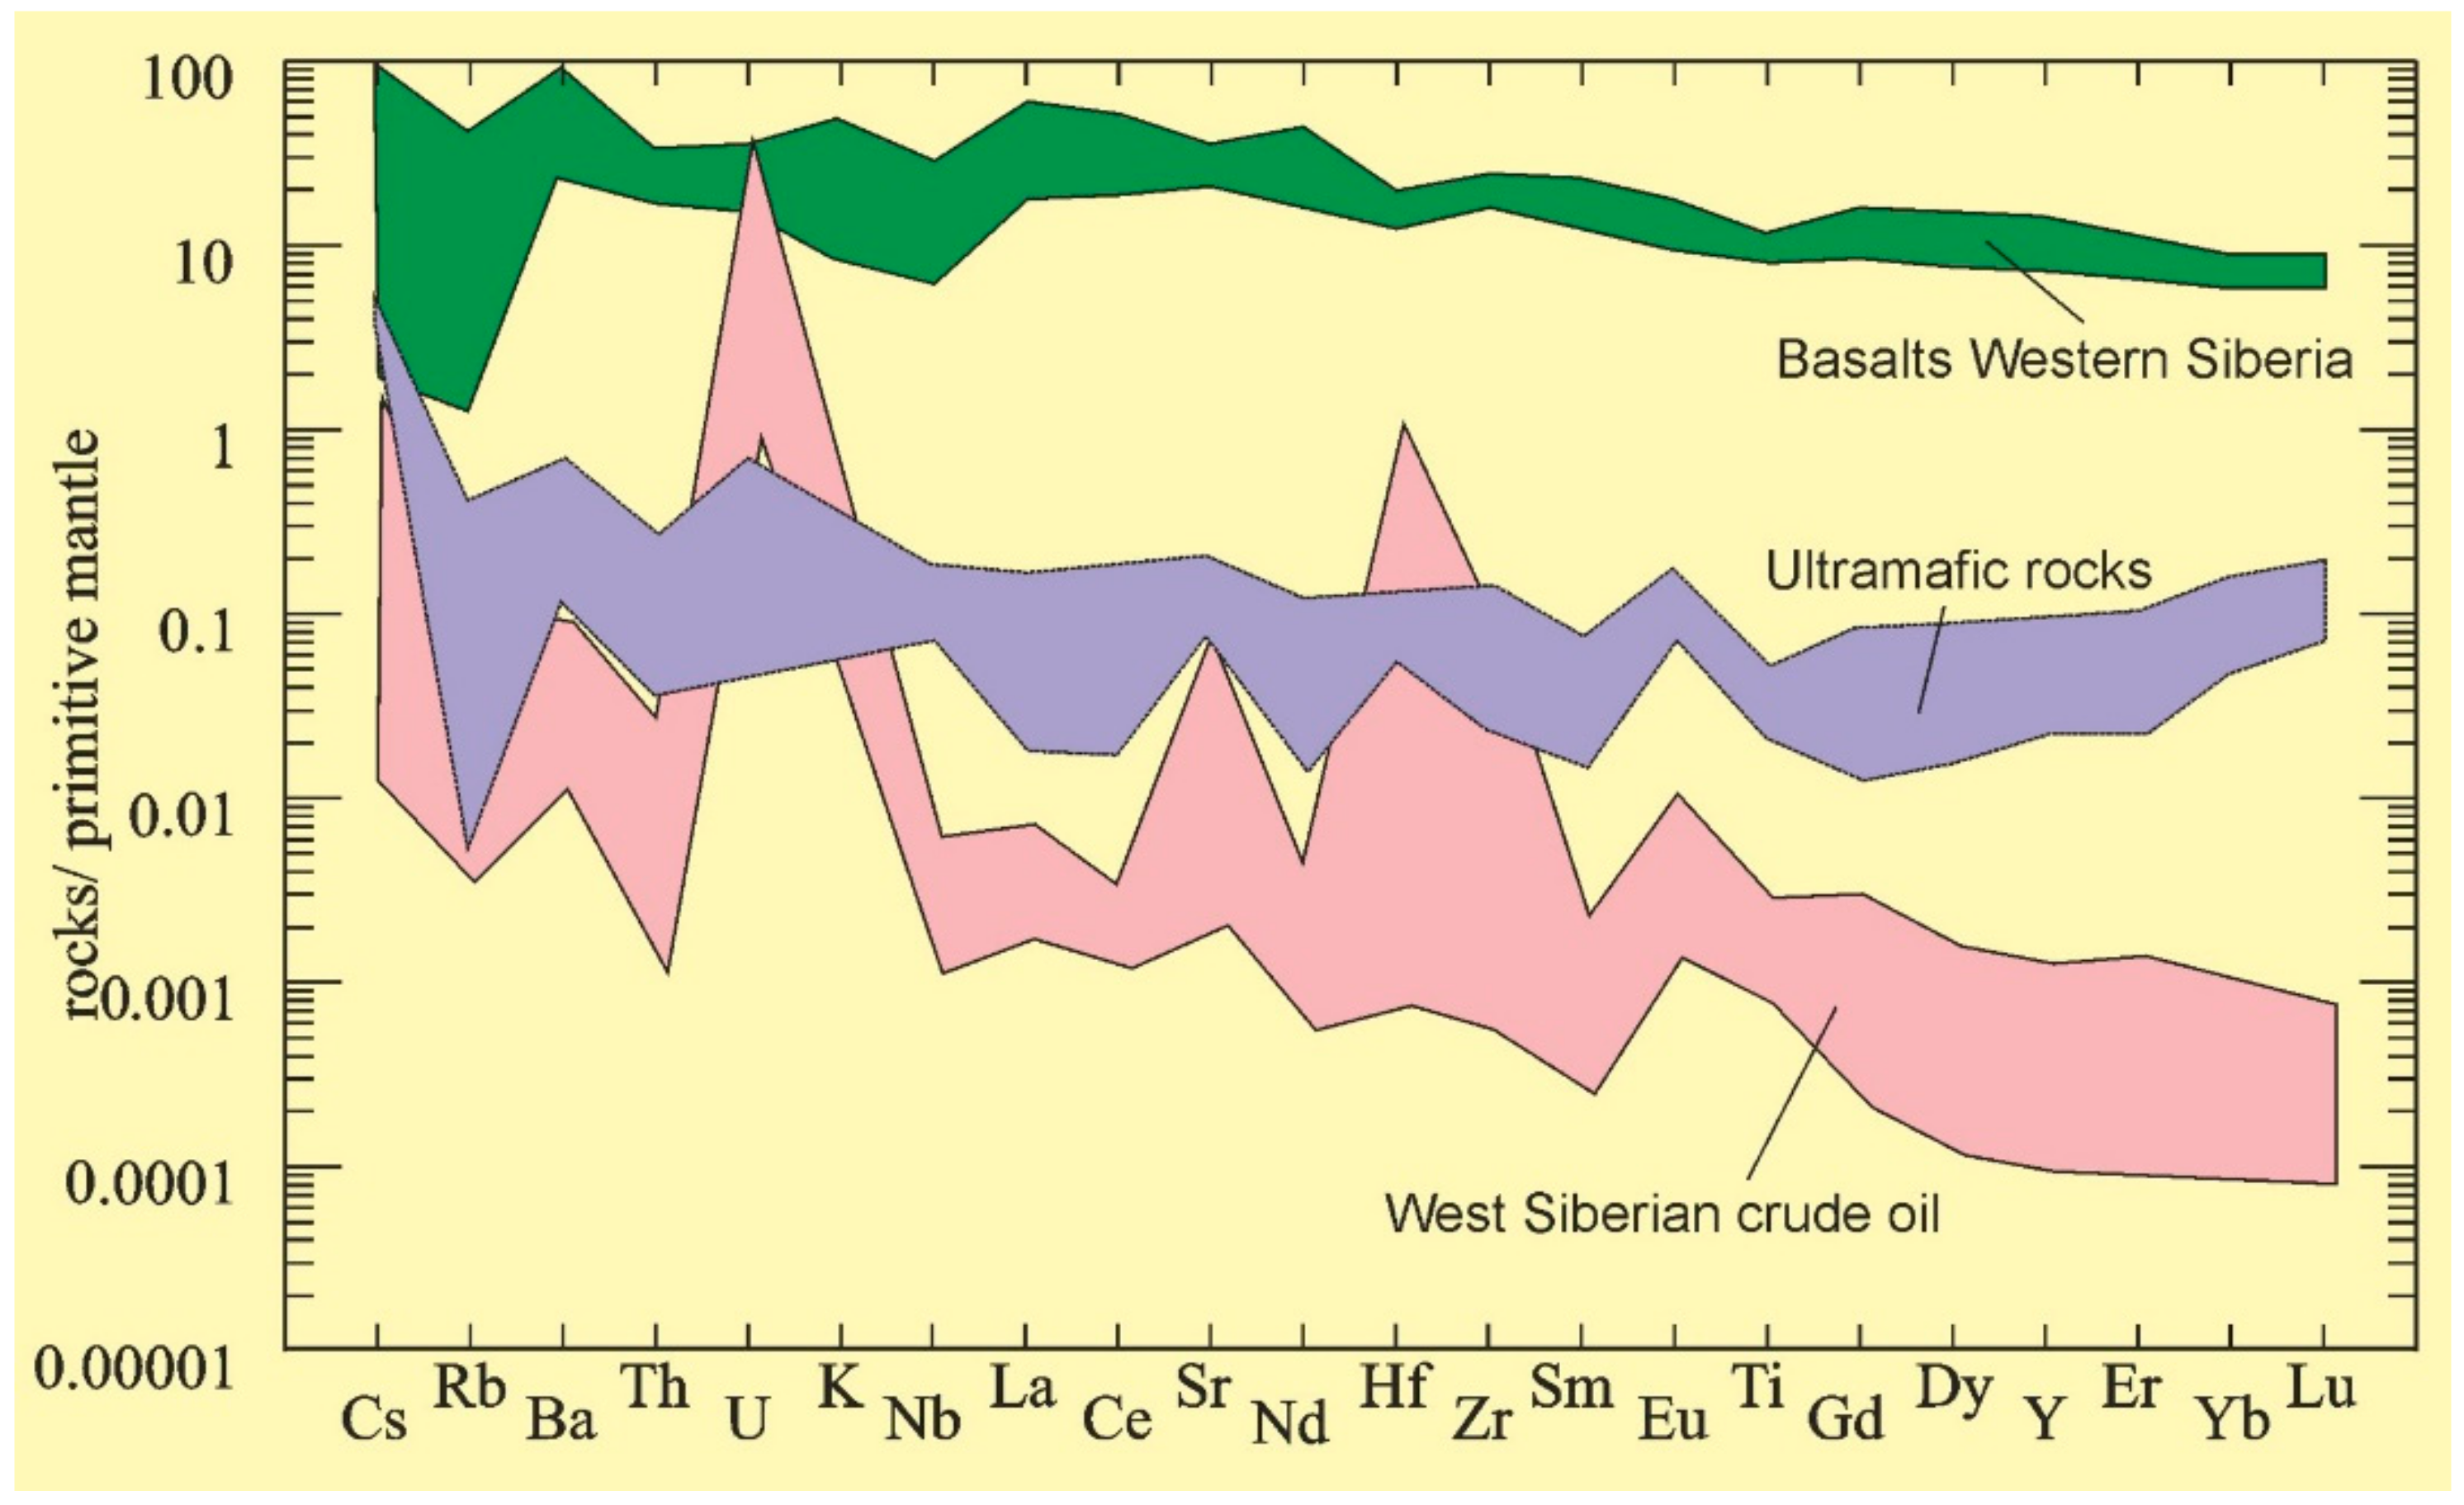
Figure 1. Spider diagram normalized by the composition of the primitive mantle [18] for Priuralskaya crude oil (West Siberia).
Energies 15 00048 g001
Figure 2. Taxonomy of crude oil fields by the content of nickel, copper, and chromium in crude oils. Note: the field shows the West Siberian province [6]. Our data: the circles—crude oils of the West-Siberian Urals part, pentagons—Tatarstan.
Energies 15 00048 g002
Figure 3. Distribution curves of rare earth elements normalized to chondrite [16] for crude oil of Slavinskoye oil field of Shaimsky petroleum district. The temperatures are corresponding to the crude oil’s distillation fractions.
Energies 15 00048 g003
Figure 4. Distribution curves of rare earth elements normalized to chondrite [16] for crude oil from the Romashkinskoye oil field.
Energies 15 00048 g004
Figure 5. Spider diagram normalized by the primitive mantle composition [18] for crude oil of Tatarstan.
Energies 15 00048 g005
Figure 6. Distribution of platinoids in crude oils of the Romashkinskoye deposit and Western Siberia.
Energies 15 00048 g006
Table 1. Results of ICP-MS (in ppm) for crude oil of Shaimsky district.
Elements12345678
Li---0.002680.005500.004480.007530.00089
Be0.000370.003860.003110.000680.000900.000800.000360.00036
B0.000580.000730.000660.053210.133000.060200.065000.04371
Mg0.7258813.8547012.400900.470860.917310.568820.390740.71989
Al0.152369.521408.275371.124541.373501.013431.092911.84287
Sc0.002960.156870.132270.119980.114440.108730.172180.14430
Ti0.013470.973350.877962.897652.749382.356543.561461.78890
V3.354000.176431.3145110.449811.63188.861009.332106.48840
Cr14.542805.2967410.8183028.4995032.7446028.6782017.2258025.54590
Mn0.020830.153190.128570.116410.597760.110360.167660.63659
Fe5.0330049.087843.7330052.1724048.9204035.9154038.3182035.9450
Co0.001530.008510.004730.012460.007020.077820.091660.00702
Ni0.918050.415041.0319710.114204.5767617.064614.72183.12589
Cu0.001461.368851.357121.773102.063761.675531.831921.93616
Zn0.184621.364371.481574.980105.845796.300844.8588711.7174
Ga0.058590.005410.008270.153530.155720.133750.047400.12771
As0.520420.172140.096810.68190.839620.787020.588100.66959
Rb0.023640.055730.027940.001940.006960.002550.012050.01118
Sr0.054280.093920.471560.211420.650980.461560.583191.69799
Y0.000890.001070.000390.000410.001040.000690.000870.00079
Zr0.006580.852190.440270.123560.204150.108100.106680.12442
Nb0.000780.001590.001220.002100.004080.003130.002030.00338
Mo0.169100.133470.117080.098740.059950.051830.056820.05256
Ru0.000800.007170.005680.003290.005800.002260.004110.00509
Rh0.001220.000240.000220.000270.000160.000090.000510.00033
Pd0.002160.037440.019310.010560.016350.008200.009520.01052
Ag0.010750.000980.004210.004160.002960.003390.003210.00506
Cd0.002040.004500.000480.013960.007200.008910.008210.00967
In0.000340.001390.002160.000050.000430.000620.000440.00051
Sn0.161980.001080.387630.249980.145380.146100.273920.22622
Sb0.000790.004450.002850.003910.004980.003540.002040.00440
Te0.001090.002230.000180.000200.000330.000310.000190.00028
I---0.173781.374070.276950.189880.09614
Cs0.001990.001950.001940.000280.000390.000420.000130.00007
Ba0.099140.191760.079790.321650.283960.142680.180090.53189
La0.001290.002330.001850.002370.003950.003660.005480.00358
Ce0.002270.004020.002950.003730.005520.004840.006450.00456
Pr0.000480.000530.000430.000520.000660.000480.000580.00064
Nd0.001940.001910.001840.001450.002710.002150.001810.00207
Sm0.000760.000590.000520.000350.000280.000470.000290.00029
Eu0.001680.000270.000290.000510.000400.000050.000020.00088
Gd0.001550.000460.000530.000490.000450.000530.000480.00040
Tb0.000250.000090.000060.000050.000050.000070.000100.00006
Dy0.001080.000470.000480.000290.000330.000390.000640.00029
Ho0.000230.000110.000120.000060.000060.000070.000130.00007
Er0.000590.000360.000330.000190.000190.000220.000340.00022
Tm0.00010.000040.000030.000020.000030.000030.000050.00003
Yb0.000530.000120.000150.000130.000190.000130.000250.00017
Lu0.000050.000010.000020.000020.000030.000020.000030.00003
Hf0.004580.338350.274810.012080.012600.012150.014180.01237
Ta0.000030.00165-0.000190.000060.000070.000020.00015
W0.002560.015890.009940.008700.004770.006220.004060.00769
Re0.000040.005670.000040.005640.002720.004000.002760.00456
Os0.000480.000170.000020.000060.000050.000180.000000.00000
Ir0.000580.009580.006220.00040.00030.000160.000040.00007
Pt0.001620.013780.009880.000940.001190.000810.000270.00032
Au0.001780.001380.000840.000390.000020.000490.000410.00029
Hg0.002450.023550.003730.001850.002780.012670.005490.00215
Tl0.001520.001250.000110.045970.033230.044280.070180.05134
Pb0.002030.109080.161430.140130.103620.142960.233860.15592
Bi0.001180.001080.001270.000800.000180.000560.001450.00099
Th0.000050.000580.000280.000680.001940.000680.000590.00072
U0.031240.150640.428040.340900.200170.807530.435870.43525
Note: hereinafter, experiments were carried out on Element 2 by Yu.L. Ronkin, O.P. Lepikhina, O.Yu. Popova, and others; 1—Tolumskaya area (sample BPS-4), 2—Mortymya-Teterevskaya area (well 395), 3—Lovinskaya area (well 9195), 4—Vostochno-Pridorozhnoe (well 402/2), 5—Kustovoe (well 1182/26), 6—Povkhovskoe (well 3775/165), 7—Vat-Yeganskoe (well 4881/106), 8—Yuzhno-Yagunskoe (well 164r).
Table 2. Results of ICP-MS (in ppm) for crude oils of Sredneobsky and Oktyabrsky district.
Elements12345678
Li0.004000.008000.000900.570000.380000.290000.230000.34000
Be0.001000.000400.000400.002000.002000.003000.002000.00200
Na200.000003.770004.37000525.00000970.2000013.120000087.5300040.35000
Mg0.570000.390000.7198927.8700017.5200028.5200013.6900012.20000
Al1.010001.090001.8400036.8700020.8100034.1600030.9700020.07000
P---2156.000002001.000002452.000001964.000002173.00000
K---128.0000095.14000126.0000075.6600092.71000
Ca---225.00000142.00000220.00000170.00000181.00000
Sc0.110000.170000.14000r1.010000.280001.510000.760000.81000
Ti2.360003.560001.7900045.7000014.8200018.9400016.3700019.35000
V8.860009.330006.490000.120000.070000.070000.040000.06000
Cr28.6800017.2300025.550001.590000.740002.190001.760001.88000
Mn0.110000.170000.640000.560000.170000.230000.120000.25000
Fe35.9200038.3200035.9500070.3300041.1300079.2400030.3600061.57000
Co0.078000.092000.007000.024000.017000.031000.011000.02000
Ni17.0650014.722003.126004.024003.696004.723003.505004.62800
Cu1.676001.832001.936000.173001.601001.029000.016000.26400
Zn6.301004.8590011.717006.173003.0330010.340010.58003.47200
Ga0.134000.047000.128000.232000.104000.014000.019000.02500
Ge---0.026000.010000.033000.003000.01900
Rb0.003000.012000.011000.020000.013000.027000.02700-
Sr0.462000.583001.6980010.440007.120000.690000.560001.02000
Y0.000700.000900.000800.009000.004000.006000.017000.00400
Zr0.108000.107000.124000.067000.057000.057005.354000.05200
Nb0.003000.002000.003000.007000.004000.004000.00400r0.02600
Mo0.052000.057000.053000.039000.034000.035000.032000.03400
Ru0.002000.004000.005000.002000.002000.003000.004000.00300
Rh0.000100.000500.000300.003000.002000.001000.001000.00200
Ag0.003000.003000.005000.004000.002000.011000.047000.00300
Pd0.008000.010000.011000.000200.000200.000200.002800.00020
Cd0.009000.008000.010000.007000.004000.011000.011000.00400
In0.001000.000400.001000.002000.001000.002000.001000.00200
Sn0.146000.274000.226000.032000.031000.063000.031000.03200
Sb0.004000.002000.004000.018000.007000.049000.016000.05600
Te0.000300.000200.000300.0010-0.00010.00100.0050
I0.270000.190000.100009.120004.390002.070001.630001.23000
Cs0.000400.000100.000100.02900.00600.00200.00100.0020
Ba0.140000.180000.5300010.650005.020000.250000.270000.73000
La0.003700.005500.003600.009000.003000.007000.008000.01000
Ce0.004800.006500.004600.01700.006000.013000.015000.02000
Pr0.000500.000600.000600.002000.001000.001000.002000.00200
Nd0.002200.001800.002100.007000.003000.005000.005000.00700
Sm0.000470.000290.000290.002000.000500.001000.001000.00100
Eu0.000050.000020.000880.009000.004000.001000.001000.0013
Gd0.000500.000500.000400.002000.000500.001000.001000.00100
Tb0.000070.000100.000060.000200.000100.000200.000200.00020
Dy0.000390.000640.000290.002000.000400.001000.002100.00130
Ho0.000070.000130.000070.000300.000100.000200.000600.00020
Er0.000220.000340.000220.000800.000200.000600.002000.00070
Tm0.000030.000050.000030.00010.000040.000100.001000.00010
Yb0.000130.000250.000170.001000.000300.000710.004200.00071
Lu0.000020.000030.000030.000200.000040.000100.001000.00010
Hf0.012000.014000.012000.002000.001000.002000.144000.00100
Ta0.000100.000020.000200.000400.000300.000300.000400.00100
W0.006000.004000.008000.032000.099000.024000.055000.02900
Re0.004000.003000.005000.003000.007000.002000.003000.00200
Os0.00020--0.000100.00020.000200.000200.00040
Ir0.000200.000040.000100.000200.000200.000100.001000.00010
Pt0.001000.000300.000300.004000.004000.003000.005000.00400
Au0.000500.000400.00030.024000.024000.022000.019000.02500
Hg0.013000.005500.002200.240000.130000.240000.110000.13000
Tl0.04400.07000.05100.000300.000100.000500.000300.00020
Pb0.143000.234000.156000.072000.032000.151000.069000.06200
Bi0.000600.001500.000900.005000.005000.027000.009000.00400
Th0.000700.000600.000700.002000.000600.0009000.004000.00100
U0.810000.440000.440000.080000.050000.210000.160000.03000
Note: 1–3—Sredneobsky district crude oils: 1—Povkhovskoye, well 3775/165, reservoir BV-8, interval 2684,6–2733; 2—Vatjeganskoye, well 4881/106, interval 2607,8–2612; 3—Yuzhno-Yagunskoye, well 164p, interval 2852,8–2858,6; 4–8—Oktyabrsky district crude oil.
Table 3. Results of ICP-MS (in ppm) for crude oil of Abdrakhmanovskaya area (Romashkinskoye oil field).
Crude Oil Well880337888559161918913,813
Li0.0530000.0574000.0733000.0597000.0506000.221300
Be0.0279000.0307000.0086000.0084000.0332000.006400
Na61.69000082.3500002.53000050.56000023.7200001663.960000
Mg0.3174000.4443000.4757000.2090000.27320056.718600
Al0.0429000.0599000.0754000.0320000.0354000.033400
Ca1.1806000.9907000.4437000.4875000.91340086.93900
Sc0.0073000.0052000.0021000.0035000.0060000.002600
Ti0.0198000.0191000.0143000.0165000.0212000.011000
V3.4344005.6396007.9056001.7543002.0551000.422800
Mn0.2543000.2642000.2166000.2156000.2733000.167300
Co0.0337000.0471000.0666000.0249000.0247000.026500
Cr1.4449202.1349101.8683300.7923401.3377300.451820
Ni8.64130016.14550023.2513004.0975005.3161001.267300
Cu0.1125000.1126000.0973000.1069000.1239000.758800
Zn0.4241000.5717000.6946000.3728000.4137000.414100
Ga0.0406000.0518000.0482000.0163000.0223000.079600
Ge0.0295000.0512000.0582000.0193000.0295000.025700
Rb0.0033000.0044000.0055000.0028000.0030002.122200
Sr0.0865000.0825000.0848000.0221000.02050063.67600
Y0.0023000.0027000.0022000.0008000.0012000.001500
Zr0.0157000.0088000.0049000.0225000.0226000.065600
Mo0.0655000.0503000.0548000.0522000.0368000.037900
Ru0.0022000.0018000.0010000.0015000.0023000.034400
Rh0.0005000.0006000.0005000.0003000.0005000.009100
Pd0.0027000.0020020.0017000.0032000.0034000.009200
I0.6008000.6355000.8426000.5459000.4355009.552100
Ba0.1043190.1563270.1205450.0088040.0171090.56696
La0.0013790.0016880.0014390.0014810.0016360.00129
Ce0.0017820.0025980.0031240.0017080.0024870.00122
Pr0.0002470.0003490.0004590.0001780.0001700.00020
Nd0.0009590.0015250.0017110.0007110.0007240.00055
Sm0.0002380.0003710.0003970.0001550.0002260.00011
Eu0.0003670.0004380.0003920.0001390.0001850.00204
Gd0.0002240.0003510.0003420.0001400.0001650.00009
Tb0.0000430.0000550.0000520.0000250.0000310.000014
Dy0.0003250.0003370.0002620.0001600.0001840.000079
Ho0.0000660.0000890.0000590.0000310.0000330.000016
Er0.0001820.0002190.0001610.0000930.0000740.000048
Tm0.0000290.0000300.0000260.0000120.0000110.000009
Yb0.0002060.0002050.0001560.0000730.0000700.000070
Lu0.0000320.0000340.0000200.0000100.0000100.000010
Os0.0000370.0000490.0000990.0001170.0000770.000315
Ir0.0000690.0000560.0000190.0000850.0001970.000484
Pt0.0042360.0036060.0008770.0015450.0054080.001278
Pb0.0410470.0517040.0968000.0575650.0387300.055446
Th0.0000340.0000480.0000850.0000330.0000260.000104
U0.0044700.0047500.0051200.0137400.0135100.080020
Note: well 3378, D3 psh, 1764,8–1767,6 m; well 13,813, D3 psh, 1784–1798 m; well 8855, D3 gv, 1816–1828 m; well 9189, D3 psh, 1624–1665 m; well 880, D3 psh; well 9161, 1691–1716 m.
Table 4. Results of ICP-MS (in ppm) for crude oil of Berezovskaya area (Romashkinskoye oil field).
Crude Oil Well101651702021,54921,726
Li0.0662000.0685000.0622000.1878000.282500
Be0.0339000.0378000.0338000.0251000.033100
Na56.94100080.95000073.2647002142.940000754.320000
Mg0.3604000.3068000.62190074.14160056.024900
Al0.0473000.0441000.0835000.0370000.041700
Ca1.4430001.7674000.831400162.900900134.323000
Sc0.0090000.0062000.0037000.0044000.003100
Ti0.0267000.0190000.0184000.0141000.014900
V1.5766001.5876009.2609000.4952000.253100
Mn0.5469000.4376000.2745000.2120000.283400
Co0.0320000.0253000.0660000.0263000.021800
Cr1.6776741.4752833.1543750.7628330.465681
Ni6.2139005.00810030.1662001.6442001.466600
Cu0.2001000.1960000.1127000.8791001.172100
Zn0.5866000.6530000.7707000.4595000.350300
Ga0.0270000.0288000.0660000.1090000.068900
Ge0.0378000.0296000.0891000.0393000.032600
Rb0.0043000.0041000.0060002.2861002.456800
Sr0.0591000.0471000.07870059.08160055.223400
Y0.0018000.0016000.0031000.0022000.001200
Zr0.0202000.0190000.0050000.0661000.013900
Mo0.0463000.0262000.0386000.0267000.011200
Ru0.0028000.0008000.0015000.0521000.031100
Rh0.0006000.0005000.0008000.0155000.014500
Pd0.0031000.0028000.0018000.0098000.011400
I7.0520005.8137000.6722007.6204009.140000
Ba0.0440090.0342640.2342651.1018320.931786
La0.0012640.0016520.0015890.0014320.000552
Ce0.0018150.0021000.0032150.0013650.001350
Pr0.0002400.0003210.0004920.0001950.000150
Nd0.0009390.0011330.0024240.0007910.000611
Sm0.0001390.0001420.0005800.0001610.000119
Eu0.0002620.0002170.0005230.0027240.002885
Gd0.0001860.0001620.0005890.0001580.000147
Tb0.0000280.0000310.0000920.0000270.000024
Dy0.0001950.0001960.0004960.0001820.000141
Ho0.0000320.0000350.0001100.0000390.000030
Er0.0000910.0000890.0002630.0000980.000092
Tm0.0000150.0000130.0000350.0000150.000017
Yb0.0000930.0001000.0002080.0000800.000095
Lu0.0000150.0000160.0000310.0000120.000015
Os0.0000210.0000190.0000650.0002070.000140
Ir0.0000960.0001060.0000450.0011150.000925
Pt0.0054760.0039130.0030690.0044740.004193
Pb0.0652940.0678150.0651280.0373050.013907
Th0.0000580.0000570.0000680.0000830.000066
U0.0046200.0036450.0050420.0786920.070645
Note: well 101, D3 gv, 1803,8–1826,6 m; well 651, C1 b, 1107,6–1113,2 m; well 7020, C1 tl, 1200,2 m; well 21,549, D3 dm, 1769–1773 m; well 21,726, D3 kn, 1780,3–1782,2 m.
Publisher’s Note: MDPI stays neutral with regard to jurisdictional claims in published maps and institutional affiliations.