Abstract
The effects of urban transport are highly concerning. The rapid urbanization and motorization in smart cities have a huge impact on sustainability. The goal of the paper is to analyse the smart cities selected, in terms of the urban transport. This paper presents an overview of research works published between 1991 and 2020 concerning urban transport and MCDM (multi-criteria decision making). The author highlights the importance of decision-making criteria and their weight, as well as techniques. Seven criteria and forty-four objects were used as the input of the approach. The entropy weight method was used to compute the weight of each criterion. The TOPSIS (Technique for Order Performance by Similarity to Ideal Solution) was applied to calculate the assessment and ranking of transport performance for each smart city. Portland was found to be the best location for transport enterprises and projects; Tbilisi was ranked last. The values of the relative closeness coefficient ranged from 0.03504 to 0.921402. Finally, some suggestions for future research are discussed.
1. Introduction
Urban transport should facilitate movement and access to public services. Mobility affects the life quality of the inhabitants and the sustainability of the city. Urban transport causes many problems, such as traffic congestion, greenhouse gas emissions, air pollution and noise, biodiversity loss, fatalities and injuries, increased fuel consumption, low mobility, reduced quality of life, and delivery delays [1]. Many cities are implementing sustainable mobility measures to improve the flow of passenger and goods, for example, energy-efficient vehicles, biofuels, cycling, walking, public transport, carsharing, park-and-ride, travel reduction, and distance reduction [2]. In order to mitigate climate change, reducing greenhouse gas emissions from transport is key to keeping the liveability of cities [3]. According to the European Commission forecasts, the intensity of freight transport in cities will increase by 40% by 2030, and rise by over 80% by 2050, when compared to 2005. At the same time, it is expected that passenger transport will also increase by approximately 34% by 2030, and by more than 50% by 2050, in comparison to 2005 [4].
Transport faces many challenges related to sustainability. Nowadays, transport emissions represent around 25% of the EU’s total greenhouse gas emissions [4]. In 2011, a White Paper recommended a 20% reduction in transport emissions between 2008 and 2030, as well as at least 60% between 1990 and 2030 [5]. It also suggested the halving of the number of conventionally-fuelled cars in urban transport by 2030, with their complete phasing-out by 2050. The European Union encourage cities to develop sustainable urban mobility plans that prioritize low-carbon transport models, alternative fuel vehicles, and smart transport systems. It is anticipated that the EU’s goal of at least a 55% greenhouse gas reduction by 2030, and that of climate neutrality by 2050, will be achieved [5]. Additionally, the transport sector represents 5% of European GDP and employs more than 10 million people in Europe [6].
There are a small number of decision-making study cases from the aspect of competitiveness and sustainability, related to urban transport. In empirical study, it is necessary to assess the solutions for traffic organisation and urban performance. The goal of this paper is to present the rankings of 44 smart cities around the world related to urban transport performance, based on the MCDM technique using seven criteria from the ISO 37120 standard. Firstly, the study identified publications on urban transport and MCDM based on a literature review. Secondly, it attempted to organize the techniques and main criteria in the field of urban transport and MCDM. The papers available on the Web of Science, Springer, Scopus, and Elsevier databases were reviewed. In the theoretical part, inductive thinking was used, whereby the empirical part was based on the TOPSIS technique and entropy method. The empirical part of article was tested on cities with ISO37120 standard. The implemented research indicated the possibility to evaluate the urban transport systems by using the TOPSIS technique for decision making. The paper is an attempt to answer the research questions: How can we measure the urban transport performance from the point of view of city residents’ transport needs and the quality of life, as well as, what does the classification of the smart cities present, in terms of urban transport, look like?
The MCDM technique was chosen because it avoids pairwise comparison, thus allowing it to be calculated in a simple and efficient way. Ranking a number of feasible alternatives based on the closeness to the ideal solution is best achieved by the TOPSIS approach. TOPSIS is a compensatory aggregation technique based on the idea that the ideal alternative must the smallest geometric distance to a positive ideal solution, and the geometric farthest distance to a negative ideal solution. It means, the benefit is maximized and cost is minimized. There is no study, despite growing interest in the issue, which includes a comprehensive and complete set of criteria characteristics for the urban transport based on the ISO 37120 standard. Considering this important gap in the literature, this paper aims to contribute on location theories by providing a framework based on problem hierarchy and the use supporting tools from the multi-criteria decision. It is a tool designed for city leaders. This framework can be used for different needs or multi-criteria problems faced by the cities. There are several other reasons for applying the TOPSIS techniques for this case study. (1) It is based on quantitative data. (2) It allows the possibility of performing calculations in a regular spreadsheet. (3) The TOPSIS techniques enable identification of patterns and anti-patterns.
The paper is organized into six sections and four appendixes. Section 1 provides an introduction to urban transport, while Section 2 presents a literature overview on MCDM techniques and criteria in urban transport. Section 3 describes the research methodology, while Section 4 presents an overview of research criteria and profiles of objects. Section 5 includes the smart cities ratings and an assessment of urban transport. Section 6 provides some general conclusions. Appendix A and Appendix B contain the results of a review of the following databases such as Web of Science, Springer, Scopus, and Elsevier in the context of urban transport and MCDM techniques. Thus, the third and fourth appendixes contain examples of the conducted research results (Appendix C and Appendix D).
2. Literature Review
Recently, many studies have explored the assessment of urban transport performance. Researchers often use technical efficiency, total factor productivity, and service satisfaction to evaluate the urban transport performance [2]. Researchers establish public transit service as production, such as vehicle-kilometres, passenger-kilometres, employees, fuel, and number of vehicles [3]. The transit performance assessment depends on inputs (capital, labour, energy, and air pollution) and outputs (gross domestic product, and GDP). MCDM techniques are a useful tool for measuring urban transport performance. The selection was performed on the basis of a cost–benefit analysis. Classical economic analysis techniques are unable to take into account the non-monetary parameters, which have a large impact on the result. The application of MCDM techniques allows the comparison of non-homogeneous criteria and prepare the ranking of the different alternatives. The TOPSIS technique is characterized by its simplicity and the computation process is a simple mathematical form. The decision-making process allows to search the best alternatives for each criterion.
The author analysed publications with the implementation of at least one MCDM technique to solve the problem related to urban transport. Papers available on the Web of Science, Springer, Scopus, and Elsevier databases were reviewed (Appendix A). Figure 1 presents the chronological evolution of the number of publications published for the period 1991 to 2020. More than 22,000 papers were published over the last three decades. There was a significantly increasing trend of growth each year. Additionally, an exponential increase in the number of papers has been observed since 2006. Most of the papers were observed in the Scopus database.
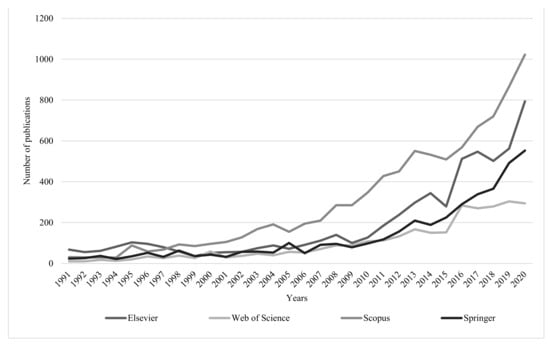
Figure 1.
Number of publications on the topic urban transport published over the period 1991–2020 (status: 2 October 2021). Source: author’s work.
Decision making is a common human practice that requires choosing the best alternative among many. MCDM techniques are considered the modern part of operations research with the multi-objective optimization problem. One of the first publications on MDCM was performed by Benjamin Franklin in his work on moral algebra. Since the 1950s, MCDM has been practiced by theoretical and empirical scientists to test the capability of mathematical modelling of decision-making approaches. The MCDM provides a framework for structuring decision problems and provides a set of methods for generating preferences among alternatives. Their advantage is the ability to take into account the contradictory and disproportionate effects of the decisions. The limitation is that the generated solutions are a compromise between many goals and are not optimal due to the nature of the problem.
The next stage analysed the publications regarding the MCDM techniques related urban transport (Figure 2). Over fifteen different MCDM techniques were used (Appendix B). “Transport Policy”, “Transport Research Part A: Policy and Practice”, and “Applied Soft Computing” are the top journals referred to urban transport and MCDM techniques. In a review of the research paper, the author observed that AHP (Analytical Hierarchy Process) is the most popular MCDM technique [7]. DEA (Data Envelopment Analysis) and TOPSIS are the well-known classical MCDM techniques. Authors used the lower proportion ELECTRE (Elimination et Choice Translating Reality), PROMOTHEE (Preference Ranking Organization Method for Enrichment Evaluation), or VIKOR (Vlsekrzterijumska Optimizacija I Kompromisno Resenje). In addition, MACBETH (Measuring Attractiveness by a Categorical Based Evaluation Technique), DEMATEL (Decision Making Trial and Evaluation Laboratory), and REMBRANDT (Ratio Estimation in Magnitudes or deci-Bells to Rate Alternatives which are non-dominated) are also considered. A lot of papers used two or more MCDM techniques (hybrids) [2,8,9,10,11,12,13,14,15].
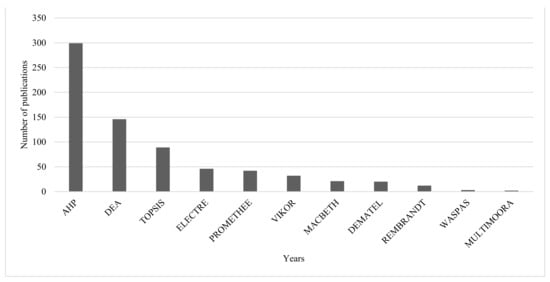
Figure 2.
Number of times that the different MCDM techniques were employed in the reviewed publications in the field urban transport (status: 4 October 2021). Source: author’s work.
The highest number of published papers concern the evaluation of the performance of urban transport. MCDM techniques are advantageous in comparison with the classical assessment methods, focussing on a single criterion such as cost–benefit analysis. The MCDM techniques are the most used, mainly for the choice of infrastructure, information systems technologies, choice of clean technologies for vehicles, location problems, and choice of transportation mode and route.
The identification of the best alternatives is highly dependent on the criteria and their weighting [8]. Criteria should be independent of alternatives and relevant to the decision-making process. Perez et al. argue that economic, logistic, and technical criteria were considered in early papers, while environmental and social criteria have been considered more recently [9]. Economic criteria are related with financial resources, for example, implementation costs, GDP, transportation expenses, infrastructure investments, maintenance costs, taxes, operational costs, and fuel costs. Logistic and technical criteria refer to technical requirements such as travel time, demand, number of vehicles, accessibility, reduction in journeys numbers, transit flows, transportation mode, technical feasibility, system reliability, and efficiency of the transport network. This criteria affect the economic issues of transport. Environmental criteria consider the impact on the natural environment, for example, energy efficiency, fossil fuel consumption, use of natural resources, the level of carbon emissions, GHG emissions, and ecological use. Safety criteria are associated to safety passengers and users involved in the operations of transport systems, such as transit accidents, fatalities, pedestrian safety, health risk, and reduction in consequences of accidents. These criteria could be included as a part of social criteria. Social criteria include consumer satisfaction, social equity, corporate social responsibility, participation of the population in decision making, preference of society regarding transport alternatives, people adaptability to the transport system, and society welfare. Land-use criteria refer to the location of activities. Miskolczi et al. argue that role of automation, sharing mobility, electric vehicles, congestions, GHG emissions, and social attitudes are the future topics in the context of urban transport [10].
The author conducted the literature review that focused on MCDM techniques in the field of urban transport. The summary indicates the aims of each paper, objects, MCDM techniques, and main criteria of the research. Table 1 presents the results of this analysis.

Table 1.
Papers relevant to MCDM and urban transport.
Based on the literature review, the author identified several areas of urban transport: (i) mobility performance, (ii) sustainable transport assessment, (iii) transport efficiency, and (iv) safety on the road. The urban transport studies are orientated to a different type of city, such as sustainable, liveable, competitive, and smart. The interest in the problem of urban transport evaluation is high and constant. The urban transport studies include four perspectives: rail transport, road network, shared transport, and external connectivity. The sustainable transport assessment obtains low-carbon performance, well-being performance, security performance, and carbon emission performance. While, the mobility performance involves the following metrics such as availability, affordability, and convenience. The transport efficiency can be analysed in two dimensions, public and personal transport.
Sancha et al. claim that medium size transit transfer stations are more suitable to reach a better balance among technical, social, and environmental objects [23]. However, Pamucar et al. show that public transport capacity improvements are the best alternative among the other transport demand management measures [25]. Sobhani et al. suggest that economic, social, and political factors have the highest influence on sustainability and competitiveness of unconventional modes of transport [14]. Additionally, Taboada et al. claim that Exploratory Data Analysis and Data Envelopment Analysis play a key role in improving decision making in transport network management and route planning. Techniques are useful to score multiple transport modes and Urban Rail Transit lines efficiency [27]. Fitzová et al. argue that bigger cities with greater population densities are more efficient than smaller cities, and the main efficiency factors are the ticket price, rate of subsidies, and structure of the city transport system [29]. Moreover, Singh et al. proposed methodology useful for developing a bus route transportation network for city using multimodal GIS data and social priority [30]. Awasthi et al. argue that a new tramway in the city centre of Luxembourg is the best alternative for implementation [2]. Likewise, Sinha et al. suggest that users are satisfied with ticketing facility, seat comfort, condition of bus stops, and condition of bus, whereas dissatisfaction was found for bus information at the bus stop, frequency of bus service, and buses not being on time [33]. Shen et al. suggest strengthening the construction of urban road transportation systems, optimizing transportation, improving the infrastructure of new energy vehicles, and promoting the concept of green transportation [35]. One of the most important things that has a significant impact on urban transport is the stakeholder participation. There are business and service operators, citizens, as well as authorities, who have different goals and perspectives [36,37]. Additionally, Queiroz et al. claim that smart mobility systems in city provide opportunities for the well-being of citizens and permit the solving of problems arising from the impacts of urbanization [38]. Fistola proposed that urban mobility meant distribution, quality, and use of urban activities with ICT, as well as different users being required [39].
Transport is one of smart city’s dimensions in the rankings. Table 2 presents the characteristics of the most popular smart cities rankings.
Table 2.
The characteristics of the most popular smart city rankings.
The literature contains many procedures for testing a city’s performance, such as The Smart City Index [44], The Innovation Cities Index [47], The Global Smart Cities Index [40], The City Competitiveness Index [48], The Global Liveability Index [46], and The Sustainable Cities Index [51]. Numerous organizations and institutions have prepared city rankings, in particular, relating to the life quality, innovation, competitiveness, such as the Institute for Urban Strategies [43], Mercer [49], the Institute for Management Development [40], and Arcadis [51]. Conger prepared an overview of the indexing methodology [53]. Dameri argued that the process of evaluating sustainable smart cities is a complex task [54,55]. Furthermore, Sacirovic et al. introduced a transformation between the present and the vision of a sustainable city in the future [56].
The determinants of a high position in the cities ranking are digital services associated with public transport and investments in low-carbon transport infrastructure, including bike sharing and electric incentives. Cities that promote energy-efficient public transport can reduce the city’s ecological footprint. Moreover, the most popular smart city rankings use the following metrics in related to transport such as: travel comfort, electronic services, intermodality, and a ticketing system [57]. Mobility innovation can be measured by traffic management, clean transport, and parking innovation [44].
TOPSIS technique is often used in urban transport. Moreover Zhang et al. established an index system to evaluate public transport priority performance by comprehensively considering four subsystems such as overall development level, infrastructure construction, public transportation level, and policy support [31]. Huang et al. evaluated the urban rail transit system’s operation performance from the operator’s, passenger’s, and government’s perspectives [1]. The number and the frequency of the operation accidents of the network are the most important sub-indicators in the evaluation system. Ajith et al. developed a framework for the selection of the best chassis among original equipment manufacturer based on the following criteria: technical features, cost of ownership, operational characteristics, reliability, maintenance, and safety [58]. Likewise, Awasthi et al. presented a multi-criteria decision-making approach for sustainability assessment of urban transportation systems [59]. There criteria are operating costs, safety, security, reliability, air pollutants, noise, GHG emissions, usage of fossil fuels, travel costs, waste from road transport, energy consumption, land usage, accessibility, benefits to economy, mobility, occupancy rate, share in public transit, and convenience to use. Alternatively, Sobhani et al. presented a framework to assess the sustainability and competitiveness of unconventional modes of transport in developing cities. The major driving forces in this market are economic, political, and social factors, with legal factors also exhibiting a weak influence [14]. Sinha et al. assessed the quality of services of midi bus users in terms of satisfaction based on their experiences while commuting [33]. Satisfaction was found for ticketing facility, seat comfort, condition of bus stops, and condition of bus, whereas bus information at the bus stop, frequency of bus service, and buses being on time are big concerns for the users. In addition, Zhao et al. evaluated the importance of each metro stations by complex network theory [60]. Erdogan et al. carried out a prioritization analysis for failures of corrective actions in Bus Rapid Transit system [61]. The most important failures were engine or fuel injection malfunction, whereas smart ticket machine failure was the least important. However, Buyukozkan et al. evaluated different public bus technologies as urban transportation alternatives. Dependencies among decision criteria significantly affect the selection process of the most sustainable urban transportation systems [62]. Zhu et al. established a comprehensive evaluation indicator system of metro development conditions [63]. The metro systems of slightly unbalanced cities should put urban development first because only favourable demand and supply conditions will benefit the metro development. Moreover, Shen et al. suggested the promotion of the development of green transportation from four aspects: strengthening the construction of urban road transportation system, optimizing transportation, improving the infrastructure of new energy vehicles, and promoting the concept of green transportation [35]. Lambas et al. compared Light-Rail Transit and Bus Rapid Transit [26]. Jakimavicius and Burinskiene indicated problematic transportation zones in Vilnius city according to time-based accessibility [64].
3. Research Methods
The presented research focused on the evaluation of urban transport and performance. The scope of research consists of three stages: selection, assessment, and classification (Figure 3). The TOPSIS technique selects an alternative that should simultaneously have the closest distance to the positive ideal solution and the farthest distance from the negative ideal solution. The test procedure consists of several successive steps: (1) selection of criteria and objects; (2) construction of the normalized decision matrix; (3) calculation of criterion weights based on the entropy method; (4) computation the weighted normalized decision matrix; (5) determination the positive ideal solution and the negative ideal solution; (6) calculation the separations of an alternative from the positive ideal solution and the negative ideal solution; (7) computation the ranking index; (8) linear ordering of smart cities using TOPSIS method; and (9) conclusions and finding the recommendations.
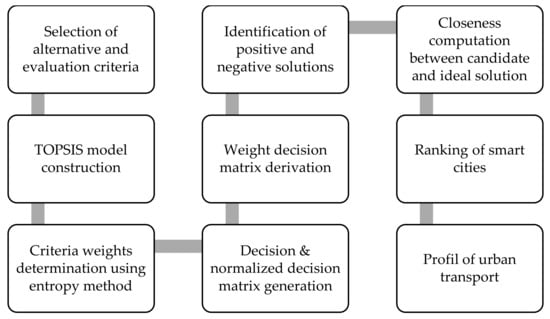
Figure 3.
The research design. Source: author’s work.
According to the review, the TOPSIS technique was used in this work, one of the most commonly applied to solve decision problems in field of urban transport. On the basis of the decision theory, the first method of linear ordering using the ideal solution and the negative ideal solution was proposed by C.L. Hwang and K. Yoon in 1981 under the name TOPSIS. TOPSIS takes the distance to the ideal solution and to the negative ideal solution with respect to each alternative, and chooses the nearness and farthest from the negative ideal solution. The test steps using the classic TOPSIS procedure can be concluded as follows [65]:
Stage 1. The multiple attributes were selected in accordance with substantive and statistical considerations. Then, the attributes were divided into stimulants (S) and de-stimulants (D).
Stage 2. The decision matrix was established for the ranking. The structure of matrix can be expressed as follows:
where represents the value of the -th criterion ( for the -th alternative (city, ) and .
Stage 3. The value of attributes was normalized in order to obtain their comparability in accordance with the formula:
Stage 4. The normalized (vector-based) decision matrix was constructed:
where means the normalized value of the -th criterion ( for the -th alternatives (cities, ).
Stage 5. The criterion weight vector for attribute was determined based on the entropy method [66]. According to Information theory, entropy is a measure of uncertainty. The entropy weight method is an objective weighting method. The assessment matrix is constructed and standardized according to the variation degree of each attribute. The entropy weight and the entropy weight of each attribute are computed. The quotient weight of each attribute is used to weight all the attributes, so as to obtain a more objective assessment result. The steps of entropy weight:
where means an entropy vector,
when:
represents the proportion of attribute values of the i-th alternative method under j-th index.
where means the criterion weight.
The weights were computed according to the following formula:
The entropy weight method is based on the Shannon entropy, developed by Claude Shannon [67]. It is a concept which is proposed as a measure of uncertainty in information, formulated in terms of probability theory. The entropy measures the intensities of criteria in order to represent the average information transmitted for decision making.
Stage 6. The weighted normalized decision matrix was calculated by multiplying the decision matrix by its associated weights. The weighted normalized value is calculated as:
where represents the weight of the j-th criterion.
Stage 7. The weighted normalized decision matrix was calculated based on the weight of each attribute:
where means the weighted and normalized value of the -th criterion ( for the -th alternatives (cities, ).
Stage 8. The positive ideal solution () and negative-ideal solution () were established [68]:
where ; .
Stage 9. The separation measures were calculated, using the n-dimensional Euclidean distance. The separation of each alternative from the positive ideal solution was computed:
Similarly, the separation of each alternative from the negative ideal solution was calculated:
where .
Stage 10. The relative closeness coefficient () was computed whose value is always between 0 and 1. The relative closeness coefficient of the alternative can be expressed as:
where 1, .
Stage 11. The ranking of smart cities was prepared.
Stanković et al. provided the ranking of Central and Eastern European cities in context of social, economic, and environmental aspects of urban life based on combining the AHP and TOPSIS [69]. Porro et al. designed a framework oriented to public managers based on the assessment of criteria and sub-criteria the strategic location decision made by energy enterprises of European cities using AHP and TOPSIS [70].
4. Research Materials
ISO standards can be used for assessing urban transport and other dimensions of smart cities. For example, the ISO 37122 standard obtains the following indicators city streets and thoroughfares covered by real-time online traffic alerts and information, users of sharing economy transportation, low-emission vehicles registered in the city, bicycles available through bicycle sharing services, public transport lines equipped with a real-time ICT-based system, city public transport network covered by a unified payment system, public parking spaces equipped with e-payment systems, public parking spaces equipped with real-time ICT-based available system, traffic lights that are smart, and city area mapped by real-time interactive street maps [71]. Moreover, the ISO 37123 standard includes only the one indicator related to transport: evacuation routes available [72].
The starting point for the multi-criteria analysis of urban transport in this study was the indicators proposed in the ISO 37120:2014 standard [73]. The ISO 37120:2014 standard involves 46 core and 54 supporting indicators in seventeen thematic groups [74,75]. The criteria were selected from ISO 37120:2014, namely [76]:
X1—high-capacity public transport system;
X2—light passenger public transport system;
X3—annual number of public transport trips per capita;
X4—number of personal automobiles per capita;
X5—length of bicycle paths and lanes;
X6—transport fatalities;
X7—commercial air connectivity.
There are four basic (X1, X2, X3, X4) and three additional indicators (X5, X6, X7).
Table 3 provides a list of the general overview of the analysed cities. The urban profile involves the following characteristics, such as country, certification year, city population, city land area, population density, and city product per capita. Ahmedabad (India) is the city with the largest population (6,374,470). Guadalajara (Mexico) is the city with the largest area (2734.11 km2). Whereas, Makati (Philippines) is the city with the highest population density (19,336.22).
Table 3.
The selected cities profile.
5. Research Results and Discussion
The research began with computing the basic statistics for urban transport indicators by measuring the position (arithmetic mean) and variability (standard deviation, variation coefficient). The most diverse indicator is the share of the transport fatalities (397.96%), while the least - the number of personal automobiles per capita (46.07%). Table 4 presents information on the general statistics of each indicator.
Table 4.
Basic statistics of urban transport indicators.
In the next step, the decision matrix () was developed. Then, the normalized decision matrix () was developed based on a normalized vector (). The results of calculated the normalized decision matrix are summarized in Appendix C.
Based on the entropy method, the entropy vector () and the criterion weight vector () were determined. Table 5 shows the weights of the evaluation criteria. The most important criterion was the transport fatalities (X6, , whereas the least important was the light passenger public transport system (X2, .
Table 5.
Weights of the evaluation criteria.
Weight factors () were determined and the weighted normalized decision matrix () was developed. Appendix D presents the weighted normalized decision matrix.
The results of the calculated relative closeness coefficient () and the ranking of smart cities compared to the basic level of urban transport are summarized in Table 6. Likewise, the positive distance and the negative distance are presented in this table. The values of the relative closeness coefficient range from 0.03504 to 0.921402.
Table 6.
The ranking of smart cities.
The relative closeness coefficient () was defined for each smart city. As a result, Portland (PR) was found to be the most desirable city among these alternatives, overtaking its nearest competitor, Melbourne (ME). Makkah (MK) ranked forty-three, leaving Tbilisi (TB) last.
The sensitivity analysis allowed the identification of the criteria that are particularly sensitive to weight changes, and it enabled the stability of TOPSIS rating to be examined by introducing changes to the criteria weighs. The sensitivity analysis enabled the identification of the criteria that have the greatest impact on the difference in the smart cities ranking, in terms of the proposed ranking.
The conducted analysis was accompanied by the sensitivity analysis of the final ranking to the variation of the weights of individual criteria. Relative weights of some criteria are increased and some of them are decreased according to equation [78]:
where is the percentage change of ;
Minor changes in the criteria weights have little effect on original ranking of the forty-four cities. The results of the sensitivity analysis confirm that PR, ME, and TC are the best among cities. In Table 7, we observe a few changes in the ranking order if the criteria weights were change enormously. In addition, AM has the highest position in the maximum number of scenarios expect in scenario 5 and 7. In these two cases, a great change in priorities of criteria is observed with a big change in ranking. The ranking remains consistent unless some drastic changes are made to the weights of the criteria set. Otherwise, the sensitivity analysis shows solidity in the ranking order.
Table 7.
The rank of the cities in various scenarios.
In order to validate the efficiency of the proposed TOPSIS, a comparative analysis with several approaches based on the same example can be carried out. Some of them are DEA and AHP. The calculation stages are not included here since this section is dedicated for comparison of the final rankings. Table 8 shows that the ranking order is the same, more or less, as the order due to the projected TOPSIS. The ranking order in DEA is not the same as the original study. According to this technique, ZW has an advantage over ME and OS over GM. The ranking order produced by AHP is similar to the original ranking order in this study. Thus, from the above two cases, it can be concluded that the results are harmonious with each other and they agree moderately with the results of the original preference order. The sensitivity analysis confirmed the high stability of this ranking, especially in the leading positions.
Table 8.
Comparison with other models.
Limitations and Further Study Works
The selected criteria for the evaluation of urban transport could help evaluate other cities. Therefore, there is an increasing number of scientists and practitioners to find solutions as to how, not only, to evaluate the urban transport, but also, to find prospects for their development. TOPSIS is modellable by using simple linear algebra operations. This technique considers a large number of criteria and alternatives. Analysis of all alternative are conducted after normalization, making each comparable.
The proposed approach is, however, not without limitations. This study uses available and measurable indicators while omitting those that are difficult to obtain and evaluate. Though, the analysis should be multidimensional and comprehensive. Therefore, more indicators should be considered and selected in future research. Furthermore, TOPSIS is a sensitive technique because of its method of normalization and weighing the criteria.
The results of this investigation provide theoretical support for the municipal government to formulate efficient transport policies. The paper has important value for urban study researchers and city governance practitioners, with regards to future-oriented urban transport projects concerning products with low emission of polluting gases, improvement of public transport, sustainable mobility, the use of a sharing economy, and technologies to reduce the time spent on traffic.
The paper contributes to the knowledge of city governance and managers of new business models, as well as to contemporary considerations on the competitiveness of the urban transport systems. The research findings may prove interesting primarily for city mayors and heads of urban transportation agencies and companies. Future research could be focussed on additional data and using other techniques of decision making, e.g., DEA, and AHP. There are also plans to use the TOPSIS procedure with other algorithms of normalization and criteria weighting.
6. Conclusions
In this paper, ideal solution-based multi-criteria decision-making techniques were applied for the assessment of urban transport. By using the entropy weight method and TOPSIS technique, the ranking of smart cities in terms of urban transport was obtained. Seven criteria in field of transportation were selected to build the evaluation index system.
Based on theoretical and empirical studies, the author concluded several findings. Overall, the urban transport is an important research direction, as confirmed by the growing number of publications. MCDM techniques are one of the important tools in solving decision-making problems in the field of urban transport, especially transport efficiency, sustainability performance, environmental efficiency, and low-carbon ecological city evaluation. AHP, TOPSIS, and DEA are the most popular MCDM techniques in the field of urban transport. Transport fatalities were found to be the most important criterion, followed by number of personal automobiles per capita. The ranking of smart cities in terms of urban transport was obtained based on the multi-criteria analysis. Portland was found to be the best location for transport enterprises and projects; Tbilisi was ranked last. The sensitivity analysis confirmed the high stability of the prepared rankings, and additionally, the sensitivity analysis showed solidity in the ranking order.
Funding
The research was conducted within WZ/WIZ-INZ/2/2019 project and was finance from Ministry of Science and Higher Education funds.
Institutional Review Board Statement
Not applicable.
Informed Consent Statement
Not applicable.
Data Availability Statement
Not applicable.
Acknowledgments
The authors thanks everyone who provided constructive advice that helped to improve this paper.
Conflicts of Interest
The author declares no conflict of interest.
Abbreviations
| AM—Amsterdam | EN—Eindhoven | HE—Heerlen | RT—Rotterdam |
| HG—Hague | ZW—Zwolle | OS—Oslo | KP—Koprivnica |
| ZA—Zagreb | GD—Gdynia | KL—Kielce | BR—Barcelona |
| VA—Valencia | PO—Porto | SI—Sintra | BO—Boston |
| DO—Doral | LA—Los Angeles | PR—Portland | SD—San Diego |
| CA—Cambridge | SA—Saint-Augustin- | OA—Oakville | SH—Shawinigan |
| SU—Surrey | de-Desmaures | TO—Toronto | VU—Vaughan |
| GU—Guadalajara | PN—Piedras Negras | LE—Leon | TR—Torreon |
| BA—Bueno Aires | GM—Greater Melbourne | TB—Tbilisi | PU—Pune |
| AN—Amman | ME—Melbourne | MA—Makati | DU—Dubai |
| AH—Ahmedabad | TC—Tainan City | TA—Taipei | MK—Makkah |
| CT—Cape Town |
Appendix A
Table A1.
The publications on the topic of the urban transport between 1991 and 2020.
Table A1.
The publications on the topic of the urban transport between 1991 and 2020.
| Elsevier | Web of Science | Scopus | Springer | |
|---|---|---|---|---|
| 1991 | 68 | 11 | 31 | 24 |
| 1992 | 56 | 11 | 30 | 26 |
| 1993 | 62 | 18 | 30 | 37 |
| 1994 | 82 | 13 | 29 | 22 |
| 1995 | 103 | 20 | 88 | 35 |
| 1996 | 96 | 34 | 59 | 52 |
| 1997 | 80 | 26 | 68 | 32 |
| 1998 | 59 | 38 | 93 | 63 |
| 1999 | 36 | 27 | 85 | 36 |
| 2000 | 52 | 59 | 96 | 43 |
| 2001 | 55 | 30 | 105 | 32 |
| 2002 | 57 | 37 | 128 | 57 |
| 2003 | 75 | 48 | 169 | 58 |
| 2004 | 88 | 40 | 191 | 53 |
| 2005 | 72 | 57 | 155 | 100 |
| 2006 | 91 | 54 | 195 | 50 |
| 2007 | 112 | 71 | 210 | 91 |
| 2008 | 140 | 89 | 285 | 96 |
| 2009 | 100 | 88 | 285 | 79 |
| 2010 | 127 | 108 | 347 | 98 |
| 2011 | 185 | 113 | 428 | 118 |
| 2012 | 238 | 133 | 451 | 156 |
| 2013 | 298 | 167 | 551 | 210 |
| 2014 | 344 | 150 | 532 | 189 |
| 2015 | 279 | 152 | 509 | 225 |
| 2016 | 512 | 284 | 568 | 290 |
| 2017 | 547 | 270 | 669 | 339 |
| 2018 | 502 | 279 | 720 | 366 |
| 2019 | 562 | 304 | 866 | 492 |
| 2020 | 794 | 294 | 1023 | 553 |
| Total | 5872 | 3025 | 8996 | 4022 |
Source: author’s work.
Appendix B
Table A2.
The publications with different MCDM techniques in the field urban transport.
Table A2.
The publications with different MCDM techniques in the field urban transport.
| Elsevier | Scopus | Web of Science | Springer | Total | |
|---|---|---|---|---|---|
| AHP | 46 | 72 | 42 | 139 | 299 |
| DEA | 36 | 0 | 15 | 95 | 146 |
| TOPSIS | 11 | 19 | 6 | 53 | 89 |
| ELECTRE | 6 | 2 | 1 | 37 | 46 |
| PROMETHEE | 6 | 5 | 2 | 29 | 42 |
| VIKOR | 3 | 4 | 1 | 24 | 32 |
| MACBETH | 0 | 1 | 0 | 20 | 21 |
| DEMATEL | 2 | 4 | 2 | 12 | 20 |
| REMBRANDT | 0 | 0 | 0 | 12 | 12 |
| WASPAS | 1 | 0 | 0 | 2 | 3 |
| MULTIMOORA | 0 | 0 | 0 | 2 | 2 |
| Total | 111 | 107 | 69 | 425 | 712 |
Source: author’s work.
Appendix C
Table A3.
Normalized decision matrix.
Table A3.
Normalized decision matrix.
| Cities | X1 | X2 | X3 | X4 | X5 | X6 | X7 |
|---|---|---|---|---|---|---|---|
| AM | 0.021319692 | 0.004226 | 0.027353 | 0.985333 | 0.032151 | 0.99696 | 0.03521 |
| EN | 0.001315848 | 0.008383 | 0.01961 | 0.967522 | 0.08622 | 0.993551 | 0.004857 |
| HE | 0.017017313 | 0.01841 | 0.006696 | 0.974332 | 0.093534 | 0.995297 | 0.055997 |
| RT | 0.019811642 | 0.002583 | 0.025595 | 0.98219 | 0.043055 | 0.996673 | 0.107406 |
| HG | 0.005366885 | 0.003675 | 0.011456 | 0.981666 | 0.035914 | 0.996817 | 0.060688 |
| ZW | 0.068749353 | 0.000241 | 0.005779 | 0.978523 | 0.054351 | 0.995892 | 0.055639 |
| OS | 0.026716146 | 0.012583 | 0.041065 | 0.976951 | 0.012218 | 0.998747 | 0.039634 |
| KP | 0 | 0.004169 | 0.00000103 | 0.980094 | 0.095531 | 1 | 0.006369 |
| ZA | 0.004864202 | 0.032201 | 0.035407 | 0.980618 | 0.013331 | 0.994804 | 0.006369 |
| GD | 0.006564454 | 0.015742 | 0.024769 | 0.971713 | 0.009526 | 0.999178 | 0.006103 |
| KL | 0.017194731 | 0.107955 | 0.018291 | 0.974856 | 0.01087 | 0.993777 | 0.006309 |
| BR | 0.023493059 | 0.009359 | 0.045602 | 0.974856 | 0.002743 | 0.997207 | 0.025611 |
| VA | 0.021334477 | 0.009449 | 0.016353 | 0.969094 | 0.008886 | 0.995338 | 0.003688 |
| PO | 0.027869361 | 0.046522 | 0.065689 | 0.982713 | 0.002928 | 0.9962 | 0.0000177 |
| SI | 0.011975694 | 0.080804 | 0.004506 | 0.964379 | 0.000518 | 0.995708 | 0 |
| BO | 0.017919186 | 0.01263 | 0.041742 | 0.985856 | 0.016625 | 0.991353 | 0.029612 |
| DO | 0 | 0.038409 | 0.001313 | 0.97957 | 0.017915 | 0.995995 | 0.065842 |
| LA | 0.007274125 | 0.009531 | 0.005477 | 0.967522 | 0.007672 | 0.995892 | 0.060669 |
| PR | 0.276446324 | 0.017106 | 0.00333 | 0.962808 | 0.037089 | 0.98587 | 0.030746 |
| SD | 0.003755341 | 0.013874 | 0.00703 | 0.977475 | 0.01874 | 0.98168 | 0.013748 |
| CA | 0 | 0.018987 | 0.002188 | 0.963855 | 0.039107 | 1 | 0.03711 |
| OA | 0.011354732 | 0.035727 | 0.001614 | 0.967522 | 0.043763 | 0.993839 | 0.053272 |
| SA | 0 | 0.044164 | 0.000701 | 0.951807 | 0.058404 | 1 | 0.002872 |
| SH | 0 | 0.008498 | 0.000611 | 0.966475 | 0.084096 | 0.99581 | 0.0000246 |
| SU | 0.001774177 | 0.009928 | 0.005098 | 0.974332 | 0.04386 | 0.994331 | 0.026703 |
| TO | 0.011739137 | 0.021921 | 0.020837 | 0.979047 | 0.007803 | 0.996262 | 0.042134 |
| VA | 0.007717669 | 0.017914 | 0.001959 | 0.969618 | 0.03178 | 0.996652 | 0.051514 |
| GU | 0.00076881 | 0.021202 | 0.026317 | 0.97957 | 0.000792 | 0.974944 | 0.007231 |
| LE | 0.003119594 | 0.037487 | 0.015843 | 0.984285 | 0.002827 | 0.995379 | 0.001432 |
| PN | 0 | 0.033317 | 0.005756 | 0.985856 | 0 | 0.993715 | 0.0000571 |
| TO | 0 | 0.029471 | 0.009263 | 0.991619 | 0.000931 | 0.993346 | 0.001379 |
| BA | 0.036193208 | 0.021366 | 0.0749 | 0.960712 | 0.001866 | 0.986424 | 0.009828 |
| GM | 0.042077561 | 0.02902 | 0.008434 | 0.96857 | 0.041492 | 0.994619 | 0.018277 |
| ME | 0.152091311 | 0.047239 | 0.104152 | 0.962284 | 0.062112 | 0.996467 | 0.018277 |
| TB | 0.007126277 | 0.064581 | 0.03378 | 0.97538 | 0 | 0.3977 | 0.001568 |
| AN | 0 | 0.006675 | 0.000237 | 0.990571 | 0 | 0.984658 | 0.006345 |
| DU | 0.004760708 | 0.03699 | 0.013907 | 0.972237 | 0.002751 | 0.984371 | 0.047401 |
| AH | 0.00193681 | 0.001447 | 0.0000196 | 0.999476 | 0.000476 | 0.989115 | 0.00000528 |
| PU | 0 | 0.0000949 | 0.000132 | 0.989523 | 0.00118 | 0.984104 | 0.003298 |
| MA | 0.001626329 | 0.000523 | 0.216445 | 0.996857 | 0.0000758 | 0.998152 | 0.018892 |
| MK | 0 | 0.00192 | 0.000553 | 0.994238 | 0 | 0.915116 | 0.026709 |
| TC | 0.110235522 | 0.021153 | 0.001096 | 0.98219 | 0.008043 | 0.980735 | 0.000066 |
| TA | 0.005706936 | 0.029368 | 0.049068 | 0.987428 | 0.007837 | 0.993222 | 0.004741 |
| CT | 0.022783388 | 0.013156 | 0.0000258 | 0.988476 | 0.004845 | 0.964099 | 0.006352 |
Source: author’s work.
Appendix D
Table A4.
Weighted normalized decision matrix.
Table A4.
Weighted normalized decision matrix.
| Cities | X1 | X2 | X3 | X4 | X5 | X6 | X7 |
|---|---|---|---|---|---|---|---|
| AM | 0.002951706 | 0.0000459 | 0.001689 | 0.337897 | 0.000709 | 0.378747 | 0.001552 |
| EN | 0.000182179 | 0.000091 | 0.001211 | 0.331789 | 0.001902 | 0.377452 | 0.000214 |
| HE | 0.002356043 | 0.0002 | 0.000413 | 0.334124 | 0.002063 | 0.378115 | 0.002468 |
| RT | 0.002742917 | 0.000028 | 0.00158 | 0.336819 | 0.00095 | 0.378638 | 0.004734 |
| HG | 0.000743044 | 0.0000399 | 0.000707 | 0.336639 | 0.000792 | 0.378692 | 0.002675 |
| ZW | 0.00951833 | 0.00000262 | 0.000357 | 0.335562 | 0.001199 | 0.378341 | 0.002452 |
| OS | 0.003698843 | 0.000137 | 0.002535 | 0.335023 | 0.000269 | 0.379426 | 0.001747 |
| KP | 0 | 0.0000452 | 0.0000000637 | 0.3361 | 0.002107 | 0.379902 | 0.000281 |
| ZA | 0.000673447 | 0.000349 | 0.002186 | 0.33628 | 0.000294 | 0.377928 | 0.000281 |
| GD | 0.000908847 | 0.000171 | 0.001529 | 0.333226 | 0.00021 | 0.379589 | 0.000269 |
| KL | 0.002380606 | 0.001172 | 0.001129 | 0.334304 | 0.00024 | 0.377537 | 0.000278 |
| BR | 0.003252608 | 0.000102 | 0.002815 | 0.334304 | 0.0000605 | 0.37884 | 0.001129 |
| VA | 0.002953753 | 0.000103 | 0.00101 | 0.332328 | 0.000196 | 0.37813 | 0.000163 |
| PO | 0.003858506 | 0.000505 | 0.004055 | 0.336999 | 0.0000646 | 0.378458 | 0.000000782 |
| SI | 0.001658032 | 0.000877 | 0.000278 | 0.330711 | 0.0000114 | 0.378271 | 0 |
| BO | 0.002480907 | 0.000137 | 0.002577 | 0.338076 | 0.000367 | 0.376617 | 0.001305 |
| DO | 0 | 0.000417 | 0.000081 | 0.335921 | 0.000395 | 0.37838 | 0.002902 |
| LA | 0.001007101 | 0.000103 | 0.000338 | 0.331789 | 0.000169 | 0.378341 | 0.002674 |
| PR | 0.038273921 | 0.000186 | 0.000206 | 0.330172 | 0.000818 | 0.374533 | 0.001355 |
| SD | 0.000519926 | 0.000151 | 0.000434 | 0.335202 | 0.000413 | 0.372942 | 0.000606 |
| CA | 0 | 0.000206 | 0.000135 | 0.330532 | 0.000863 | 0.379902 | 0.001636 |
| OA | 0.00157206 | 0.000388 | 0.0000996 | 0.331789 | 0.000965 | 0.377561 | 0.002348 |
| SA | 0 | 0.000479 | 0.0000433 | 0.3264 | 0.001288 | 0.379902 | 0.000127 |
| SH | 0 | 0.0000922 | 0.0000377 | 0.33143 | 0.001855 | 0.37831 | 0.00000108 |
| SU | 0.000245634 | 0.000108 | 0.000315 | 0.334124 | 0.000967 | 0.377748 | 0.001177 |
| TO | 0.00162528 | 0.000238 | 0.001286 | 0.335741 | 0.000172 | 0.378482 | 0.001857 |
| VA | 0.001068509 | 0.000194 | 0.000121 | 0.332508 | 0.000701 | 0.37863 | 0.002271 |
| GU | 0.000106442 | 0.00023 | 0.001625 | 0.335921 | 0.0000175 | 0.370383 | 0.000319 |
| LE | 0.000431907 | 0.000407 | 0.000978 | 0.337538 | 0.0000624 | 0.378146 | 0.0000631 |
| PN | 0 | 0.000362 | 0.000355 | 0.338076 | 0 | 0.377514 | 0.00000251 |
| TO | 0 | 0.00032 | 0.000572 | 0.340052 | 0.0000205 | 0.377374 | 0.0000608 |
| BA | 0.00501094 | 0.000232 | 0.004624 | 0.329454 | 0.0000412 | 0.374744 | 0.000433 |
| GM | 0.005825627 | 0.000315 | 0.000521 | 0.332148 | 0.000915 | 0.377857 | 0.000806 |
| ME | 0.021057002 | 0.000513 | 0.00643 | 0.329993 | 0.00137 | 0.37856 | 0.000806 |
| TB | 0.000986631 | 0.000701 | 0.002085 | 0.334484 | 0 | 0.151087 | 0.0000691 |
| AN | 0 | 0.0000724 | 0.0000147 | 0.339693 | 0 | 0.374073 | 0.00028 |
| DU | 0.000659119 | 0.000401 | 0.000859 | 0.333406 | 0.0000607 | 0.373964 | 0.002089 |
| AH | 0.000268151 | 0.0000157 | 0.00000121 | 0.342747 | 0.0000105 | 0.375766 | 0.000000233 |
| PU | 0 | 0.00000103 | 0.00000816 | 0.339334 | 0.000026 | 0.373862 | 0.000145 |
| MA | 0.000225165 | 0.00000568 | 0.013363 | 0.341849 | 0.00000167 | 0.379199 | 0.000833 |
| MK | 0 | 0.0000208 | 0.0000342 | 0.340951 | 0 | 0.347654 | 0.001177 |
| TC | 0.015262079 | 0.00023 | 0.0000677 | 0.336819 | 0.000177 | 0.372583 | 0.00000291 |
| TA | 0.000790124 | 0.000319 | 0.003029 | 0.338615 | 0.000173 | 0.377327 | 0.000209 |
| CT | 0.003154354 | 0.000143 | 0.00000159 | 0.338975 | 0.000107 | 0.366263 | 0.00028 |
Source: author’s work.
References
- Huang, W.; Shuai, B.; Sun, Y.; Wang, Y.; Antwi, E. Using entropy-TOPSIS method to evaluate urban rail transit system operation performance: The China case. Transport. Res. Part A Policy Pract. 2018, 111, 292–303. [Google Scholar] [CrossRef]
- Awasthi, A.; Omrani, H.; Gerber, P. Investigating ideal-solution based multicriteria decision making techniques for sustainability evaluation of urban mobility projects. Transport. Res. Part A Policy Pract. 2018, 116, 247–259. [Google Scholar] [CrossRef]
- Hamurcu, M.; Eren, T. Strategic planning based on sustainability for urban transportation: An application to decision-making. Sustainability 2020, 12, 3589. [Google Scholar] [CrossRef]
- White Paper. Roadmap to a Single European Transport Area—Towards a Competitive and Resource Efficient Transport System, Brussels 2011. Available online: https://www.eur-lex.europa.eu (accessed on 12 September 2021).
- The European Green Deal, Brussels. 2019. Available online: https://www.eur-lex.europa.eu (accessed on 30 September 2021).
- Sustainable and Smart Mobility Strategy—Putting European Transport on Track for the Future, Brussels 2020. Available online: https://www.eur-lex.europa.eu (accessed on 29 September 2021).
- Pedroso, G.; Bermann, C.; Sanches-Pereira, A. Combining the functional unit concept and the analytic hierarchy process method for performance assessment of public transport option. Case Stud. Transp. Policy 2018, 6, 722–736. [Google Scholar] [CrossRef]
- Senousi, A.M.; Zhang, J.; Shi, W.; Liu, X. A proposed framework for identification of indicators to model high-frequency cities. ISPRS Int. J. Geo-Inf. 2021, 10, 317. [Google Scholar] [CrossRef]
- Camargo Perez, J.; Carrillo, M.H.; Montoya-Torres, J.R. Multi-criteria approaches for urban passenger transport systems: A literature review. Ann. Oper. Res. 2015, 226, 69–87. [Google Scholar] [CrossRef]
- Miskolczi, M.; Foldes, D.; Munkacsy, A.; Jaszberenyi, M. Urban mobility scenarios until the 2030s. Sustain. Cities Soc. 2021, 72, 103029. [Google Scholar] [CrossRef]
- Feizi, A.; Joo, S.; Kwigizile, V.; Oh, J.-S. A pervasive framework toward sustainability and smart-growth: Assessing multifaceted transportation performance measures for smart cities. J. Transp. Health 2020, 19, 100956. [Google Scholar] [CrossRef]
- Liu, C.H.; Tzeng, G.H.; Lee, M.H.; Lee, P.Y. Improving metro-airport connection service for tourism development: Using hybrid MCDM models. Tour. Manag. Perspect. 2013, 6, 95–107. [Google Scholar] [CrossRef]
- Curiel-Esparza, J.; Mazario-Diez, J.L.; Canto-Perello, J.; Martin-Ulrillas, M. Prioritization by consensus of enhancement for sustainable mobility in urban areas. Environ. Sci. Policy 2016, 55, 248–257. [Google Scholar] [CrossRef]
- Sobhani, G.; Imtiyaz, N.; Azam, S.; Hossain, M. A framework for analyzing the competitiveness of unconventional modes of transportation in developing cities. Transp. Res. A 2020, 137, 504–518. [Google Scholar] [CrossRef]
- Jakimavičius, M.; Burinskiene, M.; Gusaroviene, M.; Podviezko, A. Assessing multiple criteria for rapid bus route in the public transport system in Vilnius. Public Transp. 2016, 8, 365–385. [Google Scholar] [CrossRef]
- Zhang, L.; Zhang, X.; Yuan, S.; Wang, K. Economic, social, and ecological impact evaluation of traffic network in Beijing-Tianjin-Hebei Urban Agglomeration based on the entropy weight TOPSIS method. Sustainability 2021, 13, 1862. [Google Scholar] [CrossRef]
- Samaie, F.; Javadi, S.; Meyar-Naimi, H.; Feshki-Farahani, H. Environmental sustainability policy on plug-in hybrid electric vehicle penetration utilizing TOPSIS and game theory. Clean Technol. Environ. Policy 2020, 22, 787–801. [Google Scholar] [CrossRef]
- Sinniah, G.K.; Li, X.Y.; Abdulkarim, S. The framework for assessing public transportation by using competitiveness index indicators. IOP Conf. Ser. Mater. Sci. Eng. 2021, 1153, 012012. [Google Scholar] [CrossRef]
- Tang, J.; Li, Z.; Gao, F.; Zong, F. Identifying critical metro stations in multiplex network based on D-evidence theory. Physica A 2021, 574, 126018. [Google Scholar] [CrossRef]
- Tudela, A.; Akiki, N.; Cisternas, R. Comparing the output of cost benefit and multi-criteria analysis. An application to urban transport investment. Transp. Res. A Policy Pract. 2005, 40, 414–423. [Google Scholar] [CrossRef]
- Wolnowska, A.E.; Konicki, W. Multi-criterial analysis of oversize cargo transport through the city using the AHP method. Transp. Res. Proc. 2019, 39, 614–623. [Google Scholar] [CrossRef]
- Vajjarapu, H.; Verma, A. Composite adaptability index to evaluate climate change adaptation policies for urban transport. Int. J. Disaster Risk Reduct. 2021, 58, 102205. [Google Scholar] [CrossRef]
- Sancha, A.R.; Mayoral, J.M.; Román, L.I. A novel approach for transit transfer stations design optimization in densely populated cities. Procedia Comput. Sci. 2018, 130, 1013–1018. [Google Scholar] [CrossRef]
- Suguiy, T.; Carvalho, M.F.; Nithack e Silva, D.L. Efficiency of urban public transport: Case study of Brazilian cities. IFAC Proc. 2013, 46, 379–384. [Google Scholar] [CrossRef]
- Pamucar, D.; Deveci, M.; Canitez, F.; Bozanic, D. A fuzzy Full Consistency Method-Dombi-Bonferroni model for prioritizing transport demand management measures. Appl. Soft. Comp. 2020, 87, 105952. [Google Scholar] [CrossRef]
- Lambas, M.E.L.; Giuffrida, N.; Ignaccolo, M.; Inturri, G. Comparison between Bus Rapid Transit and Light-Rail Transit systems: A multi-criteria decision analysis approach. Urban Transp. XXIII 2018, 176, 143–154. [Google Scholar] [CrossRef] [Green Version]
- Taboada, G.L.; Han, L. Exploratory Data Analysis and Data Envelopment Analysis of Urban Rail Transit. Electronics 2020, 9, 1270. [Google Scholar] [CrossRef]
- Budimir, D.; Šoštarić, M.; Vidović, K. Data Envelopment Analysis for determining the efficiency of variant solutions for traffic flow organisation. Promet—Traffic Transport. 2019, 31, 341–353. [Google Scholar] [CrossRef]
- Fitzová, H.; Matulová, M.; Tomeš, Z. Determinants of urban public transport efficiency: Case syudy of the Czech Republic. Eur. Transp. Res. Rev. 2018, 10, 42. [Google Scholar] [CrossRef]
- Singh, P.; Singh, A.K.; Singh, P.; Kumari, S.; Sangaiah, A.K. Multimodal data modelling for efficiency assessment of social priority based urban bus route transportation system using GIS and data envelopment analysis. Multimed. Tools. App. 2019, 78, 23897–23915. [Google Scholar] [CrossRef]
- Zhang, X.; Zhang, Q.; Sun, T.; Zou, Y.; Chen, H. Evaluation of urban public transport priority performance based on the improved TOPSIS method: A case study of Wuhan. Sustain. Cities Soc. 2018, 43, 357–365. [Google Scholar] [CrossRef]
- Zhao, L.; Zhou, J.; Li, H.; Yang, P.; Zhou, L. Optimizing the design of an intra-city metro logistics system based on a hub-and-spoke network model. Tunn. Undergr. Space Technol. 2021, 116, 104086. [Google Scholar] [CrossRef]
- Sinha, S.; Sadhukhan, S.; Priye, S. The role of quality assessment for development of sustainable bus service in mid-sized cities of India: A case study of Patna. Procedia Eng. 2017, 198, 926–934. [Google Scholar] [CrossRef]
- Aljohani, K.; Thompson, R.G. A multi-criteria spatial evaluation framework to optimise the siting of freight consolidation facilities in inner-city areas. Transp Res. Part A Policy Pract. 2020, 138, 51–69. [Google Scholar] [CrossRef]
- Shen, Z.; Zhao, Q.; Fang, Q. Anaysis of green traffic development in Zhoushan based on entropy weight TOPSIS. Sustainability 2021, 13, 8109. [Google Scholar] [CrossRef]
- Istiqomah, S.; Yuniaristanto; Sutopo, W. Recent developments in city logistics research: A literature review. IOP Conf. Ser. Mater. Sci. Eng. 2020, 943, 012038. [Google Scholar] [CrossRef]
- Kiryluk, H.; Glińska, E.; Ryciuk, U.; Vierikko, K.; Rollnik-Sadowska, E. Stakeholders engagement for solving mobility problems in touristic remote area from the Baltic Sea Region. PLoS ONE 2021, 16, e0253166. [Google Scholar] [CrossRef] [PubMed]
- Queiroz, A.P.F.; Guimareaes Junior, D.S.; Mascimento, A.M.; Melo, F.J.C. Overview of urban mobility in smart cities. Res. Soc. Dev. 2021, 10, e18210917830. [Google Scholar] [CrossRef]
- Fistola, R.; Raimondo, M.; La Rocca, R.A. The smart city and mobility: The functional polarization of urban flow. In Proceedings of the 5th IEEE International Conference on Models and Technologies for Intelligent Transportation Systems (MT-ITS), Naples, Italy, 26–28 June 2017; pp. 532–537. [Google Scholar] [CrossRef]
- Institute for Management Development World Competitiveness Centre. Smart City Index 2020. A Tool for Action, an Instrument for Better Lives for All Citizens. Available online: https://www.imd.org/smart-city-observatory/smart-city-index-2020 (accessed on 12 September 2021).
- Berrone, P.; Ricart, J.E. IESE Cities in Motion Index 2020, Business School University of Navarra. Available online: https://www.media.iese.edu/research/pdfs/ST-0542-E.pdf (accessed on 17 September 2021).
- TOP50 Smart City Governments. Available online: https://www.smartcitygovt.com (accessed on 21 September 2021).
- Institute for Urban Strategies; The Mori Memorial Foundation. Global Power City Index 2020. Available online: https://www.mori-m-foundation.or.jp (accessed on 11 September 2021).
- EasyPark. Smart Cities Index 2019. Available online: https://www.easyparkgroup.com/smart-cities-index/ (accessed on 19 September 2021).
- Kearney, A.T. Global Cities Index: New Priorities for a New World. Available online: https://www.kearney.com/global-cities/2020 (accessed on 27 September 2021).
- Economist Intelligence Unit, Global Liveability Index 2020. Available online: https://www.services.eiu.com/postponed-the-2020-global-liveability-index/ (accessed on 23 September 2021).
- 2THINKNOW. World’s Most Innovative Cities 2020–2021. Available online: https://www.innovation-cities.com/worlds-most-innovative-cities-preview-innovation-cities-index-2020-from-2thinknow/19288/ (accessed on 25 September 2021).
- Economist Intelligence Unit. Hot spots 2025. Benchmarking the Future Competitiveness of Cities 2018. Available online: http://www.citigroup.com/citi/citiforcities/pdfs/hotspots2025.pdf (accessed on 13 October 2021).
- Mercer, Quality of Living City Ranking 2019. Available online: https://www.mobilityexchange.mercer.com (accessed on 11 September 2021).
- Un Habitat, State of the World’s Cities 2008/2009 Harmonious Cities. Available online: https://www.sustainabledevelopment.un.org (accessed on 29 September 2021).
- Citizen Centric Cities. The Sustainable Cities Index 2018. Available online: https://www.arcadis.com (accessed on 28 September 2021).
- European Digital City Index 2016. Available online: https://www.nesta.org.uk (accessed on 15 October 2021).
- Conger, B.W. On livability, liveability and the limited utility of quality-of-life ranking. Sch. Public Policy 2015, 7, 1–8. Available online: https://www.policyschool.ca/wp-content/uploads/2016/03/livability-conger.pdf (accessed on 5 September 2021).
- Dameri, R.P. Urban Smart Dashboard Measuring Smart City Performance. In Smart City Implementation. Creating Economic and Public Value in Innovation Urban Systems; Springer: Cham, Switzerland, 2017; pp. 67–84. [Google Scholar] [CrossRef]
- Hajduk, S. Instruments of Spatial Management in the Context of Sustainability—A Multi-Dimensional Comparative Analysis of the Regional Cities. Annu. Set Environ. Protect. 2018, 20, 1219–1233. [Google Scholar]
- Sacirovic, S.; Ketin, S.; Vignjevic, N. Eco-industrial zones in the context of sustainability development of urban areas. Environ. Sci. Pollut. Res. 2018, 26, 24346–24356. [Google Scholar] [CrossRef]
- McKinsey&Company, Urban Transportation Systems of 25 Global Cities. Elements of Success. 2021. Available online: https://www.mckinsey.com (accessed on 29 October 2021).
- Ajith, A.J.; Vaidya, D.; Sodawalaa, M.; Verma, S. Selection of bus chassis for large fleet operations in India: An AHP-TOPSIS. Expert Syst. Appl. 2021, 186, 115760. [Google Scholar] [CrossRef]
- Awasthi, A.; Chauhan, S.S.; Omrani, H. Application of fuzzy TOPSIS in evaluating sustainable transportation systems. Expert Syst. Appl. 2011, 38, 12270–12280. [Google Scholar] [CrossRef]
- Zhao, L.; Li, H.; Li, M.; Li, J.; Xue, J. Location selection of intra-city distribution hubs in the metro-integrated logistics system. Tunn. Undergr. Space Technol. 2018, 80, 246–256. [Google Scholar] [CrossRef]
- Erdogan, M.; Kaya, I. Prioritizing failures by using hybrid multi criteria decision making methodology with a real case application. Sustain. Cities Soc. 2019, 45, 117–130. [Google Scholar] [CrossRef]
- Buyukozkan, G.; Feyzioglu, O.; Gocer, F. Selection of sustainable urban transportation alternatives using an integrated intuitionistic fuzzy Choquet integral approach. Transp. Res. D 2018, 58, 186–207. [Google Scholar] [CrossRef]
- Zhu, Y.; Jiao, J.; Zhang, Y.; Wu, Y.; Huo, X. Sustainable development of urban metro system: Perspective of coordination between supply and demand. Int. J. Environ. Res. Public Health 2021, 18, 349. [Google Scholar] [CrossRef] [PubMed]
- Jakimavicius, M.; Burinskiene, M. A GIS and multi-criteria based analysis and ranking of transportation zones of Vilnus city. Technol. Econ. Dev. Econ. 2009, 15, 39–48. [Google Scholar] [CrossRef]
- Hwang, C.L.; Yoon, K. Multiple Attributes Decision Making Methods and Application. Lecture Notes in Economics and Mathematical Systems, 186; Springer: Berlin/Heidelberg, Germany, 1981. [Google Scholar] [CrossRef]
- Halicka, K. Technology selection using the TOPSIS method. Foresight STI Gov. 2020, 14, 85–96. [Google Scholar] [CrossRef]
- Shannon, C.E.; Weaver, W. The Mathematical Theory of Communication; The University of Illinois Press: Champaign, IL, USA, 1964. [Google Scholar]
- Ban, A.J.; Ban, O.J.; Bogdan, V.; Sabau Popa, D.C.; Tuse, D. Performance evaluation model of Romanian manufacturing listed companies by fuzzy AHP and TOPSIS. Technol. Econ. Dev. Econ. 2020, 26, 808–836. [Google Scholar] [CrossRef]
- Stanković, J.; Dzunić, M.; Dzunić, Z.; Marinković, S. A multi-criteria evaluation of the European cities’ smart performance: Economic, social and environmental aspects. J. Econ. Bus. 2017, 35, 519–550. [Google Scholar] [CrossRef]
- Porro, O.; Pardo-Bosch, F.; Agell, N.; Sanchez, M. Understanding location decisions of energy multinational enterprises within the European smart cities’ context: An integrated AHP and extended fuzzy linguistic TOPSIS method. Energies 2020, 13, 2413. [Google Scholar] [CrossRef]
- ISO37122. Sustainable Cities and Communities—Indicators for Smart Cities. Available online: http://transparencia.caubr.gov.br/arqivos/ISO_FDIS37122 (accessed on 19 October 2021).
- ISO37123. Sustainable Cities and Communities—Indicators for Resilient Cities. Available online: http://transparencia.caubr.gov.br/arqivos/Ballot_result_and_comments_on_ISO_DIS37123 (accessed on 19 October 2021).
- Fox, M.S. The semantics of populations: A city indicator perspective. J. Web Semant. 2018, 48, 48–65. [Google Scholar] [CrossRef]
- Fox, M.S. The role of ontologies in publishing and analyzing city indicators. Comput. Environ. Urban Syst. 2015, 54, 266–279. [Google Scholar] [CrossRef]
- Hajduk, S. Using multivariate statistical methods to assess the urban smartness on the example of selected European cities. PLoS ONE 2020, 15, e0240260. [Google Scholar] [CrossRef] [PubMed]
- ISO37120. Sustainable development of communities—Indicators for city services and quality of life. Available online: http://oxy.social/wp-content/uplods/2020/06/2020/ISO_37120_2014 (accessed on 29 October 2021).
- World Council on City Data. Available online: http://open.dataforcities.org/ (accessed on 9 October 2021).
- Debnath, A.; Roy, J.; Kar, S.; Zavadskas, E.K.; Antucheviciene, J. A hybrid MCDM approach for strategic project portfolio selection of agro by-products. Sustainability 2017, 9, 1302. [Google Scholar] [CrossRef] [Green Version]
Publisher’s Note: MDPI stays neutral with regard to jurisdictional claims in published maps and institutional affiliations. |
© 2021 by the author. Licensee MDPI, Basel, Switzerland. This article is an open access article distributed under the terms and conditions of the Creative Commons Attribution (CC BY) license (https://creativecommons.org/licenses/by/4.0/).