Article

Optimisation of Propane Production from Hydrothermal Decarboxylation of Butyric Acid Using Pt/C Catalyst: Influence of Gaseous Reaction Atmospheres

1
Department of Chemical Engineering and Applied Chemistry, College of Engineering and Physical Sciences, Aston University, Birmingham B4 7ET, UK
2
Energy and Bioproducts Research Institute, College of Engineering and Physical Sciences, Aston University, Birmingham B4 7ET, UK
3
Sustainable Fuels, SHV Energy, 2132 JL Hoofddorp, The Netherlands
*
Author to whom correspondence should be addressed.
Energies 2022, 15(1), 268; https://doi.org/10.3390/en15010268
Submission received: 1 December 2021 / Revised: 22 December 2021 / Accepted: 28 December 2021 / Published: 31 December 2021

Abstract

:
The displacement and eventual replacement of fossil-derived fuel gases with biomass-derived alternatives can help the energy sector to achieve net zero by 2050. Decarboxylation of butyric acid, which can be obtained from biomass, can produce high yields of propane, a component of liquefied petroleum gases. The use of different gaseous reaction atmospheres of nitrogen, hydrogen, and compressed air during the catalytic hydrothermal conversion of butyric acid to propane have been investigated in a batch reactor within a temperature range of 200–350 °C. The experimental results were statistically evaluated to find the optimum conditions to produce propane via decarboxylation while minimizing other potential side reactions. The results revealed that nitrogen gas was the most appropriate atmosphere to control propane production under the test conditions between 250 °C and 300 °C, during which the highest hydrocarbon selectivity for propane of up to 97% was achieved. Below this temperature range, butyric acid conversion remained low under the three reaction atmospheres. Above 300 °C, competing reactions became more significant. Under compressed air atmosphere, oxidation to CO2 became dominant, and under nitrogen, thermal cracking of propane became significant, producing both ethane and methane as side products. Interestingly, under a hydrogen atmosphere, hydrogenolytic cracking propane became dominant, leading to multiple C–C bond cleavages to produce methane as the main side product at 350 °C.

1. Introduction

The global energy sector is a major contributor to greenhouse gas (GHG) emissions, and a range of ambitious decarbonisation measures are being developed based on the production and utilisation of low-carbon fuels and energy. These include production of renewable electricity, deployment of electric vehicles, use of hydrogen fuel for road transport, and the utilisation of biofuels. Deployment of biofuels, including renewable fuel gases, can contribute to addressing the deleterious effects of climate change and global warming such as incidences of wildfires, agricultural and ecological droughts, and flash floods. By law, the UK has a commitment to reduce GHG emissions through the Climate Change Act 2008. Indeed, the UK’s independent Climate Change Committee (UKCCC) has recommended a reduction of 1990 levels of GHG emissions by 100%, in order to achieve net zero by 2050 [1]. While electrification is developing into a potential solution for road transport, there is still the need for the application of low-carbon liquid or gaseous carbon-based fuels for difficult-to-decarbonise sectors.
The World Liquefied Petroleum Gases Association (WLPGA) and Liquid Gas UK, (LGUK) have both proposed bio-LPG (biomass-derived liquified petroleum gases) as a potential solution for off-grid heating to reduce carbon emissions [2,3]. The carbon intensity of bio-LPG is around 80% lower than oil [2], and for the UK, switching from fossil LPG to bio-LPG can potentially lead to around 78% reduction in GHG emissions [4]. In addition, bio-LPG has the potential to maintain air quality, giving that its combustion emits 27% less nitrogen oxides (NOx) and 43% less particulate matter compared with oil [2].
Different routes are being proposed and researched for the production of bio-LPG and its components (mainly propane and butane) from biomass and biomass-derived feedstocks. Currently, the main process for making bio-LPG is via hydroprocessing of vegetable oils and fats (HVO) to produce green liquid fuels, such as sustainable aviation fuel and green diesel, as the target products. In the HVO process, biopropane is obtained as a by-product at a yield of 5–8% [5]. A typical commercial production plant capacity for HVO biopropane is that of Neste in Rotterdam, which has around 40,000 tonnes per year bio-LPG capacity. In 2017, the global capacity was estimated to be around 220,000 tonnes per year [6]. Demand for all the products has been driving further growth and plant capacity, though growth is constrained by feedstock availability. To satisfy growing demand for bio-LPG, dedicated plants, using novel feedstocks, producing larger quantities of on-purpose biopropane and biobutane, or both, as main products, will be required.
Catalytic conversion of carboxylic acids, including volatile and long-chain fatty acids, via decarboxylation (removal of -COO groups), can produce fuel range aliphatic hydrocarbons [7,8,9,10]. Long-chain fatty acids obtained from lipids (vegetable oils and animal fats) have been investigated to produce liquid hydrocarbons products as alternatives to conventional fossil-derived diesel and kerosene fuels. In addition, C2–C5 carboxylic acids can undergo decarboxylation to produce C1–C4 hydrocarbon fuel gases [11,12]. Furthermore, for C3+ carboxylic acids, the choice of catalysts and reaction environment can determine whether the final hydrocarbon products are alkenes (via decarbonylation) or alkanes (via decarboxylation) [13,14]. The presence of hydrogen (either added or generated in situ) and hydrogenating or hydrogen-transfer catalysts favour the conversion of carboxylic acids to alkanes [15]. For instance, some researchers have found that the conversion of stearic, palmitic, and lauric acids in the presence of Pt and Pd catalysts under hydrothermal conditions proceeded, via the decarboxylation mechanism, to produce n-alkanes with more than 90% hydrocarbon selectivity [8,15]. The combination of hydrothermal conditions and the noble metals have been reported to generate hydrogen in situ for alkane formation without external hydrogen supply [8,9,15]. In contrast, with zeolite-based catalysts, the carboxylic acid, butyric acid, was converted to propylene even in the presence of water [16].
Decarboxylation of butyric acid has been identified as a potential route to produce commercial quantities of propane at high yields compared with existing routes [11,17]. Making butyric acid from biomass offers a green and simple route to make high yields of biopropane according to the following Reaction Equation (R1):
C3H7COOH ==> C3H8 + CO2
The US National Renewable Energy Laboratory (NREL) has also recently identified butyric acid an excellent candidate biomass-derived feedstock for the production of renewable fuels and chemicals [18]. Indeed, researchers from NREL have recently published a paper on a potential commercial route to make bio-butyric acid that can deliver the product at about 55% of the cost of fossil the fossil-derived analogue [19]. In a recent publication, Razaq et al. [17] showed that the decarboxylation of butyric acid could be achieved under hydrothermal conditions in the presence of 5 wt% Pt/C catalyst. The work showed that the highest yield of propane was obtained around 300 °C after 1 h reaction time under nitrogen atmosphere. However, analysis of the reaction products showed the presence of other gases apart from propane and CO2. These other gases included hydrogen, methane, and ethane, and their compositions changed with reaction conditions [17]. The presence of these gases indicated that other competing reactions occurred alongside the main decarboxylation reaction (Reaction Equation (R1)). Identifying such reactions and the conditions that favour them is important in determining the optimum reaction conditions for decarboxylation in order to enhance the selectivity towards propane. In addition, while experiments have been reported at temperatures above 300 °C [11,17], it is important to carry out tests at lower temperatures, which may have significant influence on production costs. Additionally, operating at lower temperatures and pressures may provide good compensation for the use of expensive Pt catalyst for this reaction.
In the present work, the catalytic hydrothermal decarboxylation of butyric acid has been investigated under different gaseous reaction atmospheres of nitrogen, hydrogen, and compressed air within a temperature range of 200–350 °C. Using a batch reactor, experiments were carried out to study the effects of these variables on butyric conversion and the yields and compositions of gas products. The reactor enables the easy sampling of the gas products from the reaction for direct analysis to measure the yields of propane and CO2 (the main products of decarboxylation of butyric acid (1). The observed yields and compositions of gas products, as well as the conversions of butyric acid, have been used to hypothesise the dominant reaction schemes or mechanisms involved in the process under the different gas atmospheres and varying temperatures. In addition, response surface methodology (RSM) was used as a statistical tool to interrogate the experimental data to determine the optimum conditions for propane production.

2. Materials and Methods

2.1. Materials

The main feedstock, n-butyric acid (+99%, Acros Organics) was purchased from Fisher Scientific, Leicester, UK, and 5 wt% platinum on carbon (Pt/C) catalyst was purchased from Sigma Aldrich, Gillingham, Dorset, UK. The Pt/C catalyst was confirmed to contain 4.9 wt% of Pt metal. This was done by calcining 2 g of the fresh catalyst in a muffle furnace at 500 °C for 2 h to burn off the carbon. X-ray diffraction measurement showed that all the carbon was removed during calcination. Thereafter, the solid residue (ash) was reduced at 300 °C under hydrogen at a flow rate of 20 mL per min for 3 h and weighed. A Milli-Q Advantage A10 Water Purification System was used to produce deionised water in-house, for use in experiments and analytical work. Hydrochloric acid (1 M), ethanol (98%), sodium hydroxide (pellets), and phenolphthalein indicator (1 wt% in ethanol) were purchased from Fisher Scientific (UK) for butyric acid analysis by acid-based titration. At the end of an experiment, the gas products were collected using Tedlar bags (1 L) purchased from Restek, Saunderton, UK.

2.2. Method

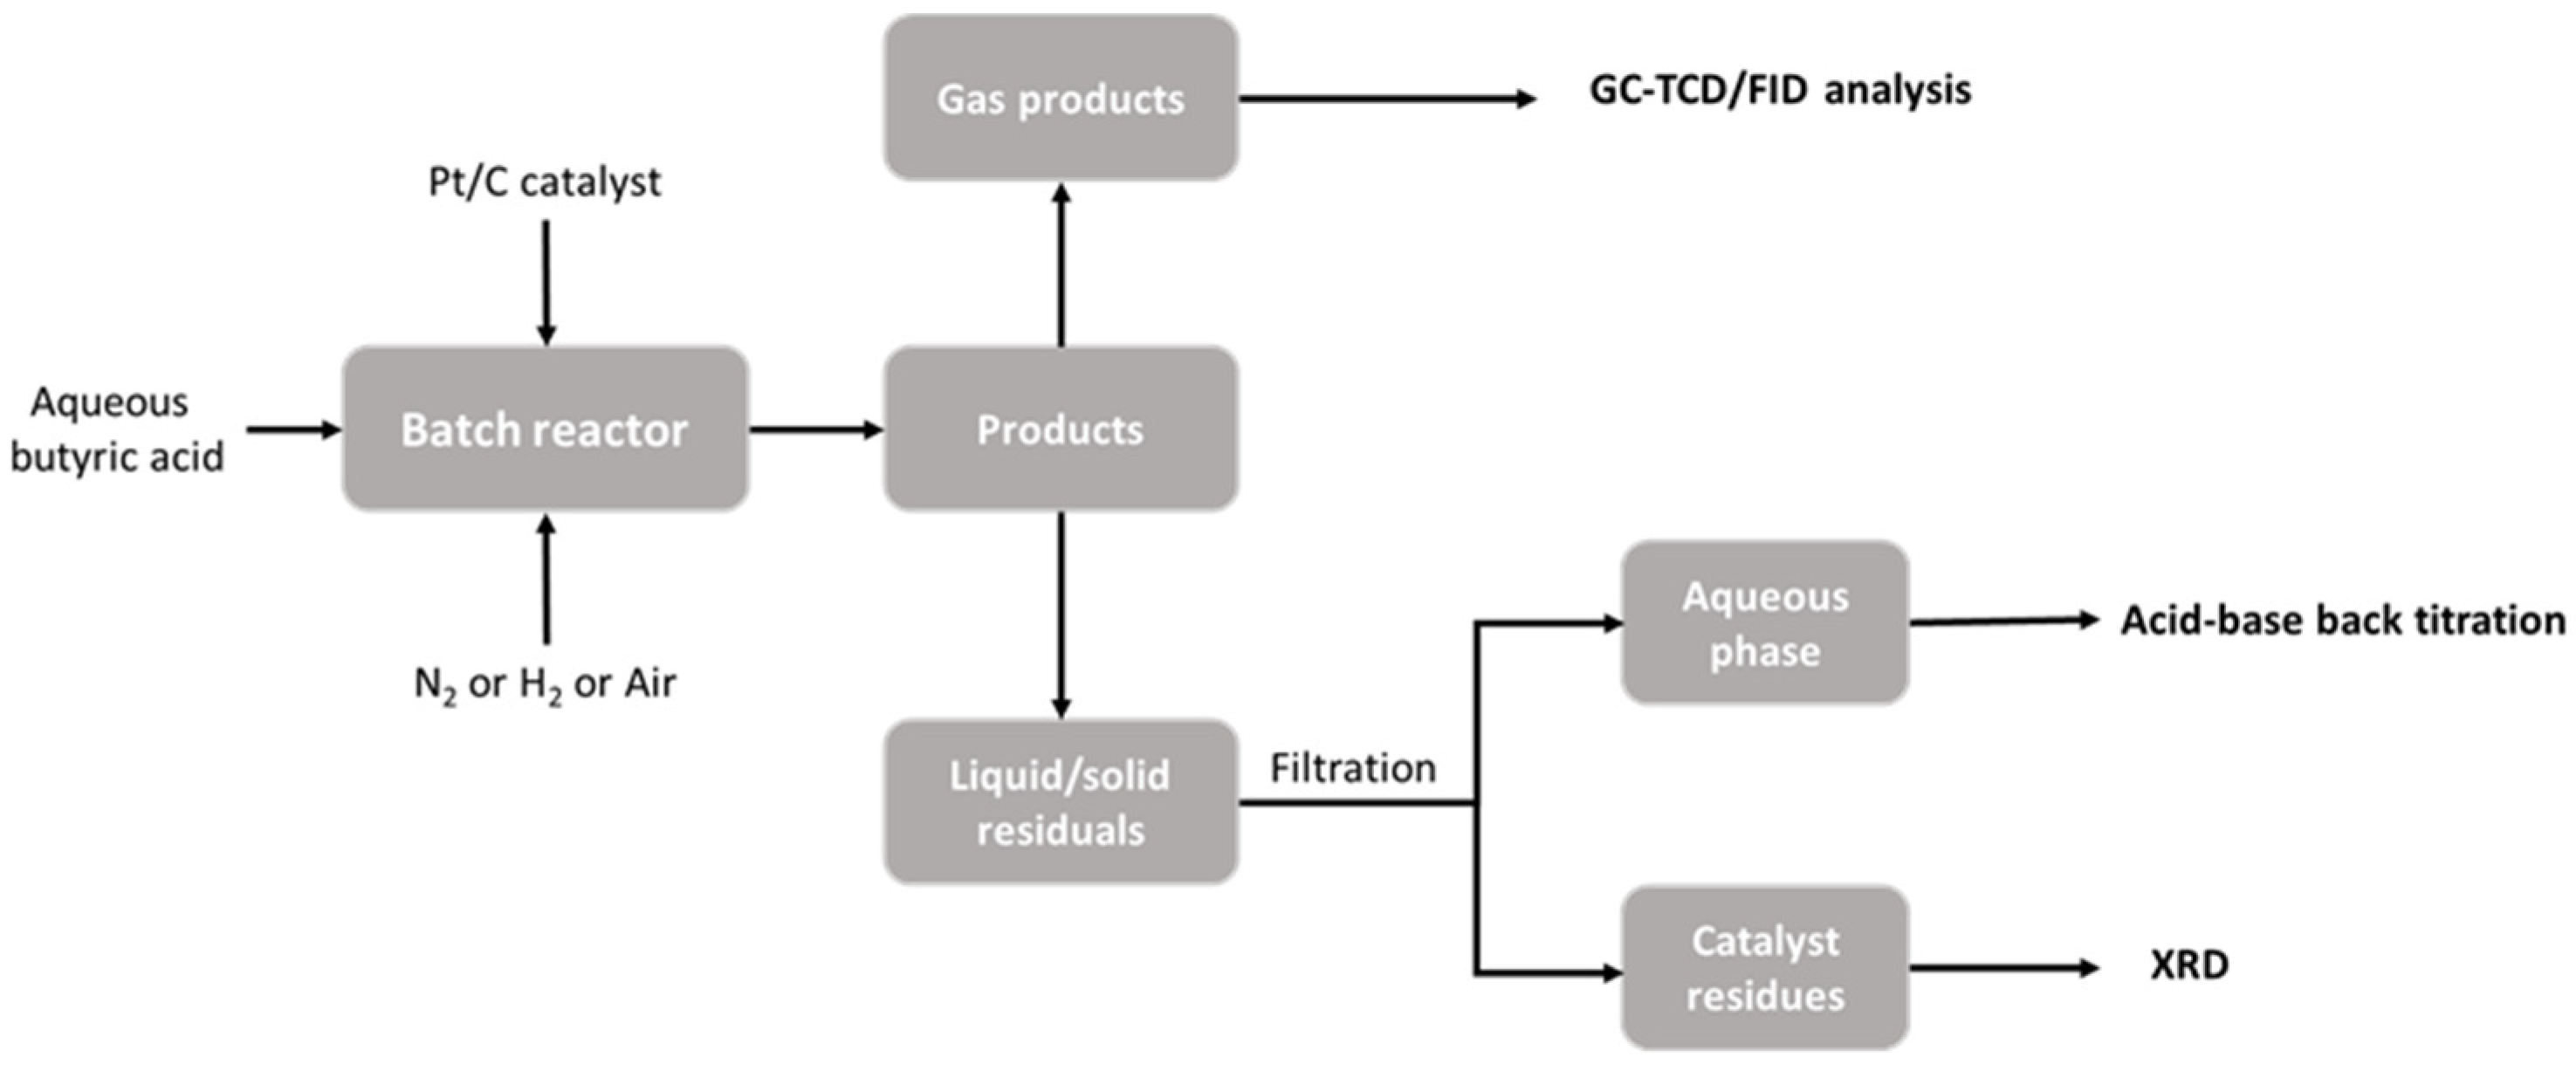
2.2.1. Batch Reactor Procedure

The catalytic decarboxylation of butyric acid, in the present study, was carried out in a Hastelloy-C 100 mL capacity batch reactor purchased from Parr Instruments Co., Inc., Moline, IL, USA. The reactor can operate at maximum temperature and pressure of 600 °C and 35 MPa, respectively.
The experimental procedure has been reported previously [17]. For each individual experiment, a 10 wt% of butyric acid in water was used, with the deionised water (9 g) used to quantitatively transfer the butyric acid (1 g) into the reactor. This was followed by the addition of 1 g of the 5 wt% Pt/C catalyst (Pt metal/butyric acid mass ratio = 1:20).
Upon loading, the reactor was sealed and purged for 5 min with the nitrogen, hydrogen, or compressed air, to provide different reactions atmospheres for butyric acid conversion. Thereafter, the reactor was pressurised to 5 bar with the respective gas, and heated at a heating rate of approximately 30 °C/min by an electric heating jacket coupled with a temperature controller. Experiments were carried out at temperatures of 200 °C, 250 °C, 300 °C, and 350 °C, respectively. Each reaction was held for 1 h at the set temperature and stopped by removing the heating jacket and quickly cooling the reactor with an industrial cooling fan, to reach ambient temperature within 30 min. The schematic of the full experimental programme is depicted in Figure 1.

2.2.2. Product Collection

Once cooled, the temperature and pressure of the reactor were noted and then the gas product was collected using the 1 L Tedlar bags. The reactor was then opened to collect the liquid and solid contents. This was achieved by rinsing with a known volume of deionised water. The resulting slurry was then separated into the two components of solid residue (including catalyst) and aqueous phase using vacuum filtration. Whatman Grade 4 qualitative filter paper was used for the filtration. Throughout this work, each experiment was repeated twice, and analyses of products were carried out in triplicates and averages reported (standard deviations were consistently ≤2%).

2.2.3. Analysis of Gaseous Phase

A GC-2014 gas chromatograph, obtained from Shimadzu, UK, was used to analyse each gas product by injecting 1 mL of the gas sample into the GC, using a gas-tight syringe. The temperature of the injector was held at 60 °C and the detectors—a flame ionization detector (FID) and a thermal conductivity detector (TCD)—were at 220 °C. The column oven program started at 80 °C, increased to 180 °C at 10 °C min−1 and then held at 180 °C for 3 min, resulting in a total analysis time of 13 min. A Hayesep 80–100 mesh column with 2 mm diameter and 2 m length was used to separate the hydrocarbons and CO2 and were quantified using FID for the hydrocarbons and the TCD for CO2. A 2 mm diameter, 2 m length, 60–80 mesh molecular sieve column was used for the permanent gases—hydrogen, nitrogen, oxygen, and carbon monoxide—and were quantified using a TCD.
The volume % of each gas was used to calculate their mass yields using the ideal gas equation [17]. In addition, considering that the gas products were held under pressures (5–15 bar), Henry’s law was used to calculate the mass of dissolved CO2 (results from other gases were negligible due to poor solubility in water), based on the volume % obtained from the GCs, the volume of the reactor occupied by the gas, and their Henry’s constants. The yield of individual components in the gas products was calculated using Equation (1), as follows:
Gas   component   yield   ( % ) = mass   of   component i × 100 mass   of   butyric   acid   feed
The decarboxylation of butyric acid would produce a 1:1 mass ration of propane and CO2. As the target product, the hydrocarbon selectivity towards propane was evaluated to assess the possibility of secondary reactions such as cracking and oxidation was calculated according to Equation (2). This was based on the total yields of hydrocarbon gases.
Propane   hydrocarbon   selectivity   ( % ) = mass   of   propane   produced   × 100 Total   mass   of   hydrocarbon   gases

2.2.4. Analysis of Aqueous Phase

The butyric acid conversion was determined using acid-based back-titration of aliquots of the filtered aqueous phase, based on a modified version of the method of analysing fatty acids approved by the European Economic Community [20]. The back-titration procedure involved adding 10 mL of the filtered aqueous solution to 25 mL of 0.1 M NaOH solution, which was gently swirled and covered with parafilm for 5 min. Thereafter, a few drops of phenolphthalein indicator were added and the solution and titrated with 0.1 M HCl standard solution (Fisher Scientific, UK) from a 50 mL burette to a colourless endpoint. A blank titration was also carried out using 10 mL of deionised water. Butyric acid conversion was then calculated, based on Equation (3), as follows:
Butyric   acid   conversion   ( % ) = 100 ( ( B S ) ×   C   ×   V   × 88.11 ) 100 ×   m
  • S = volume of HCl used in titration (mL)
  • B = volume of HCl used in blank titration (mL)
  • C = concentration of HCl (mol/L)
  • V = volume of aqueous phase collected (mL)
  • m = mass of butyric acid feed
  • 88.11 is the mol. wt% of butyric acid (g/mol)

2.2.5. Analysis of Pt/C Catalyst and Solid Residue

The recovered solid residues (comprising of mostly the used Pt/C catalyst and any char product) were dried to a constant weight at 105 °C in a vacuum oven for 2 h and weighed. Characterisation of the fresh ‘as-received’ catalyst and the recovered and dried solid residues was carried out using X-ray Diffraction (XRD), performed on a Bruker D8 Advance diffractometer, as previously reported [17,21]. The crystallite size (τ) was calculated using the Scherrer equation [21].

2.2.6. Statistical Analysis

In the present study, response surface methodology (RSM) has been used to interrogate the experimental data for optimisation. RSM is a collection of statistical and mathematical techniques useful for developing, improving, and optimizing processes [22,23,24]. The most extensive applications of RSM are in the industrial world, particularly in situations where several input variables influence some performance measure or quality characteristics of the products or process [24,25]. The central composite design (CCD) tool in RSM is efficient to estimate polynomials and combine value for optimisation of the response.
CCD was applied to identify and optimise the effects of temperature and gaseous reaction atmospheres (nitrogen, hydrogen, and compressed air) on the yields and compositions of gas products from the decarboxylation of butyric acid. Two sets of models were tested—temperature-based models and another set based on coded factors—to determine the fit between experimental and the models within the temperature range of 200–350 °C. The least square multiple regression methodology was performed to investigate the relationship between the independent and dependent variables. The experimental design results were fitted by a second-order polynomial equation to correlate the response to the independent variable. Prediction of the optimal point was given by Equation (4), as follows:
Y = β k 0 + i = 1 4 β k i x i + i = 1 4 β k i i x i i 2 + i < j = 2 4 β k i j x i x j
where Y is the predicted response (LA);   β k 0 ,   β k i i ,   and   β k i j   represent regression coefficients; x i and x j are the coded independent factors.
The models were compared based on the coefficient of determination (R2), adjusted coefficient of determination (R2-adj), predicted coefficient of determination (R2-pred), root mean square error of prediction (RMSEP) (Equation (5)), and absolute average deviation (AAD) (Equation (6)). To confirm the model, RMSEP and AAD between the estimated and observed data must be as low as possible and R2 must be close to 1. After selecting the most accurate model, the analysis of variance (ANOVA) was used to interrogate the statistical significance of the regression coefficients by conducting Fisher’s F-test at 95% confidence level. The surface plots of accurate model are illustrated the interactive effects of the factors [25].
RMSEP = i = 1 N ( y e x p y p r e ) 2 N
AAD = { i = 1 N ( | y e x p y p r e | /   y e x p ) / N } × 100
where y e x p ,   y p r e , and N are the predicted data, observed data, and number of treatments, respectively.
The aim of the optimization was to maximize the propane gas with the same weight (w = 1) and the credibility of the optimum conditions was diagnosed through the desirability values of the responses which range from 0 to 1. The optimal condition becomes more credible and desirable when the values of desirability are closed to 1.

3. Results and Discussions
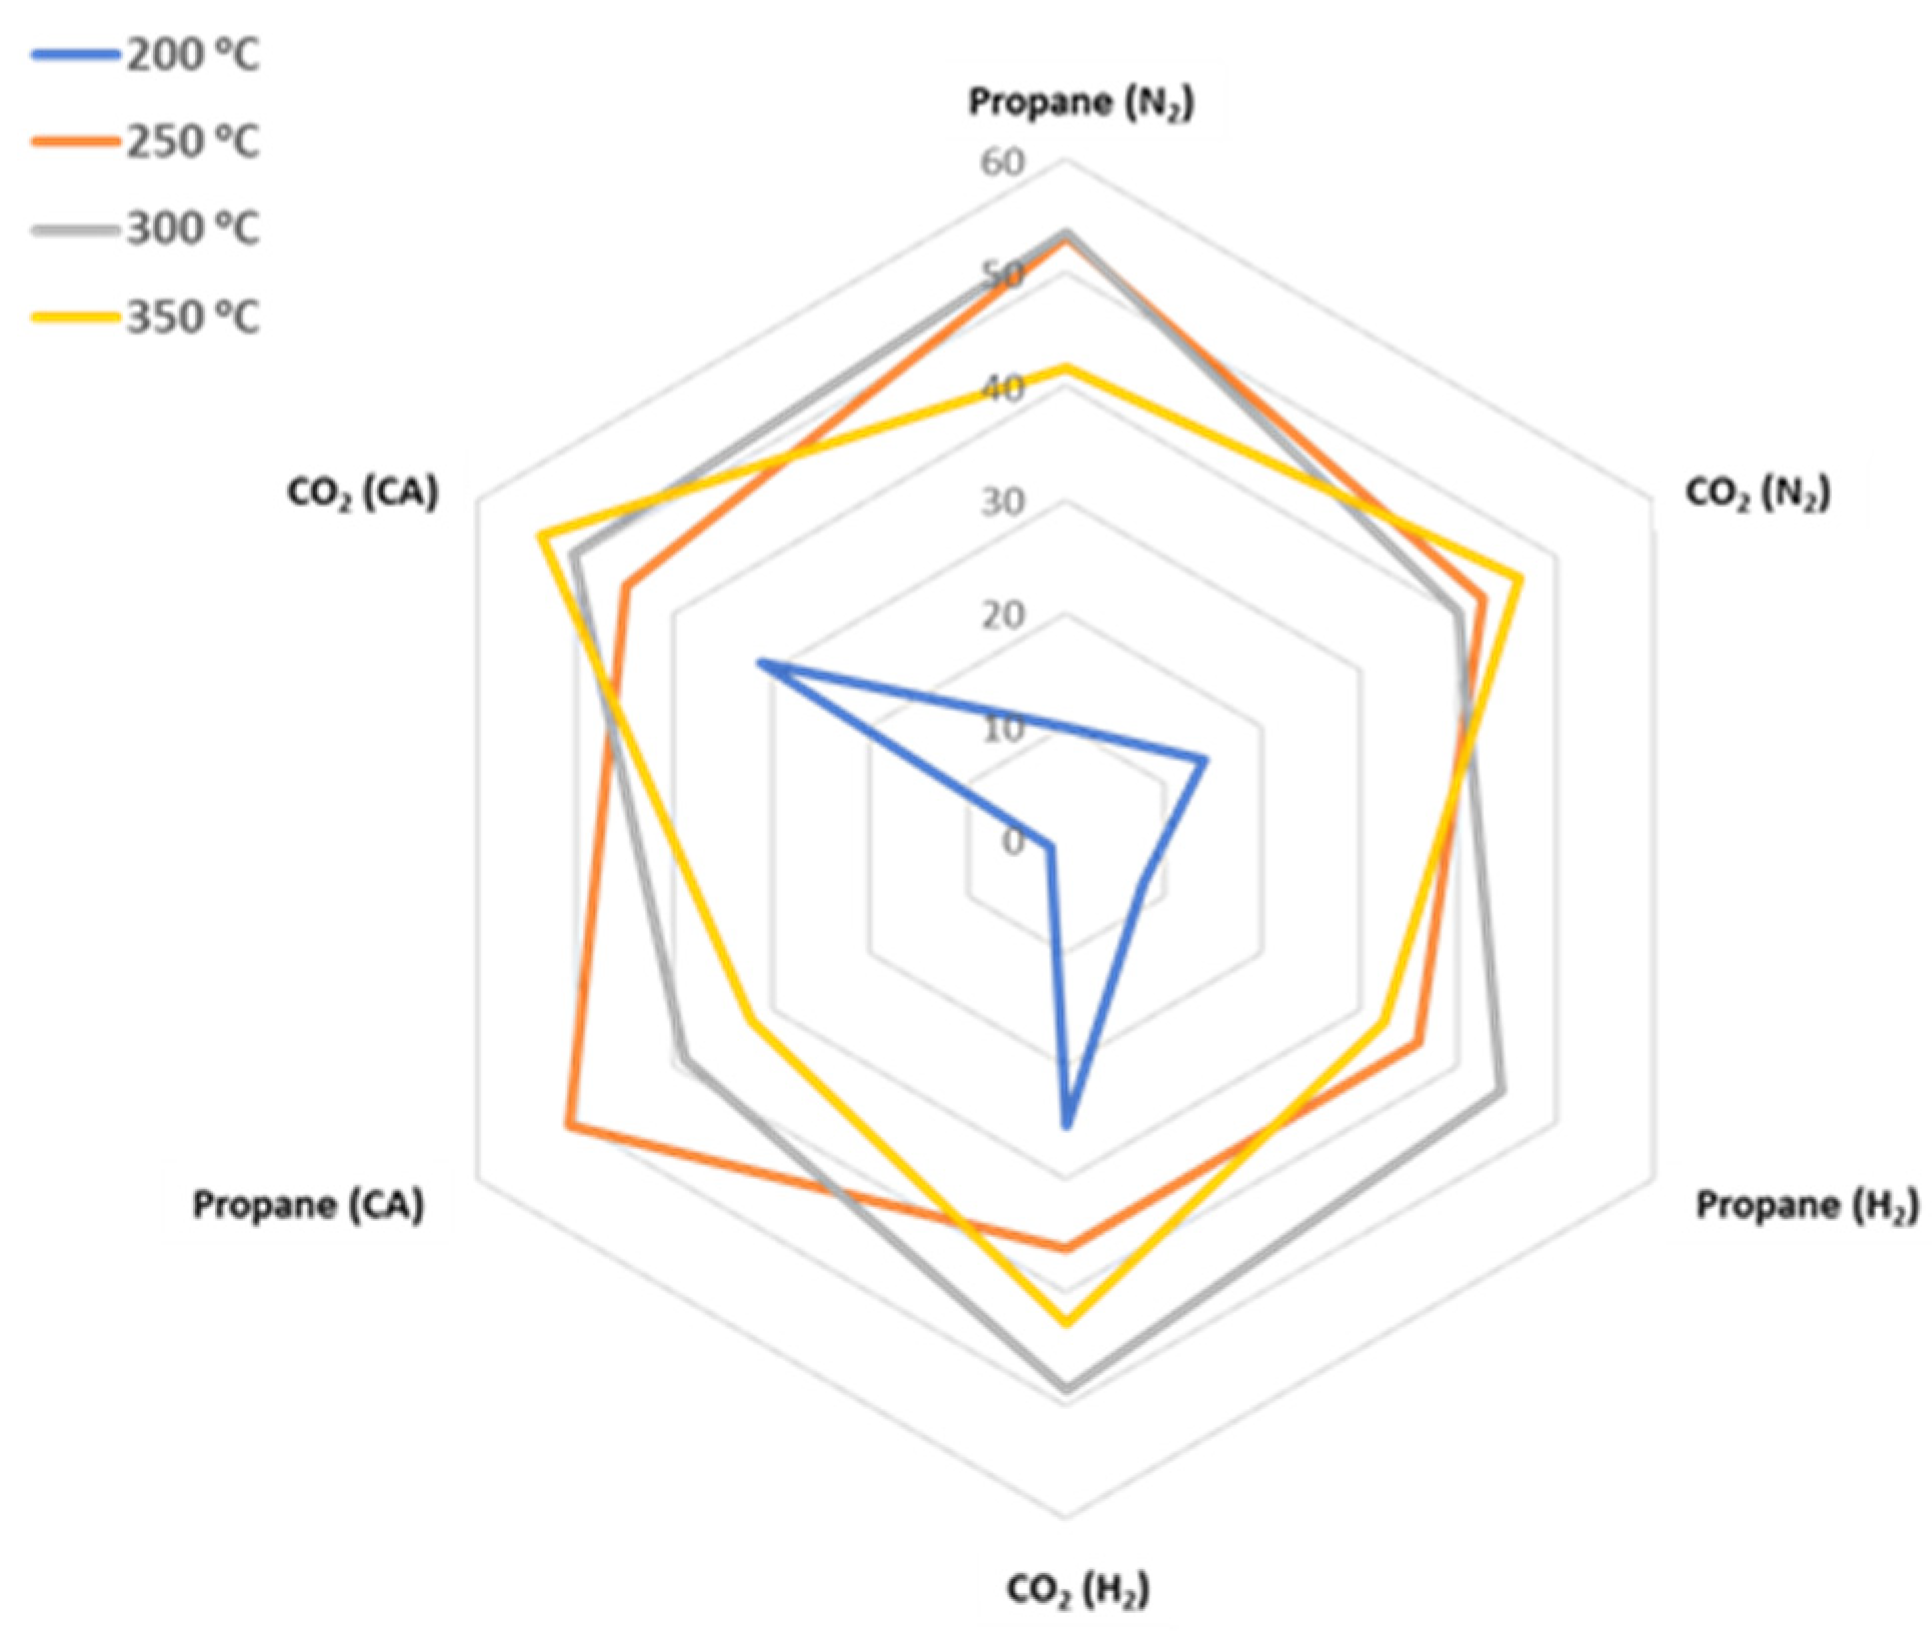
In the present study, experiments were carried out to investigate the yields of products from decarboxylation of butyric acid at varying temperatures from 200 °C to 350 °C. Each test involved a 1:1 ratio of butyric acid (1 g or 1.14 M butyric acid) and Pt/C (1 g = 50 mg of Pt) for 1 h at the set reaction temperature in either hydrogen, compressed air, or nitrogen.

3.1. Product Yields

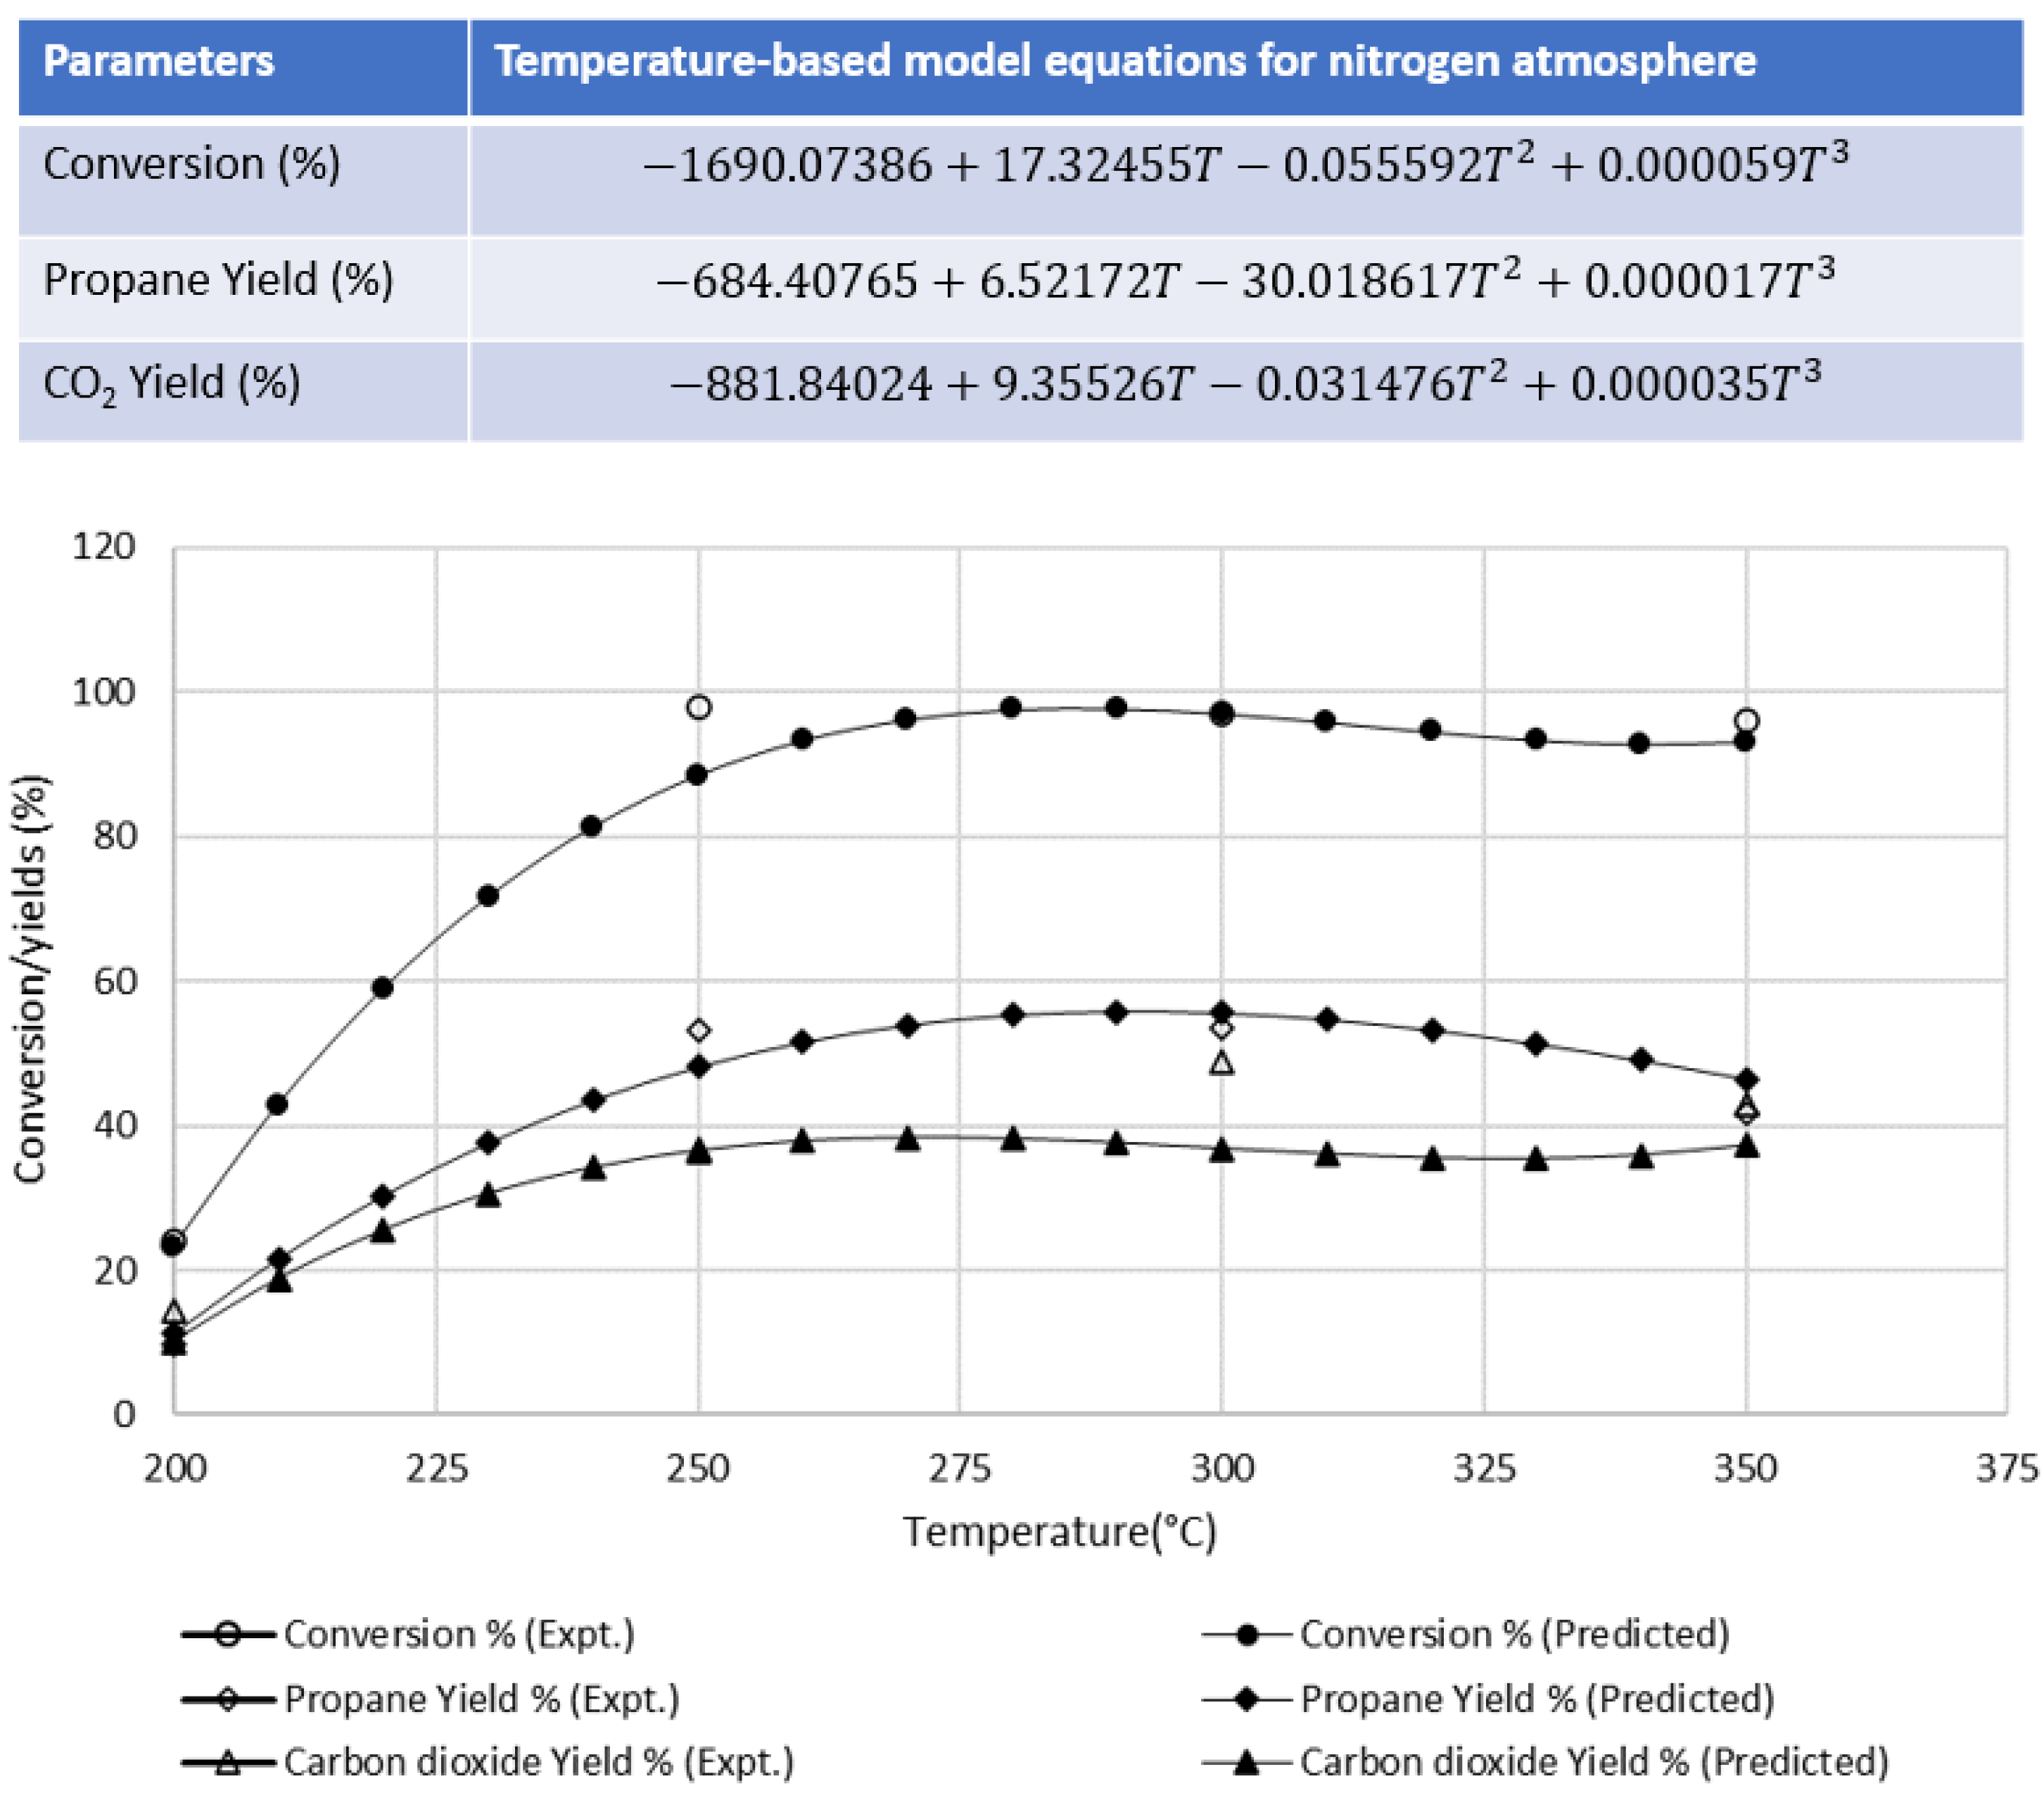
3.1.1. Effect of Nitrogen Atmosphere at Different Temperatures

Table 1 shows the percentage butyric acid conversion and the gas components (mainly propane and CO2), produced at the varying temperatures in a nitrogen atmosphere. The results show that the most butyric acid was converted by over 92% at 250 °C and above. The yield of propane from these tests was highest at 300 °C, confirming the results of an earlier study [17]. Increasing the temperature to 350 °C, resulted in the formation of significant amounts of other hydrocarbon gases such as methane (4.7%) and ethane (5.3%). Therefore, it can be concluded that temperatures above 300 °C, would lead to cracking of the main propane product to lower hydrocarbon gases. In addition, there was a small amount of hydrogen in the gas products from 250 °C and above. Hydrogen generation during Pt/C catalysed decarboxylation of carboxylic acids has been reported [26]. The in situ generated hydrogen has also been reported to be responsible for the formation of only alkanes due to direct hydrogenation of decarboxylation products [26].
The formation of hydrogen could be postulated to be from the reaction of aqueous-phase decarboxylation, which may involve initial decarbonylation of the butyric acid to form CO and propanol (Reaction Equation (R2)). The CO then undergoes water–gas shift reaction to produce hydrogen and CO2 (Reaction Equation (R3)). Thereafter, the formation of propane could occur via the hydrogenation of the propanol intermediate (Reaction Equation (R4)).
C3H7COOH ==> C3H7OH + CO
CO + H2O ==> CO2 + H2
C3H7OH + H2 ==> C3H8 + H2O
However, hydrogen yield nearly doubled between 300 °C and 350 °C, which could be due to a number of reactions, including the reforming of alkanes (Reaction Equation (R5)).
CxHy + 2xH2O ==> xCO2 + (y/2 + 2x)H2
Table 1 also shows the hydrocarbon selectivity towards propane was consistently above 90% when the reaction temperature was between 200 °C and 300 °C. However, at 350 °C, propane selectivity decreased to 80%, which corresponded to an increase in the yields of methane and ethane, suggesting the hydrogenolytic cracking of propane at the higher temperature.

3.1.2. Effect of Hydrogen Atmosphere at Different Temperatures

The use of hydrogen as the reaction atmosphere, in place of the nitrogen, was investigated with 5 bar hydrogen at the four reaction temperatures: 200 °C, 250 °C, 300 °C, and 350 °C. The compositions of gas product are shown in Table 2. Again, the conversion of butyric acid increased with temperature. The results show that the yield of propane was consistently lower than corresponding yields obtained under nitrogen atmosphere at the different temperatures. However, the reaction at 300 °C still produced the highest yield of propane of 44.4%. The yield of propane reduced by 27% at 350 °C compared with the value at 300 °C. In contrast, the yield of methane increased dramatically to 12.8% at 350 °C from 0.5% at 300 °C. The increased formation of methane may be due to the hydrogenolysis of propane. Considering the much lower yields of ethane, the hydrogenolysis of propane could be explained to be across both of its two C–C bonds, as shown in Reaction Equation (R6):
C3H8 + 2H2 ==> 3CH4
An alternative hydrogenolysis (R7) would yield roughly equimolar yields of ethane and methane, but Table 2 shows that methane molar yield was nearly 5 times more than that of ethane.
C3H8 + H2 ==> CH4 + C2H6
Sermon et al. [27] reported that at higher temperatures (≥317 °C), platinum-catalysed hydrogenolysis of propane proceeded via multiple C–C bond cleavage mechanism to yield methane as the dominant product. This supports the predominance of Reaction Equation (R6) over (R7) in this work.
However, the proportion of hydrogen increased with increasing temperature, showing a net production of hydrogen during the reactions above 250 °C. The 5 bar of hydrogen fed into the reactor at ambient temperature (≈20 °C), equating to about 0.0185 mol of hydrogen. The molar contents of hydrogen in the gas products were 0.0165 mol, 0.185 mol, 0.0215 mol, and 0.0285 mol as 200 °C, 250 °C, 300 °C, and 350 °C, respectively. Hence, these results agreed with the work of Fu et al. [26] to confirm the net production of hydrogen during Pt/C catalysed decarboxylation of butyric acid.
Propane hydrocarbon selectivities were ≥94% between 200 °C and 300 °C, but at 350 °C, this decreased dramatically to 64%, possibly due its increased hydrogenolytic cracking. It is important to note that the severity of the cracking of propane at 350 °C under hydrogen atmosphere was higher than that observed under nitrogen. Hence, further tests with different hydrogen pressures were carried out to verify the hydrogenolytic cracking pathway.

3.1.3. Effect of Hydrogen Pressure at 300 °C

The interesting results on the influence of hydrogen atmosphere on the conversion of butyric acid and yields of products, presented in Section 3.1.2. were followed up by varying the amount of hydrogen used. The tests were carried out at 300 °C, which gave the highest propane yield under hydrogen atmosphere. Table 3 shows the conversion of the butyric acid and gas yields from the three different reaction pressures: 2.5, 5.0, and 10.0 bar hydrogen. The table shows that there is little difference between the conversion of the butyric acid at the three different reaction pressures. However, while the yields of propane were similar for the reactions with 2.5 and 5.0 bar hydrogen, it increased by around 9–48.5% when 10.0 bar hydrogen was used. Indeed, initial results showed that the yield of propane was higher than the theoretical yield (50 wt%) expected from the decarboxylation of butyric acid. However, during gas analysis by GC, it was observed that the propane peak from this test had a small trailing shoulder unlike the others. Hence, the GC analysis was repeated using a smaller injection volume, which showed two distinct peaks. The other peak was identified to be that of formaldehyde after sampling the headspace of a Formalin bottle and injecting into the GC.
The formation of formaldehyde could be explained from the results in Table 3, which shows that the yields of propane and CO2 remained similar, as expected from decarboxylation of butyric acid under hydrogen pressures of 2.5 bar and 5 bar. However, with 10 bar hydrogen, the yield of CO2 decreased to 29.3%, which is nearly a reduction of 40% (compared with 5 bar hydrogen). In addition, a look at the amounts of hydrogen in the gas products, showed that the more hydrogen was obtained than was added to the reactor for the 2.5 bar (0.0093 mol) and 5 bar (0.0185 mol) tests. Under these conditions, 0.0155 mol and 0.0215 mol of hydrogen were found in the gas product, which agrees with hydrogen production during Pt/C-catalysed decarboxylation [26].
In contrast, with the use of 10 bar hydrogen, the amount of hydrogen in the gas product was 0.0365 mol compared with 0.0371 mol added to the reactor. These values are similar but slightly less hydrogen was obtained than was added. This may indicate more extensive use of hydrogen in the reaction under the 10 bar hydrogen atmosphere. It could therefore be argued that hydrogen-consuming reactions occurred, and a plausible explanation is the hydrogenation of CO to form formaldehyde according to the reaction in Equation (R8), as follows:
CO + H2 ==> CH2O
The liquid-phase hydrogenation of CO2 to produce formaldehyde in the presence of Pt-based catalysts has recently been reported to proceed the thermodynamically favoured CO route [28]. While other potential reactions may be possible, Reaction Equation (R7) can explain both the reduction in hydrogen and CO2 contents of the gas product obtained under 10 bar hydrogen pressure. The propane hydrocarbon selectivity from the test with 2.5 bar hydrogen pressure was 88.3%, whereas it increased to around 95% under 5 bar and 10 bar hydrogen pressures, respectively. The possible formation of formaldehyde from did not affect the yield of propane, indicating that its formation from CO intermediate was a plausible explanation.

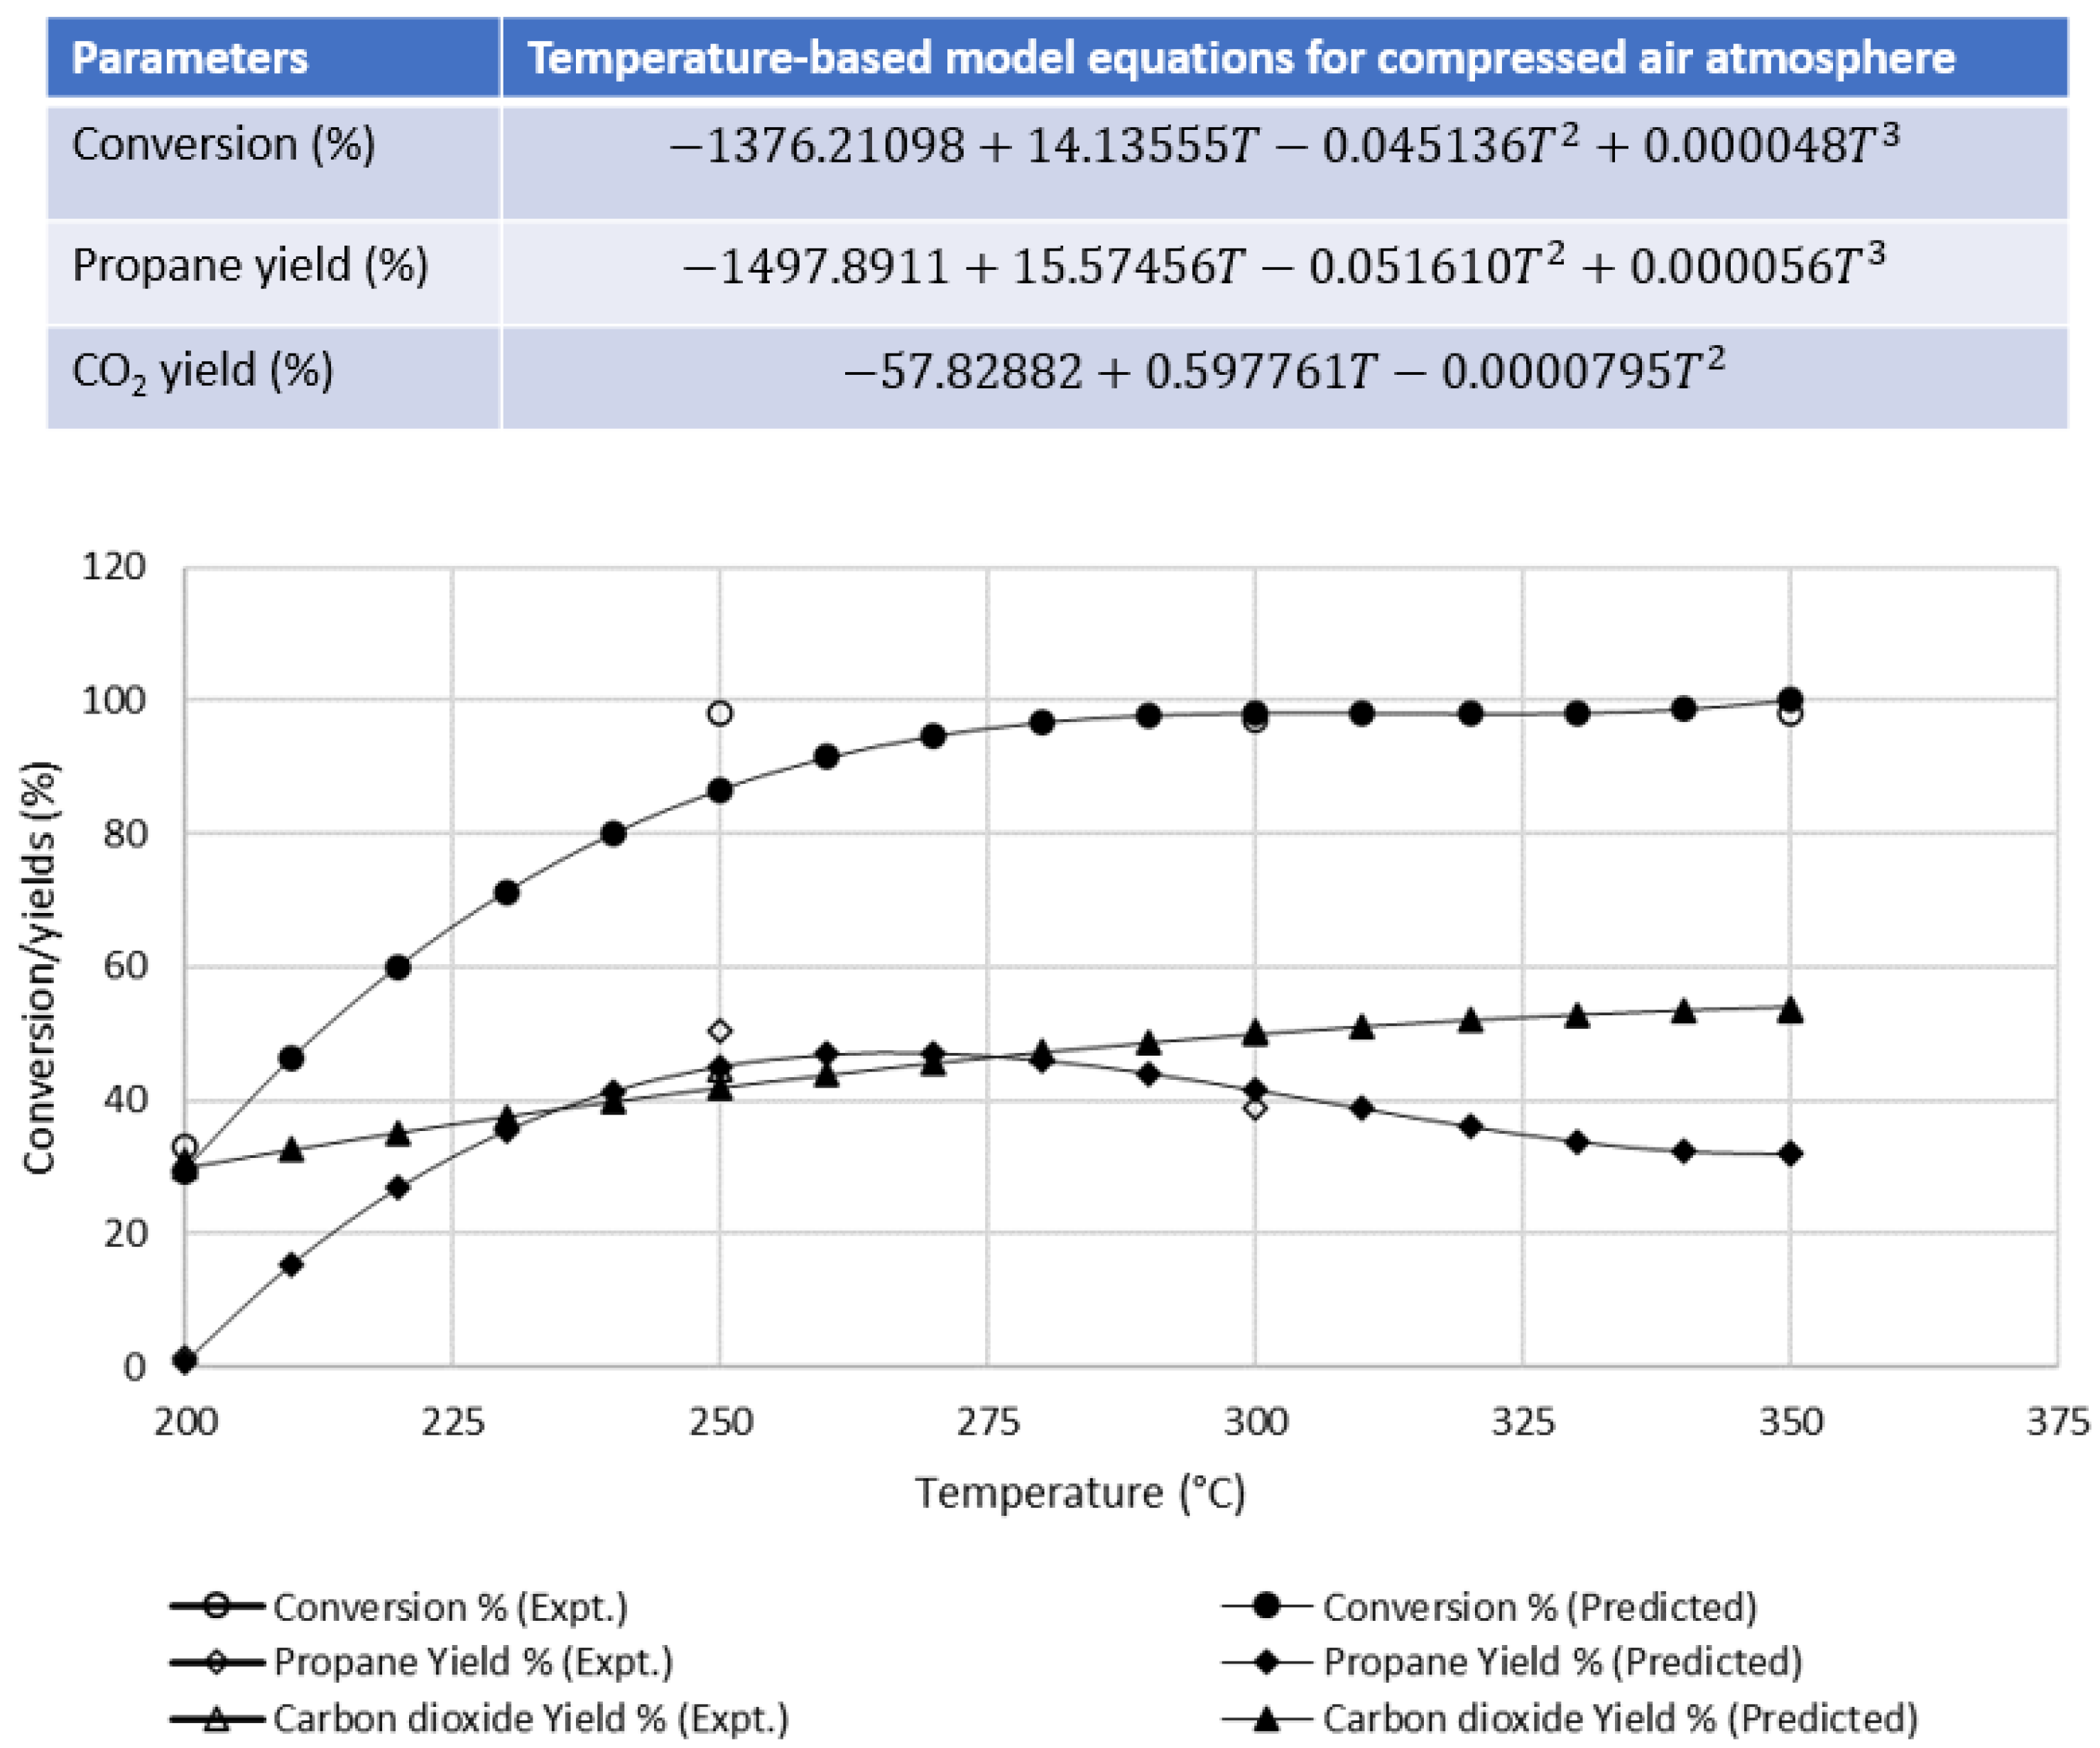
3.1.4. Effect of Compressed Air with Varying Temperature

The conversion of butyric acid and the main gas products produced from the reaction with 5 bar compressed air at different temperatures are shown in Table 4. The tests were carried out within the same temperature range of 200 °C to 350 °C. The reaction at 200 °C gave a low conversion of butyric acid; however, the reactions at the higher temperatures show almost all the butyric acid was converted, with little difference between the three temperatures.
Table 4 shows that the best condition for the targeted decarboxylation of butyric acid occurred at 250 °C, with similar yields of CO2 and propane. However, the yields of propane fell between 300 °C and 350 °C with the same amount of compressed air. Under these conditions, the yield of CO2 was much higher than that of propane even at 200 °C and increased beyond 50% for the first time in the present study. It is therefore clear that higher temperatures enhanced the complete oxidation of some of the butyric acid (e.g., Reaction Equation (R9)), intermediates, and organic compounds when compressed air is used.
C3H7COOH + 5O2 ==> 4CO2 + 4H2O

3.2. Statistical Analysis Results

To evaluate the contributions of the operating conditions of the bio-LPG production under the three reaction atmospheres nitrogen, hydrogen, and compressed air, the statistical analyses focused on the yields of propane and CO2. The operation segmentation showed that the different temperatures resulted in different yield of gases.

3.2.1. Optimisation of Reaction Conditions

The independent effect of reaction temperature on the decarboxylation of butyric acid and gas yields under the different reaction atmospheres was statistically analysed using RSM. The temperature-based model equations were used to predict the conversion of butyric acid and yields of propane and CO2 across the temperature range studied. Figure 2 shows a very good fit between the experimental results and appropriate models. Conversion of butyric acid generally increased with increasing temperature under the three reaction atmospheres. In contrast, the effect of increasing the temperature was more pronounced in the yield of propane compared with CO2. Figure 2 shows that total conversion of butyric acid and highest yield of propane (53.5%) under nitrogen atmosphere occurred at temperature range between 250 °C and 300 °C. In contrast, CO2 production initially increased rapidly between 200 °C and 250 °C before it slowed from 300 °C to 350 °C. This corroborates the hypothesis expressed in Reaction Equations (R2)–(R4), which indicates that the reaction may have evolved through initial decarbonylation and water gas shift steps before hydrogenation of the propanol intermediate to propane.
In comparison with the nitrogen reaction atmosphere, the use of hydrogen also initially generated more CO2 gas than propane at 200 °C in Figure 3. However, at a temperature of around 220 °C–230 °C, the yield of propane became consistently higher than that of CO2 but at similar values up to 300 °C. The lack of delay in evolution of propane under hydrogen atmosphere compared with what was observed with nitrogen, may indicate that the ab initio presence of hydrogen in the reactor promoted the last-stage hydrogenation of propanol to propane (Reaction Equations (R2)–(R4)). Then, the propane yield plummeted on reaching 350 °C, which corresponded to the largest methane yield due to high rates of hydrogenolytic cracking [28]. Figure 3 also shows that at 200 °C, more CO2 was produced from the converted butyric acid under hydrogen atmosphere compared with using nitrogen. Again, there was a good agreement between the experimental data and those predicted by the temperature-based model equations as shown in Figure 3.
Figure 4 shows that using compressed air atmosphere produced the highest yield of CO2 at 200 °C compared with using nitrogen (0%) or hydrogen (25.4%). This may indicate that the presence of oxygen promoted the catalytic decarbonylation of butyric acid. Although an alternative argument would be that complete oxidation of butyric acid and/or other organic intermediates occurred in the presence of oxygen according to Reaction Equation (R9), the composition of gas products at 250 °C disagreed with this latter pathway.
Interestingly, there was a dramatic increase in propane yield at 250 °C, reaching the expected theoretical yield of 50% from decarboxylation. It is therefore reasonable to infer that Reaction Equation (R8) only became dominant after 250 °C, which led to increased CO2 yields and decreased propane yields. Therefore, at higher temperatures, the use of compressed air favoured the conversion of butyric acid but resulted in over 50% CO2 yield. Indeed, the temperature-based model for CO2 predicts a linear increase in CO2 yield with increasing temperature, indicating the possible predominance of complete oxidation.
Pulling together all the reaction conditions and the yields of propane and CO2, the radar chart in Figure 5 was obtained. Figure 5 shows that when the temperature was 250 °C, most of butyric acid was converted in each case and the yields of propane and CO2 indicate the predominance of the ultimate decarboxylation pathway.
However, as shown in Figure 5, above 250 °C, results show that decarboxylation was still dominant under nitrogen up to 300 °C. Comparison between yields of propane and CO2 gases show that the highest yield of propane was obtained at temperature of 300 °C under nitrogen gas atmosphere, while the highest CO2 gas was generated at temperature of 350 °C under compressed air. Therefore, segmentation points revealed that the nitrogen gas was more appropriate to control propane production under the test conditions studied in the present work. At temperatures above 250 °C, compressed air led to increased CO2 production via over-oxidation, while hydrogen favoured hydrogenolysis of C–C bonds [28], leading to increased yields of lower alkane gases, especially methane.

3.2.2. Fitting the Surface Response Models

The initial comparison of statistical models indicated that the percentage butyric acid conversion and the yields of propane and CO2 are more desired with one-factor polynomial models up to a degree of 6 (Table 5). The models have been used to calculate the data for butyric acid conversion, the yield of propane, and the yield of CO2, based on the coded factors (X = −1, 0 and +1) using CCD. The coded factors −1 and +1 corresponded to the lowest (minimum) and highest (maximum) reaction conditions of temperature, respectively, under the different gas atmospheres. The values obtained from the models have been compared with the experimental values (in parenthesis). The central point (X = 0) was also calculated and compared with the optimum yields and their corresponding temperatures under the different gas atmospheres in Figure 2, Figure 3 and Figure 4. The data predicted by the models and the experimental data appear to be similar in most cases, as shown in Table 5. Interestingly, the data obtained at the central point (X = 0) in Table 5 are close to the optimum values from Figure 2, Figure 3 and Figure 4, which shows good fit between the models and experimental data.
Comparing all three gas atmospheres, the optimum parameters to produce the highest yield of propane from the 10 wt% butyric acid solution, from the range investigated, was a temperature point between 290 °C and 300 °C under nitrogen gas atmosphere.
The stepwise elimination of insignificant coefficients was carried out for the coded-factor models, based on each response at the different temperatures under nitrogen atmosphere (which gave the highest propane yield). This helped to reduce the model polynomial equations down to degree 3 (cubic function) for the statistical calculations of R2, R2-adjusted (R2-adj.), R2-predicted (R2-pred.), and standard deviation (Sdv.) from linear to cubic models presented in Table 6.
Therefore, the comparison of reaction atmospheres found that temperature had more influence on the yields of propane and CO2 during the hydrothermal conversion of butyric acid in all cases. The predicted values of yields of propane and CO2 were obtained by calculating the mathematical model close to actual value, and the correlation coefficients (R2) ≥ 0.9 for linear models, ≥97 for quadratic models, and ≥0.95 for cubic models, respectively. The R2-adjusted and R2-predicted values were also ≥0.9 for all responses. These values revealed that the suggested models reliably estimated the evaluation of temperature on the conversion and yields of products during butyric acid decarboxylation.
Furthermore, the significance of temperature was evaluated by analysis of variance (ANOVA) for the nitrogen gas atmosphere only (which gave the optimum yield of propane) in Table 7. In this type of analysis, the highly effective parameters are validated by a large F-value and a small p-value. Comparing model variance is usually tested by F-value regarding error variance, hence the p-value is associated with the probability of observed F-value, if the null hypothesis is true. The more significant model is expressed by the larger F-value, while the lower p-value tests the significance of the corresponding coefficient. The statistical significance of the response surface quadratic model implies that the F-value and p-value for CO2 and propane are 105 and 0.0001, respectively, which support a good fit with the experimental values. The F-value and p-value for conversion of 81.63 and 0.0001, respectively, also support this conclusion.
Similar statistical analysis and ANOVA of the models were carried out for experiments under hydrogen and compressed air atmospheres. These can be found in the Supplementary data (Tables S1–S4), with evidence of good fit between experimental data and the models. Further improvements to these models can be made by increasing the number of experimental data points within a narrower range of reaction conditions, where the desired conversions and yields have been obtained under the different reaction gas atmospheres in the present work.

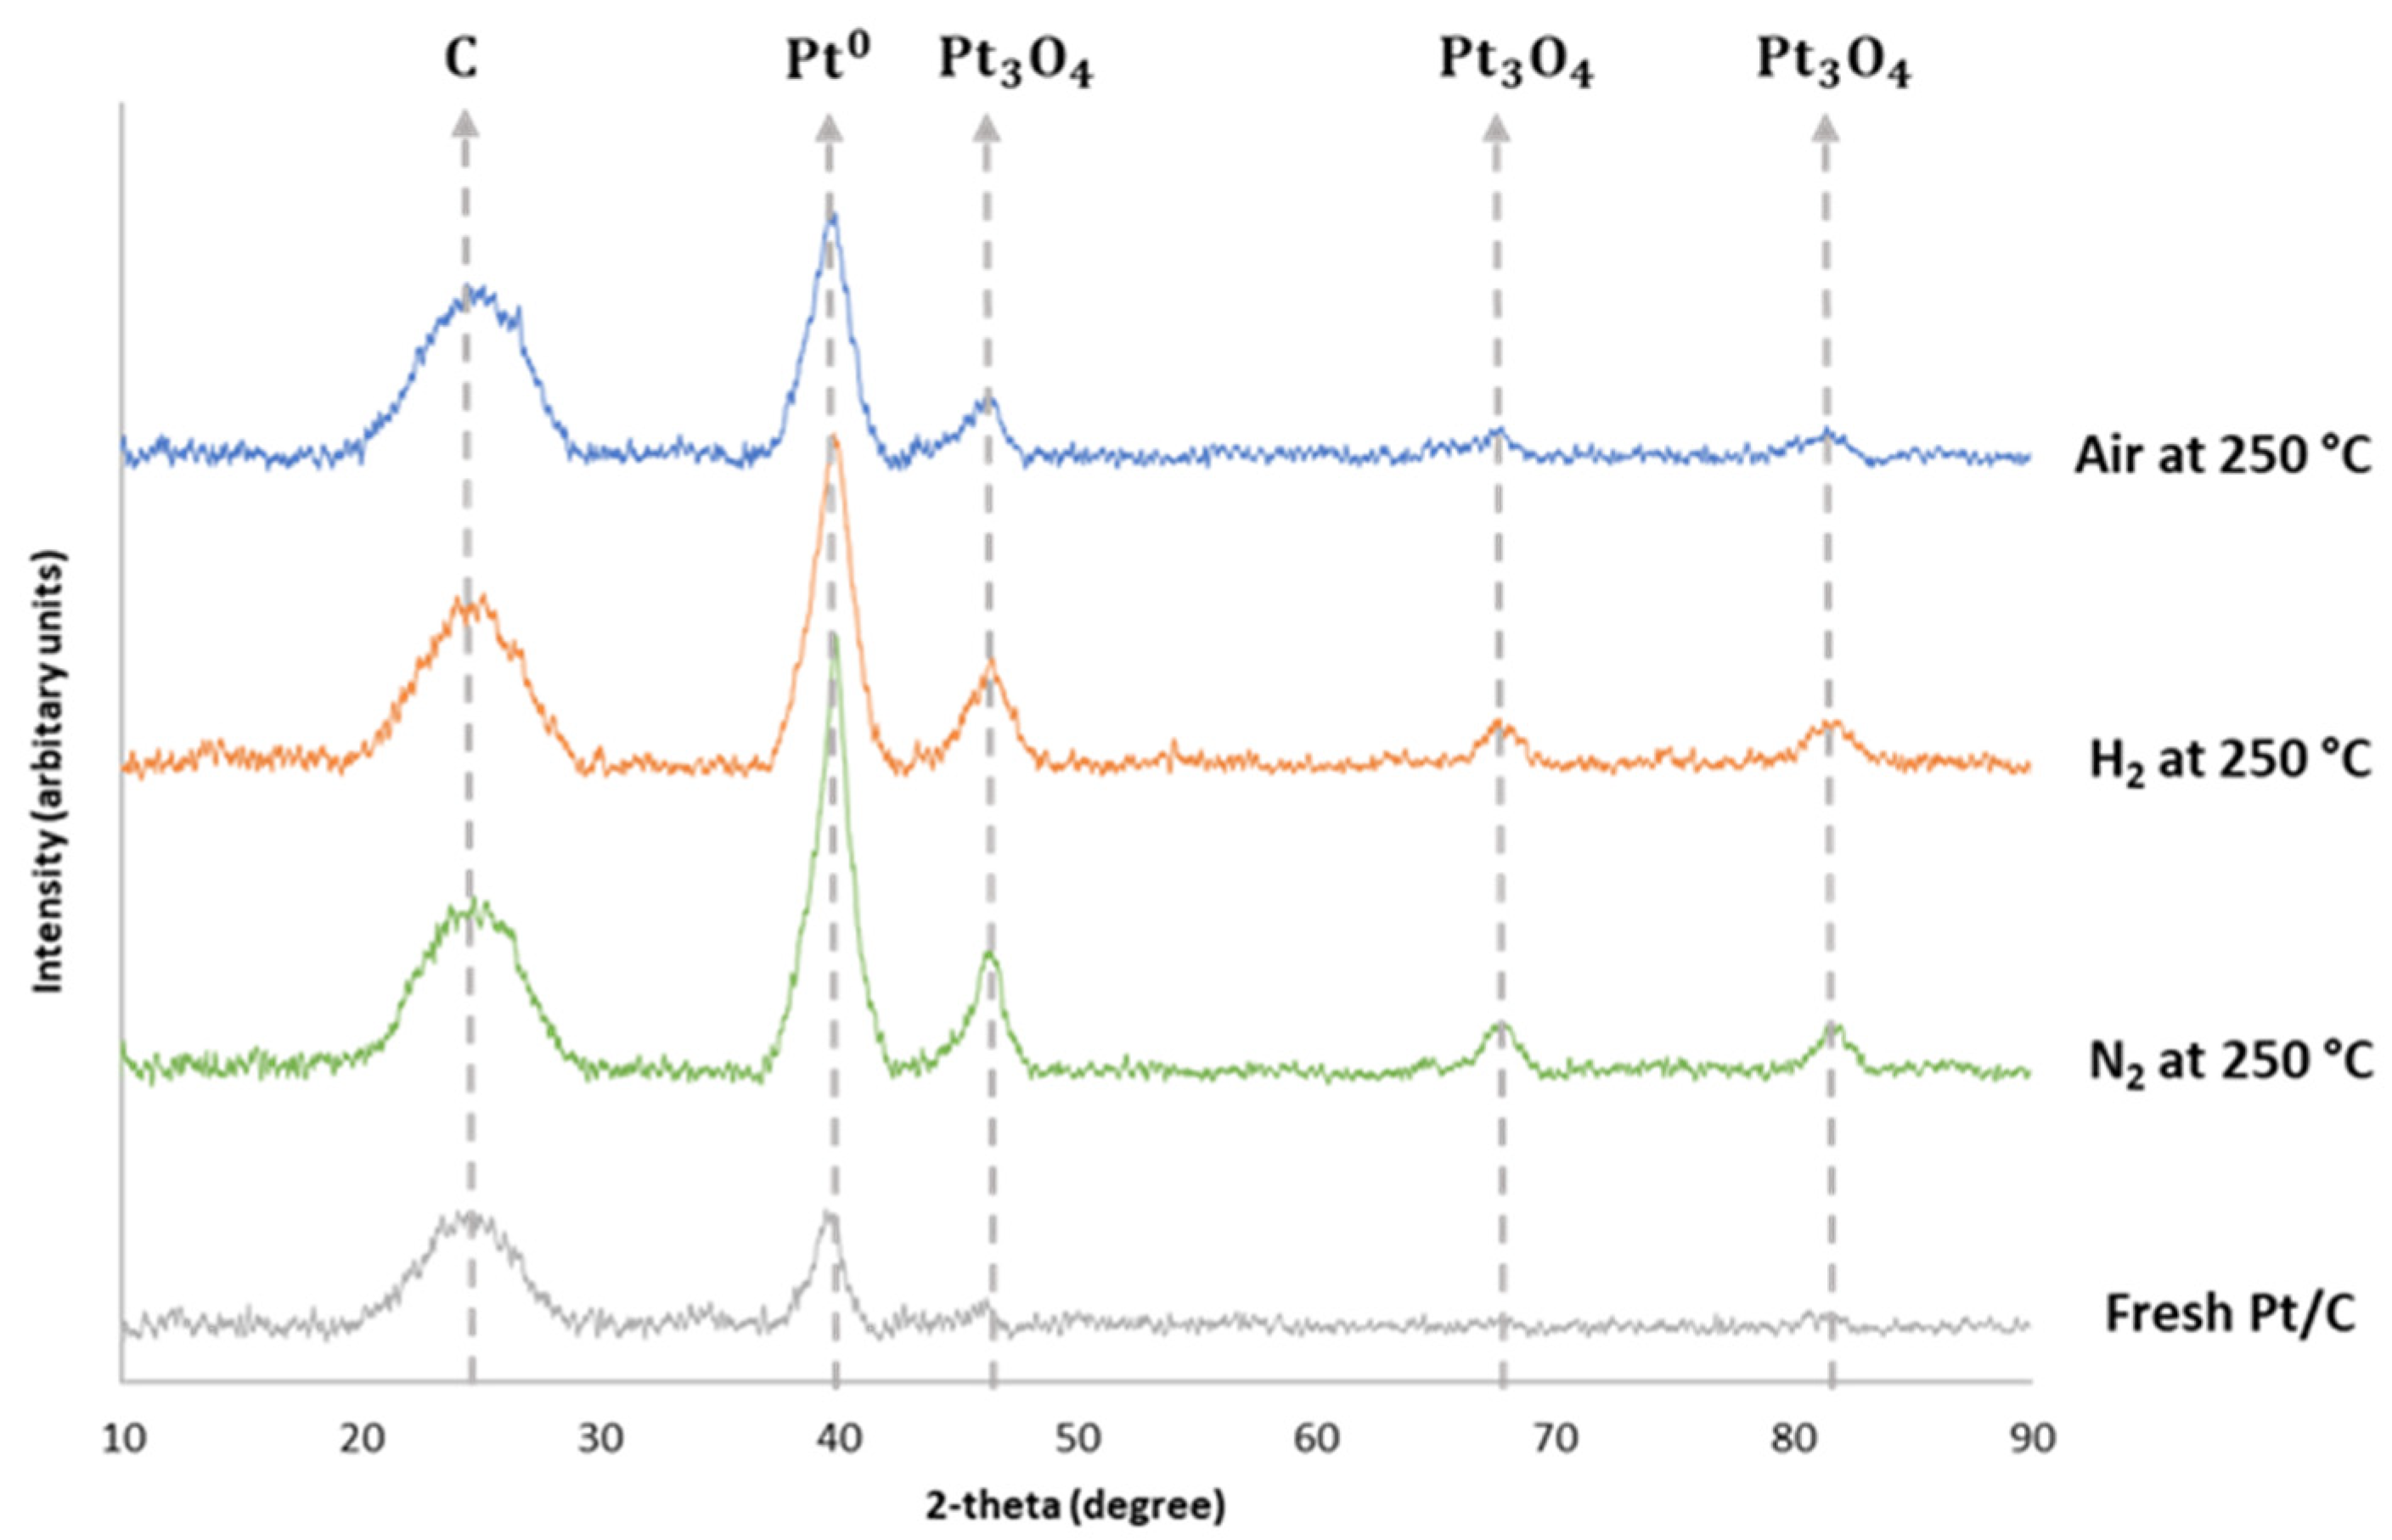
3.3. Catalyst and Solid Residue Characterisation by XRD

Figure 6 shows the results of characterisation of the fresh Pt/C catalyst and solid residues (containing mostly used Pt/C catalyst) by XRD. In Figure 6, only the solid residues from the reactions that gave the highest propane yields under the different reaction atmospheres have been shown. The carbon and platinum peaks are shown at 2θ = 26.6° and 39.6°, respectively. The platinum peaks from the catalyst recovered from the reactions gave higher intensities than the fresh Pt/C catalyst. The catalyst recovered from the reaction with nitrogen at 350 °C showed the highest intensity of platinum. The carbon peak seemed to show little difference between the fresh and recovered catalysts. In addition to the platinum and carbon peaks, other prominent peaks at 2θ = 47°, 67°, and 81° could be seen in the diffractograms of the used catalysts, which corresponded to the Pt3O4 phase in the ICDD database. The changes observed in the diffractograms in Figure 6 have been reported to be due to the collapse of the pore structure in the carbon support [11]. Hence, the increased intensity of the platinum peaks could therefore be attributed to the exposure of Pt metals following the impact of the hot-pressurised water medium on the catalyst support. However, previous work showed that the catalyst actually became more active and maintained high activity after four experimental cycles [17].
In addition, the presence of Pt3O4 was hardly noticeable for the fresh catalyst compared to the used ones, indicating the possible oxidation of the Pt metal by the hot pressurised water medium used in all reactions. From the XRD characterisation, the Scherrer equation gave a platinum crystallite size of 49.1 nm for the Pt/C fresh catalyst, while for the used catalysts, the platinum crystallite sizes were 58.8 nm under nitrogen, 55.3 nm under hydrogen, and 43.4 nm under compressed air.
The increase in the crystallite sizes could be attributed to the formation of Pt3O4 on the catalyst’s surface, as shown in Figure 6. Interestingly, the used catalyst recovered from the test under compressed air gave the lowest intensities for Pt3O4, as well as the closest Pt metal crystallite size to the fresh catalyst. This may suggest that the reaction atmospheres may not have significant effects on the changes observed on the used catalysts at 250 °C, compared to the impact of the hydrothermal media.

4. Conclusions

The influence of reaction atmospheres (nitrogen, hydrogen, or compressed air) on the Pt/C catalysed conversion of butyric acid to propane has been studied in a 100 mL batch reactor. Results indicate that the decarboxylation pathway may include an initial decarbonylation step to produce CO, which generates hydrogen gas for in situ hydrogenation of a possible propanol intermediate to produce propane. Butyric acid conversion and the yields of propane and CO2 increased with temperature under all three reaction atmospheres. Data obtained from the experiments were used to optimise the reaction conditions based on RSM and CCD, which produced good fit between the models and experimental data. The segmentation of points revealed that the nitrogen atmosphere was the most appropriate to control propane production under the temperature range studied. It also revealed that the highest yields of propane (≥50%) were obtained between 250 °C and 300 °C under nitrogen, and at 250 °C under the compressed air test conditions studied in the present work. Hence, the inert gas atmosphere provided by nitrogen prevented further secondary reactions once propane and CO2 were produced via the main decarboxylation of butyric acid within the optimal conversion temperature range between 250 °C and 300 °C. At temperatures above 250 °C, compressed air led to increased CO2 production via over-oxidation while hydrogen favoured hydrogenolysis of C–C bonds, leading to increased yields of lower alkane gases, especially methane. Future kinetic studies will be carried out to generate design data for the design a laboratory-scale test rig for continuous operation. In future, we plan to use of a flow/continuous system that would enable rapid sampling, quenching, and real-time analysis of reaction products to confirm the presence of the reaction intermediates being hypothesized in the present work, by a range of instrumental techniques (e.g., HPLC and gas analysers).

Supplementary Materials

The following are available online at https://www.mdpi.com/article/10.3390/en15010268/s1.

Author Contributions

J.A.O. contributed to conceptualisation, funding acquisition, methodology design, supervision, project administration, visualisation, and paper writing (drafting, review, and editing). I.R. carried out the initial laboratory investigation, validation, and the presentation of the experimental data. K.E.S. contributed to project administration, methodology design, validation, and paper writing (review and editing). All authors have read and agreed to the published version of the manuscript.

Funding

The authors thank Aston University Research England Global Challenges Research Fund (GCRF) Block Grant 20/21 Allocation for funding this research. Additional fundings from SHV Energy, the Netherlands (for I. Razaq). EPSRC, BBSRC, and UK Supergen Bioenergy Hub (EP/S000771/1) are also gratefully acknowledged.

Institutional Review Board Statement

Not applicable.

Informed Consent Statement

Not applicable.

Data Availability Statement

All data files generated in Aston will be stored in academics’ secure home folder (H:\drive) and backed up to the Aston University Central Backup system each night. The backups are kept on tape for a period of up to 2 months. Active research data will be stored in Aston’s recommended unlimited data Box https://aston.account.box.com/login, which is GDPR compliant https://www.box.com/en-gb/gdpr.

Acknowledgments

Authors gratefully acknowledge the technical help of J. Cherukkattu-Manayil during XRD and physisorption analysis, and P. Ghorbannezhad for help with statistical analysis.

Conflicts of Interest

Keith Simons, a co-author of the paper, works for SHV Energy (project co-funder) and was involved in design of study and the decision to publish the results.

References

  1. UK Committee on Climate Change. Net Zero. The UK’s Contribution to Stopping Global Warming. 2019. Available online: https://www.theccc.org.uk/wp-content/uploads/2019/05/Net-Zero-The-UKscontribution-to-stopping-global-warming.pdf (accessed on 1 October 2021).
  2. WLPGA. The Role of LPG and bioLPG in Europe. 2019. Available online: https://www.wlpga.org/wpcontent/uploads/2019/09/The-Role-of-LPG-Bio-LPG-in-Europe-The-2019-Report.pdf (accessed on 2 October 2021).
  3. Liquid Gas UK. A Practical Approach—Analysis of Off-Grid Heat Decarbonisation Pathways. 2019. Available online: https://www.liquidgasuk.org/uploads/DOC5DA5B347CF3A7.pdf (accessed on 2 October 2021).
  4. NNFCC. A Business Case for an Indigenous BioLPG Supply Chain in the UK. Prepared for Liquid Gas UK. 2020. Available online: https://www.liquidgasuk.org/uploads/DOC5FC77254A1388.pdf (accessed on 10 October 2021).
  5. NNFCC. Biopropane: Feedstocks, Feasibility and Our Future Pathway. Prepared for Liquid Gas UK. 2019. Available online: https://www.liquidgasuk.org/uploads/DOC5DA5B52BBA49F.pdf (accessed on 5 August 2021).
  6. Johnson, E. A carbon footprint of HVO biopropane. Biofuels. Bioprod. Bioref. 2017, 11, 887–896. [Google Scholar] [CrossRef] [Green Version]
  7. Immer, J.G.; Lamb, H.H. Fed-batch catalytic deoxygenation of free fatty acids. Energy Fuels 2010, 24, 5291–5299. [Google Scholar] [CrossRef]
  8. Fu, J.; Lu, X.; Savage, P.E. Hydrothermal decarboxylation and hydrogenation of fatty acids over Pt/C. ChemSusChem 2011, 4, 481–486. [Google Scholar] [CrossRef] [PubMed] [Green Version]
  9. Hossain, M.Z.; Chowdhury, M.B.I.; Jhawar, A.K.; Xu, W.Z.; Charpentier, P.A. Continuous low-pressure decarboxylation of fatty acids to fuel-range hydrocarbons with in situ hydrogen production. Fuel 2018, 212, 470–478. [Google Scholar] [CrossRef]
  10. Deng, F.; Huang, J.; Ember, E.E.; Achterhold, K.; Dierolf, M.; Jentys, A.; Liu, Y.; Pfeiffer, F.; Lercher, J.A. On the mechanism of catalytic decarboxylation of carboxylic acids on carbon-supported palladium hydride. ACS Catal. 2021, 11, 14625–14634. [Google Scholar] [CrossRef]
  11. Yeh, T.; Linic, S.; Savage, P.E. Deactivation of Pt catalysts during hydrothermal decarboxylation of butyric acid. ACS Sustain. Chem. Eng. 2014, 2, 2399–2406. [Google Scholar] [CrossRef]
  12. Lu, M.; Lepore, A.W.; Choi, J.; Li, Z.; Wu, Z.; Polo-Garzon, F.; Hu, M.Z. Acetic acid/propionic acid conversion on metal doped molybdenum carbide catalyst beads for catalytic hot gas filtration. Catalysts 2018, 8, 643. [Google Scholar] [CrossRef] [Green Version]
  13. Lopez-Ruiz, J.A.; Davis, R.J. Decarbonylation of heptanoic acid over carbon-supported platinum nanoparticles. Green Chem. 2014, 16, 683–694. [Google Scholar] [CrossRef]
  14. Clark, J.M.; Pilath, H.M.; Mittal, A.; Michener, W.E.; Robichaud, D.J.; Johnson, D.K. Direct production of propene from the thermolysis of poly(β-hydroxybutyrate) (PHB). An experimental and DFT investigation. J. Phys. Chem. A 2016, 120, 332–345. [Google Scholar] [CrossRef]
  15. Yeh, T.M.; Hockstad, R.L.; Linic, S.; Savage, P.E. Hydrothermal decarboxylation of unsaturated fatty acids over PtSnx/C catalysts. Fuel 2015, 156, 219–224. [Google Scholar] [CrossRef]
  16. Goshima, T.; Isoda, Y.; Sakaguchi, M.; Fukudome, K.; Mizuta, K.; Nii, S. Feasibility of zeolites in converting butyric acid into propylene for biorefineries. Energy Sources Part A Recovery Util. Environ. Eff. 2018, 40, 306–311. [Google Scholar] [CrossRef]
  17. Razaq, I.; Simons, K.E.; Onwudili, J.A. Parametric study of Pt/C-catalysed hydrothermal decarboxylation of butyric acid as a potential route for biopropane production. Energies 2021, 14, 3316. [Google Scholar] [CrossRef]
  18. National Renewable Energy Laboratory, USA. NREL Process for Renewable Butyric Acid Good for Environment, Cheaper Biofuels. 2021. Available online: https://www.nrel.gov/news/program/2021/nrel-process-for-renewable-butyric-acid-good-for-environment-cheaper-biofuels.html (accessed on 25 October 2021).
  19. Salvachu, D.; Saboe, P.O.; Nelson, R.S.; Singer, C.; McNamara, I.; del Cerro, C.; Chou, Y.-C.; Mohagheghi, A.; Peterson, D.J.; Haugen, S.; et al. Process intensification for the biological production of the fuel precursor butyric acid from biomass. Cell Rep. Phys. Sci. 2021, 2, 100587–100606. [Google Scholar] [CrossRef]
  20. European Commission Regulation. European Commission Regulation 2568/91 on the characteristics of olive oil and olive residue oil and on the relevant methods of analysis, and subsequent amendments. Off. J. Eur. Community 1991, L248, 1–102. [Google Scholar]
  21. Taylor, M.J.; Beaumont, S.K.; Islam, M.J.; Tsatsos, S.; Parlett, C.A.M.; Issacs, M.A.; Kyriakou, G. Atom efficient PtCu bimetallic catalysts and ultra-dilute alloys for the selective hydrogenation of furfural. Appl. Catal. B Environ. 2021, 284, 19737. [Google Scholar] [CrossRef]
  22. Sampaio, F.C.; De Faveri, D.; Mantovani, H.C.; Passos, F.M.L.M.; Perego, P.; Converti, A. Use of response surface methodology for optimization of xylitol production by the new yeast strain Debaryomyces hansenii UFV-170. J. Food Eng. 2006, 76, 376–386. [Google Scholar] [CrossRef]
  23. Wang, H.; Cui, X.; Wang, R.; Li, C. Response surface optimization of the operating parameters for a complex distillation column based on process simulation. Energy Procedia 2012, 16, 571–578. [Google Scholar] [CrossRef] [Green Version]
  24. Asadi, N.; Zilouei, H. Optimization of organosolv pretreatment of rice straw for enhanced biohydrogen production using Enterobacter aerogenes. Bioresour. Technol. 2017, 227, 335–344. [Google Scholar] [CrossRef]
  25. Ghorbannezhad, P.; Park, S.; Onwudili, J.A. Co-pyrolysis of biomass and plastic waste over zeolite- and sodium-based catalysts for enhanced yields of hydrocarbon products. Waste Manag. 2020, 102, 909–918. [Google Scholar] [CrossRef]
  26. Fu, J.; Lu, X.; Savage, P.E. Catalytic hydrothermal deoxygenation of palmitic acid. Energy Environ Sci. 2010, 3, 311–317. [Google Scholar] [CrossRef]
  27. Sermon, P.A.; Keryou, K.M.; Ahmed, F. Products and intermediates in propane hydrogenolysis on supported Pt. Phys. Chem. Chem. Phys. 2000, 2, 5723–5729. [Google Scholar] [CrossRef]
  28. Chan, F.L.; Altinkaya, G.; Fung, N.; Tanksale, A. Low temperature hydrogenation of carbon dioxide into formaldehyde in liquid media. Catal. Today 2018, 309, 242–247. [Google Scholar] [CrossRef]
Figure 1. Schematic of experimental procedure used in this work.
Energies 15 00268 g001
Figure 2. Comparisons between experimental and temperature-based model equations on butyric acid conversion and yields of propane and CO2 under initial nitrogen pressure of 5 bar.
Energies 15 00268 g002
Figure 3. Comparisons between experimental and temperature-based model equations on butyric acid conversion and yields of propane and CO2 under initial pressure of 5 bar hydrogen.
Energies 15 00268 g003
Figure 4. Comparisons between experimental and temperature-based model equations on butyric acid conversion and yields of propane and CO2 under initial compressed air pressure of 5 bar.
Energies 15 00268 g004
Figure 5. Radar chart plot for gas products from butyric acid conversion at different temperatures and reaction atmospheres (CA—compressed air).
Energies 15 00268 g005
Figure 6. XRD of the fresh catalyst and used catalyst from the reactions with the highest propane yields under the three different reaction atmospheres.
Energies 15 00268 g006
Table 1. Butyric acid conversion and product yields under nitrogen atmosphere at different temperatures.
Wt %Temperature (°C)
200250300350
Conversion24989796
Hydrogen-0.30.71.3
Methane-0.21.04.7
Ethane0.51.73.65.3
Propane9.853.253.541.6
Butane-0.10.10.1
CO214.541.543.146.1
* Propane selectivity94969280
* Based on total yields on hydrocarbon gases only.
Table 2. Butyric acid conversion and product yields under hydrogen atmosphere at different temperatures.
Wt %Temperature (°C)
200250300350
Conversion377710099
Hydrogen3.33.74.35.7
Methane0.00.10.512.8
Ethane0.40.71.95.0
Propane7.836.044.432.3
Butane0.10.40.10.1
CO225.436.248.742.8
* Propane selectivity94979464
* Based on total yields on hydrocarbon gases only.
Table 3. Butyric acid conversion and gas yields at 300 °C under different hydrogen pressures.
Wt %Pressure (bar)
2.55.010.0
Conversion96100100
Hydrogen3.14.37.3
Methane2.50.50.4
Ethane3.51.92.1
Propane45.844.448.5
Formaldehyde--12
Butane0.10.10.1
CO240.648.729.3
* Propane Selectivity88.394.795
* Based on total yields on hydrocarbon gases only.
Table 4. Butyric acid conversion and product yields under compressed air atmosphere at different temperatures.
Wt %Temperature (°C)
200250300350
Conversion33989798
Hydrogen0.00.00.41.5
Methane0.20.44.67.4
Ethane0.42.94.73.2
Propane1.550.638.932.0
Butane0.00.10.10.1
CO231.044.850.353.6
* Propane selectivity60947974
* Based on total yields on hydrocarbon gases only.
Table 5. Comparison of predicted and experimental data on butyric acid conversion and yields of propane and CO2 using coded factors X (−1, 0 and +1). Experimental data in parenthesis—().
ParametersModel Equations Based on Coded Factors under Nitrogen AtmosphereMinimum (X = −1)Central Point (X = 0)Maximum (X = +1)Optimum
Temperature (°C)
Conversion (%) + 98.22 + 11.05 X 38.65 X 2 + 24.91 X 3 23.6
(24.0)
98.2
(97.0)
95.5
(96.0)
300
(290)
Propane Yield (%) + 50.84 + 10.15 X 1.37 X 2 0.4529 X 3 60.52 X 4 + 5.68 X 5 + 36.24 X 6 9.81
(10.2)
50.8
(53.5)
40.6
(41.6)
CO2 Yield (%) + 42.82 2.44 X 13.64 X 2 + 14.86 X 3 16.7
(14.5)
42.8
(43.1)
41.6
(46.1)
ParametersModel Equations Based on Coded Factors under Hydrogen AtmosphereMinimum (X = −1)Central Point (X = 0)Maximum (X = +1)Optimum Temperature (°C)
Conversion (%) + 87.61 + 48.00 X 42.01 X 2 17.011 X 3 + 22.57 X 4 37.2
(37.1)
87.6
(100)
99.2
(99.0)
320
(300)
Propane Yield (%) + 38.76 + 19.59 X 18.93 X 2 7.37 X 3 7.61
(7.80)
38.8
(36.0)
32.1
(32.0)
CO2 Yield (%) + 44.42 16.94 X 10.55 X 2 18.17 X 3 25.1
(25.4)
44.4
(48.7)
42.6
(42.8)
ParametersModel Equations Based on Based Coded Factors under Compressed Air AtmosphereMinimum (X = −1)Central Point (X = 0)Maximum (X = +1)Optimum
Temperature (°C)
Conversion (%) + 97.28 + 13.3 X 32.01 X 2 + 20.17 X 3 31.8
(33.0)
98.0
(97.0)
98.7
(98.0)
270
(250)
Propane Yield (%) + 45.97 8.56 X 30.60 X 2 + 23.61 X 3 0.32
(1.50)
46.0
(50.6)
30.4
(32.0)
CO2 Yield (%) + 46.43 + 12.04 X 4.47 X 2 29.9
(31.0)
46.4
(44.8)
54.0
(53.6)
Table 6. Statistical analysis of models for butyric acid conversion and yields of propane and CO2 under nitrogen gas atmosphere.
ModelsStatisticsResponse
ConversionPropaneCO2
LinearR20.680.280.81
R2-adj.0.650.220.79
R2-pred.0.560.10.74
Sdv.15.8144.01
Linear SquareR20.930.90.95
R2-adj.0.940.880.94
R2-pred.0.920.850.93
Sdv.6.45.42.06
Full quadraticR20.970.980.98
R2-adj.0.960.970.97
R2-pred.0.930.940.94
Sdv.5.12.61.5
CubicR20.950.960.95
R2-adj.0.930.950.94
R2-pred.0.90.930.91
Sdv.6.73.22.2
Table 7. ANOVA results for the models for butyric acid conversion and yields of propane and CO2 under nitrogen gas atmosphere.
ResponseFactorsDFMean of SquareF-Valuep-Value
ConversionModel42124.981.630.0001
A1434.616.70.0035
A21563.521.650.0016
A314.70.180.68
A412037.800.02
Residual826.03--
Lack of fit369.413013.30.0001
Pure error50.005--
Total12---
PropaneModel4749.751050.0001
A115.162.140.18
A21218.130.850.0001
A31200.928.40.0007
A4136.95.20.05
Residual87.57--
Lack of fit38.41.30.36
Pure error56.29--
Total12---
CO2Model4235.9105.040.0001
A171.131.70.0005
A2151.322.90.0014
A310.120.050.8
A4124.6710.720.01
Residual82.2--
Lack of fit35.9117.30.0001
Pure error50.05--
Total12---
Publisher’s Note: MDPI stays neutral with regard to jurisdictional claims in published maps and institutional affiliations.

