1. Introduction
Geothermal energy generation from dry, hot rock is a promising concept, as the source of heat at great depth is abundant anywhere on the planet. While the research interest is high, EGS is still the least successful among all renewable energy technologies. Many problems hamper the current EGS concepts: (1) high risks from the unpredictable geologic variables at a great depth; (2) insufficient surface intersection between the connecting wells and the fracture’s fluid cavity; (3) weakness in the design concepts of the fracture opening by high fluid pressure, making the joint’s aperture an operational variable; (4) seismic activities due to variable thermal dilatation with changing pressures and temperatures; and (5) reliance on very small fracture apertures, causing a high fluid pumping energy requirement, and an inherent loss of coolant water and large circulation loss.
A low risk of REGS creation is promised by an invention [
1,
2,
3], regarding the fracture geometry, aperture support technique, and coolant fluid flow isolation system, all created under step-by-step engineering control, verification, and correction if needed, reducing the reliance only on the always fractional knowledge of the geologic system. REGS has been envisioned and introduced with the goal of simultaneously overcoming the known shortcomings (1)–(5). The target features of the new, Robust EGS (REGS) arrangement are (a) to create connected, cooling pathways with large contact surface areas in the rockmass at a low cost and risk; (b) keep the fractures stabilized by support islands in order to depress seismic activities associated with thermal contraction during rock mass cooling and stress−strain redistribution; (c) close parasite fluid flow short circuits with the same support islands for avoiding cooling surface reduction; and (d) circulate the coolant fluid with low over-pressure to prevent fluid and energy loss to the host rock mass. The concept involves an innovative fracture permeability creation technique and an engineered fluid flow isolation and control system. The key to robustness is reliance on the engineering controls during the construction of an REGS, with continuous adjustments made to the variable elements of the geology.
The new REGS arrangement and its method of construction are disclosed and published elsewhere [
1,
2,
3]. A brief synopsis is recalled for convenience regarding the creation of REGS, as follows: (a) directional drilling; (b) wing-type fracturing; (c) testing for the connectivity of each planar wing fracture with the well; (d) continuation of the construction and testing of a series of wing fractures along the directional drilled well; (e) the well direction is adjusted, if needed, to the planar directions of the fractures; and (f) the completion of a series of wing fractures with zonal insolation in each planar fracture by the injection of a grouted or propped blocking island between the intake and the extraction points of the wing fracture section. The key to the creation of a series of large, planar, wing fractures is a directionally-drilled well to follow each major, planar fracture, intersecting it at multiple points around a section at which the fracture approximates the osculating plane (OP) of the well, as shown in
Figure 1 and
Figure 2.
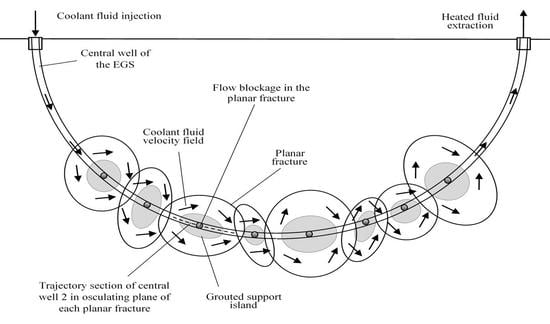
The key to geothermal energy extraction from the contact surface area of the planar wing fractures is an efficient coolant flow system inside the opened void space. Such a flow system in an REGS fracture is illustrated in
Figure 3, showing the incoming and exiting coolant flow velocities in the well, as well as the overall flow directions inside the void space of the planar fracture. As depicted, the coolant fluid flow is separated into two wings by the multi-functional flow-blocking and aperture-supporting islands at the center. The blockage is advantageous for preventing a straight flow pass both through the central well section and through the open fracture zone along the shortest distance.
Any newly conceived geothermal energy recovery system, such as REGS, remains as a hypothesis until it is tested in the field. The motivation of the current study is to test potential benefits of a REGS arrangement for clean, carbon-free, electrical energy generation. Some new elements of REGS technology have been investigated by researchers in the USA and the EU in an international research cooperation [
4]. The goal of additional numerical simulations is to show the energy extraction and monetary benefits of a simple REGS arrangement that requires only two, directionally drilled, deep wells. The focus is on the simplicity of the arrangement, which can be adapted to a wide range of geologic sites and in situ stress fields.
As the high cost of tryout experiments is a deterrent, another practical method is numerical simulations for analyzing potential benefits in order to inspire further application interests and experimental tryouts. This study presents a low-cost, computational, simulation effort to analyze and estimate the potential energy and financial benefits of a REGS reservoir for a 30-year operation outlook.
2. Materials and Methods
Two arrangements were tested by numerical simulation for the energy extraction capacity and thermal drawdown during operation. The first layout of the geothermal energy extraction arrangement, shown in
Figure 4, assumes the application of seven planar, circular REGS fractures in a series along an injection well and a return well with thermal insulation along its length for retaining its thermal energy. The second layout, shown in
Figure 5, is a twin fracture series arrangement with six additional REGS fractures along the lower part of the returning well, whereas the last 1750 m section of the well is thermally insulated.
The hypothesis is that the twin arrangement may be beneficial for energy extraction in comparison with the single arrangement, up to a point where the coolant fluid reaches a too-low-temperature rock layer due to a gradually decreasing virgin rock temperature with reducing depth. The hypothesis test is part of the work plan for the study.
2.1. Input Parameters for the Flow and Thermal Models
The input parameters for both the single and the twin arrangement examples are chosen to be representative of the common geological formations of ordinary crystalline, e.g., granite type base rock. The input data used for the study are given in
Table 1, following previous numerical simulations in various geothermal energy extraction examples [
3,
4]. A deep REGS of 5000 m is assumed, with a moderate thermal gradient of 0.033 °C/m in the host rock. The thermal properties of the host rock strata are close to the typical values of granite, the most common target crystalline rock type for EGS applications. The yearly average rock temperature at the surface is chosen at 10 °C, from which a linearly increasing virgin rock temperature with depth is used to model the strata heat reservoir. The coolant fluid temperature is assumed to be 30 °C, kept constant as the exhaust temperature from an Organic Rankine cycle [
5] (Hijriawan et al., 2019) or a Kalina Cycle [
6] (Nemati et al., 2017). The assumption is conservative, applying low- to moderate-temperature energy-recovery turbines in the expected intake temperature range of 100 °C to 175 °C at the electrical power plant throughout a 30-year operating time period.
A lens-shape fracture with a variable aperture is assumed along the radius of the circular planar fracture with a 0.015 m opening at the inner edge, next to the grouted island. The fracture aperture is gradually and parabolically reduced from the largest aperture at the edge of the grouted island to zero at the edge of the planar fracture. According to the REGS concept, the initial fracture opening is created by grout or proppant injection. Grouting is a well-developed technology providing solution for stabilization and flow sealing [
7,
8]. Reducing preferential pathways along the shortest flow path close to the leading well in the fracture void space may also be accomplished by engineered proppants. Resin-coated, innovative, proppant injection may also be sufficient to open and stabilize the planar fracture aperture developed from the oil and gas industry [
9]. Either way, an internal support is assumed in the center area of the planar fracture that does not allow for the variation of the fracture aperture with changing the temperature or hydraulic pressure of the coolant fluid. Variation of the fracture aperture is assumed only with the distance from the center point of the circular planar fracture, according to the well-known, lens-shaped geometry [
3].
The diameter of the wells is 0.3 m, accommodating a flow circulation pipe diameter of 0.2 m. Even with a high coolant water flow rate of 50 kg/s, the flow velocity remains moderate at around 1 m/s in the long pipes, and even lower in the fractures, allowing for low circulation pressure loss in the system. In spite of the low velocities in the geothermal heat exchanger’s water circulation system, the heat transfer coefficients on the fracture and the well’s walls still remain high, above 70 W/(m2 °C) and 800 W/(m2 °C), respectively.
The coolant fluid passes down in the intake well (down well D1) to the first planar REGS fracture at the depth of 1750 m un-insulated, picking up some heat from the warming rock strata as it increases in depth. At this point, the open well intercepts the planar fracture void space (D2) and the coolant fluid flow spreads into various flow paths in the REGS fracture.
Figure 6a shows the paths of the entire flow network in the planar fracture. Each line segment of the network represents a fluid flow connection channel. The nodes of the network (i.e., the vertices of the connected segments) represent flow junction connections. The coolant fluid in each channel section is driven by the pressure difference between connecting nodes, created by the forced circulation. The three main flow paths in the planar fracture are shown as ellipsoids. The fan-type flow paths are assumed to be symmetrical on the left and the right sides, according to the mesh grid of the flow network. The three main flow paths on either side are demonstrated according to
Figure 6b,c, showing the differential lengths of the network sections and the radial extension of their centers’ positions from the centerline, respectively. The available surface area for heat exchange on either side of the planar fracture along each flow path is shown in
Figure 6d.
The three flow paths merge together and connect to the intercepting well at the bottom of each subsequent planar REGS fracture. These flow connections are expected to be checked during the REGS construction as an engineering control for success. After a common flow section of 50 m in length in the well, the coolant fluid progresses into the next REGS fracture. The fluid flow continues across all seven REGS fractures (D3 through D8) down to the void area in which the return well is ended with a checked, fluid flow connection to the same void space. In the return well, a heat insulation liner is assumed to minimize the fluid heat exchange to or from the rock strata in the single arrangement case.
In the twin arrangement case, six more upward REGS fractures (U1 through U6) are created along the return well to a depth of 1750 m from the surface, for allowing additional heat exchange between the strata and the coolant fluid. From the depth of 1750 m to the surface, heat insulation is assumed along the well’s liner to avoid energy loss of the heated fluid toward the gradually cooling strata.
2.2. The Coupled Flow and Thermal Models
Discrete flow network models such as Ventsim and Pumpsim [
10,
11] are widely employed for channel flow analysis. Flows in porous and fractured media, typical around EGS reservoirs, are also modeled using transport network methods [
12,
13]. The MULTIFLUX network model [
14,
15] is used in the present study, following previous REGS applications [
3,
14,
15]. The fracture flow simulation model follows the coolant fluid’s flow path from the injection to the extraction points at the surface, according to
Figure 3 and
Figure 4. In each planar fracture, the flow from the well is split into six paths (that is, three individual paths symmetrically arranged on either side of the planar fracture) in the first 100 m section, and collected back to the well in the last 100 m section. The split of the total flow rate between the individual paths depends on the hydraulic resistances across which the coolant fluid is driven by the total Bernoulli-type energy gradient [
15].
It is difficult to predict these resistances for a REGS fracture in an actual geologic setting. For understanding the implications of the “known-unknowns” of the flow resistances, a sensitivity study was carried out in a previous study [
3] for a similar fracture geometry, varying the split of the total injection flow rate into individual flow rates in Path 1, Path 2, and Path 3. First, an optimum distribution was determined, defined by the balanced temperature field in the coolant fluid between the joining paths, giving the same exit temperature in each path before merging into the common mixed flow in the well’s junction point. The optimum flow rate distribution between Path 1, Path 2, and Path 3 was found to be 47%, 28%, and 25%, respectively. Second, the flow rate split between Paths 1, 2, and 3 was varied up and down around the optimum (while keeping the total flow rate constant), and the heat exchange capacity was evaluated for each split ratio. Interestingly, the study showed a very low sensitivity to different flow rate splits from the optimum values [
3], concluding that the issue of flow rate split between paths may be kept as a low-priority input for the thermal model.
Nevertheless, lateral flow connections between the paths are included in the flow model to allow for cross-flows between neighboring paths (
Figure 6a) as the grid lines. In the case the flow rate splits between the flow paths are not at the optimum due to constrained engineering control during fracture creation, lateral flows will be driven by the unbalanced pressure field, causing swirls in the void space, an advantageous process that transports the thermal energy from the colder areas into the main coolant stream.
The heat, mass, and momentum transport simulation code, called MULTIFLUX [
14,
15,
16], is applied for the model calculations in the present study for a new REGS arrangement. The coupled, thermal, flow, and mechanical network model is a comprehensive simulator, similar to those used by others for geothermal energy simulations [
17], with separate network modules for flow and heat transport. In the current study, the MULTIFLUX model configuration assumes a stabilized fracture cross section of lens-shaped geometry. The thermal and the flow network models are both defined by the same mesh grid of the flow field geometry (shown in
Figure 6). Advection, convection, and turbulent heat dispersion are modeled in the flow field in the thermal network. Advection heat transport by the coolant fluid flow is modeled by the thermal capacitance flux oriented by the direction of the velocity in each flow branch. Heat transport by dispersion and/or diffusion is added in each branch, in addition to advection, to represent the axial heat transport in branches of a very low flow velocity. Convective heat transport at each thermal network node is represented by a heat transfer coefficient as a function of the local velocity field in each pixel and the contact surface area of half of the sum of all incoming and exiting flow branches.
The ultimate heat source is the three-dimensional, transient heat conduction from the host rock strata used as the boundary condition of the heat transport network of the coolant fluid flow. The heat flux as the source or sink to the thermal network is modeled by the NTCF (Numerical Transport Code Functionalization Method) matrix, an artificial intelligence tool used for accelerating model simulations involving large, coupled processes [
18]. The NTCF matrix is determined from the thermal properties of the host rock by a patented method, used as an integral part of the MULTIFLUX model [
16,
18].
4. Discussion
Any newly conceived energy recovery system from a geologic formation remains a hypothesis until it is tested in the field. This unconventional geothermal reservoir system is called REGS, because of its invention with a new type of fracture geometry and creation methodology. However, the high cost of tryout experiments may be preventive for exploring a true transformative solution that cannot otherwise be validated by small-step evolutionary improvements. This is a “catch 22” phenomena for disruptive development in EGS reservoir technology such as REGS. Therefore, numerical simulations were conducted for analyzing the potential benefits in order to inspire further application interests and experimental tryouts.
The present study is a low-cost, computational simulation effort to analyze and estimate the potential energy and financial benefits of a REGS reservoir for a 30-year operation outlook. The expected income can then be compared with the operation and capital expenses to decide if an a REGS arrangement may be financially profitable. The input data for the study are conservatively selected for wide-scale applicability regarding location selection. The numerical model, described earlier, is flexible and adjustable for the analysis of REGS-type fracture arrangements in order to answer questions about the expected outcomes for any site-specific input data.
A REGS reservoir based on a detailed geologic thermal resource exploration and target geometry can be analyzed for improved predictions with the presented method for a single, D1–D8, or twin D1–U7 array of REGS fracture series, but with different input parameters. Even the depth of the REGS reservoir and the number of fractures in the series arrays can be selected to match the size of the host rock formation. There are numerous “unknown unknowns” in any conventional EGS reservoir, but there are less for REGS, as a robust engineering control (hence the name) is prescribed in every step in its creation as part of the technology [
1,
2]. For example, if the flow distribution paths in a planar fracture element, as shown in
Figure 6a, are not found satisfactory during their creation, the fracture is abandoned and re-created further along the well, which is drilled into an adjusted direction.
The temperature distribution results in
Figure 7 show the individual contribution of each REGS fracture for the increase in the coolant fluid temperature as a function of time. The coolant water exiting the first REGS fracture (labeled D2) at 2250 m depth gains only a low temperature of 33.9 °C at the end of a 30-year coolant circulation time, hardly higher than the intake water temperature of 30 °C at the surface. The additional temperature step raises in the exit temperature of the coolant water in each additional REGS fracture from D2 though D8, as the virgin rock temperature raises with depth and more energy becomes available to be transported from the rock. The highest value of the coolant water temperature of 174 °C is reached at the exit point of the deepest REGS fracture, D8, at 5250 m depth in the first time step of 5 days. At this point, the fluid temperature still remains at 77.1 °C at the end of a 30-year coolant circulation time.
Figure 7 clearly shows that it is beneficial to create REGS fractures up to a point along the return well, as shown in the twin array arrangement in
Figure 5. Gradually increasing output coolant water temperatures are seen at the REGS fractures from U1 through U6, where the minimum temperature is still 102.5 °C at the end of year 30. The temperature steps, however, are rapidly decreasing due to the declining virgin rock temperature around the REGS fractures. The benefit of keeping U6 is not obvious from the temperature field as the output temperature of REGS fractures U5 and U6 overlap by year 30. During the first 6 to 9 year time period, the water temperatures from REGS fractures U5 and U6 cross from the bottom of fracture U4, indicating that they are cooled by their rock strata. This internal heat exchange along the fluid circulation heats the colder rock strata through the hotter fluid coming from the deeper and warmer areas. This is beneficial as the heat is stored and saved for later time periods in the system. Indeed, after year 10, the output temperatures from U5 and U6 are higher than from U4 (
Figure 7), slowing down their thermal drawdown.
An internal heat exchange along the fluid circulation loop can also be seen from the heat flux distribution along the surface wall pixels of the REGS fractures as a function of space and time (shown in
Figure 8a,b) for the single and the twin REGS arrays, respectively. While the heat flux distribution shows a positive gain everywhere along the single REGS array with the downward flow and increasing virgin rock temperature, the twin array confirms expected negative fluxes through the heat loss from the coolant fluid during the first few years along the upward REGS fracture zones, and heat gain at the later time period at the same zones.
In conclusion, the hypothesis test for the benefit of fracturing the upward well even at the lowered temperature regime up to a point is affirmative. However, once the gain and the loss are evened out, it is worth applying thermal insulation for keeping the production fluid temperature as high as possible. In the example, the best performance can be seen when insulating from the exit point of the upward REGS fracture U4 from a depth of around 2750 m in the example. That is, in the presented example, it would have been beneficial to leave out fractures U5 and U6.
The thermal power output for the entire system (including fractures U5 and U6) as a function of time is calculated from the enthalpy change in the coolant water along the circulation loop, and is checked against the spatial integral of the wall heat flux results using the simulation model. The results for each REGS fracture are shown in
Figure 9, where curve D8 is the cumulative output for the single REGS array, and curve U7 is the cumulative output for the twin REGS array. As depicted, the single REGS array can produce about 10 MW gross thermal power at the end of 30 years, with a peak output of about 20 MW for the first year. The twin REGS array can supply 15 MW gross thermal power at the end of 30 years and a peak output of about 20 MW for the first five years with a thermal insulation from the exit point of REGS fracture U4. If REGS fractures U5 and U6 are kept operational, the output power for the first five years will gradually increase from 12 MW to 20 MW, as shown in
Figure 9.
The gross cumulative energy is calculated by the temporal integral of the gross power output capacity of the reservoir, as shown in
Figure 10a. As depicted, 3.5
kWh and 4.7
kWh gross thermal energy capacities can be obtained from the single and the twin array REGS reservoirs, respectively, by the end of the 30-year production time period. The change is nearly linear with the time for the twin array arrangement, a benefit from the internal thermal storage process between REGS fractures.
The net cumulative electrical energy value is shown in
Figure 10b, and is calculated by the temporal integral of the gross power output capacity of the reservoir, multiplied by an estimated Carnot energy conversion efficiency of 0.21 and an energy cost rate of
$0.1/kWh, a similar value to those applied by Cui et al. for a single-well EGS system [
19]. As depicted,
$70 M and
$90 M electrical energy market value can be obtained from the single and the twin array REGS reservoirs, respectively, by the end of the 30-year production time period.
5. Conclusions
A new geothermal energy recovery system, REGS, is analyzed for its potential benefits. The new system will remain as a hypothesis until it is tested in the field. To attract interest for such tests, numerical model results are presented regarding a new REGS geothermal power exploitation system in a single and a twin arragenments for examination of the operating characteristics and potential benefits to green, cumulative energy supply and the market value from its operation.
The results show that the single and the twin REGS array arrangements may produce a market value of $70 M and $94 M electrical energy, assuming a Carnot conversion efficiency of 0.21 for a conservatively selected, low temperature regime for wide applicability.
EGS developers may use the presented results to evaluate the business case for investments, by analyzing the cost of drilling two 5000 m deep wells and performing the robust construction of 13 REGS wing fractures, 500 m in diameter each, under checks and engineering control.


