Article

Energy from the Waves: Integration of a HESS to a Wave Energy Converter in a DC Bus Electrical Architecture to Enhance Grid Power Quality

by
Linda Barelli
1,
Ermanno Cardelli
1,
Dario Pelosi
1,
Dana Alexandra Ciupageanu
1,2,
Panfilo Andrea Ottaviano
3,
Michela Longo
4,* and
Dario Zaninelli
4
1
Department of Engineering, University of Perugia, Via G. Duranti 93, 06125 Perugia, Italy
2
Engineering Faculty, University Politehnica of Bucharest, Splaiul Independentei 313, 060042 Bucharest, Romania
3
VGA S.R.L., Via Ugo Foscolo 1, 06053 San Nicolò di Celle, Italy
4
Department of Energy, Politecnico di Milano, Via La Masa, 34, 20156 Milano, Italy
*
Author to whom correspondence should be addressed.
Energies 2022, 15(1), 10; https://doi.org/10.3390/en15010010
Submission received: 12 November 2021 / Revised: 10 December 2021 / Accepted: 13 December 2021 / Published: 21 December 2021
(This article belongs to the Special Issue Green Energy)

Abstract

:
The need for environmental protection is pushing to a massive introduction of energy production from renewables. Although wind and solar energy present the most mature technologies for energy generation, wave energy has a huge annual energy potential not exploited yet. Indeed, no leading device for wave energy conversion has already been developed. Hence, the future exploitation of wave energy will be strictly related to a specific infrastructure for power distribution and transmission that has to satisfy high requirements to guarantee grid safety and stability, because of the stochastic nature of this source. To this end, an electrical architecture model, based on a common DC bus topology and including a Hybrid Energy Storage System (HESS) composed by Li-ion battery and flywheel coupled to a wave energy converter, is here presented. In detail, this research work wants to investigate the beneficial effects in terms of voltage and current waveforms frequency and transient behavior at the Point of Common Coupling (PCC) introduced by HESS under specific stressful production conditions. Specifically, in the defined simulation scenarios it is demonstrated that the peak value of the voltage wave frequency at the PCC is reduced by 64% to 80% with a faster stabilization in the case of HESS with respect to storage absence, reaching the set value (50 Hz) in a shorter time (by −10% to −42%). Therefore, HESS integration in wave energy converters can strongly reduce safety and stability issues of the main grid relating to intermittent and fluctuating wave production, significantly increasing the tolerance to the expected increasing share of electricity from renewable energy sources.

1. Introduction

Nowadays, a huge interest in exploiting sustainable and renewable energy sources such as solar, wind, hydro, wave and tidal, is growing. The main concerns stimulating research and development activities in this field include aspects as environmental protection and energy independence [1]. Among the renewables, wave energy has a great annual energy potential equal to an amount of 32,000 TWh worldwide, of which 2000–4000 TWh can be exploited [2]. Cumulative global wave and tidal stream capacity has more than doubled since 2017, reaching approximately 65 MW in 2020 and slowly approaching the Ocean Energy Systems vision of 300 GW of global capacity by 2050, as reported in [3]. Although the great potential, the wave energy industry is struggling to reach cost-efficient and reliable systems to follow the path towards commercialization [2]. Moreover, not only must the technological aspects be considered, but also the implications relating to social and ecological challenges [4], especially for what regards protected marine and ocean areas.
As for wind and solar energy, another major issue regards the integration of Wave Energy Converters (WECs) into electricity network because of the mismatch between load demand and fluctuating power generation due to the stochastic nature of waves [5]. Furthermore, no WEC technology can be considered the leading one; consequently, the wide variety of WEC systems makes it difficult to generally discuss power quality [6]. However, the large variation of output power is a common issue. Thus, the infrastructure costs and complexity have to be faced. Indeed, as analyzed in [7], a study of grid connection assuming an off-shore 20 MW wave farm linked to the Irish distribution network has been carried out. In detail, it was shown that the grid connection costs account for 69% of the total electrical equipment budget.
Among the proposed solutions to mitigate power quality issues, Energy Storage Systems (ESSs) represent one of the best available paths for a better Renewable Energy Source (RES) exploitation and penetration, thanks to their good scalability, fast responsiveness, and efficiency [8,9,10,11,12]. Several studies have been addressed to the application of ESS in WEC systems. As example, Zhang et al. [13] apply a Battery Energy Storage (BES) to the DC link of the back-to-back converter linked to the WEC in order to smooth the generated power. Murray et al. [14] describe the applications of an energy storage system based on supercapacitors in a full-scale, grid-connected offshore WEC. Specifically, such study is focused on the minimization of the output power fluctuations, the start sequences for the machine and the Low-Voltage Ride-Through (LVRT) capability. Aubry et al. [15] report the sizing of an Energy Storage System based on supercapacitors with two State of Charge (SoC) control strategies and two power quality criteria for power smoothing. Other noteworthy research activities concerning ESS integration in WEC systems are discussed in [16,17,18,19,20].
Nevertheless, because of the intrinsic limits of state-of-the-art energy storage technologies, a single device cannot cover in an effective and efficient way all the operating modes on different time scales. Hence, a solution to mitigate this issue is represented by hybridization of complementary ESSs. As matter of fact, Hybrid Energy Storage Systems (HESSs), including multiple storage devices complementary to each other, can cope with storage requirements for different timeframes, merging the positive features of base-technologies and extending their application ranges [21]. From the power quality point of view, the integration of HESS in WECs has been widely studied in [22,23,24,25], with the purpose of smoothing the generated output power fluctuations. Nevertheless, to the best of our knowledge, no studies address the comparative analysis of electrical behavior of a WEC with and without the HESS integration, to assess the consequent impact in terms of power quality at the Point of Common Coupling (PCC).
In reference to the power quality issues relating to WEC connection to the main grid, as previously stated, this paper aims to evaluate the improvement in power quality (e.g., in terms of voltage waveform frequency and current transient behavior) at the PCC produced by the HESS integration, with respect to the case of storage absence. Specifically, the considered HESS is composed by a 24 kWh Li-ion battery and a 33 kW/2.1 kWh Flywheel Energy Storage System (FESS), and it is coupled to a 250 kW WEC by means of a common DC bus. The choice of such architecture topology presents several positive features, such as easy management, high quality of the energy, reduced number of power converters and no reactive power exchange, although currently incomplete standardization is defined as the main drawback [26]. In particular, an electrical architecture based on a common DC bus is widely used in microgrids, as reported in [27,28,29,30].
Moreover, the implemented power management strategy is based on a suitable Simultaneous Perturbation Stochastic Approximation (SPSA) algorithm, as reported in our previous paper [31]. By means of SPSA power management strategy, it was demonstrated that HESS coupled to the WEC allows to reduce more than 80% the oscillations power ramp (kW/s) at the PCC.
Through the electrical model and simulations under large and sudden WEC power variations, defined based on the experimental data gathered from three installation sites, the present study demonstrates that, in case of HESS integration, the consequent peak value of the voltage wave frequency at the PCC is reduced over 64%. Furthermore, the regimen value (50 Hz) is re-established in a shorter time (up to 42%).
The paper is organized as follows: in Section 2 the main components of the considered system are described; in Section 3 the simulation scenarios, relating to the most stressful conditions with reference to WEC power profiles, have been defined, while Section 4 reports and discusses the main results obtained from the simulations. Finally, the main contributions of this research work are argued in the Conclusions paragraph.

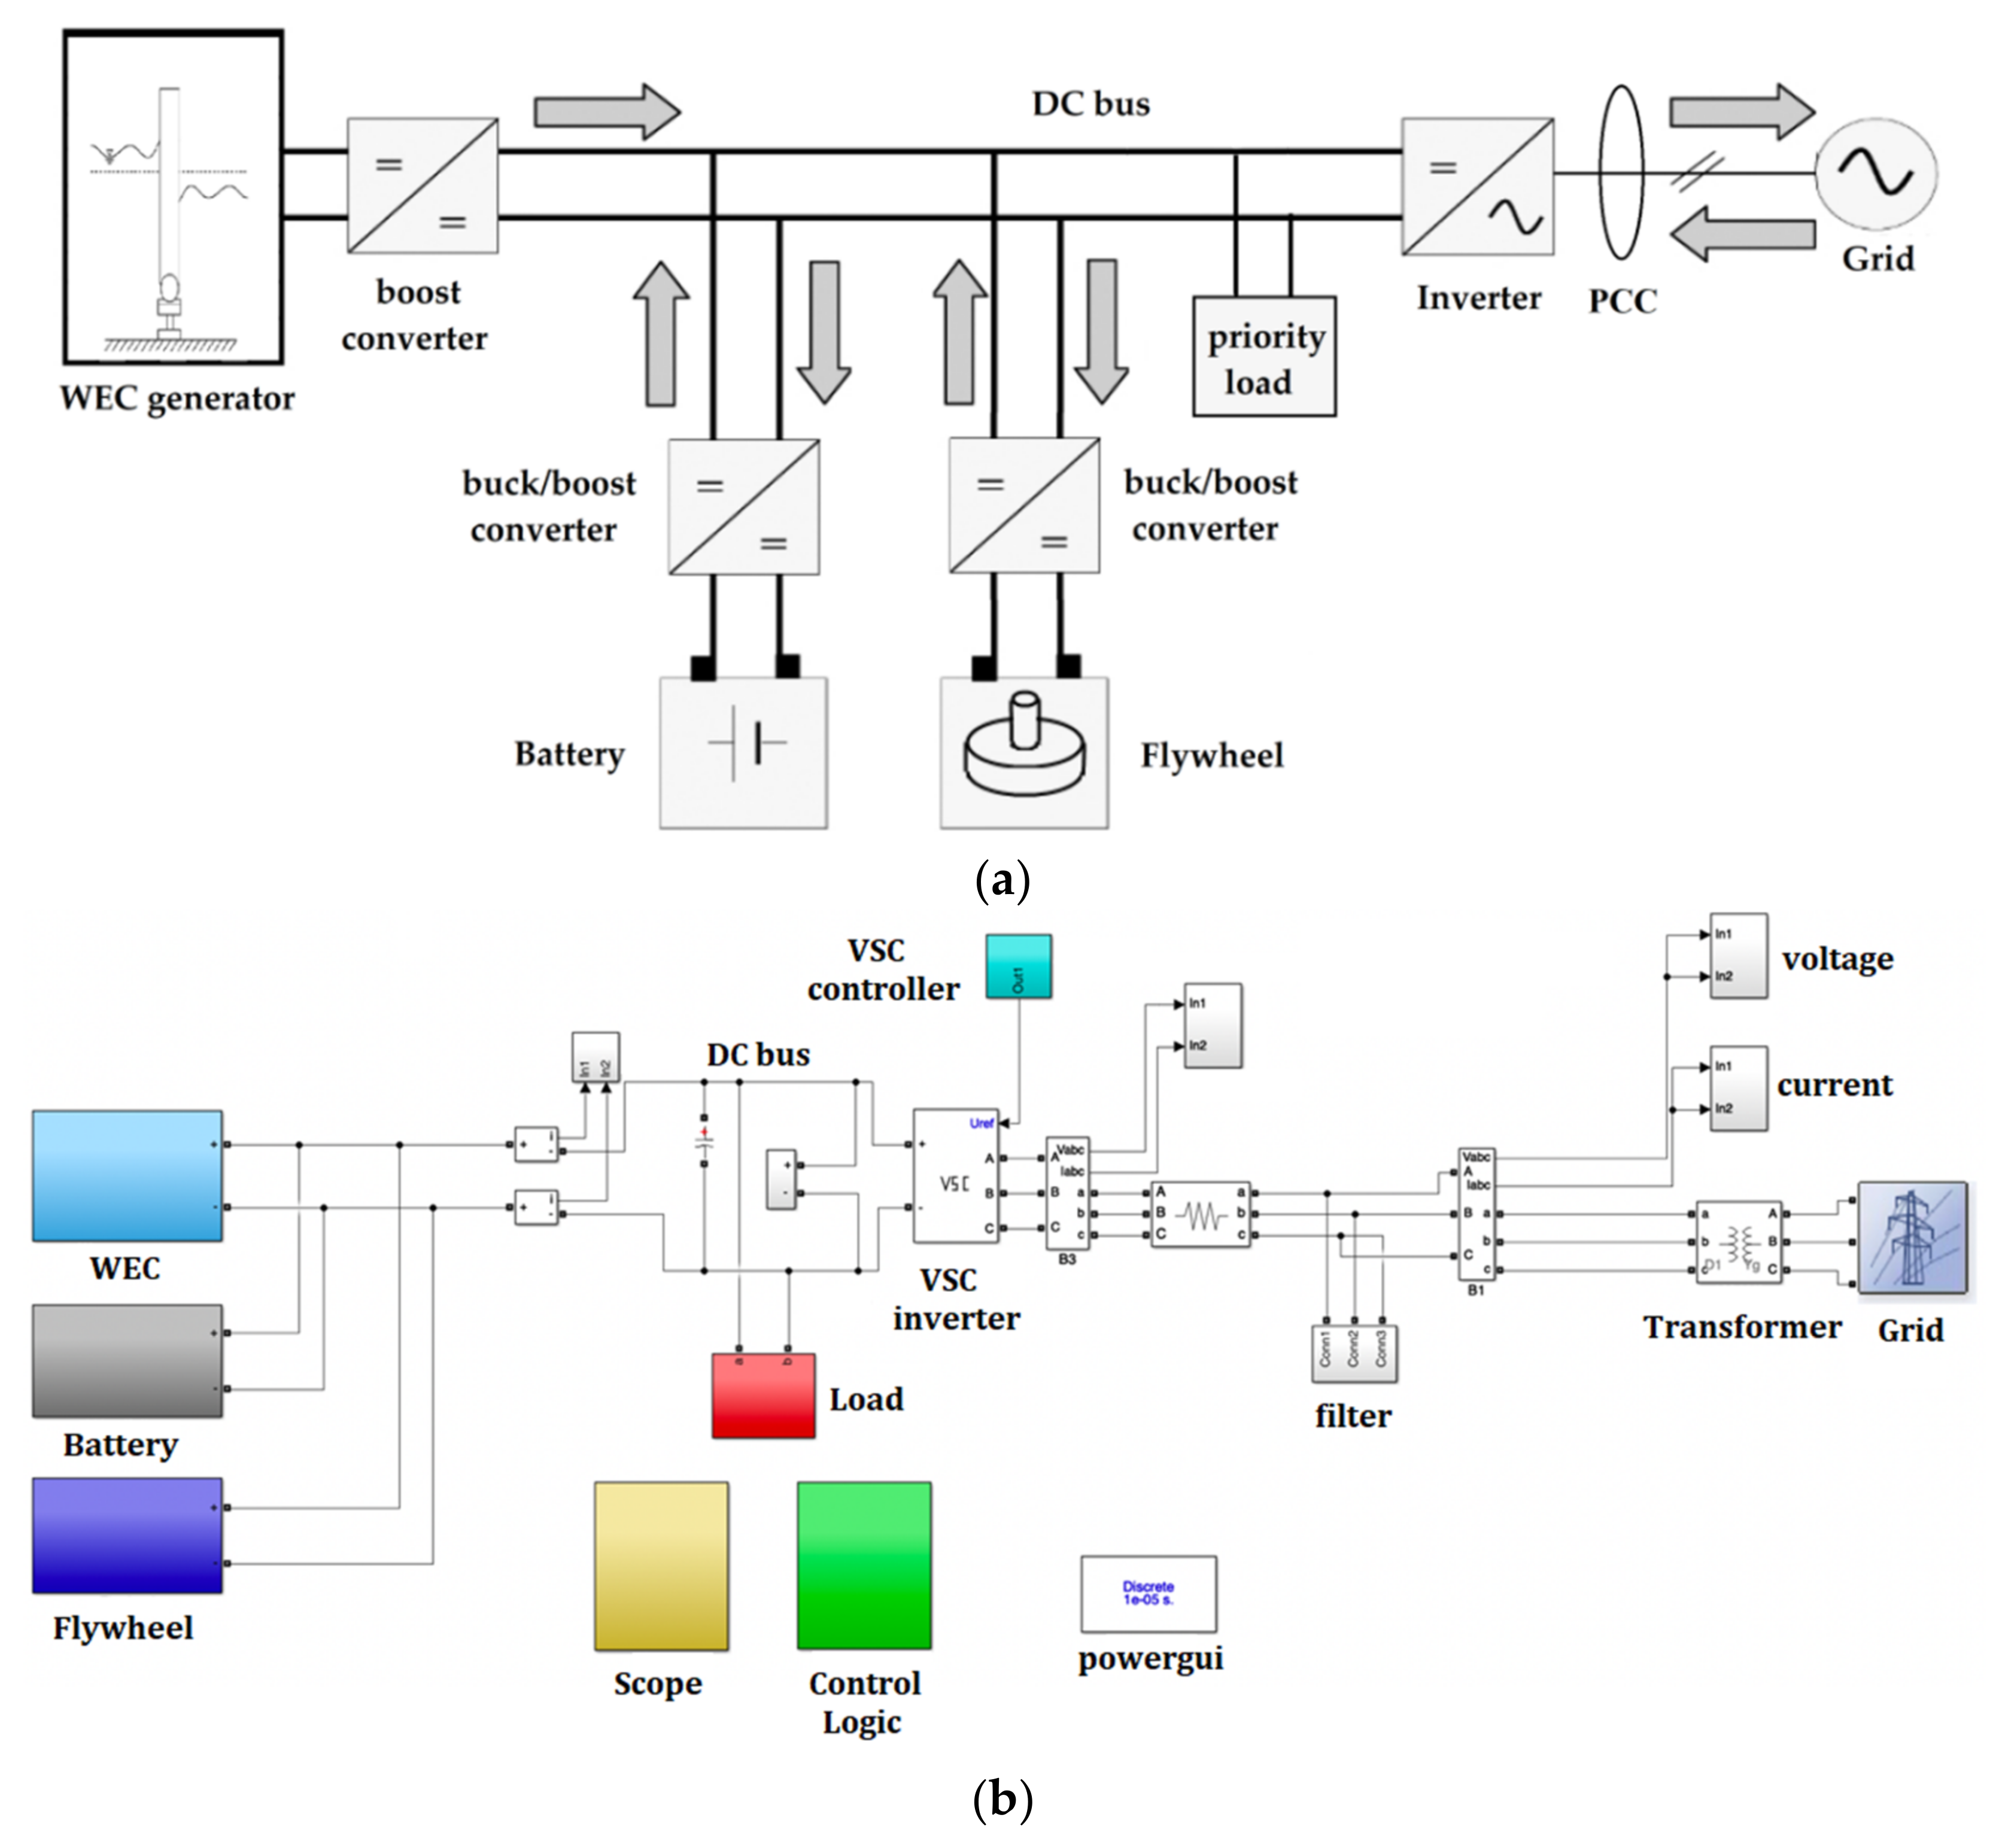
2. Model Description

In this section a detailed description of the components implemented in SimPowerSystems (SPS) environment has been carried out. The model layout is represented in Figure 1.
The chosen electrical architecture topology is based on a common DC bus, whose voltage is fixed at 650 VDC, in order to interface with the typical low voltage grid of European Countries (i.e., 400 VL-L according to the mandatory low voltage connection specifications of the Italian national electric network [32]). The overall system results in (i) a 250 kWp WEC generator, (ii) a battery having a capacity of 24 kWh and 72 kW/24 kW as maximum discharge/charge power, coupled with a flywheel of 33 kW rated power and 2.1 kWh capacity. Furthermore, a 4 kW priority load directly connected to the common DC bus, relative to the WEC auxiliary systems, has been taken into account.

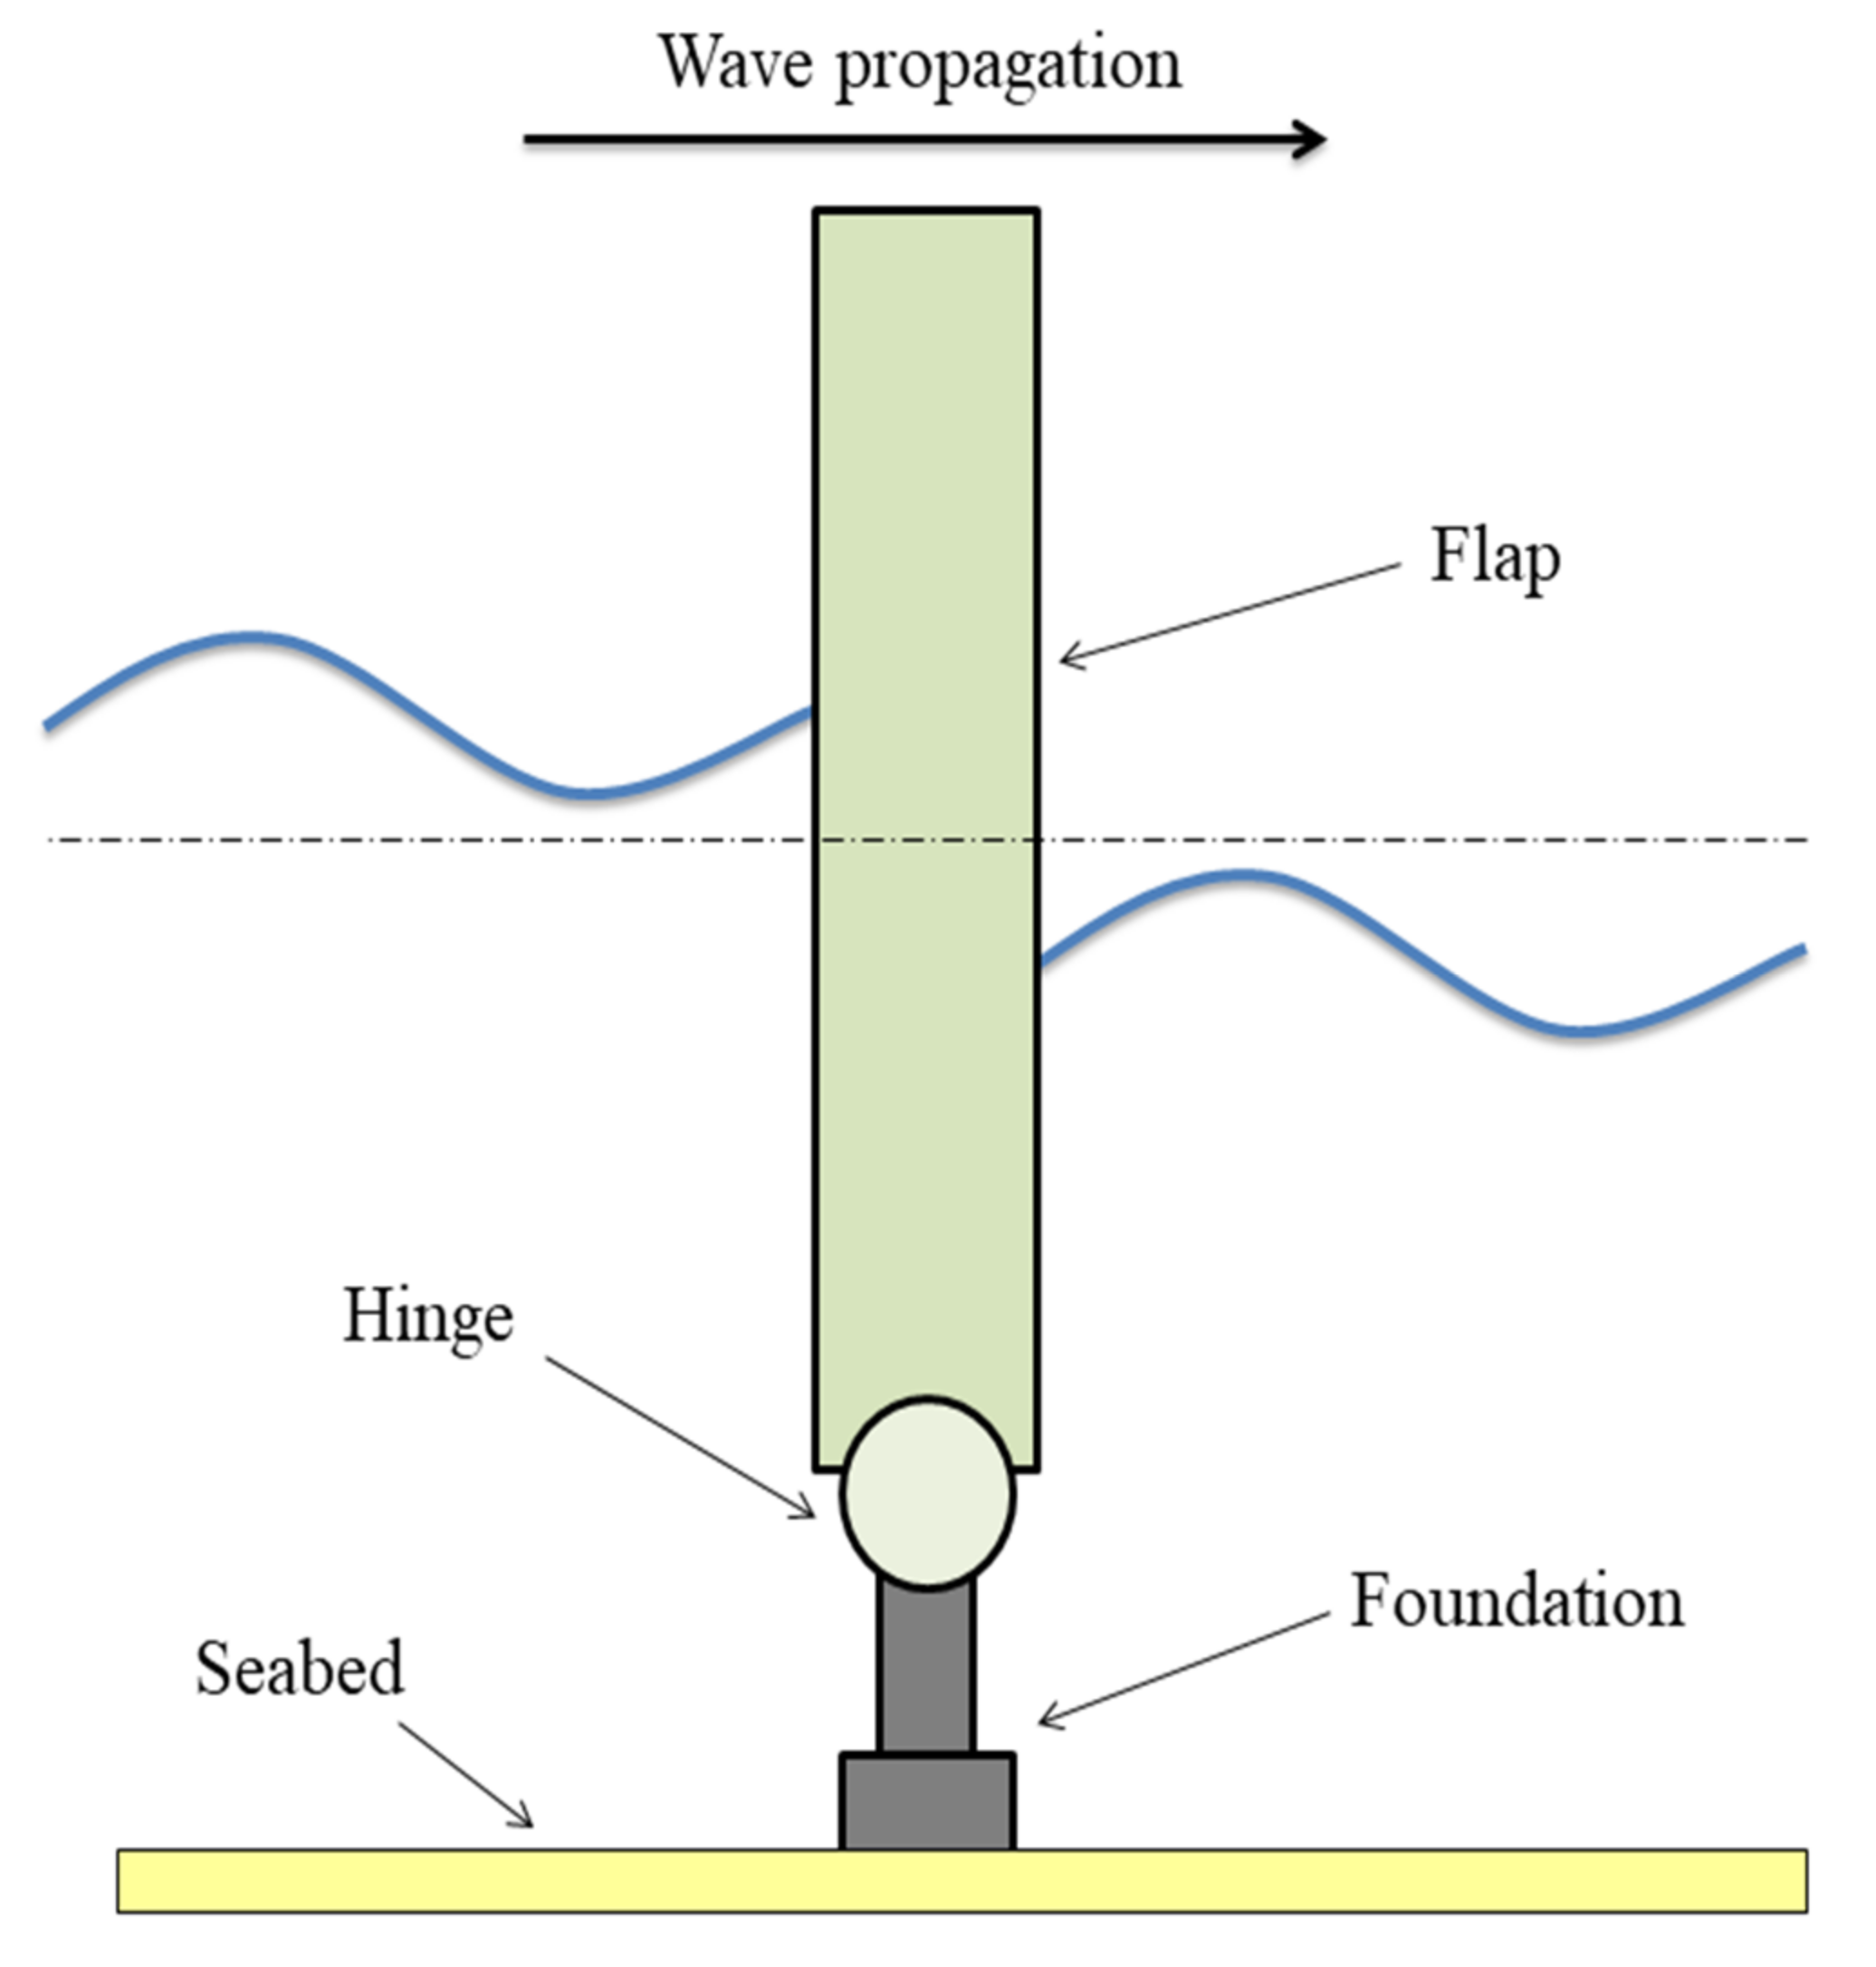
2.1. Wave Energy Converters—WEC

The Oscillating Wave Surge Converter technology (OWSC) is considered. A schematic view is illustrated in Figure 2, deduced from [33].
Figure 3 depicts the implemented WEC generator, modeled as Permanent Magnet DC Brushless Generator (PMBG). Since the present work is mainly focused on the electric aspects relating to the integration of HESS in a WEC, only the generator connected at the Power-Take-Off (PTO) has been taken into account. The rated power of the PMBG is equal to 250 kW with a nominal DC voltage of 400 V. The inertia momentum of the PMBG is equal to 1.33 kg·m2 and the viscous damping to 78.8 Nms. Since the PMBG block is developed in Simscape, an interface block is used to link the Simscape block to the SPS environment. Furthermore, a boost converter is used to increase the PMBG DC voltage up to the DC bus voltage (fixed at 650 V in order to interface with the 400 VL-L three-phase low voltage grid). The control of the boost converter is performed by means of Pulse Width Modulation (PWM) strategy.

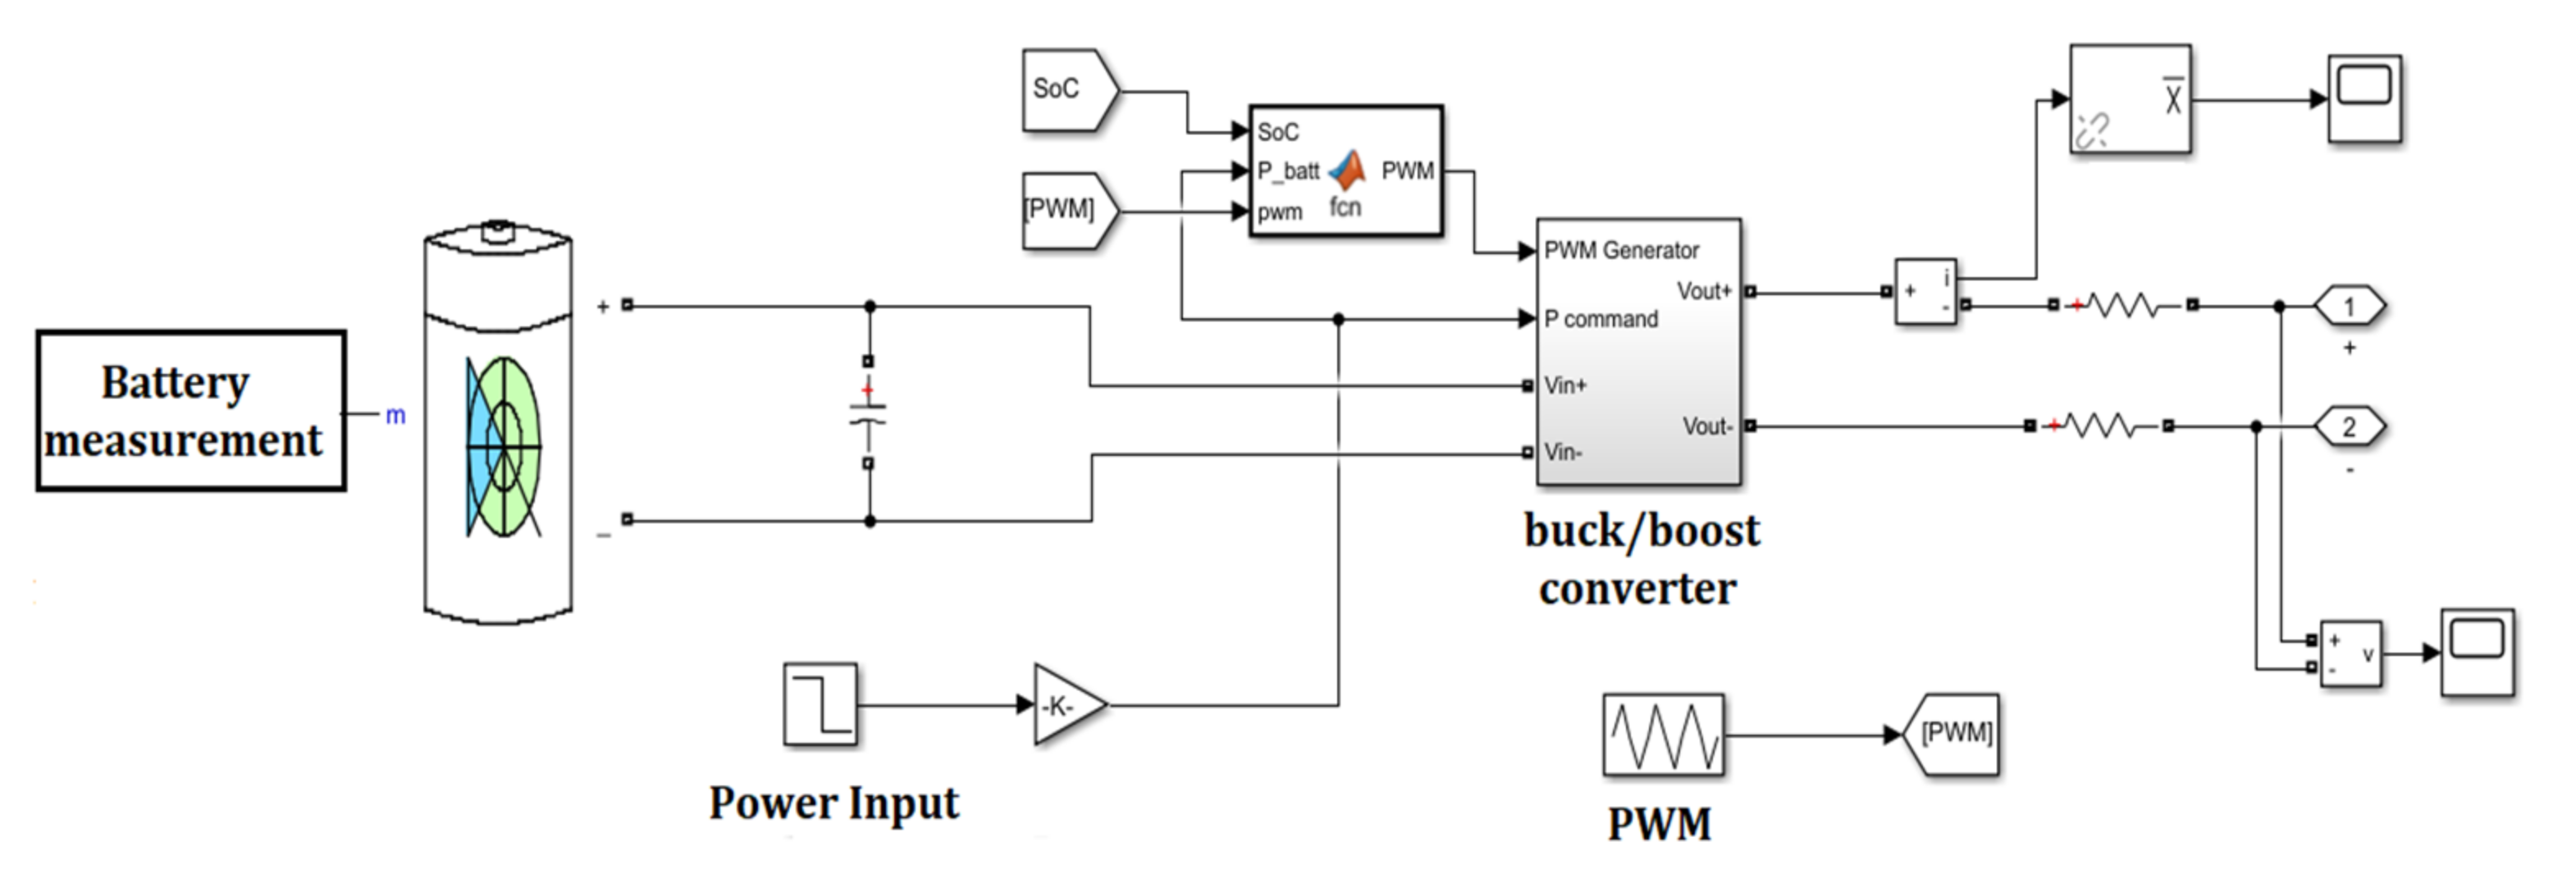
2.2. Li-Ion Battery Characteristics

Li-Ion battery section is implemented through a generic dynamic block from SPS library within Simulink environment. Such block follows Equations (1) and (2) according to charge and discharge respectively [34].
f d i s c h ( C o u t , i * , i ) = E 0 K · C max C max C o u t · i * K · C max C max C o u t · C max + E exp · e C exp C o u t
f c h ( C o u t , i * , i ) = E 0 K · C max C max + 0.1 · C o u t · i * K · C max C max C o u t · C o u t + E exp · e C exp C o u t
where C o u t represents the extracted capacity [Ah], C max is the maximum capacity [Ah], C exp defines the battery capacity in the exponential zone [Ah], E 0 is the constant voltage [V], E exp the voltage in the exponential zone [V] and K represents the polarization constant [Ah−1]. Constant values, listed in Table 1, are defined in reference to battery specifications and available data in the scientific literature [35,36].
The selected battery (24 kWh pack; maximum charging current (1C, 57.1 A@420V); maximum discharge current (3C, 205.7A@350V), from [32]) and the bidirectional DC/DC converter (buck/boost converter) are shown in Figure 4. In detail, the bidirectional buck/boost converter is used to adjust the battery voltage both in charging and discharging processes. It receives as input the power from/to the battery and the control signals computed by the PWM strategy. Such power is imposed according to the procedure reported in Section 2.1. Moreover, instantaneous battery SoC is computed within SPS block.

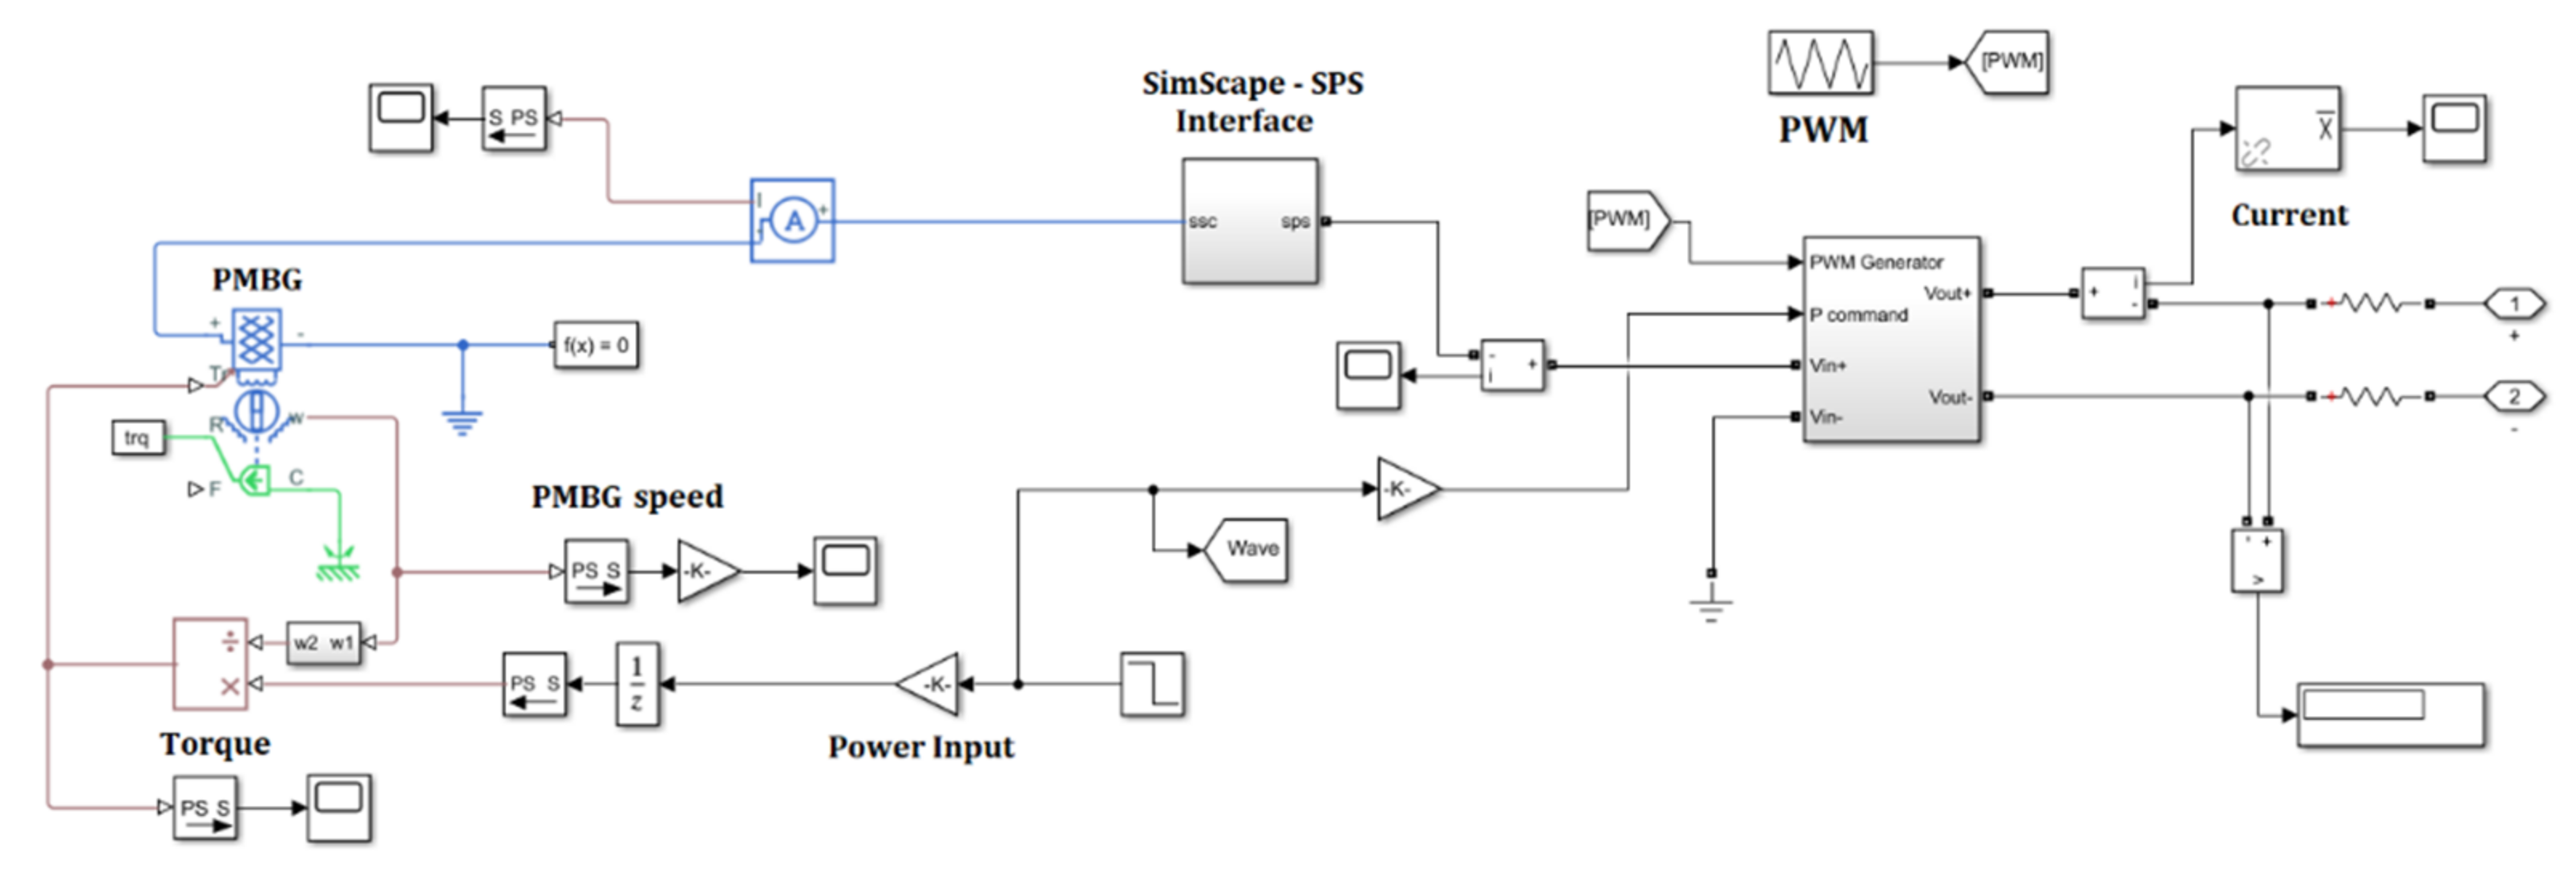
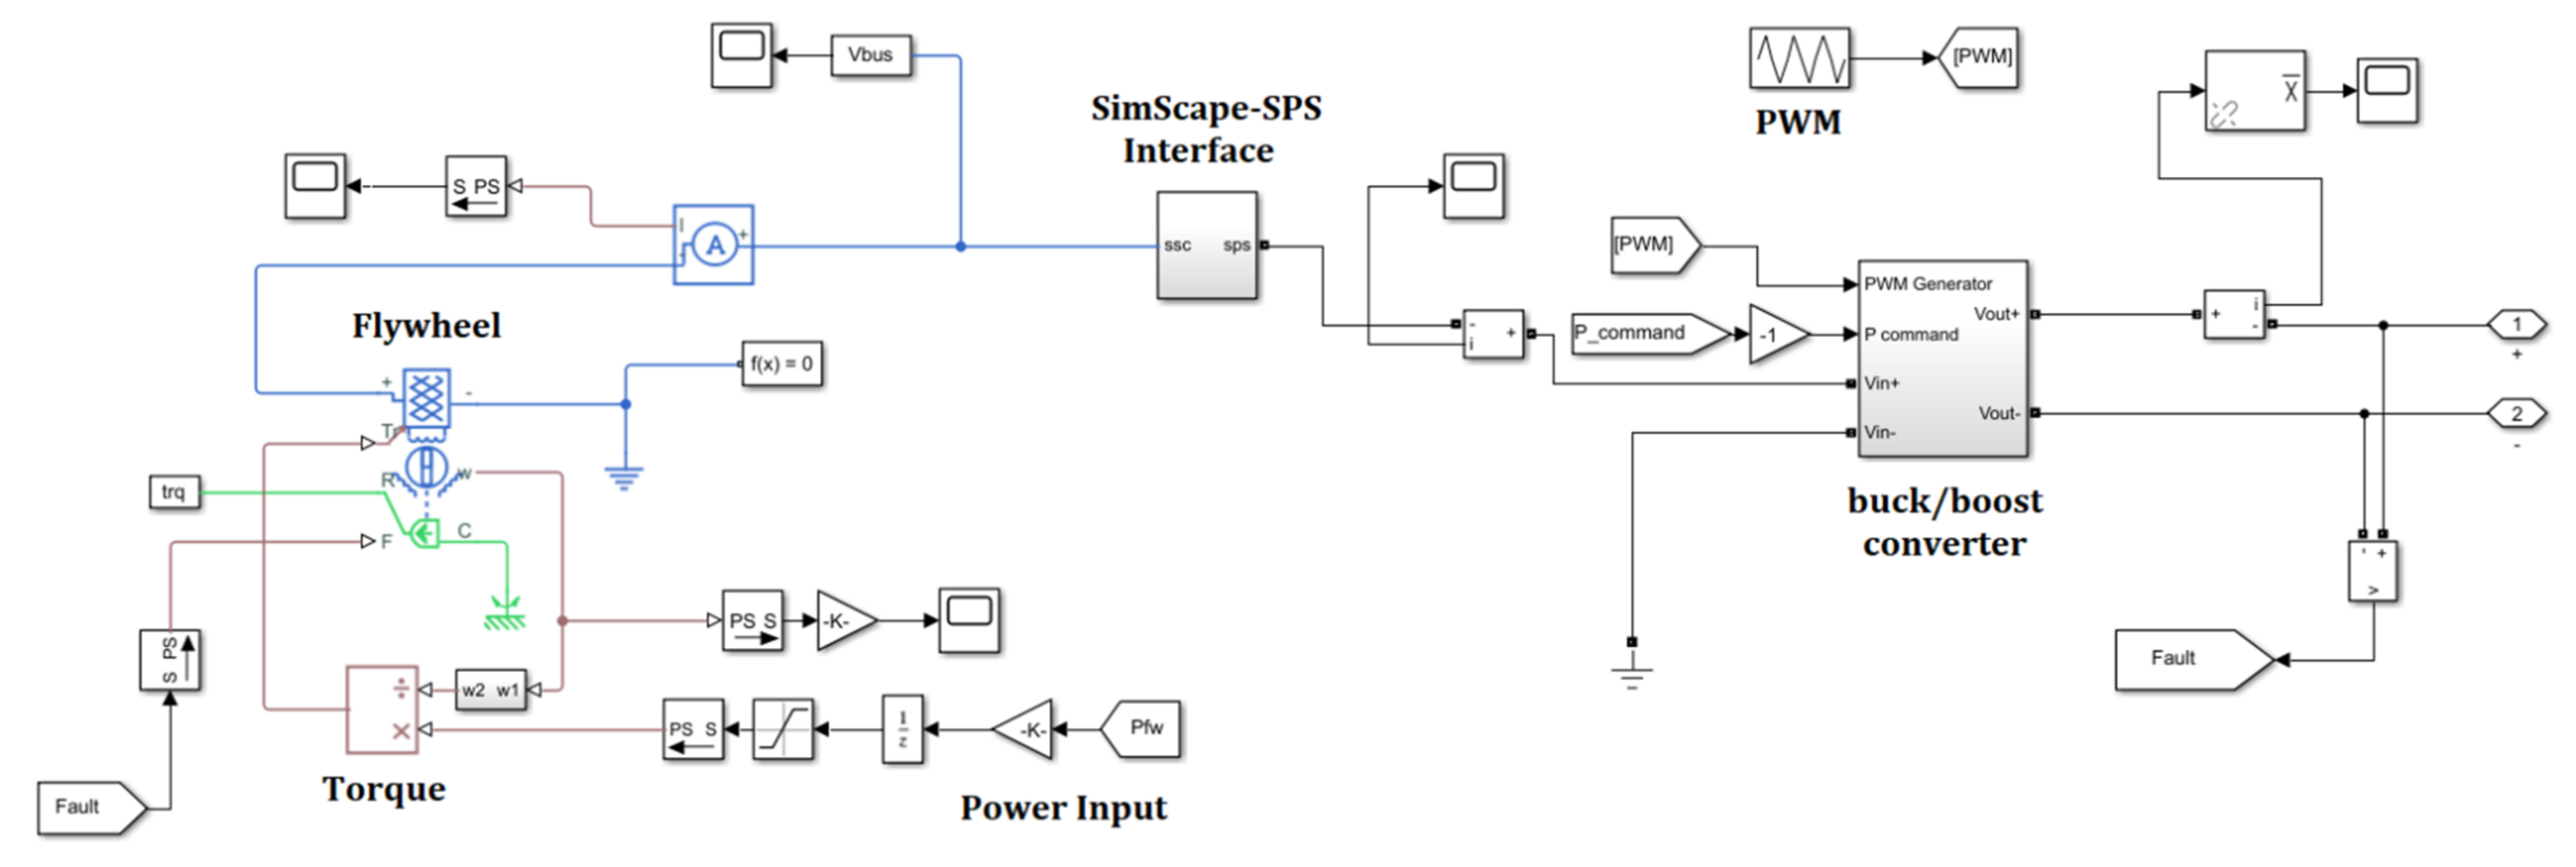
2.3. Flywheel and Electric Machine

The flywheel section is modeled as an inertia connected to the mechanical part of the Permanent Magnet DC Brushless Machine (PMBM). Since the FESS capacity is sized equal to 2.1 kWh, assessed in reference to Equation (3), with operating rotational speed range of 3500–8500 rpm, the corresponding inertia momentum is set at 22.4 kg∙m2.
E = 1 2 · J · ω max 2 ω min 2
where J is the inertia momentum [kg∙m2]; ω min and ω max respectively, minimum and maximum angular velocity [rad/s]. Specifically, ω max = 890.1 rad/s and ω min = 366.5 rad/s.
The flywheel subsystem block diagram is illustrated in Figure 5. It includes the mechanical flywheel, the PMBM electric machine, the buck/boost converter and the related control scheme. As concerns the electric machine, it is noted as in this work the design and HESS operation is focused on the energy exchanges among its components. A PMBM with a maximum power of 33 kW in relation to the torque vs. speed characteristic curve has been implemented. The power required from or supplied to the flywheel, as well as for the battery, is imposed according to the specific procedure described in Section 3 and transmitted as input to the PMBM, which has a proper internal torque control. The interface block allows enabling the interconnection between Simscape (SSC) and SPS blocks. The buck/boost converter regulates, through a PWM strategy, the electric machine input and output powers.
The auxiliary systems to supply are modelled as a priority load connected to the DC bus by means of a dedicated VSC inverter [37]. The load is considered as a pure resistive three-phase element and the rated power resulting from the specific studied WEC is fixed at 4 kW.

3. Different Scenarios for Simulation

In this section the investigated scenarios have been defined. Specifically, three different scenarios are identified both for HESS presence and absence. The definition of simulation scenarios for the Simscape electrical model follows a three stages procedure, described forward.
  • Scenario 1—instantaneous power vectors are generated for three different wave power plants, processing the sea state matrix for each site (i.e., site 1—France, site 2—England, site 3—Norway), as reported in [31].
  • Scenario 2—the yearly power vectors are processed, separating them by days. A set of parameters (i.e., bandwidth, mean power, bandwidth to mean power ratio, mean ramp) are evaluated for each day, aiming to select the most representative ones for all the three sites. Consequently, simulation profiles (with 1 s time step for 24 h) are extracted from the yearly profile and employed in simulation in the Simulink environment (the model is described in detail in [31] and the rated power values for each component are indicated also in the previous section). The representative days are selected based on particular statistics, as listed below. The statistical analysis procedure is depicted in the previous works of the Authors for similar applications [38,39]. Specifically, days selection is realized according the following criteria:
    Day 1: maximum bandwidth;
    Day 2: maximum mean power;
    Day 3: maximum bandwidth to mean power ratio;
    Day 4: minimum bandwidth to mean power ratio;
    Day 5: maximum mean ramp.
    A suitable model, previously developed in Simulink environment is applied for simulations over the selected most representative days [31]. The applied Simulink model has been implemented based on the mathematical equations, efficiency maps and including a stochastic power management section, suitably developed by applying a SPSA algorithmic method for power management optimization. Specifically, the power management is defined pursuing two objectives:
    (i)
    smoothing the power profile sent to the grid and
    (ii)
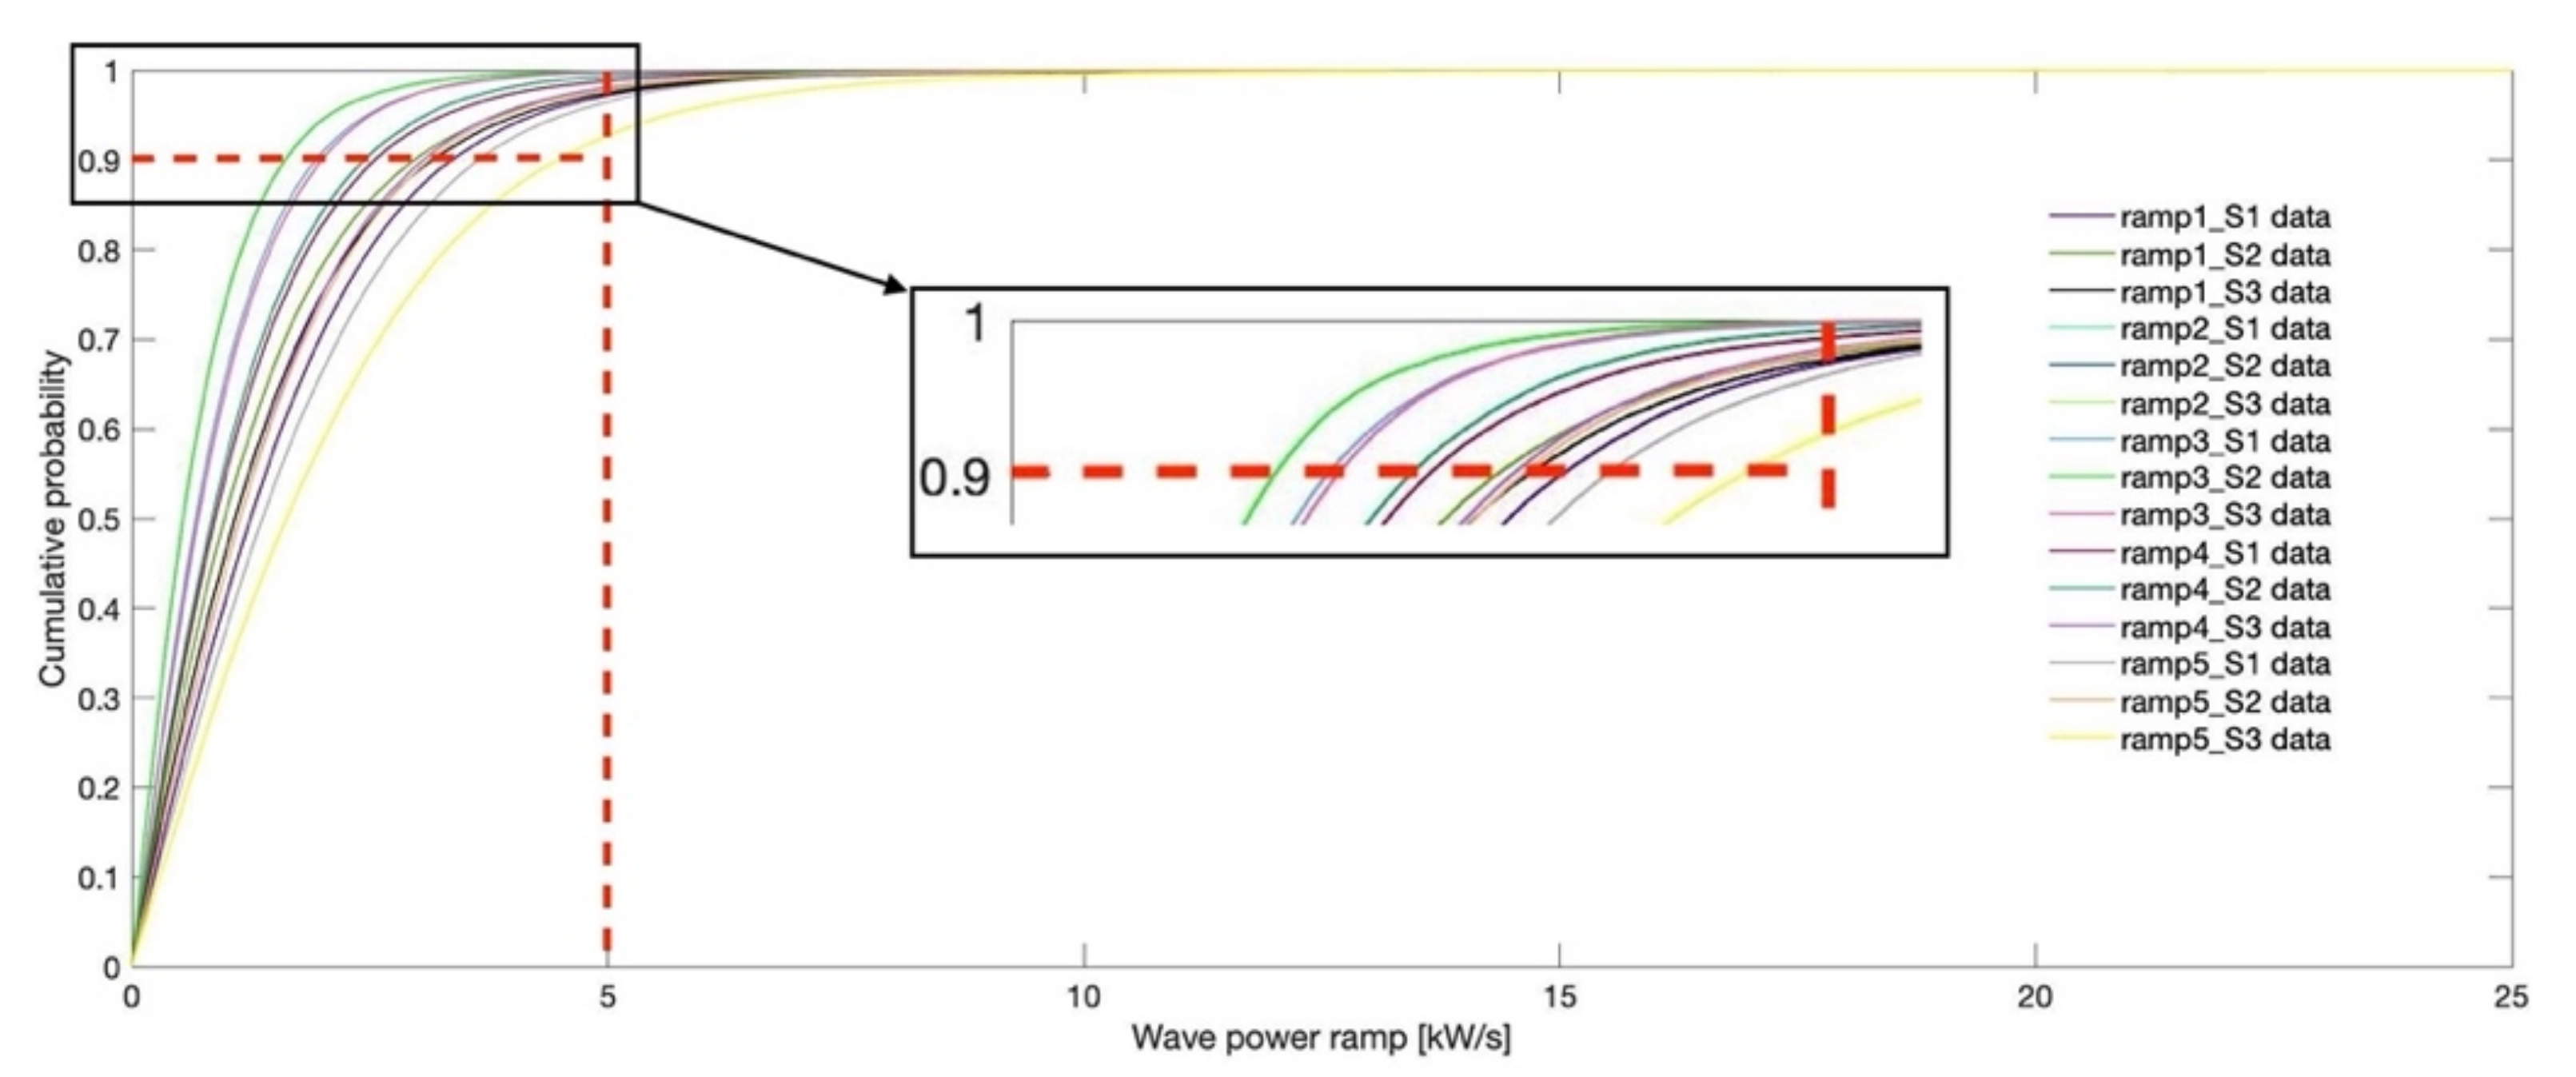
    reducing the power ramp associated to the battery in order to preserve it. Thus, more oscillating power profile is imposed to the flywheel, while a flatter profile is exchanged by the battery, all in the context of reducing the power ramp at the PCC. Our previous research proved that the proposed power management strategy achieves more than 80% ramp at the PCC compared to the original renewable energy source profile and around 70% smoothing regarding the battery profile compared to the flywheel [31]. The wave power ramp cumulative distribution function corresponding to the selected days in all three sites is depicted in Figure 6. It is evident that the wave power ramp values do not exceed 20 kW/s during the monitoring time span in none of the cases. Moreover, in 90% of the occurrences, the power ramp values are under 5 kW/s.
  • Scenario 3—the input power profiles in the SPS model are established based on the Simulink results for the representative days, selecting the correlated wave production, battery and flywheel power from the results, as well as the initial battery and flywheel SoCs. This approach extends the analysis performed over daily basis in the Simulink mathematical model to a more detailed level in the implemented electrical architecture. Given the complexity of the model, the simulation time is restricted to only four seconds. It is highlighted that, taking into account the dynamics of electrical systems and the time response of the HESS components, the behavior of the system can be properly investigated even in such reduced timespan.
    Three simulation scenarios are defined, aiming to observe the dynamic behavior of the HESS coupled to the wave power plant. The scenarios are defined focusing on the most stressful conditions associated to the step-up and step-down wave power variation:
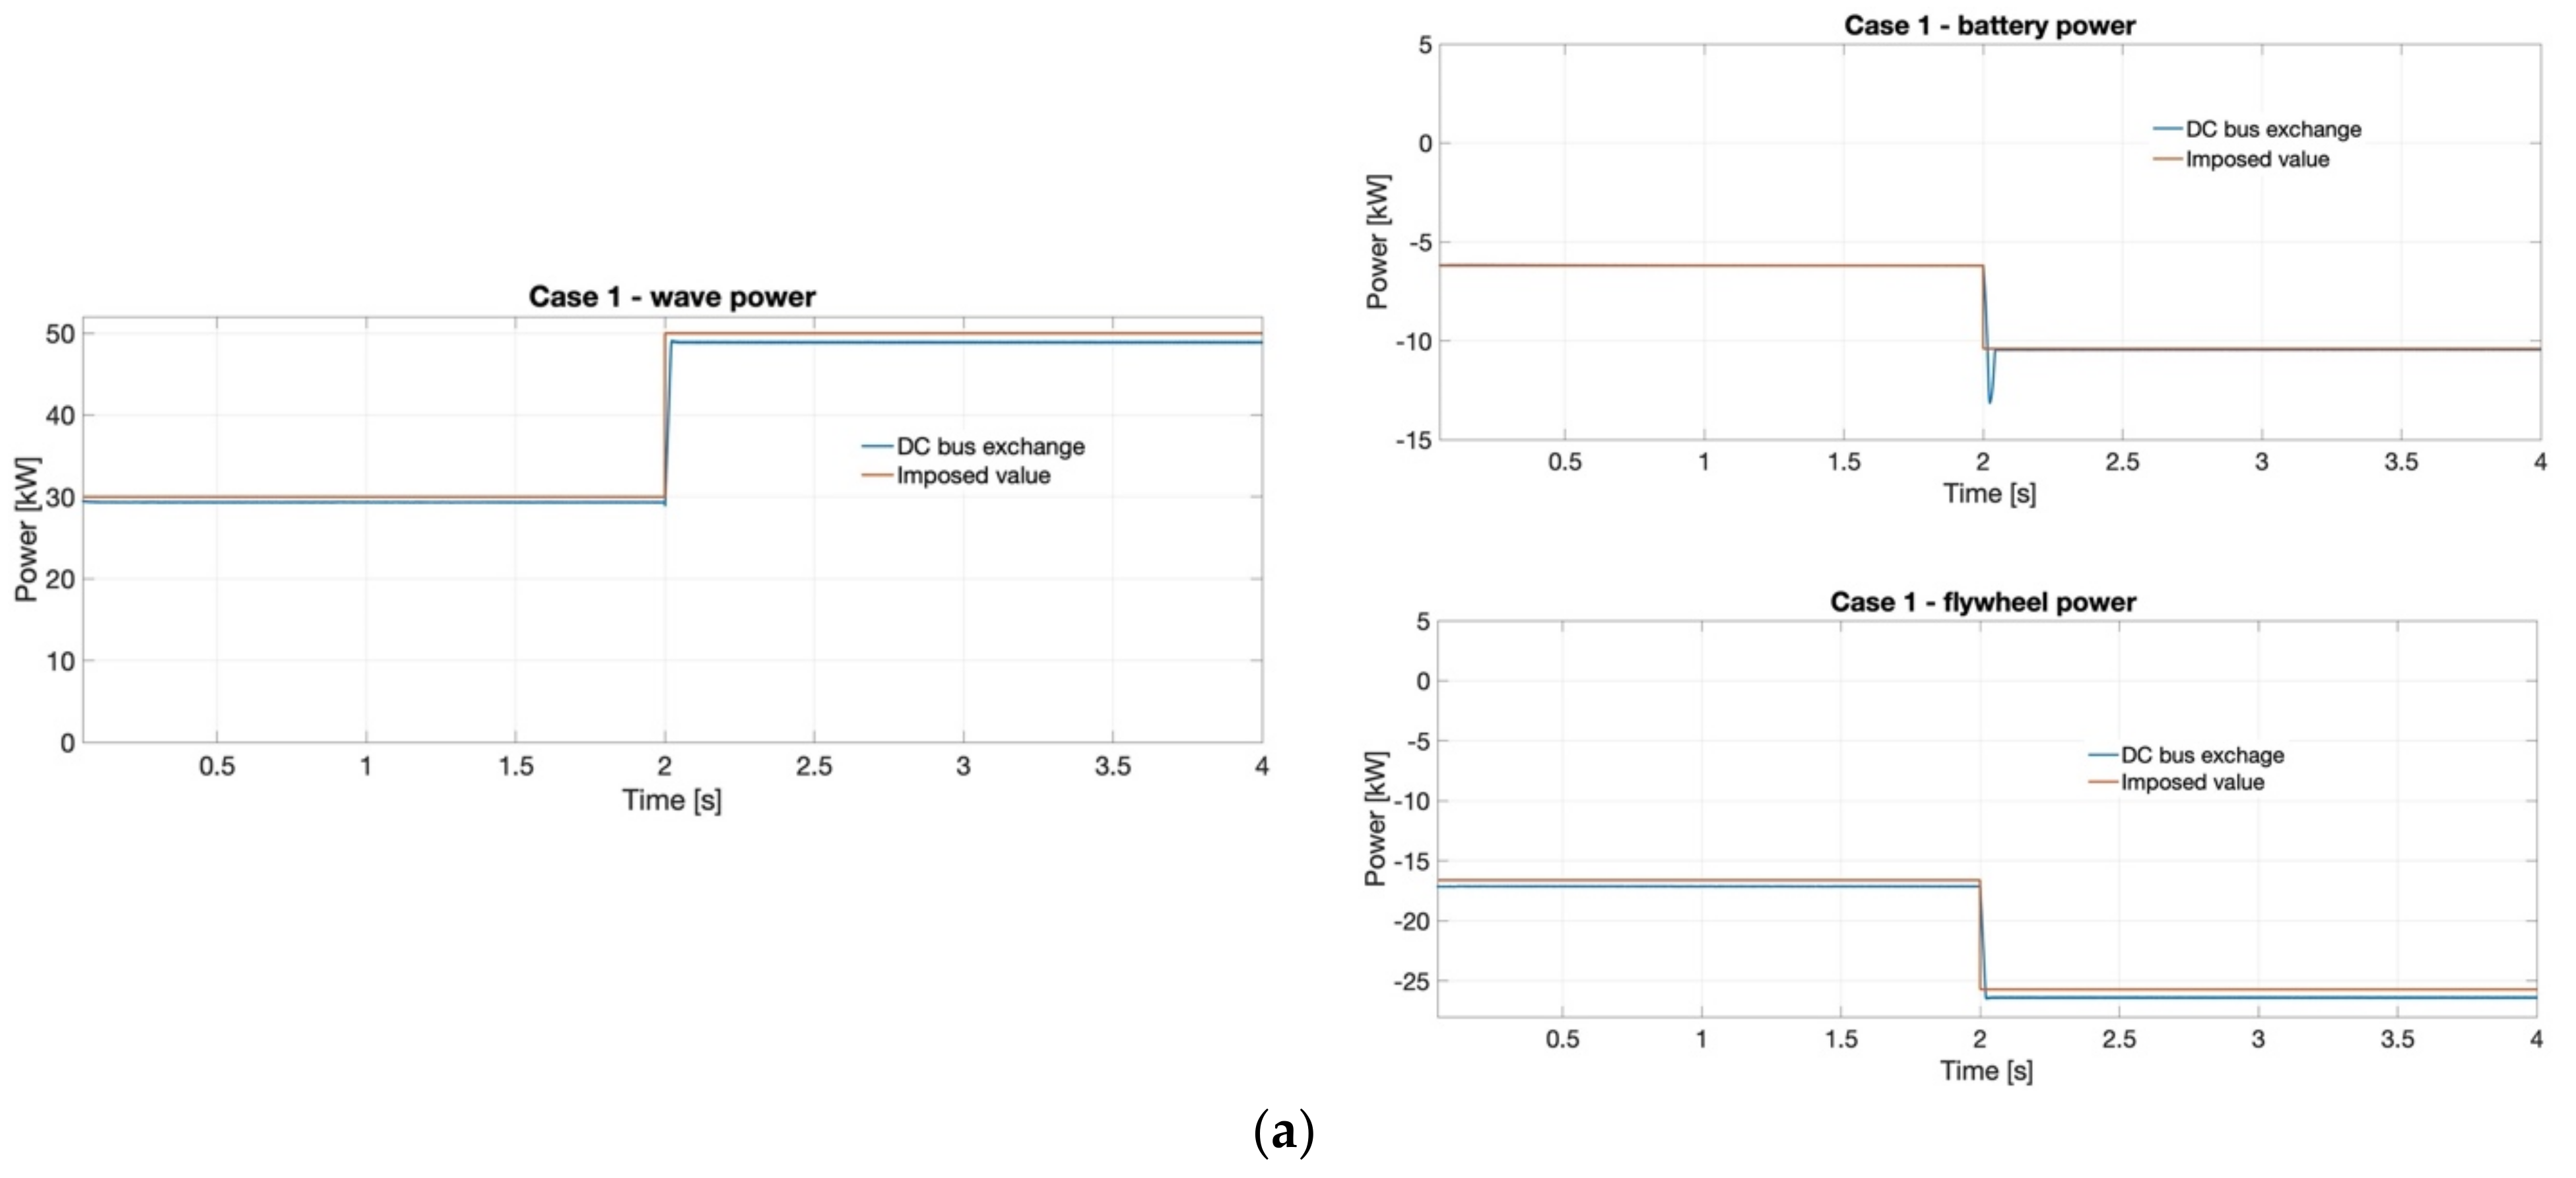
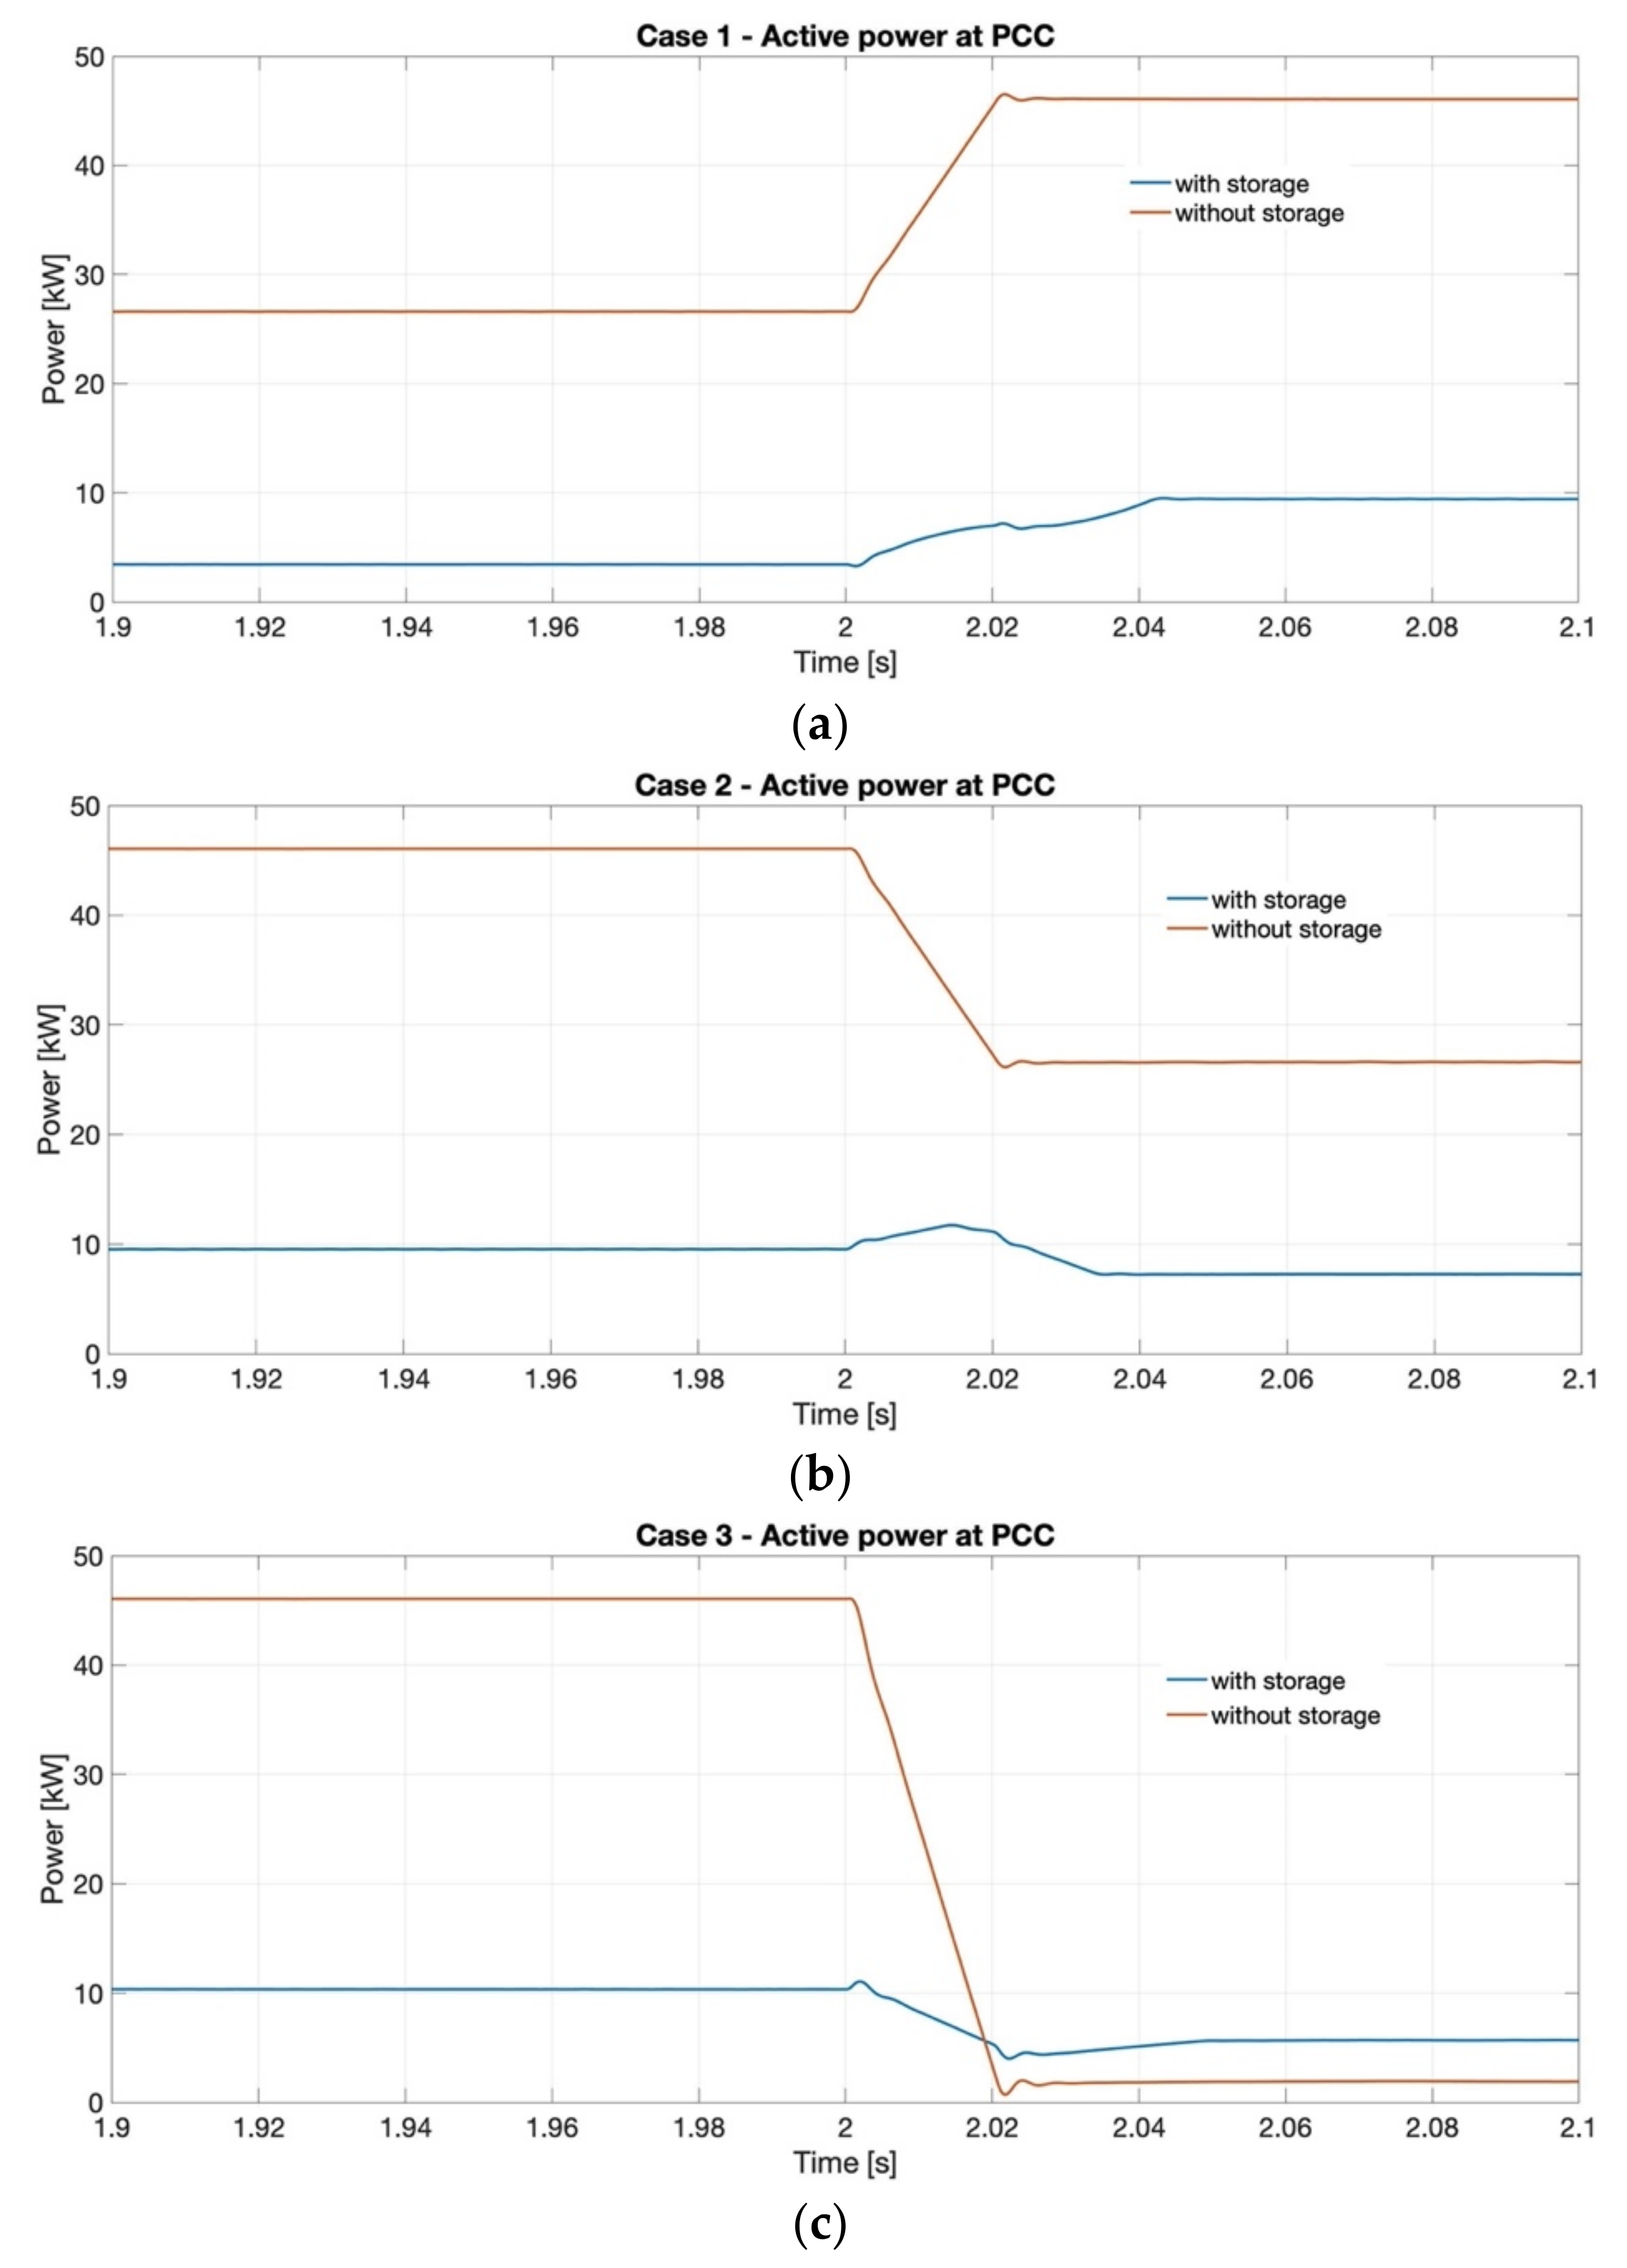
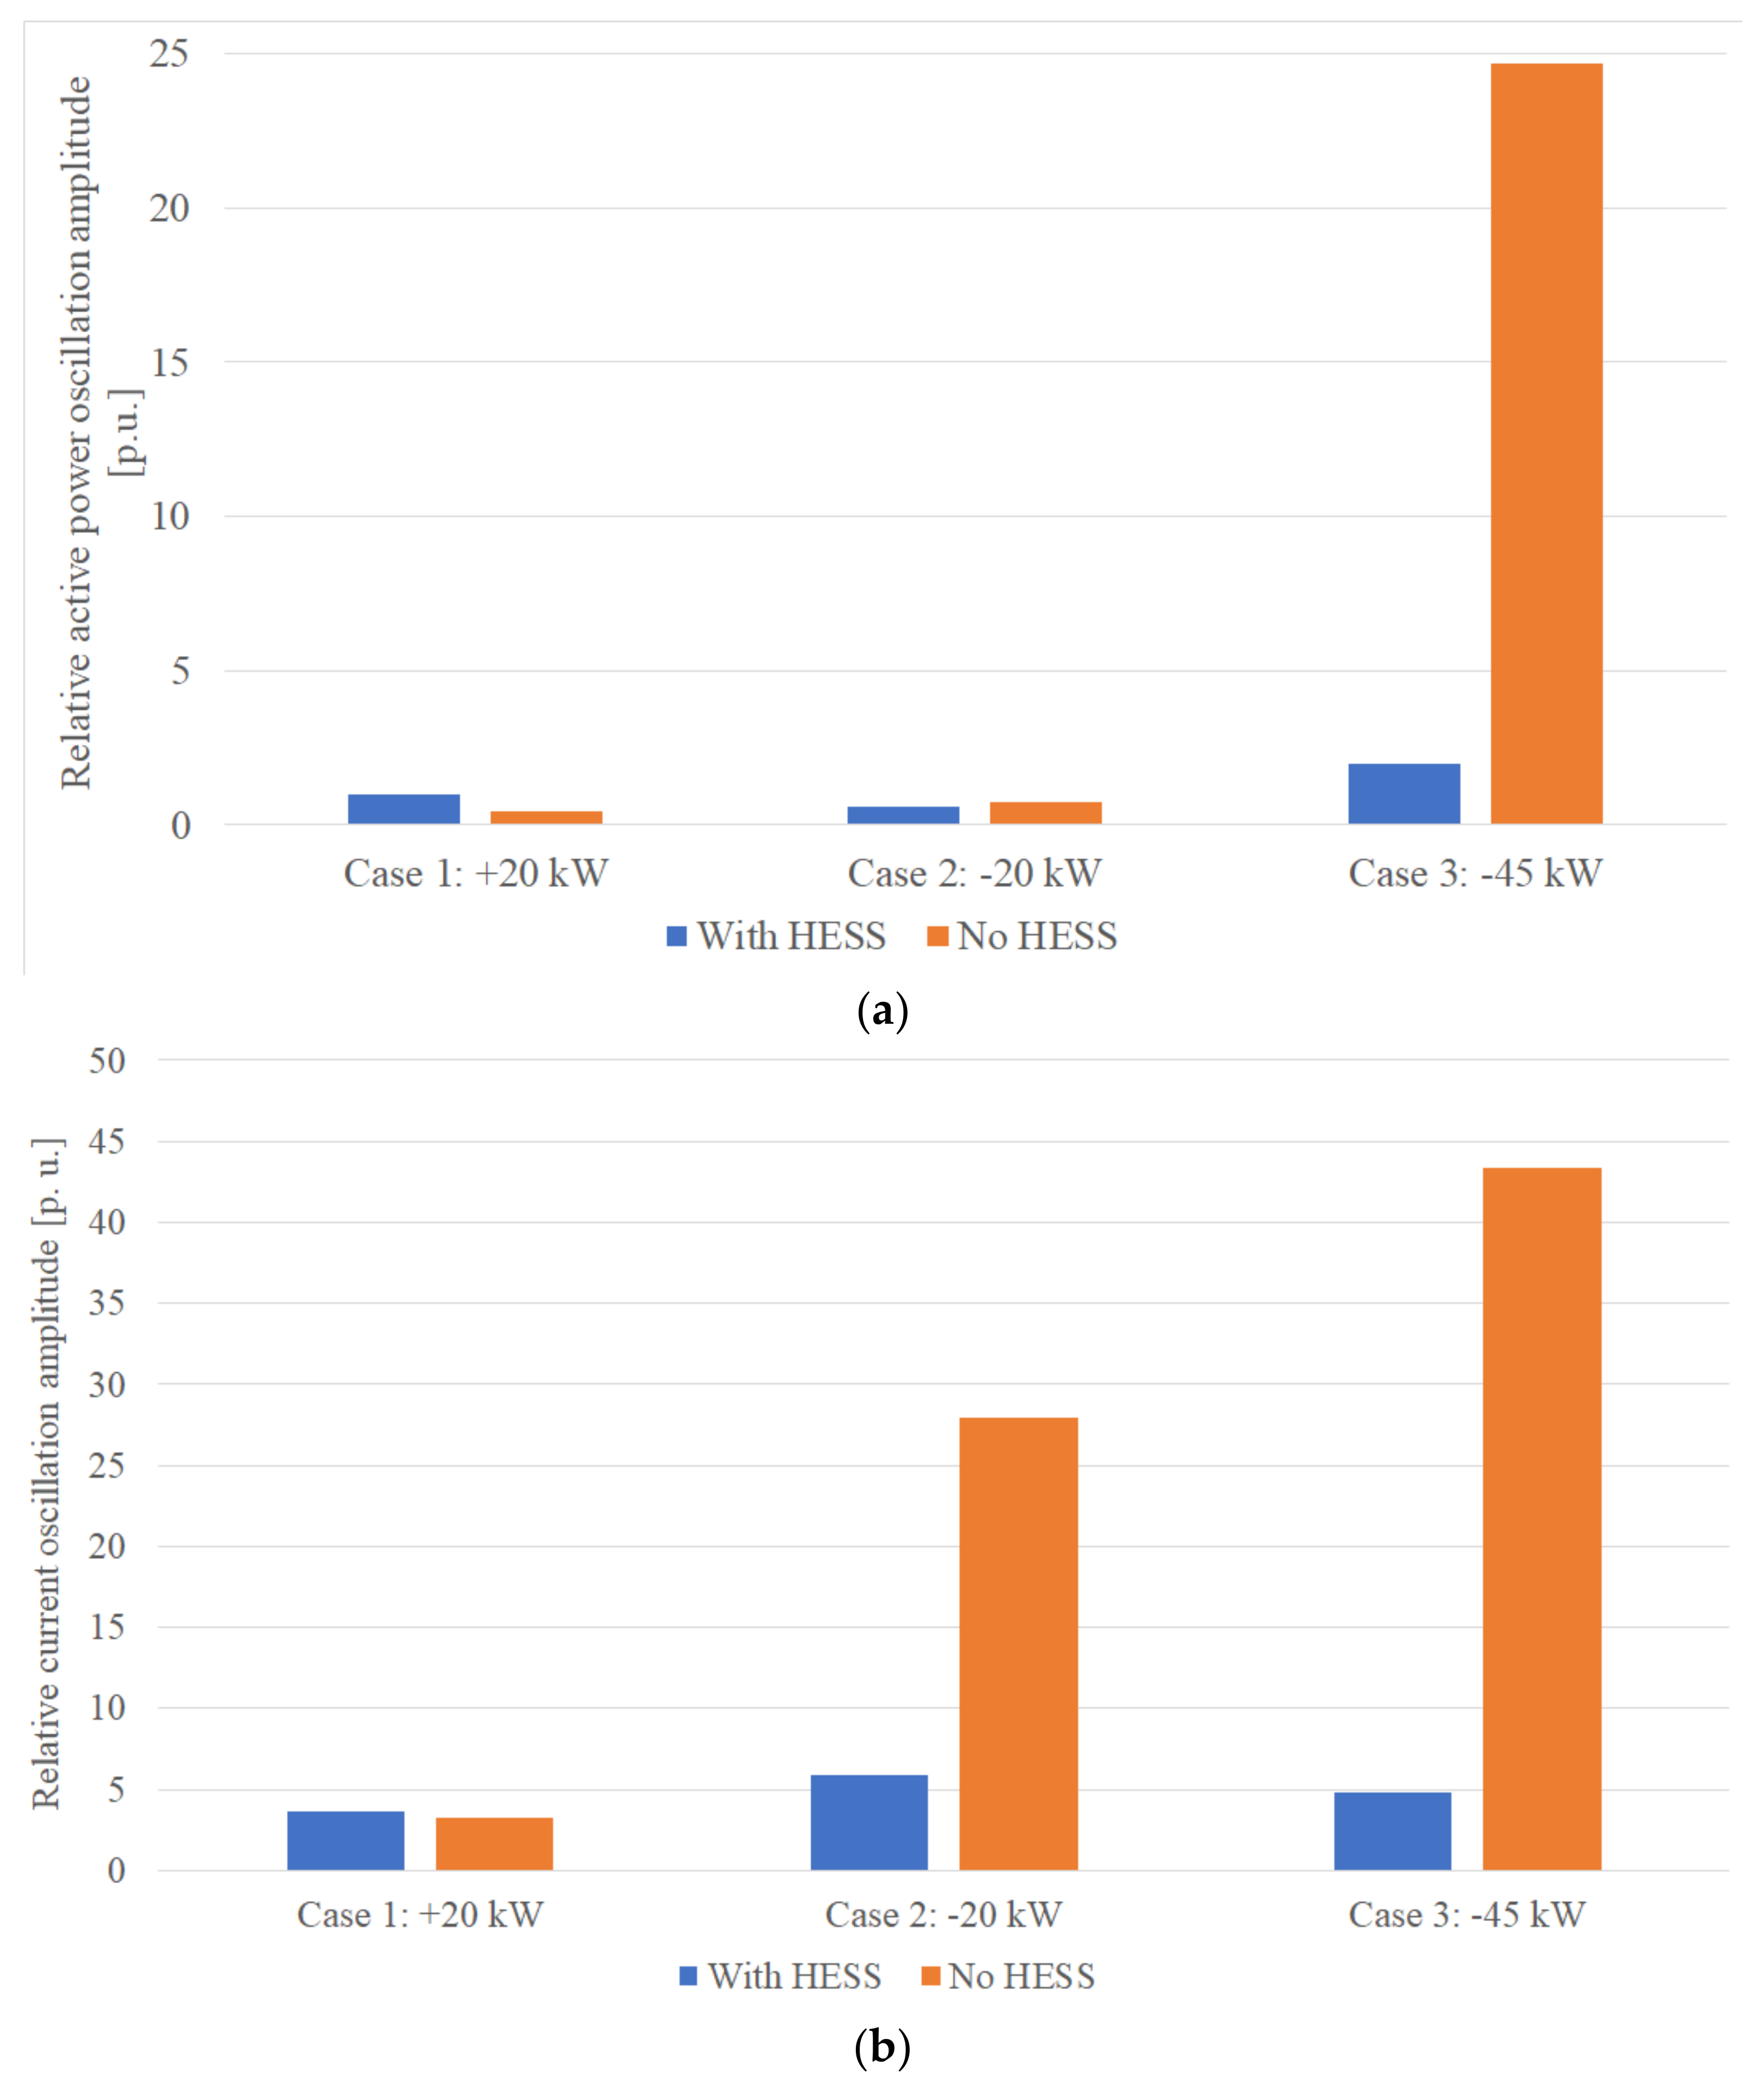
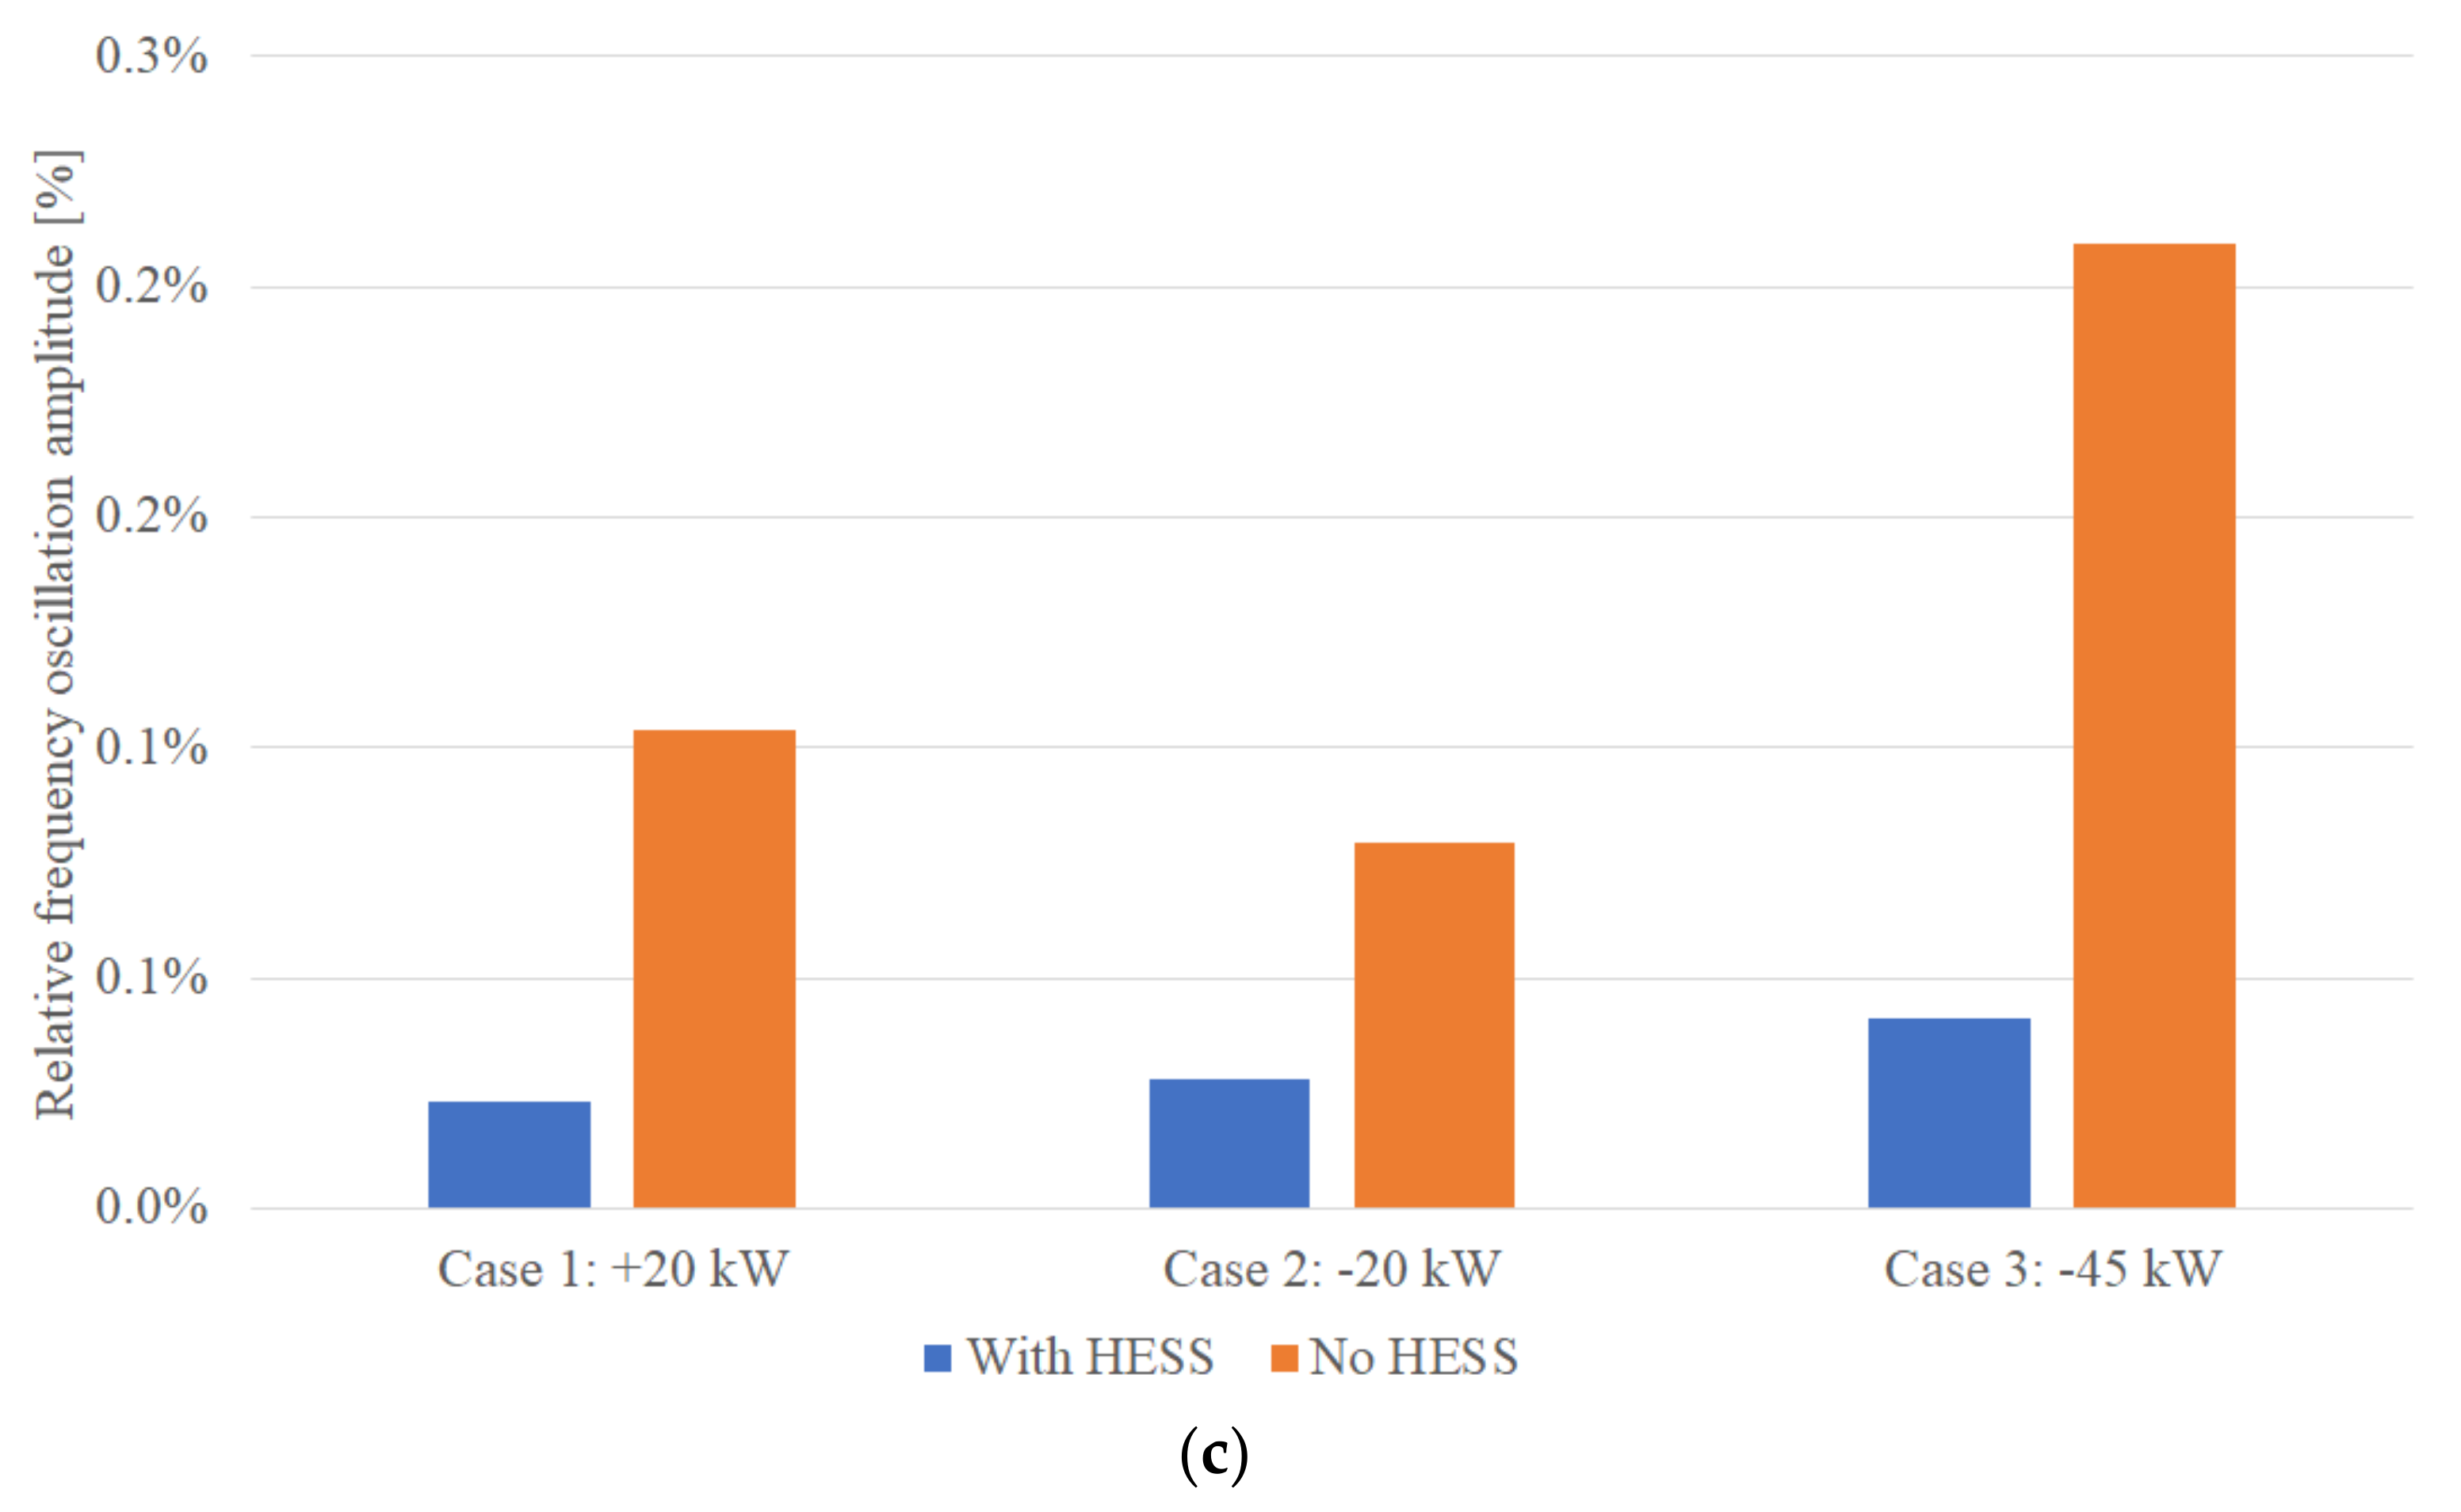
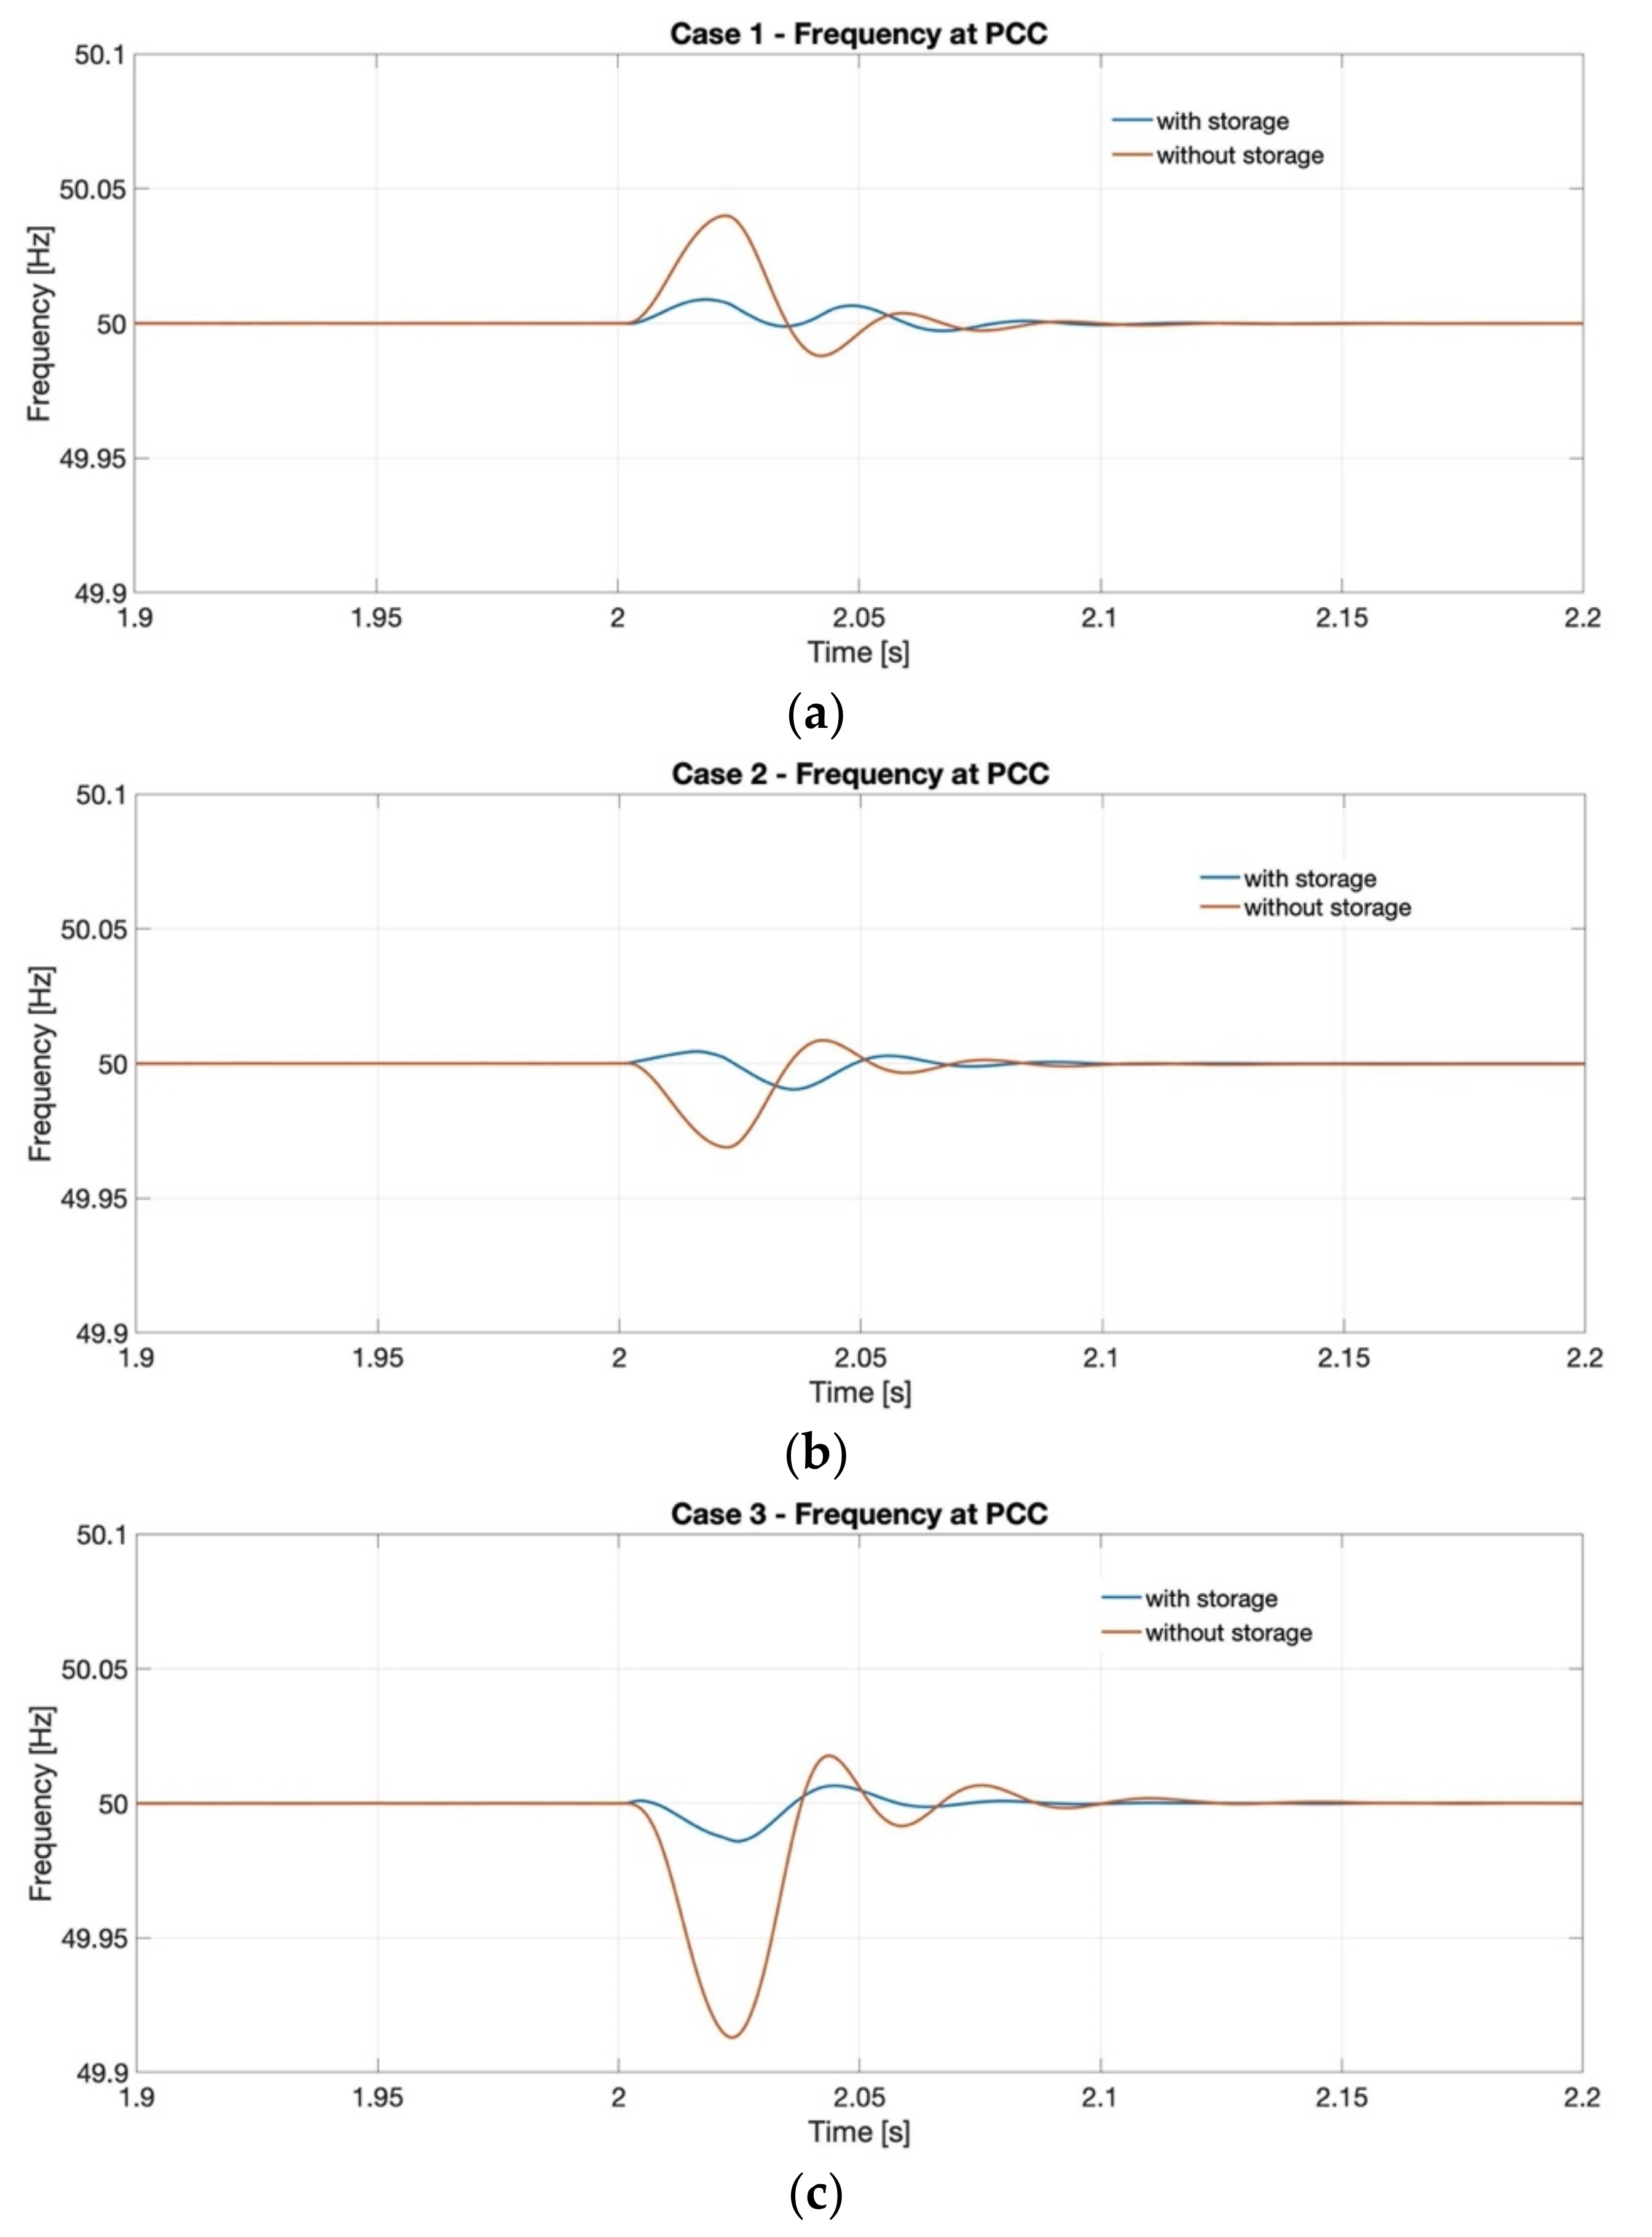
  • Case 1: wave power step-up, the power generated by the wave converter suddenly increases from 30 kW to 50 kW, by 67%. The 20 kW step value is selected based on the power ramp cumulative probability illustrated in Figure 6. To compensate this variation, the HESS components, according to the implemented SPSA power management, start to absorb more power, in order to smooth the power flow at the PCC. Specifically, according to the outcomes of the simulations carried out in the Simulink environment, the flywheel withdraws from the DC bus 9.1 kW more and the battery 4.2 kW more power. Both flywheel and battery keep their charging mode of operation. The power profiles are exhibited in Figure 7a.
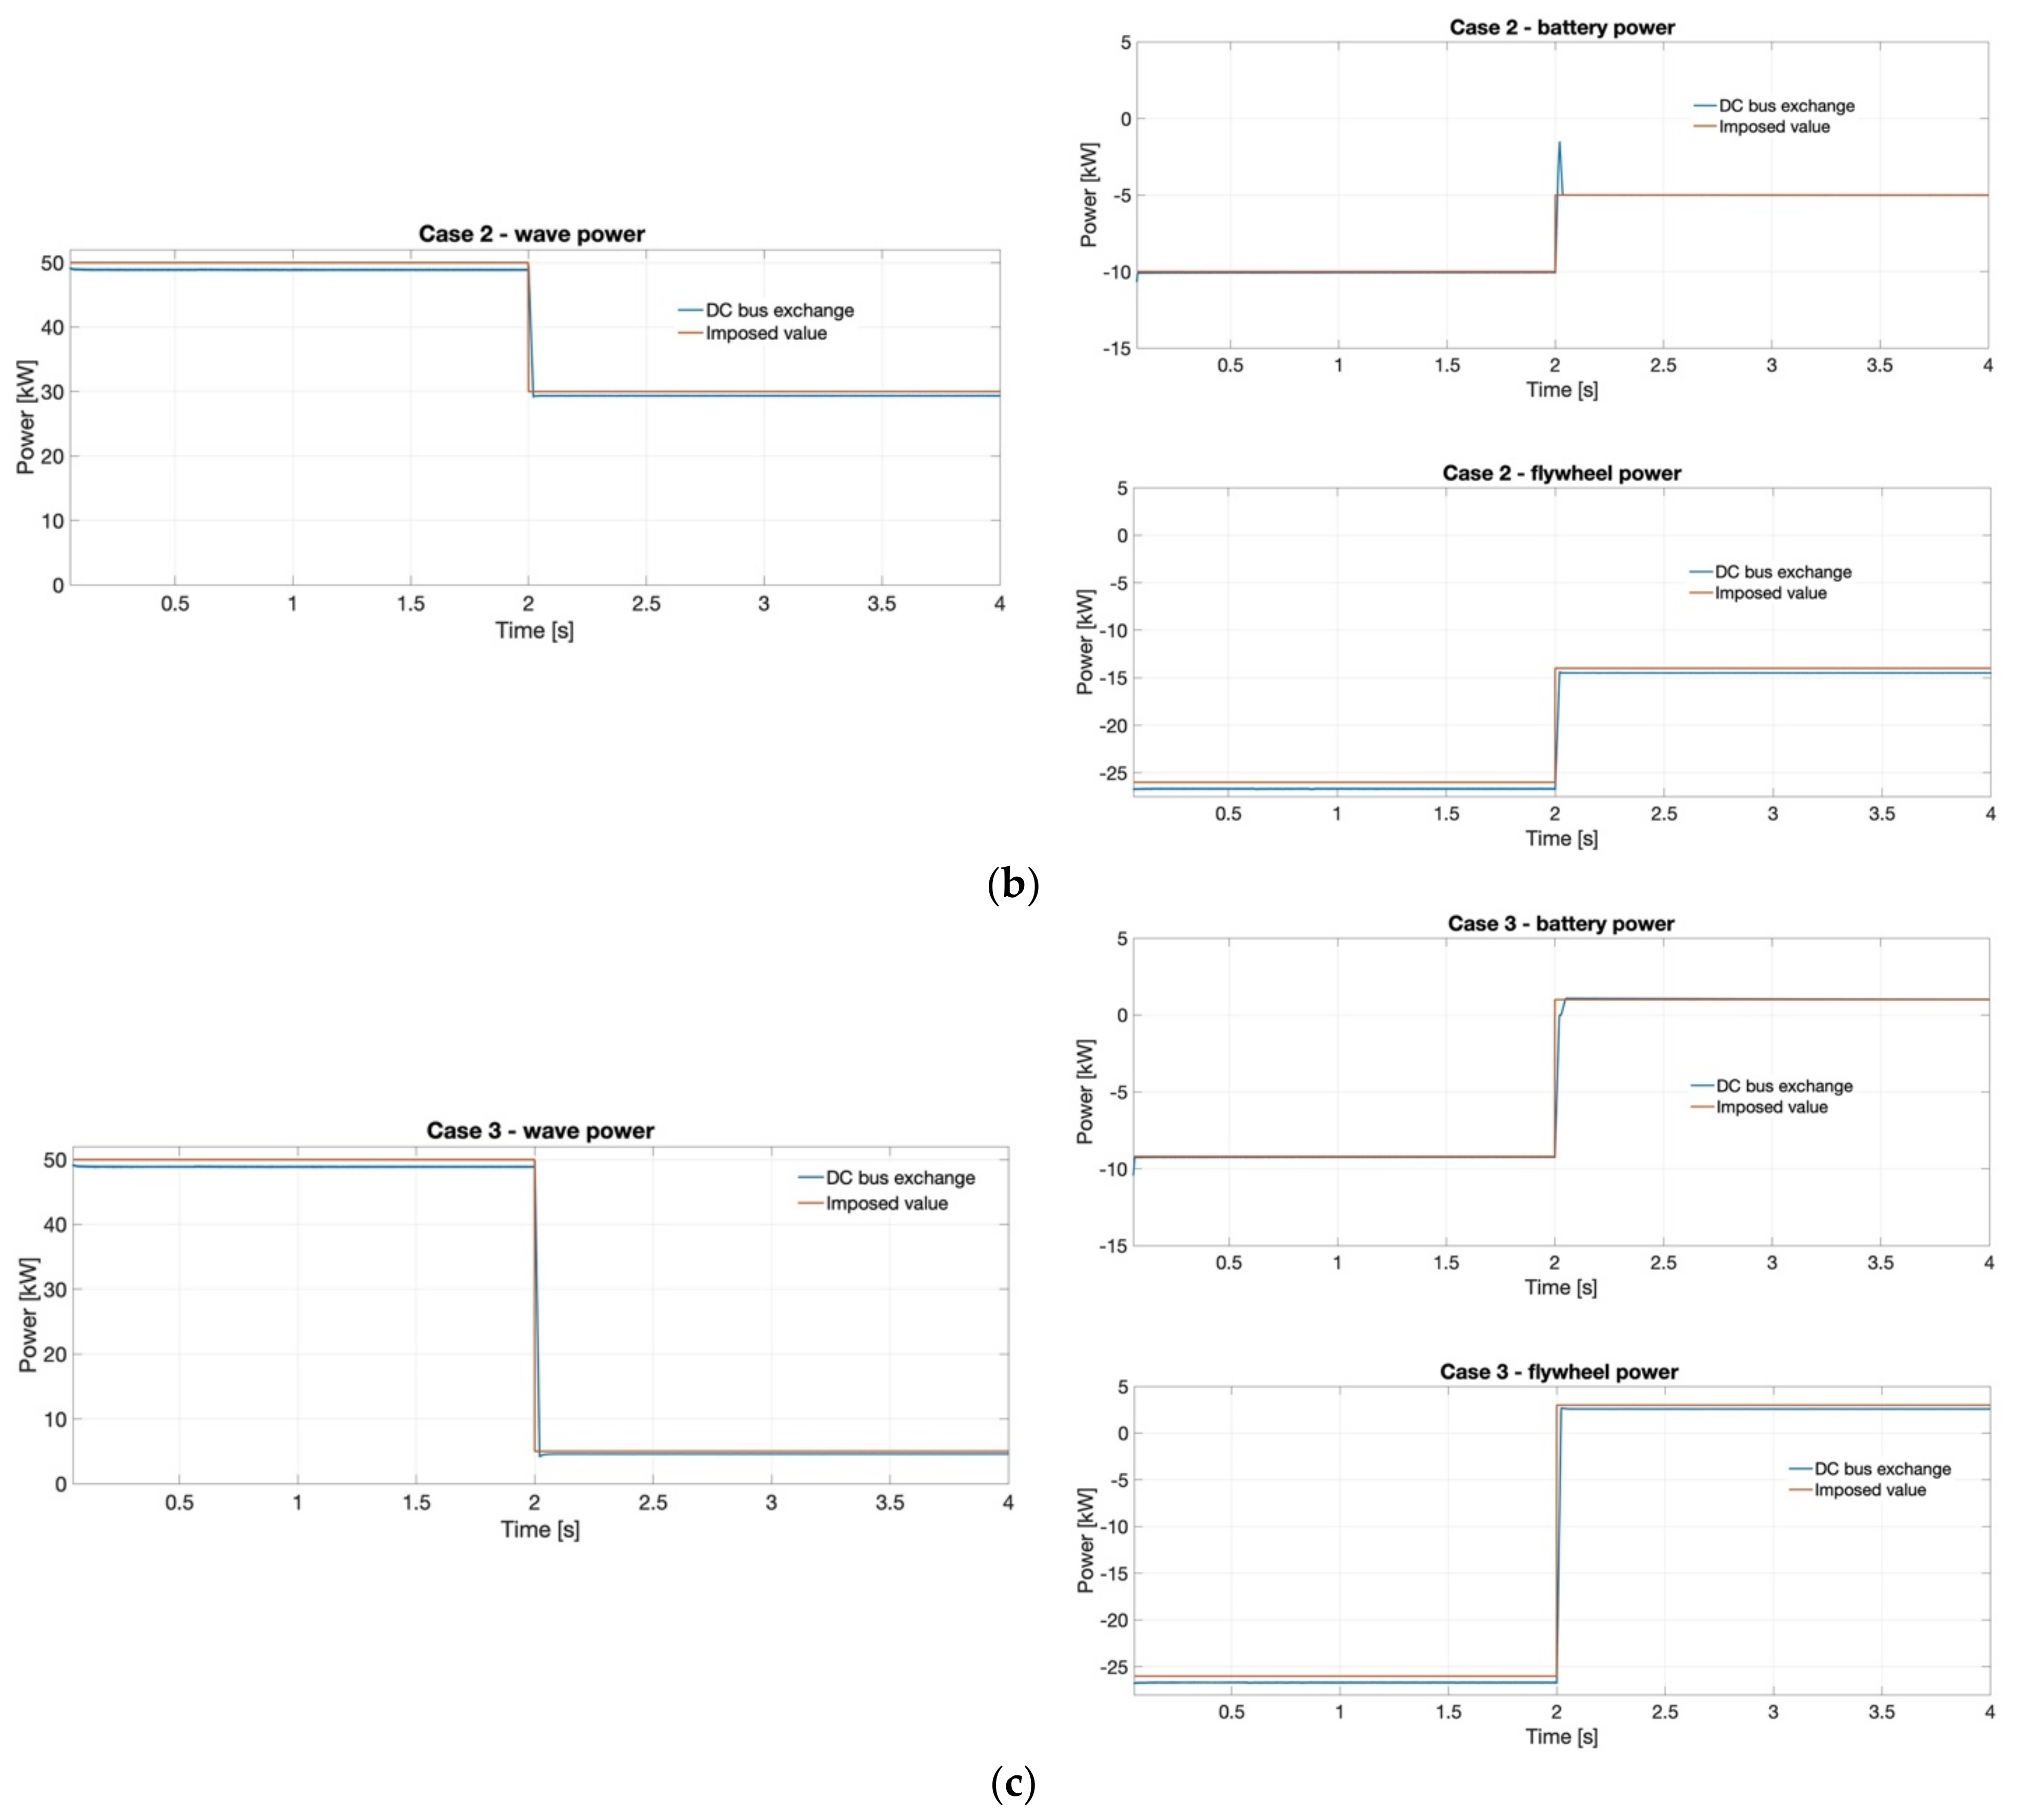
  • Case 2: wave power step-down, the wave converter power drops from 50 kW to 30 kW, simulating symmetrically to Case 1 the 20 kW power step. In this case, both battery and flywheel keep their charging operating mode, but reduce the power they absorb in order to smooth the power flow at the PCC. The flywheel withdraws from the DC bus 12 kW less power and the battery reduce the absorbed power by 5 kW, as depicted in Figure 7b.
  • Case 3: wave power step-down, the wave converter power drops by 90%, from 50 kW to 5 kW. This step value is taken into account as a forward stressing dynamic condition, aiming to prove that the proposed configuration and related power management are operating properly, being capable of coping with even higher fluctuations than expected. Under these circumstances, both battery and flywheel switch their operating modes to discharge, aiming to reduce the difference between the power flow at the PCC. Thus, the flywheel provides 29 kW more power, while the battery increases the delivered power by 10.2 kW, as depicted in Figure 7c.

4. Analysis and Discussion of Results

The main objective concerns the system behavior at the Point of Common Coupling (PCC) in order to prove the benefits introduced by the HESS in smoothing the generated power and consequently assessing the better quality of the power injected to the grid. Such aspect greatly contributes to grid safety and stability of supply. As the objective of the proposed power smoothing approach is to obtain a smoother active power component transmitted to the grid, the performance assessments are made in terms of active power. Moreover, both devices included in the HESS configuration provide a DC output; thus, the reactive power component is not a focus for such investigation, as detailed also in [40,41]. Further, the frequency behavior is analyzed, as an immediate correlation to the active power [42]. Figure 8 depicts the power exchanges at the PCC. As expected, according to the SPSA power management strategy, in case of HESS integration the power ramp is reduced by 68% up to 84% in the three cases, with respect to the case of energy storage absence. According to the simulation results, it is highlighted that the smoothing percent of the power at the PCC compared to the wave production increases with the size of the power step.
In the following, the behavior at the PCC is analyzed in terms of current and voltage frequency response in the three simulation scenarios. According to Figure 9 (single phase current is depicted, given that the network is considered balanced among the three phases), it is noticeable that the HESS coupling introduces, because of the additional converters, a slightly longer current transient. However, as already mentioned for the power exchanges (Figure 8), the steady state value is reduced, the HESS enabling a smoother response to the sudden change in the wave produced power.
For what concerns the voltage frequency, as pictured in Figure 10, a significantly lower peak during the transient is remarked when the HESS is coupled. Specifically, the peak value is reduced by 77% in Case 1, by 64% in Case 2 and by 80% in Case 3 when the largest wave power variation is imposed. It is remarked that, as stated before for the power smoothing performance, the benefits of coupling the HESS to the highly oscillating wave power plant increase with the power ramp at the wave energy converter. Although for the considered system the peak value is under 0.5% in all the investigated scenarios, such impact is very important under the RES increasing integration perspective, particularly highly variable RES such as wave generation. Moreover, the frequency stabilizes faster when the HESS is coupled to the wave power plant, reaching the set value (50 Hz) in a time shorter by 10% in the first scenario, 28% in the second and 42% in the third one. Also in this case the beneficial effect of the HESS integration increases with the solicitation caused by the WEC.
In order to provide an evaluation of the active power oscillation amplitude at the PCC for the investigated simulation scenarios, the relative active power oscillation amplitude is presented in Figure 11a in terms of the ∆P/Pstabilized parameter. It is specified that ∆P is the difference between the maximum and minimum active power value across the transient occurring at the PCC, while Pstabilized is the stabilized value subsequent the step occurrence (see Figure 8). It is highlighted that the evolutionary trends varying the WEC power step are characterized by a strong reduction of the ∆P/Pstabilized values in case the HESS is integrated. Moreover, it is noticeable that coupling the HESS enables a more reduced slope of the trend if compared to the no-storage conditions.
Furthermore, Figure 11b shows the relative current oscillation amplitude, evaluating it as a I / I s t a b i l i z e d r m s , where I represents the difference between the maximum and minimum current values during the transient, while I s t a b i l i z e d r m s is the effective value of the phase A of the current at the stabilization after the transient. A strong difference of the relative current oscillation amplitude is clear, as depicted in Figure 11b, showing that HESS integration enables a reduced ratio of the evaluated parameter at the PCC, with greater benefits increasing the power step at the WEC terminals. Thus, a smoother interaction with the grid is remarked when compared with the no-storage conditions.
Finally, the relative frequency oscillation amplitude is depicted in Figure 11c. This quantity is evaluated as the ratio between the frequency oscillation amplitude and the nominal value (i.e., 50 Hz) achieved after stabilization, f / f n o m , where f = f m a x f m i n t r a n s i e n t . Comparing the storage/no-storage conditions, it is evident that the ESS (in particular HESS) integration ensures a considerably smoother frequency behavior in dynamic conditions at PCC.

5. Conclusions

In this paper, a DC bus topology electrical architecture model consisting of a Li-ion battery-flywheel HESS coupled to a wave energy converter is presented. Specifically, this study aims to investigate, through a comparative analysis, the beneficial effects in terms of voltage waveform frequency and current transient behavior at the PCC introduced by HESS under specific stressful production conditions. A proper model was implemented in SimPowerSystems environment and simulations were carried out according to specific stressful scenarios, assessing the benefits introduced by the HESS in the developed electrical architecture topology. Furthermore, it is also proven that DC bus topology fits well to RES applications because of its easy management, high power quality, reduced number of power converters and no presence of reactive power. As matter of fact, thanks to the HESS introduction in the DC bus where the WEC is connected, it is demonstrated that the peak value of the voltage wave frequency at the PCC is reduced respectively by 77%, by 64% and by 80% in the three case studies with a faster stabilization with respect to storage absence, reaching the nominal value in a shorter time (up to 42% of reduction for the largest WEC power sudden variation). Moreover, the achieved results reflect the outcomes of our previous paper concerning the application of HESS to a WEC with a proper power management strategy based on SPSA, with the purpose of smoothing the power oscillations sent to the grid.
Thus, in the framework of massive RES penetration all over the world, HESS integration in wave energy converters can strongly reduce safety and stability issues relating to intermittent and fluctuating wave production in the main grid, significantly contributing to the expected increasing share of electricity from renewables.
Future research works will be addressed to the experimental validation and techno-economic assessment of storage integration in coupling to WECs in order to evaluate the feasibility and competitiveness of such a plant.

Author Contributions

Conceptualization, L.B. and D.Z.; methodology, D.P., D.A.C. and L.B.; software, D.A.C.; validation, D.P. and D.A.C.; formal analysis, L.B., D.A.C., P.A.O. and D.P.; investigation, D.A.C., D.P. and L.B.; data curation, P.A.O., D.P. and D.A.C.; writing—original draft preparation, D.P. and D.A.C.; writing—review and editing, L.B., E.C. and M.L. All authors have read and agreed to the published version of the manuscript.

Funding

This research was funded by the Research Fund for the Italian Electrical System under the Contract Agreement “Accordo di Programma 2019-2021-PTR_19_21_ENEA_PRG_10” between ENEA and the Ministry of Economic Development.

Conflicts of Interest

The authors declare no conflict of interest.

References

  1. Sabzehgar, R.; Moallem, M. A review of ocean wave energy conversion systems. In Proceedings of the 2009 IEEE Electrical Power & Energy Conference (EPEC), Montreal, QC, Canada, 22–23 October 2009. [Google Scholar]
  2. Sandberg, A.B.; Klementsen, E.; Muller, G.; de Andres, A.; Maillet, J. Critical factors influencing viability ofwave energy converters in off-grid luxury resorts and small utilities. Sustainability 2016, 8, 1274. [Google Scholar] [CrossRef] [Green Version]
  3. OES. Annual Report 2020. Available online: https://www.ocean-energy-systems.org/about-us/annual-report/ (accessed on 15 December 2021).
  4. Felix, A.; Hernández-Fontes, J.V.; Lithgow, D.; Mendoza, E.; Posada, G.; Ring, M.; Silva, R. Wave energy in tropical regions: Deployment challenges, environmental and social perspectives. J. Mar. Sci. Eng. 2019, 7, 219. [Google Scholar] [CrossRef] [Green Version]
  5. Reikard, G. Integrating wave energy into the power grid: Simulation and forecasting. Ocean Eng. 2013, 73, 168–178. [Google Scholar] [CrossRef]
  6. Polinder, H.; Scuotto, M. Wave Energy Converters and their Impact on Power Systems. In Proceedings of the 2005 International Conference on Future Power Systems, Amsterdam, The Netherlands, 18 November 2005; p. 9. [Google Scholar]
  7. O’Sullivan, D.L.; Dalton, G. Challenges in the Grid Connection of Wave Energy Devices. In Proceedings of the 8th European Wave and Tidal Energy Conference, Uppsala, Sweden, 7–10 September 2009; pp. 12–20. [Google Scholar]
  8. Barelli, L.; Bidini, G.; Bonucci, F.; Castellini, L.; Castellini, S.; Ottaviano, A.; Pelosi, D.; Zuccari, A. Dynamic Analysis of a Hybrid Energy Storage System (H-ESS) Coupled to a Photovoltaic (PV) Plant. Energies 2018, 11, 396. [Google Scholar] [CrossRef] [Green Version]
  9. Das, C.K.; Bass, O.; Kothapalli, G.; Mahmoud, T.S.; Habibi, D. Overview of energy storage systems in distribution networks: Placement, sizing, operation, and power quality. Renew. Sustain. Energy Rev. 2018, 91, 1205–1230. [Google Scholar] [CrossRef]
  10. Díaz-Gonźalez, F.; Del-Rosario-Calaf, G.; Girbau-Llistuella, F.; Gomis-Bellmunt, O. Short-term energy storage for power quality improvement in weak MV grids with distributed renewable generation. In Proceedings of the 2016 IEEE PES Innovative Smart Grid Technologies Conference Europe (ISGT-Europe), Ljubljana, Slovenia, 9–12 October 2016. [Google Scholar]
  11. Mundackal, J.A.; Varghese, A.C.; Sreekala, P.; Reshmi, V. Grid power quality improvement and battery energy storage in wind energy systems. In Proceedings of the 2013 Annual International Conference on Emerging Research Areas and 2013 International Conference on Microelectronics, Communications and Renewable Energy, Kanjirapally, India, 4–6 June 2013. [Google Scholar]
  12. Faisal, M.; Hannan, M.A.; Ker, P.J.; Hussain, A.; Bin Mansor, M.; Blaabjerg, F. Review of energy storage system technologies in microgrid applications: Issues and challenges. IEEE Access 2018, 6, 35143–35164. [Google Scholar] [CrossRef]
  13. Wu, F.; Zhang, X.P.; Ju, P. Application of the Battery Energy Storage in Wave Energy Conversion system. In Proceedings of the 2009 International Conference on Sustainable Power Generation and Supply, Nanjing, China, 6–7 April 2009; pp. 29–32. [Google Scholar]
  14. Murray, D.B.; Egan, M.G.; Hayes, J.G.; Sullivan, D.L.O. Applications of Supercapacitor Energy Storage for a Wave Energy Converter System. In Proceedings of the Eighth European Wave and Tidal Energy Conference, Uppsala, Sweden, 7–11 September 2009; pp. 786–795. [Google Scholar]
  15. Aubry, J.; Bydlowski, P.; Multon, B.; Ben Ahmed, H.; Borgarino, B. Energy Storage System Sizing for Smoothing Power Generation of Direct Wave Energy Converters. In Proceedings of the 3rd International Conference Ocean Energy, Bilbao, Spain, 6–9 October 2010; pp. 1–7. [Google Scholar]
  16. Sjolte, J.; Tjensvoll, G.; Molinas, M. All-electric Wave Energy Converter array with energy storage and reactive power compensation for improved power quality. In Proceedings of the 2012 IEEE Energy Conversion Congress and Exposition (ECCE), Raleigh, NC, USA, 15–20 September 2012; pp. 954–961. [Google Scholar]
  17. De Koker, K.L.; Crevecoeur, G.; Meersman, B.; Vantorre, M.; Vandevelde, L. Energy storage system for off-grid testing of a Wave Energy Converter. In Proceedings of the 2016 IEEE International Energy Conference (ENERGYCON), Leuven, Belgium, 4–8 April 2016; pp. 1–5. [Google Scholar]
  18. Zhou, X.; Abdelkhalik, O.; Weaver, W. Power take-off and energy storage system static modeling and sizing for direct drive wave energy converter to support ocean sensing applications. J. Mar. Sci. Eng. 2020, 8, 513. [Google Scholar] [CrossRef]
  19. Brando, G.; Dannier, A.; Del Pizzo, A.; Di Noia, L.P.; Pisani, C. Grid connection of wave energy converter in heaving mode operation by supercapacitor storage technology. IET Renew. Power Gener. 2016, 10, 88–97. [Google Scholar] [CrossRef]
  20. Moreno-Torres, P.; Blanco, M.; Navarro, G.; Lafoz, M. Power smoothing system for wave energy converters by means of a supercapacitor-based energy storage system. In Proceedings of the 2015 17th European Conference on Power Electronics and Applications (EPE’15 ECCE-Europe), Geneva, Switzerland, 8–10 September 2015. [Google Scholar]
  21. Barelli, L.; Bidini, G.; Cherubini, P.; Micangeli, A.; Pelosi, D.; Tacconelli, C. How hybridization of energy storage technologies can provide additional flexibility and competitiveness to microgrids in the context of developing countries. Energies 2019, 12, 3138. [Google Scholar] [CrossRef] [Green Version]
  22. Nie, Z.; Xiao, X.; Yi, H.; Kang, Q. Direct drive wave energy converters integrated with a composite energy storage system. In Proceedings of the 2011 International Conference on Electrical Machines and Systems, Beijing, China, 20–23 August 2011; pp. 2–6. [Google Scholar]
  23. Nie, Z.; Xiao, X.; Kang, Q.; Aggarwal, R.; Zhang, H.; Yuan, W. SMES-Battery energy storage system for conditioning outputs from direct drive linear wave energy converters. IEEE Trans. Appl. Supercond. 2013, 23, 5000705. [Google Scholar]
  24. Artal-Sevil, J.S.; Martinez-Lopez, D.; Guillen-Asensio, A.; Dominguez-Navarro, J.A. Wave Energy Converter model based on a decentralized Hybrid Energy Storage System with MPPT control algorithm. In Proceedings of the 2020 Fifteenth International Conference on Ecological Vehicles and Renewable Energies (EVER), Monte-Carlo, Monaco, 10–12 September 2020. [Google Scholar]
  25. Parwal, A.; Fregelius, M.; Temiz, I.; Göteman, M.; de Oliveira, J.G.; Boström, C.; Leijon, M. Energy management for a grid-connected wave energy park through a hybrid energy storage system. Appl. Energy 2018, 231, 399–411. [Google Scholar] [CrossRef]
  26. Barelli, L.; Bidini, G.; Pelosi, D.; Ciupageanu, D.A.; Cardelli, E.; Castellini, S.; Lăzăroiu, G. Comparative analysis of AC and DC bus configurations for flywheel-battery HESS integration in residential micro-grids. Energy 2020, 204, 117939. [Google Scholar] [CrossRef]
  27. Kermani, M.; Adelmanesh, B.; Shirdare, E.; Sima, C.A.; Carnì, D.L.; Martirano, L. Intelligent Energy Management Based on SCADA System in a Real Microgrid for Smart Building Applications. Renew. Energy 2021, 171, 1115–1127. [Google Scholar] [CrossRef]
  28. Elmouatamid, A.; Ouladsine, R.; Bakhouya, M.; El Kamoun, N.; Khaidar, M.; Zine-Dine, K. Review of Control and Energy Management Approaches in Micro-Grid Systems. Energies 2021, 14, 168. [Google Scholar] [CrossRef]
  29. Fotopoulou, M.; Rakopoulos, D.; Trigkas, D.; Stergiopoulos, F.; Blanas, O.; Voutetakis, S. State of the Art of Low and Medium Voltage Direct Current (DC) Microgrids. Energies 2021, 14, 5595. [Google Scholar] [CrossRef]
  30. González, I.; Calderón, A.J.; Portalo, J.M. Innovative Multi-Layered Architecture for Heterogeneous Automation and Monitoring Systems: Application Case of a Photovoltaic Smart Microgrid. Sustainability 2021, 13, 2234. [Google Scholar] [CrossRef]
  31. Linda, B.; Gianni, B.; Alexandra, C.D.; Andrea, O.; Dario, P.; Federico, G.; Giacomo, A.; Mairead, A.C. An effective solution to boost generation from waves: Benefits of HESS integration to wave energy converter in grid-connected systems. Zenodo 2021. [Google Scholar] [CrossRef]
  32. IEC 60038-2009. IEC Standard Voltages. Available online: https://standards.iteh.ai/catalog/standards/iec/bd26a0a9-bf9f-4094-9ab3-0401e5c3ad69/iec-60038-2009 (accessed on 15 December 2021).
  33. Schmitt, P.; Windt, C.; Nicholson, J.; Elsässer, B. Development and validation of a procedure for numerical vibration analysis of an oscillating wave surge converter. Eur. J. Mech.-B/Fluids 2016, 58, 9–19. [Google Scholar] [CrossRef] [Green Version]
  34. MathWorks Italia. Generic Battery Model—Simulink. Available online: https://it.mathworks.com/help/physmod/sps/powersys/ref/battery.html (accessed on 1 December 2021).
  35. Jongerden, M.R.; Haverkort, B.R. Which battery model to use? IET Softw. 2009, 3, 445–457. [Google Scholar] [CrossRef] [Green Version]
  36. LG, Datasheet LG RESU10H. Available online: https://lghomebatteryblog.eu/it/downloads_it/ (accessed on 15 December 2021).
  37. Price, W.W.; Taylor, C.W.; Rogers, G.J. Standard load models for power flow and dynamic performance simulation. IEEE Trans. Power Syst. 1995, 10, 3. [Google Scholar]
  38. Barelli, L.; Ciupageanu, D.A.; Ottaviano, A.; Pelosi, D.; Lazaroiu, G. Stochastic power management strategy for hybrid energy storage systems to enhance large scale wind energy integration. J. Energy Storage 2020, 31, 101650. [Google Scholar] [CrossRef]
  39. Barelli, L.; Bidini, G.; Ciupageanu, D.A.; Micangeli, A.; Ottaviano, P.A.; Pelosi, D. Real time power management strategy for hybrid energy storage systems coupled with variable energy sources in power smoothing applications. Energy Rep. 2021, 7, 2872–2882. [Google Scholar] [CrossRef]
  40. Barra, P.H.A.; de Carvalho, W.C.; Menezes, T.S.; Fernandes, R.A.S.; Coury, D.V. A review on wind power smoothing using high-power energy storage systems. Renew. Sustain. Energy Rev. 2021, 137, 110455. [Google Scholar] [CrossRef]
  41. Suvire, G.O.; Molina, M.G.; Mercado, P.E. Improving the integration of wind power generation into AC microgrids using flywheel energy storage. IEEE Trans. Smart Grid 2012, 3, 1945–1954. [Google Scholar] [CrossRef]
  42. Sebastián, R.; Peña-Alzola, R. Flywheel energy storage and dump load to control the active power excess in a wind diesel power system. Energies 2020, 13, 8. [Google Scholar] [CrossRef] [Green Version]
Figure 1. Schematic layout of the modelled system: (a) conceptual configuration and (b) Simscape/SimPowerSystems implementation.
Energies 15 00010 g001
Figure 2. Schematic view of an oscillating wave surge converter.
Energies 15 00010 g002
Figure 3. Wave Energy Converter (WEC) generator section.
Energies 15 00010 g003
Figure 4. Li-Ion battery subsystem and its buck-boost converter, adapted with permission from [26], Elsevier, 2020.
Energies 15 00010 g004
Figure 5. Flywheel and electric machine modeling.
Energies 15 00010 g005
Figure 6. Cumulative density function of the wave power ramp.
Energies 15 00010 g006
Figure 7. Wave power and HESS power (battery and flywheel power) for different case study: (a) Case 1, (b) Case 2 and (c) Case 3.
Energies 15 00010 g007aEnergies 15 00010 g007b
Figure 8. Power exchanges at PCC: (a) Case 1, (b) Case 2 and (c) Case 3.
Energies 15 00010 g008
Figure 9. Current behavior at PCC: (a) Case 1, (b) Case 2 and (c) Case 3.
Energies 15 00010 g009
Figure 10. Frequency behavior at PCC: (a) Case 1, (b) Case 2 and (c) Case 3.
Energies 15 00010 g010
Figure 11. Relative oscillations amplitudes for the three studied cases, with respect to (a) active power (p.u.), (b) current (p.u.), (c) frequency (in percentage).
Energies 15 00010 g011aEnergies 15 00010 g011b
Table 1. Parameters implemented for the considered Li-Ion battery.
ParameterVariableValue
Maximum capacity C max [Ah]125
Exponential zone capacity C exp [Ah]6.8
Nominal voltage E 0 [V]400
Exponential zone capacity E exp [V]425
Polarization constantK [Ah−1]0.00682
Internal resistanceRint [Ω]0.002
Publisher’s Note: MDPI stays neutral with regard to jurisdictional claims in published maps and institutional affiliations.

