Abstract
This work refers to the criterion values used to assess the state of the active part of the transformer based on the analysis of the effective value of the total vibration acceleration and the frequency spectrum. It was proved in the work that the criteria values should be differentiated for transformers of different rated power. Transformers with lower rated power are characterized by lower RMS values of vibration acceleration than units with higher rated power, which cannot remain without impact on the criteria values. Trend analysis of the total aRMS values may reveal increasing defects before the currently applicable criteria values are exceeded. In addition, the influence of the position of the sensor on the frequency spectrum of the obtained signals was analyzed. It was proved that the sensors should be mounted in the middle of the transformer tank, between its lower part and the cover. The dependence of RMS value of vibration acceleration on no-load losses was also determined for transformers of different types but the same rated power. This relationship will not have a large share in the total vibrations of the transformer, due to slight changes in the value of aRMS occurring for all analyzed units.
1. Introduction
One of the most important and dynamically developing areas of activity of research centers is diagnostics of energy devices. Detailed diagnostics makes it possible to maintain the proper technical condition of these facilities, which is necessary for the proper functioning of the power system and for maintaining the highest standards of customer service. The vibroacoustic method of transformer diagnostics discussed in this article has several undeniable advantages, which are non-invasive (the method can be used without turning off the transformer) and a relatively short time to perform the tests.
Vibroacoustics is a field of knowledge dealing with acoustic, vibration and pulsation processes occurring in the environment and in technology [1,2]. Vibroacoustic processes reflect the most important physical phenomena in machines. The opportunity to assess the technical condition of machines through the observation of vibroacoustic processes was first noticed in aviation technology [3] and later in power engineering. Thanks to the electronics that created the possibility of measuring and analyzing vibroacoustic signals, we now have the ability to separate individual signal components and analyze them in terms of the technical condition of a given machine [4,5,6]. From the vibration signal, we can also obtain information on the advancement of wear of individual elements of the tested object (by analyzing the signal components related to a specific defect) [7,8,9].
The main causes of vibrations inside transformers are electrodynamic forces and the phenomenon of magnetostriction occurring in the core [10]. However, additional sources of vibration include cooling devices (oil pumps, fans).
The electrodynamic forces acting on the transformer windings are generated during the flow of short-circuit currents and are directed along the radius of the winding, causing distortions (through compression/stretching) or winding displacement, and inter-turn spacing also increases. The consequence of deformation is vibration increase, insulation fatigue and finally its degradation, which causes inter-turn short circuits, partial discharges and gas formation. The vibrations measured on the surface of the transformer tank can provide information about the operating conditions of the core and the windings of the unit [11,12,13].
The magnetic flux in the core is practically independent of the load, while in the no-load state, the electrodynamic forces are practically negligible [14]. The magnetic induction of a conductor carrying a current is directly proportional to this current. In turn, the electrodynamic force F depends on the induction and the current:
where:
- -
- B—magnetic induction of the conductor
- -
- I—current flowing through the conductor,
- -
- l—conductor length,
- -
- α—angle between the direction of current flow and the direction of the field force lines.
Hence, it can be concluded that the electrodynamic force is proportional to the square of the current flowing through the transformer windings. The acceleration is directly proportional to the force acting on the object, so it will also depend on I2. Assuming that I = Imax·cosωt we get the formula:
where:
- -
- —winding vibration acceleration,
- -
- —current amplitude,
- -
- ω—vibration pulsation.
The phenomenon of magnetostriction consists in changing the properties of ferromagnetic elements under the influence of a magnetic field. Its effect is to change the geometrical dimensions of the magnetic material placed in the field—in transformers it causes a change of the core geometry. The magnetic field in the core depends on the flux Φ, which in turn is related to the supply voltage via Faraday’s law:
where: —electromotive force.
The change in the length of the core ΔL inside the coil can be described by the formula [14,15]:
where:
- -
- λs—magnetostriction saturation coefficient,
- -
- Umax—supply voltage amplitude,
- -
- L—length of sheets in the core,
- -
- z—number of turns in the winding,
- -
- S—core cross-section area,
- -
- Bs—saturation magnetic induction,
- -
- ω—pulsation.
Calculating the second derivative of the core length change over time, we obtain the instantaneous value of the vibration acceleration ar:
The core vibrations in the transformer caused by magnetostriction will therefore depend mainly on the applied voltage and are practically independent of the load (steady no-load state). On the other hand, in the case of windings, the vibrations are proportional to the square of the load current. Thus, the vibrations recorded on the transformer tank will be a superposition of vibrations caused by the core and the windings. The results of tests confirming the above statements were presented in publications [14,16]. In the article [16] it was stated that in order to effectively assess the condition of the transformer, measurements should be performed with the highest possible load—then the highest effective values of vibration acceleration are recorded.
This article presents the results of vibration tests of power transformers with rated power of 16 and 25 MVA. These tests were carried out to check whether the criterion values presented in [17,18,19,20,21] (which refer to units with a rated power approximately ten times higher than the power of the transformers tested in this paper) would be useful in assessing the technical condition of the transformers we tested. The research began with the determination of the most favorable, in terms of the highest value of the recorded signals amplitude, places for the installation of vibroacoustic sensors. In further tests, accelerometers were installed in previously designated locations. Measurements of the root mean squared value of vibrations were carried out and the frequency spectra of new transformers and those in operation were determined. Then, analyzes of the aRMS value of transformers depending on their rated power and operating time were carried out. On their basis, the average values of RMS of vibration acceleration characteristic for each of the transformers were calculated. Analyzing these values for transformers of different rated power, typical for them increases in vibration acceleration occurring during operation were determined. The last stage of the research was the analysis of the dependence of the mean aRMS value on no-load losses for transformers with different power ratings.
2. Related Works
In the works [17,18,19,20] we can find information about the transformer vibrations sources that has been assigned appropriate frequency ranges in the vibration spectrum:
- up to 500 Hz—vibrations caused by the magnetostriction of the core and electromagnetic forces resulting from the flow of the load current through the windings, as well as the leakage flux that is closed by other elements of the transformer;
- from 500 to 1500 Hz—vibrations from cooling devices (oil pumps, fans, and air flow through coolers);
- above 1500 Hz—vibrations generated and characterizing the work of the core, indicating progressive damage.
These works also presented two criteria for assessing the condition of transformers based on the results of vibroacoustic tests. The first criterion is based on the RMS value of the total vibration acceleration, the second on the RMS value of the vibration components occurring in the vibration spectrum in the range from 1.5 to 2.5 kHz, the RMS values of vibration acceleration were assigned to the technical condition of the transformer (Table 1).

Table 1.
Assessment of the technical condition of a transformer based on the RMS value (total and components) of vibration accelerations [17,18,19,20].
Similar criteria values can be found in the Polish instruction on the principles of operation of transformers. This document is known as the Framework Instruction for Operation of Transformers (RIET). It presents three frequency ranges for which limit values are given (Table 2). Exceeding the limit values indicates a high probability of damage to the transformer core [21].
Table 2.
Limit values of the components of the vibration spectrum for different frequency ranges. Reproduced from [21], the name of the publisher: ZPBE ENERGOPOMIAR—ELEKTRYKA Sp. z o. o.
There is no information in the literature on the places where the accelerometer should be installed. The article [22] describes only the problem of repeatability of measurements for one type of transformer. The authors recommend determining the position of the sensor with a tolerance of 5 cm in order to be able to compare the measurements made for the same transformer at different time intervals. The sensors should be attached in such a way as to obtain the best representation of the condition of the transformer core and windings. Therefore, they should not be mounted near inspection hatches, elements strengthening the transformer tank, or the cooling system pipelines. Please note that some places may be difficult to access due to the presence of elements such as coolers, control cabinets, etc.
Another kind of approach to the analysis of vibroacoustic signals in terms of the technical condition of the active part of the transformer is presented in the works [23,24,25,26]. The research with the use of the mathematical model presented in [23,24,25] showed that the vibrations of the core and the vibrations of the windings are transferred to the tank—this enables their detection on the surface of the transformer tank. These works present a mathematical model that enables the calculation of the 100 Hz component of vibrations for a correctly operating transformer. The authors compare the values of the calculated and measured components and, on the basis of the obtained differences, conclude about the condition of the winding. A significant difficulty in using this method is the need to determine the characteristic parameters of the equation, which must be determined for each transformer separately. The authors of [26] showed that it is possible to detect winding deformation using the vibroacoustic method, verifying the results using the SFRA method. They present as example the pressure pad failure in one of phases, which caused an increase in the measured vibrations, this defect was also detected by the SFRA method. The authors conclude that the vibroacoustic method has similar sensitivity and precision to the traditional winding deformation detection.
3. Materials and Methods
The subject of the research were 110/15 kV/kV transformers with a different rated power—16 and 25 MVA. These were both new transformer units, from one manufacturer, which test were carried out at the factory—Table 3, and those that had been in use for years—Table 4. The research of a new transformers were conduct during their no-load work, while in the case of units, which were in use—under a load (with the exception of transformer number 10, which was tested in a no-load state due to the established plan of use). Table 4 contains information of the years in use and the percentage of transformer loading (it was no possible to obtain such information for all units).
Table 3.
List of tested transformers—new units.
Table 4.
List of tested transformers—units in use.
Vibroacoustic diagnostics of the transformer condition is based on the measurement and analysis of the RMS value of the total vibration acceleration, as well as the RMS values of the vibration acceleration in specific frequency bands [27]. Measurements are carried out via a sensor (piezoelectric accelerometer), which is attached to the transformer tank with magnets.
After measuring the time waveform of vibration acceleration (most often the waveform is recorded at a frequency of tens of thousands of samples per second) the vibration spectrum can be determined. The spectrum is determined using the Fourier transform (FFT or STFT), however all results presented in this paper were based on the FTT transform. The time waveform of vibration acceleration and vibration spectrum examples are shown on Figure 1b.
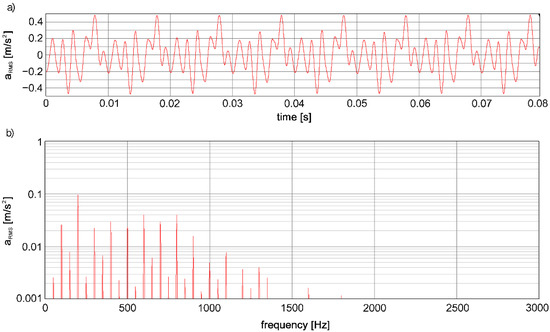
Figure 1.
(a) Typical time waveform of vibration acceleration recorded on the tank of the power transformer; (b) Vibration spectrum calculated using Fourier transform.
The measuring system consisted of a vibroacoustic sensor and the data acquisition system, which was connected to a computer with installed DEWESoft X3 software (or its newer version—DEWESoft X).
For the measurements was used the Hansford Sensors piezoelectric accelerometer model 1735005406. This sensor is a compact industrial accelerometer with an M12 connector, which has been equipped with a magnetic base from the same manufacturer, used to its mounting [28]. The sensor with an attached magnet is shown in Figure 2. For the proper work of an accelerometer necessary is its appropriate calibration. The sensor producer provides a calibration certificate in which the most important parameter is the sensitivity of the sensor in each of x, y, z axes (Figure 2). The sensitivity is defined as the voltage through the unit of gravitational acceleration [mV/g]. The values of sensitivity from the calibration certificate are:
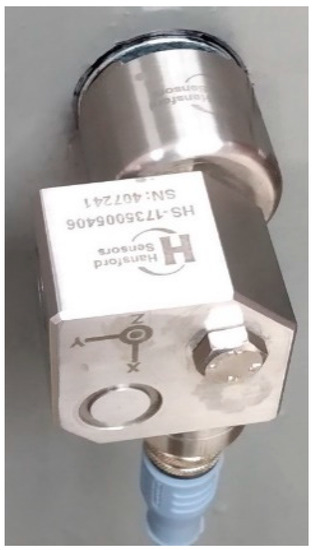
Figure 2.
The Hansford Sensors piezoelectric accelerometer (model 1735005406) which was used during the measurements.
- x-axis sensitivity—541.3 mV/g;
- y-axis sensitivity—530.3 mV/g;
- z-axis sensitivity—505.2 mV/g.
The data acquisition system DEWESoft SIRIUS Mini is the four-channel data recorder, thanks to which it was possible to read data simultaneously for each accelerometer axis (respectively: channel 1—x axis, channel 2—y axis, channel 3—z axis). All technical data of the acquisition system are available on the producer’s website [29]. The obtained results were saved to the DEWESoft program, which also enables the analysis of time waveform of vibration acceleration, their root mean square values and the frequency spectrum (fast Fourier transform FFT obtained from the time waveform of the signal).
To carried out repeatable measurements, a measurement grid consisted of 18 points was determined, shown in Figure 3a. To determine the location of the sensor around the transformer, the letter designations were used, in accordance with the alphabet, while its position in the vertical axis was marked with a number (number 1 stands for the top point, number 2 stands for the middle point, and a number 3 stands for the bottom point). For example, placing the sensor at the top point in location B in was marked as B1. These points during the measurements were adapted to the structure of a given transformer—some sensor locations were omitted because they were difficult to access (due to reinforcements, fasteners, fans, inspection hatches, etc.). Mounting the sensor on rounded parts was avoided and care was taken to ensure that the entire surface of the magnetic base was evenly adhered to the transformer tank. In the case of new transformers (Table 3), measurements were made only in the middle points, so in A2, B2, C2, D2, E2 and F2 point. Figure 3b shows the view of the sensor mounted in one of the measurement points (F1).
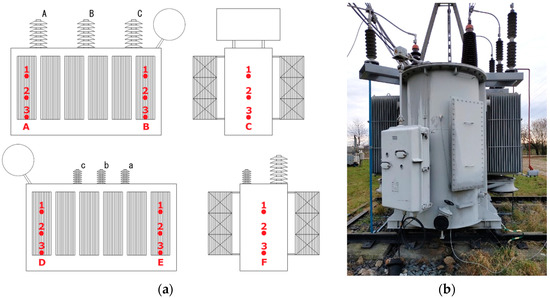
Figure 3.
(a) Arrangement of measuring points on the tested transformers; (b) View of the transformer No. 4 with the sensor attached in F1 point.
4. Results
4.1. Dominant Components of the Frequency Spectrum of the Tested Transformers with the Location of the Sensor at 3 Points in One Vertical Measurement Axis
The measurements were carried out on 8 working transformers with a rated power of 16 and 25 MVA belonging to the one of the distribution network operators in Poland—according to the Table 4 these were transformers no. 2–5 and 7–10. Recorded time waveforms of vibration acceleration were subjected to FFT analysis. A typical transformer frequency spectrum contains dominant components that are multiples of the fundamental frequency (Figure 1). For this reason, in the analysis presented in Figure 4 and Figure 5, only the values of the spectral components for frequencies that are multiples of 50 Hz were taken into account. Figure 4 shows the obtained components of the frequency spectrum in the range of 0–3000 Hz for location D of the sensor for an example transformer with rated power od 25 MVA, while Figure 5—location C for a transformer with rated power of 16 MVA.
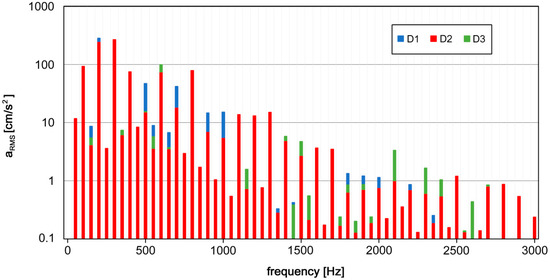
Figure 4.
Comparison of the values of the dominant components of the frequency spectrum of transformer No. 4 (25 MVA) in the range from 0 Hz to 3 kHz for different sensor locations (according to Figure 3a).
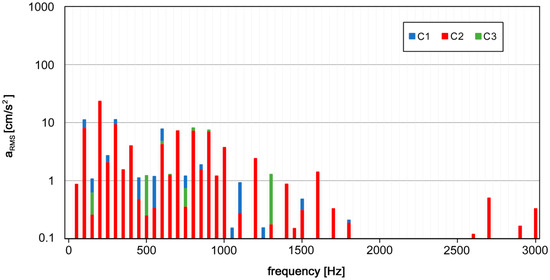
Figure 5.
Comparison of the values of the dominant components of the frequency spectrum of transformer No. 8 (16 MVA) in the range from 0 Hz to 3 kHz for different sensor locations (according to Figure 3a).
The comparisons presented in Figure 4 and Figure 5 were performed for a total of 27 sensor locations (marked as a letters in Figure 3a). The factor that made it difficult to carry out the measurements for all locations was the construction of the transformers—due to reinforcements, inspection hatches and additional equipment of units, it was not possible to locate the sensor in a some of the locations. In order to check whether the measurement at the midpoints is the most appropriate, the percentage share of the number of characteristic frequencies in the frequency spectrum in the range from 0 to 3000 Hz was calculated, for which the value of the signal component at this point is greater than for the value recorded above and below the this point. For example for the comparison shown in Figure 5—49 of the 61 frequency components in the range 0–3000 Hz for the midpoint have the greater than or equal values to the values obtained at the bottom point, which gives a percentage share of 82%. Figure 6a,b shows graphically the obtained results for two exemplary transformers with a rated power of 25 and 16 MVA. The share Pi is expressed as percentage and location of the sensor around the transformer as Li.
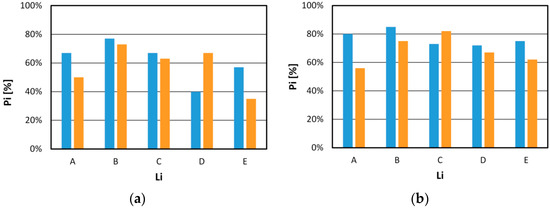
Figure 6.
Percentage Pi of the number of characteristic frequencies occurring in FFT spectrum every 50 Hz in the range from 0 Hz to 3 kHz, for which the value of the given signal component in the middle point is greater than the value obtained above (blue bars) and bellow (orange bars) this point depending on the sensor location Li (according to Figure 3a): (a) For transformer No. 4 (25 MVA); (b) For transformer No. 8 (16 MVA).
After performing the above analysis for all sensor locations, it turned out that in 23 out of 27 sensor locations, both for values recorded above and below the midpoint, the percentage Pi was greater than or equal to 50%. This means that in 85% of the cases at the midpoint, the highest root mean square values of vibration acceleration for individual frequencies in the range 0–3000 Hz were recorded. So at the midpoint we will get the best signal-to-noise ratio.
4.2. Frequency Spectra of Transformers with Different Operating Times
In the next part of the research, the obtained frequency spectra of transformers in use, as well as new transformers were analyzed. The range 0–3000 Hz and the location of the sensor were taken into account—the results for the same measurement points on each of the units were compared. Figure 7 shows the example of the FFT analysis for four chosen transformers with a rated power of 16 MVA with different usage times at the time of taking measurements. The presented graphs were obtained from time waveforms of vibration acceleration when the sensor was located at A2 point (Figure 3a). At the Figure 7 the criteria values, described in the Framework Instruction for Operation of Transformers [21], in accordance with Table 2, were marked by blue lines. This instruction does not specify whether the tank vibration measurement are to be carried out at no-load work or during normal load work. It should be noted that the new transformer, which frequency spectrum is shown in Figure 7a, was tested in no-load state.
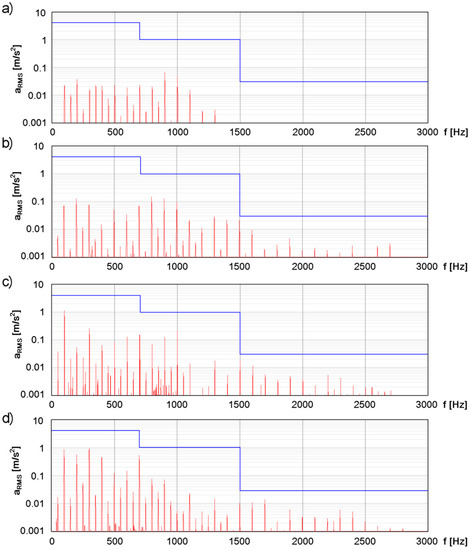
Figure 7.
Comparison of frequency spectra (in the range 0–3000 Hz) of four transformers with rated power of 16 MVA for the same measuring point (A2): (a) new transformer; (b) transformer which has been in use for 23 years; (c) transformer which has been in use for 41 years; (d) transformer which has been in use for 49 years. The criteria values (Table 2) are marked by blue lines.
The limit values were not exceeded in the spectra presented in Figure 7. However, it can be noticed that the oldest transformer (the longest in use) is characterized by much higher root mean square values of vibration acceleration for individual frequencies. Both the comparison shown in Figure 7 and the analysis of the frequency spectra of all units listed in Table 4 show that the older the transformer is, the more frequency components, being a multiple of the fundamental 50 Hz frequency, begin to reach values above 0.001 m/s2. During the analysis of vibration spectrum, it was also noticed that units with a rated power of 16 MVA are characterized by lower root mean square values of vibration acceleration for particular frequencies than those obtained on transformers with higher power (25 MVA) being in similar age, what is also clearly shown in Figure 4 and Figure 5.
4.3. Analysis of Root Mean Square Values of Vibration Acceleration of the Transformers in Use
In this part the total root mean square values of vibration acceleration obtained for transformers 16 and 25 MVA, which in accordance with Table 1 should not exceed the value of 400 cm/s2 [17,18,19,20,21], were analyzed. Figure 8a,b show the total RMS values of vibration acceleration measured for ten transformers with a rated power of 16 MVA and seven transformers with a power of 25 MVA. For each transformer the measurements were performed at 6 points (from A2 to F2—according Figure 3a). The green lines in these figures show the approximation by the exponential function. The intersection of the approximating line with the red line (indicating the criterion value above which the transformer is in the warning state) determines the time after which the transformer’s state will no longer be considered normal. Comparing the changes in the RMS value of the vibrations acceleration with time, we can see that their dynamics is much greater for transformers with higher rated power (25 MVA). Different dynamics of changes in the RMS value of vibration acceleration over time for transformers of various rated power suggests that the values of the criteria should also be another for them. For transformers with the same rated power, the vibration acceleration values and the dynamics of their changes depending on the operating time for each location (from A2 to F2) are similar. Therefore, for further analyzes for each of the transformers, the mean values of the effective vibration accelerations from all 6 points were calculated.
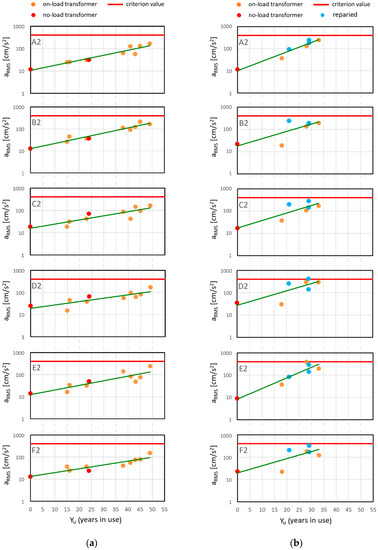
Figure 8.
Root mean square values of vibration acceleration from 6 measurements points (A2–F2) depending on the age of the transformer: (a) for 10 transformers with the rated power of 16 MVA; (b) for 7 transformers with the rated power of 25 MVA.
Figure 9 and Figure 10 show comparison of the average aRMS values depending on the working time of the units. When the mean value was calculated, the values obtained in 6 measurement points (Figure 3a) considered as standard when testing new units were taken in the account, these are the locations A2, B2, C2, D2, E2 and F2. To facilitate the analysis, exponential trend lines were marked on the charts along with their formulas. Additionally, the transformers, which were in no-load work during the measurements, are marked in red. Three of the transformers with rated power of 25 MVA were renovated, therefore they are marked in blue in Figure 10.
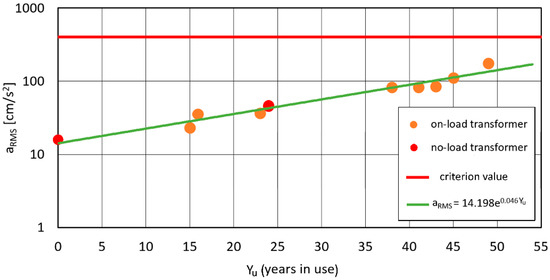
Figure 9.
Averaged root mean square values of vibration acceleration from 6 measurements points for 16 MVA transformers depending on the age of the unit.
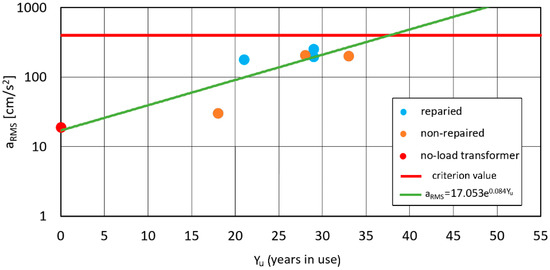
Figure 10.
Averaged root mean square values of vibration acceleration from 6 measurements points for 25 MVA transformers depending on the age of the unit.
The graphs show that the longer the transformer is in use, the higher the root mean square values of vibration acceleration are achieved. However, the percentage of load of the tested transformers should be taken into account. Load of the transformers, among which the power load value is known, ranged from 22 to 49%. The approximation of the dependence of the effective value of vibration accelerations on the load in the form of an exponential function is presented in [16], which proves the non-linearity of this phenomenon. The difference in the obtained values of total RMS vibration acceleration between 22% and 49% of the rated power was 10 cm/s2 (which constitutes only 2.5% of the criterion value of 400 cm/s2). However, it was determined during the tests carried out on a transformer with the rated power of 263 MVA, the power of which is more than 10 times greater than the units analyzed in this article. Therefore, it is possible that in the case of units with definitely lower rated powers (than described in [16]), the percentage of transformer load has an even smaller impact on the obtained RMS value of vibration acceleration.
According to the Figure 9 and Figure 10, the dynamics of the increase in the recorded values of effective vibration accelerations with the age of the unit differs depending on the transformer power. On the basis of the performed measurement, in can be clearly stated that transformers with a rated power of 25 MVA, are characterized by higher total root mean square values of the vibration acceleration than 16 MVA transformers at the same operating time. None of units tested exceeded the mean aRMS value higher than the criterion value of 400 cm/s2. The transformer number 4 showed the highest root mean square values of vibration acceleration. This unit in the D2 point reached the value of 419 cm/s2 during the measurements (Figure 8a), however, it is worth noting that in 1996 the C phase of the regulating winding was rewound in this transformer. Transformer number 2, which clearly deviate from the trend, has also undergone the renovation, in 2017 the A phase windings on the high voltage side were replaced. In turn, in the transformer number 5, the HV, LV and regulating windings were replaced.
4.4. Root Mean Square Values of Vibration Accelerations in New Transformers Depending on the No-Load Loses
The last part was the analysis of the impact of no-load losses on the root mean square value of the vibration acceleration of new transformers. The Figure 11 shows the dependence of the average effective value of vibration acceleration on the values of no-load losses. Values obtained from 6 measurement points were averaged (locations: A2, B2, C2, D2, E2 and F2). In the diagram, transformers are divided according to the rated power, because in accordance with the previous studies (Figure 9 and Figure 10), higher root mean squared values of vibration acceleration are obtained for units with higher rated power.
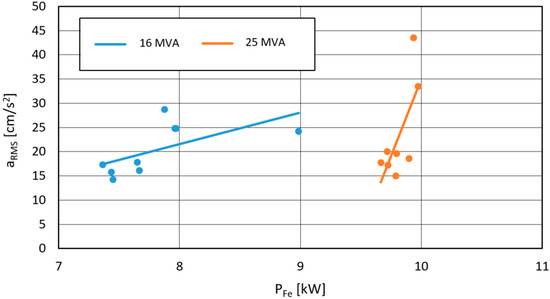
Figure 11.
Dependence of the average root mean square value of vibration acceleration on the value of no-load losses (PFe) of 16 and 25 MVA transformers.
The new tested 16 MVA transformers, which were working in the no-load state during measurements, had lower values of no-load losses than those with a rated power of 25 MVA. When comparing transformers of the same rated power, it can be noticed that with the increase of the value of no-load losses possessed by the unit, the recorded average values of the acceleration of the tank vibration increase. Additionally, it can be noticed that for the tested units with the rated power of 25 MVA, despite smaller differences in the values of no-load losses, the increase in the effective value of vibration acceleration occurs more rapidly than in the case of transformers with lower rated power.
5. Discussion
The analysis of the literature shows that very few scientific publications concern vibroacoustic diagnostics of transformers. The proposed criteria values, both relating to the RMS values and the components of the frequency spectrum of vibroacoustic signals, are very generalized and usually do not take into account, for example, the dependence of the recorded vibration parameters on the rated power of transformers and their no-load losses. There are also no clear and documented indications of where to place the sensors. This article presents the results of experiments partially supplementing these deficiencies.
The analysis of the values of the dominant components of the frequency spectrum carried out for 8 loaded transformers (with rated powers of 16 and 25 MVA) showed that the location of the sensors in the middle of the tank gives the statistically highest values of the recorded signals. In 85% of the cases at the midpoint, the highest root mean square values of vibration acceleration for individual frequencies in the range 0–3000 Hz were recorded. At the midpoint we will recorded statistically the highest values, which decreases risk of omitting the registration of signals that may indicate a possible occurring defect. On this basis, it can be concluded that carrying out measurements only in the middle points (between the bottom of tank and its lid), is correct action.
The dynamics of increase in the total RMS value of vibration acceleration (calculated for six points located around the transformer at the height of the tank center) depending on the operating time is clearly greater for transformers with a higher rated power. For transformers with the rated power of 16 MVA the intersection of the trend line with the line marking the boundary between the normal and warning condition (Table 1) will occur after the transformer has been used for more than 72 years. On the other hand, in the case of 25 MVA units, the intersection will occur much earlier—with usage for more than 37 years.
The slight increase of averaged RMS values of vibration acceleration for transformers after repair was observed. These repairs mainly involved replacing the windings. In each of these cases, the top core yoke had to be removed during the repair, and the core had to be reassembled after the repair was performed. These are operations that interfere with the core structure. There is no guarantee that after replacing the winding, the same value of pressing forces was maintained and that the sheets in the core were not loosened. In the event of performing this repair, the contractors reserve the right to increase the idle losses by several percent. This proves possible changes in the core structure which may lead to the observed increased vibrations.
During the research, the dependence of average root mean square value of vibration acceleration on the value of no-load losses was also noticed. The recorded vibration acceleration is higher for transformers of the same power, but with higher no-load losses. However, for transformers with higher power (25 MVA), this relationship is more stringent, i.e., an increase in losses by the same value causes a more dynamic increase in vibration acceleration compared to transformers with lower power (16 MVA). Generally speaking, the changes in vibration acceleration, in the analyzed range of losses, are not too large and constitute a maximum of about 10% of the criterion value.
The most important observation from the research carried out is the fact that both the RMS value of vibration acceleration recorded at various points and its average value calculated from all points, increases with the age of the transformer. Similarly, with the age of the unit, the acceleration values recorded in the frequency spectrum increase in the range from 1500 to 2600 Hz. Additionally, units with a lower rated power, similar in age to the transformers with higher power, are characterized by lower root mean square values of vibration acceleration both for total aRMS values and particular frequencies. On this basics, it can be concluded that the criteria values firstly adopted almost 40 years ago [30] should be modified for transformers with a rated power of tens of MVA.
Our experience shows that transformers of a similar design will age in a similar way. The units analyzed here (excluding repaired transformers) did not show any symptoms of damage, and the results of their periodic tests always met the requirements. Therefore, we assume that they are subject to aging processes, which are natural for transformers, and that their vibrations, which increase with time, correspond to the current technical condition. With this assumption, a trend of changes in vibrations over time can be determined. Then, by comparing the vibrations of the tested transformers with the determined trend, it is possible (for a given population of transformers) to select units with higher vibrations than those resulting from the trend. This will enable early detection of the arising damage (even before the criteria values are exceeded), which is undoubtedly the value of the research results presented in the article.
6. Conclusions
The vibroacoustic method will be applicable in the diagnostics of transformers provided that more precise criteria values are determined, especially for transformers with a rated power of several tens of MVA.
Both the total RMS value and the components of the frequency spectrum increase their values along with the increase of the transformer operation time. Changes of these parameters over time occur much faster for transformers with a rated power of 25 MVA than for a 16 MVA transformer.
In the currently used approach to the analysis of vibroacoustic signals coming from the transformer [17,18,19,20], relatively high criteria values are adopted (the normal state is determined up to the value of 400 cm/s2 of total RMS of vibration acceleration, while the emergency state is determined after exceeding 2500 cm/s2). The values of vibration accelerations measured by the authors for the 12 non-repaired transformers in service range from about 10 to 395 cm/s2, so all these units are in a normal state, even transformers over 45 years in use. It is worth noting that repaired transformers (where the structure of the windings and the core were affected) show vibration accelerations higher than indicated by the trend line. Therefore, it seems justified to say that the violation of the active part’s structure will be reflected in the recorded vibrations. In the case of non-repaired transformers, high differences between the recorded values and those resulting from the trend line may indicate mechanical defects, even if the criteria values presented in [17,18,19,20] (Table 1) are not exceeded. The obtained results indicate the direction of further work. We plan to determine the trend of total aRMS for a larger number of transformers of different types and rated powers. A comparative analysis of the vibrations recorded on the tested transformer with the trend characteristic for a given population will allow for earlier detection of defects.
For the best signal-to-noise ratio, piezoelectric accelerometers should be located halfway up the transformer—between its cover and the bottom of the tank.
For new transformers of different types but the same rated power a correlation can be noticed between the values of the total effective value of vibration acceleration and the value of no-load losses. However, this is not a strong correlation. In addition, changes in the total aRMS value when changing the value of idle losses in the range of 7–10 kW do not exceed 10% of the criterion value taken as 400 cm/s2.
Like any method, this one also has some limitations. Depending of the construction of the transformer tank, access to some locations (in which the sensor should be mounted) may be difficult due to existing radiators, reinforcements, fasteners, fans, inspection hatches, etc.
Author Contributions
Conceptualization, M.C.; methodology, J.G.; validation, J.G.; formal analysis, J.G., M.C.; investigation, J.G., M.C.; resources, J.G., M.C.; data curation, J.G., M.C.; writing—original draft preparation, M.C.; writing—review and editing, J.G.; visualization, J.G.; supervision, J.G.; funding acquisition, J.G. All authors have read and agreed to the published version of the manuscript.
Funding
This research was financing from Ministry of Science and Higher Education, Poland, grant number 0711/SBAD/4514.
Institutional Review Board Statement
Not applicable.
Informed Consent Statement
Not applicable.
Data Availability Statement
Not applicable.
Conflicts of Interest
The authors declare no conflict of interest.
Abbreviations
| RMS | Root Mean Square |
| FFT | Fast Fourier Transform |
| STFT | Short-Time Fourier Transform |
| RIET | Framework Instruction for Operation of Transformers |
| HV | High Voltage (winding) |
| LV | Low Voltage (winding) |
| SFRA | Sweep Frequency Response Analysis |
Nomenclature
| Variable | Symbol | Unit |
| Electrodynamic force | F | N |
| Magnetic induction | B | T |
| Current | I | A |
| Voltage | U | V |
| Length | l | m |
| Pulsation | ω | rad/s |
| Vibration acceleration | a | m/s2 |
| Electromotive force | ε | V |
| Magnetostriction saturation coefficient | λ | - |
| Frequency | f | Hz |
| Percentage share | Pi | % |
| Sensor location | Li | - |
| Age of transformer | Yu | years |
| No-load losses | PFe | kW |
References
- Cempel, C. Diagnostyka Wibroakustyczna Maszyn; Wydawnictwo PWN: Warszawa, Poland, 1989. [Google Scholar]
- Cempel, C. Vibroacoustic Condition Monitoring; Ellis Horwood Ltd.: London, UK, 1991. [Google Scholar]
- Collacot, R.A. Mechanical Fault Diagnosis and Condition Monitoring; Chapman & Hall: London, UK, 1977. [Google Scholar]
- Sikorski, W. Development of Acoustic Emission Sensor Optimized for Partial Discharge Monitoring in Power Transformers. Sensors 2019, 19, 1865. [Google Scholar] [CrossRef] [PubMed] [Green Version]
- Jarmolowicz, M.; Kornatowski, E. Method of vibroacoustic signal spectrum optimization in diagnostics of devices. In Proceedings of the 2017 International Conference on Systems, Signals and Image Processing (IWSSIP), Poznan, Poland, 22–24 May 2017; pp. 1–5. [Google Scholar]
- Borucki, S.; Cichon, A. Wavelet analysis of vibroacoustic signals registered during the transformer start-up. In Proceedings of the 2012 International Conference on High Voltage Engineering and Application, Shanghai, China, 17–20 September 2012; pp. 579–582. [Google Scholar]
- Mohanty, S.; Gupta, K.K.; Raju, K.S.; Singh, A.; Snigdha, S. Vibro acoustic signal analysis in fault finding of bearing using Empirical Mode Decomposition. In Proceedings of the 2013 International Conference on Advanced Electronic Systems (ICAES), Pilani, India, 21–23 September 2013; pp. 29–33. [Google Scholar]
- Pawlik, P. Analysis of the impact of oil viscosity on the vibroacoustic signal of a planetary gearbox operating at variable load. Diagnostyka 2020, 21, 43–49. [Google Scholar] [CrossRef]
- Wrobel, R.; Dimitrov, R. Vibroacoustics in the practice of vehicle diagnostics. In Proceedings of the 2020 7th International Conference on Energy Efficiency and Agricultural Engineering (EE&AE), Ruse, Bulgaria, 12–14 November 2020; pp. 1–5. [Google Scholar]
- Vandevelde, L.; Melkebeek, J.A.A. Magnetic forces and magnetostriction in electrical machines and transformer cores. IEEE Trans. Magn. 2003, 39, 1618–1621. [Google Scholar] [CrossRef]
- Lavalle, J.C. Failure Detection in Transformer Using Vibrational Analysis. Master’ Dissertation, Massachusetts Institute of Technology, Cambridge, MA, USA, 1986. [Google Scholar]
- Bartoletti, C.; Desiderio, M.; Di Carlo, D.; Fazio, G.; Muzi, F.; Sacerdoti, G.; Salvatori, F. Vibro-Acoustic Techniques to Diagnose Power Transformers. IEEE Trans. Power Deliv. 2004, 19, 221–229. [Google Scholar] [CrossRef]
- Jin, M.; Pan, J.; Huang, H.; Zhou, J. Vibration transmission from internal structures to the tank of an oil-filled power transformer. Appl. Acoust. 2016, 113, 1–6. [Google Scholar] [CrossRef]
- Shengchang, J.; Yongfen, L.; Yanming, L. Research on Extraction technique of Transformer Core Fundamental Frequency Vibration Based on OLCM. IEEE Trans. Power Deliv. 2006, 21, 1981–1988. [Google Scholar] [CrossRef]
- Krupinski, R.; Kornatowski, E. The Use of Generalized Gaussian Distribution in Vibroacoustic Detection of Power Transformer Core Damage. Energies 2020, 13, 2525. [Google Scholar] [CrossRef]
- Borucki, S.; Cichon, A. The influence of the power transformer load on vibroacoustic signal analysis results. Electr. Rev. 2010, 87, 45–47. [Google Scholar]
- Kaźmierski, M.; Olech, W. Diagnostyka Techniczna i Monitoring Transformatorów; ZPBE ENERGOPOMIAR—ELEKTRYKA Sp. z o. o.: Gliwice, Poland, 2013; pp. 286–293. [Google Scholar]
- Borucki, S.; Cichon, A.; Majchrzak, H.; Zmarzly, D. Evaluation of the Technical Condition of the Active Part of the High Power Transformer Based on Measurements and Analysis of Vibroacoustic Signals. Arch. Acoust. 2017, 42, 313–320. [Google Scholar] [CrossRef]
- Borucki, S.; Cichoń, A.; Boczar, T. Diagnostyka transformatorów energetycznych z wykorzystaniem metody wibroakustycznej. PAK 2009, 55, 19–22. [Google Scholar]
- Skubis, J.; Jezierski, G.; Dwojak, J.; Rzepiela, M. Pomiary drgań transformatora dużej mocy. Electrotech. News 2000, 68, 193–196. [Google Scholar]
- Bagiński, A. Framework Instruction for Operation of Transformers; ZPBE ENERGOPOMIAR—ELEKTRYKA Sp. z o. o.: Gliwice, Poland, 2012. [Google Scholar]
- Shengchang, J.; Lingyu, Z.; Yanming, L. Study on transformer tank vibration characteristics in the field and its application. Electr. Rev. 2011, 87, 205–211. [Google Scholar]
- Garcia, B.; Burgos, J.C.; Alonso, A.M. Winding deformations detection in power transformers by tank vibrations monitoring. Electr. Power Syst. Res. 2005, 74, 129–138. [Google Scholar] [CrossRef]
- Garcia, B.; Burgos, J.C.; Alonso, A.M. Transformer tank vibration modelling as a method of detecting winding deformations-part I: Theoretical foundation. IEEE Trans. Power Deliv. 2006, 21, 157–163. [Google Scholar] [CrossRef]
- Garcia, B.; Burgos, J.C.; Alonso, A.M. Transformer tank vibration modeling as a method of detecting winding deformations-part II: Experimental verification. IEEE Trans. Power Deliv. 2006, 21, 164–169. [Google Scholar] [CrossRef]
- Hao, M.; Jufang, W.; Xiaoguang, M. Winding Deformation Detection Based on Vibration Signal Analysis. In Proceedings of the 2021 IEEE 4th International Electrical and Energy Conference (CIEEC), Wuhan, China, 28–30 May 2021; pp. 1–4. [Google Scholar]
- Borucki, S. Diagnosis of Technical Condition of Power Transformers Based on the Analysis of Vibroacoustic Signals Measured in Transient Operating Conditions. IEEE Trans. Power Deliv. 2012, 27, 670–676. [Google Scholar] [CrossRef]
- Datasheet of HS-AM Magnets—Pole Piece. Available online: https://hansfordsensors.com/wp-content/uploads/datasheets/TS528.pdf (accessed on 2 October 2021).
- Technical Specification of the DEWESoft SIRIUS Mini Device. Available online: https://dewesoft.com/products/daq-systems/mini (accessed on 2 October 2021).
- Partyga, S. (Ed.) Diagnostyka Stanu Technicznego Transformatorów. Zasady Badań i Kryteria Oceny; ZPBE ENERGOPOMIAR: Gliwice, Poland, 1983. [Google Scholar]
Publisher’s Note: MDPI stays neutral with regard to jurisdictional claims in published maps and institutional affiliations. |
© 2021 by the authors. Licensee MDPI, Basel, Switzerland. This article is an open access article distributed under the terms and conditions of the Creative Commons Attribution (CC BY) license (https://creativecommons.org/licenses/by/4.0/).