Article

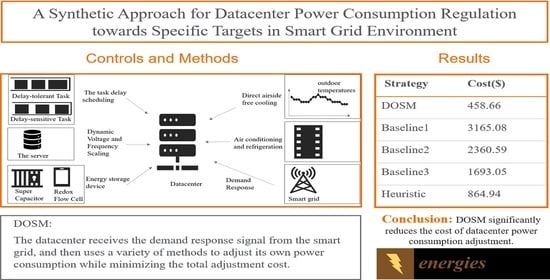
A Synthetic Approach for Datacenter Power Consumption Regulation towards Specific Targets in Smart Grid Environment

State Key Laboratory of Plateau Ecology and Agriculture, Department of Computer Technology and Applications, Qinghai University, Xining 810016, China
*
Author to whom correspondence should be addressed.
Energies 2021, 14(9), 2602; https://doi.org/10.3390/en14092602
Submission received: 31 March 2021 / Revised: 28 April 2021 / Accepted: 30 April 2021 / Published: 2 May 2021
(This article belongs to the Special Issue Demand Response Optimization Techniques for Smart Power Grids)

Abstract

:
With the large-scale grid connection of renewable energy sources, the frequency stability problem of the power system has become increasingly prominent. At the same time, the development of cloud computing and its applications has attracted people’s attention to the high energy consumption characteristics of datacenters. Therefore, it was proposed to use the characteristics of the high power consumption and high flexibility of datacenters to respond to the demand response signal of the smart grid to maintain the stability of the power system. Specifically, this paper establishes a synthetic model that integrates multiple methods to precisely control and regulate the power consumption of the datacenter while minimizing the total adjustment cost. First, according to the overall characteristics of the datacenter, the power consumption models of servers and cooling systems were established. Secondly, by controlling the temperature, different kinds of energy storage devices, load characteristics and server characteristics, the working process of various regulation methods and the corresponding adjustment cost models were obtained. Then, the cost and penalty of each power regulation method were incorporated. Finally, the proposed dynamic synthetic approach was used to achieve the goal of accurately adjusting the power consumption of the datacenter with least adjustment cost. Through comparative analysis of evaluation experiment results, it can be observed that the proposed approach can better regulate the power consumption of the datacenter with lower adjustment cost than other alternative methods.

Graphical Abstract

1. Introduction

The rise and development of cloud computing has made it one of the current hot technical topics in academic and industry research fields in recent years. Datacenters in the cloud computing environment are high-performance computing platforms comprising computing resources and massive data storage. Datacenters are usually huge scale, which leads to high energy consumption and wide distribution, while at the same time they have the flexibility to be scheduled and controlled. According to a relevant study [1], the consumption of datacenters is increasing at a rate of doubling every 5 years [2]. The energy consumption of computing systems with a computing speed of 10PFLOPS will reach more than 10 MW, and the energy consumption of the next generation of larger-scale computing systems will exceed 27 MW. Hence, datacenters have become veritable “power-consuming consumers”. Large-scale datacenters are more energy intensive, and their energy cost often accounts for more than 50% of the total management cost [3].
On the other hand, with the development and utilization of renewable energy, smart grids have developed rapidly [4]. Since new energy sources (e.g., wind, solar, tidal energy, etc.) are usually intermittent and randomly variable, it is still challenging for renewable power generation to be connected to the grid system. According to a relevant study [5], before the construction of a large number of energy storage power stations, the proportion of renewable energy in the grid is relatively small. In recent years, with the establishment of energy storage power stations, the capacity of the grid to accommodate new renewable energy sources has gradually increased, reaching more than 40%, and even reaching 70% in some areas [6]. The increasing capacity of renewable sources pushed the grid system to become more flexible and intelligent to balance the power supply and demand in order to maintain stable running. Secondly, due to the continuous increase in many new consumer devices (personal electronic devices, electric vehicles, etc.), the rapid increase in power demand has threatened the reliability of the grid, such as power outages and other emergencies [7]. In addition, after the large-scale integration of renewable energy sources into the grid, the frequency stability problem of the power system will become increasingly critical.
To solve this problem, the traditional grid usually adopts passive regulation methods in which the supply of electric energy changes with the demand for electric energy. For example, large-scale battery arrays and super capacitors are used as energy storage elements, combined with corresponding control strategies to achieve grid stability [8,9,10]. It is difficult for the power system to solve the real-time supply and demand balance problem after large-scale renewable energy integration by relying only on the regulation capability from the generation side. Therefore, in the smart grid system, the interaction capability between the demand side and the power grid has been strengthened, and the regulation potential of the demand side has received more attention. In other words, it is promising and necessary to make full use of the demand response (DR) load in the power system, adjust the load-side power, and balance the relationship of power supply and demand in the grid system in order to guarantee the stability [9].
According to prior relevant research [9], the power consumption of a datacenter is adjustable through certain management methods. Such feature makes the datacenter a good potential participant for DR programs in the smart grid. Therefore, datacenters can be integrated into the smart grid as DR loads by participating in the energy market and the ancillary service market via the regulation of their power consumption in time. This could not only help the smart grid to stabilize the voltage, but also could greatly reduce the management cost of the smart grid [9]. Thus, it is crucial and important for the datacenter as a power load to accurately adjust its own power consumption during its operation process for both the optimization and stabilization of the smart grid system. With this motivation, this paper proposes a synthetic approach to regulate the power consumption of the datacenter towards a specific target while minimizing the adjustment cost based on the DR requirements. First, we established a synthetic model on the basis of comprehensive consideration of temperature control, energy storage devices (ESDs), and the characteristics of IT devices to characterize the power consumption of the datacenter. Secondly, the action costs of various power consumption control methods and the inaccurate penalties for power regulation were also incorporated into the holistic model, which was used to calculate the total cost spent on datacenter power adjustment. Finally, we utilized the proposed synthetic management approach to achieve the target, combining hybrid methods while minimizing the adjustment cost, and also evaluated the feasibility and the effect of our approach. This paper is an extended version of our prior work [11], with several main contributions, including: (1) the calibration of the power regulation cost model of the datacenter by incorporating the adjustment cost of the cooling systems; (2) implementation of more alternative methods for further comparison with our approach; (3) more detailed results and comprehensive analysis of the experiments which were re-conducted under calibrated models.
The remainder of this paper is organized as follows. Section 2 introduces some related work about datacenter power management. Section 3 shows the system architecture and relevant models. Section 4 describes the optimization problem formulated according to the power regulation objective and presents the approach to solve the problem. Section 5 analyzes the evaluation results by comparing different approaches. Finally, Section 6 concludes the whole paper and discusses future work.

2. Related Work

In recent years, energy management of datacenters and the DR of smart grid systems have attracted a lot of attention in both academic and industrial fields. Demand-side management and the optimal allocation of power resources was promoted, showing that potential DR resources have become an important means to alleviate the contradiction between power supply and demand. Since the implementation of DR must rely on specific load adjustment capabilities, in recent years, some researchers noticed that datacenters had the characteristics of real-time power response, transferability, and controllability. They could also actively participate in DR in the smart grid in a variety of ways. Aiming at the problem of datacenter power consumption management, Zhang et al. [12] classified and compared the currently used typical energy-saving algorithms, such as the energy-saving algorithm based on dynamic voltage and frequency scaling (DVFS), the algorithm based on virtualization, and the algorithm based on host shutdown and opening. Wu et al. [13] and Huai et al. [14] gave a typical application of using DVFS technology to reduce server power consumption. On the basis of these classic algorithms, Wu et al. [15] proposed an energy efficiency optimization strategy based on the dynamic combination of DVFS perception and a virtual machine. The strategy could reduce the overall energy consumption of the datacenter on the premise of not reducing the user’s quality of service (QoS) and not violating the service level agreement (SLA). Xu et al. [2] also used virtualization technology and DVFS technology in cloud computing to reduce the power consumption of a datacenter, but this combined adjustment method would not guarantee the QoS. Instead, it evaluated the performance loss by establishing a virtual machine (VM) migration cost model and SLA measurement model. In addition to these classic energy-saving algorithms, Bahrami et al. [4], Celik et al. [7], and Tang et al. [16] used the characteristics of large load and high flexibility of datacenters to study in the power market for datacenters to manage their own energy consumption according to different workload distribution algorithms. They showed that even under the premise of ensuring QoS, the datacenter could still achieve better energy management goals by dispatching controllable loads.
On the other hand, the cooling system for the datacenter is very important to prevent the failure of IT equipment, but at the same time it also consumes a lot of energy [17]. With the development of cooling technology, a variety of different cooling strategies have emerged on the basis of air conditioning and cooling in datacenters, including natural wind cooling, liquid cooling [18], etc. These new cooling strategies can use natural cold sources to absorb energy according to seasonal changes, reduce power consumption, and improve energy efficiency [19]. Researchers have also designed a hybrid cooling system that uses indirect natural air cooling and air conditioner refrigeration. Research showed that hybrid cooling can significantly reduce the cooling power consumption of a datacenter [20]. Through microscopic research on the temperature of a datacenter, Ko et al. [17] proposed a fuzzy proportional integral controller. The controller compared the performance of energy consumption and temperature control in a more detailed manner, and reduced power consumption of a cooling system under the premise of ensuring the performance of temperature control.
According to relevant research [21], the electricity consumption of datacenters accounts for 3% of the current national electricity consumption. Especially, the energy storage equipment in the datacenter has played an important role in the process of participating in the power management program [22]. Although many studies have pointed out that datacenters can use workloads to respond flexibly to the requests from the grid, its slow response time severely limits the ability to provide real-time support. Thus, they have to leverage energy storage equipment to cooperate with workload dispatch to provide fast frequency adjustment [23]. For example, Guruprasad et al. [23] used the Lyapunov control mechanism in combination with small batteries to adjust energy consumption and, according to the grid demand, to provide real-time grid support. Narayanan et al. [22] compared the impact of different energy storage devices on the energy management of datacenters, and illustrated the important role of ESDs in the power consumption control of datacenters. Longjun et al. [24] and Mamun et al. [25] also gave the performance of energy storage devices in datacenter application examples in energy consumption management.
In summary, according the prior studies of datacenter power consumption control, three kinds of techniques of power consumption control have usually been used, including DVFS, request distribution strategy, and server aggregation. However, such power control methods had the following shortcomings: (1) the power control effect was often inaccurate, and the system energy efficiency was relatively low; (2) there were many restrictions, such as load balancing requirements, etc.; (3) dynamic load could not be effectively dealt with [26]. In order to improve these shortcomings, Huang et al. [27] proposed to use the UPS of the datacenter servers to adjust the power load of the grid more accurately. However, these single-level energy efficiency optimizations might still lead to low overall efficiency [11]. Only when the IT system layer and the supporting facilities layer (such as: cooling system, lighting equipment, etc.) are jointly considered can the datacenter energy saving potential be maximized and the overall energy efficiency of the datacenter can be improved. How to adjust power accurately is the basis for effective energy management, and appropriate power models are very crucial for the adjustment. From the perspective of the datacenter, it should decide whether to participate in a certain DR program by calculating the total net revenue which might be impacted by various factors, including the profit from executing user tasks, electricity prices, the penalty for degrading the service quality, etc. Hence, in this paper, we focused on the scenario that after complex analysis based on the current situation, the datacenter has decided to participate in the DR program by meeting the strict requirements coming from the grid side. Our motivation is to find an optimal way to regulate the datacenter power consumption appropriately to fulfill this decision. Accordingly, we propose a comprehensive way of combining multiple controlling methods to accurately adjust the power consumption of the datacenter towards specific targets while minimizing the adjustment cost to better participate in DR programs and ensure the stability of the smart grid system.

3. System Model

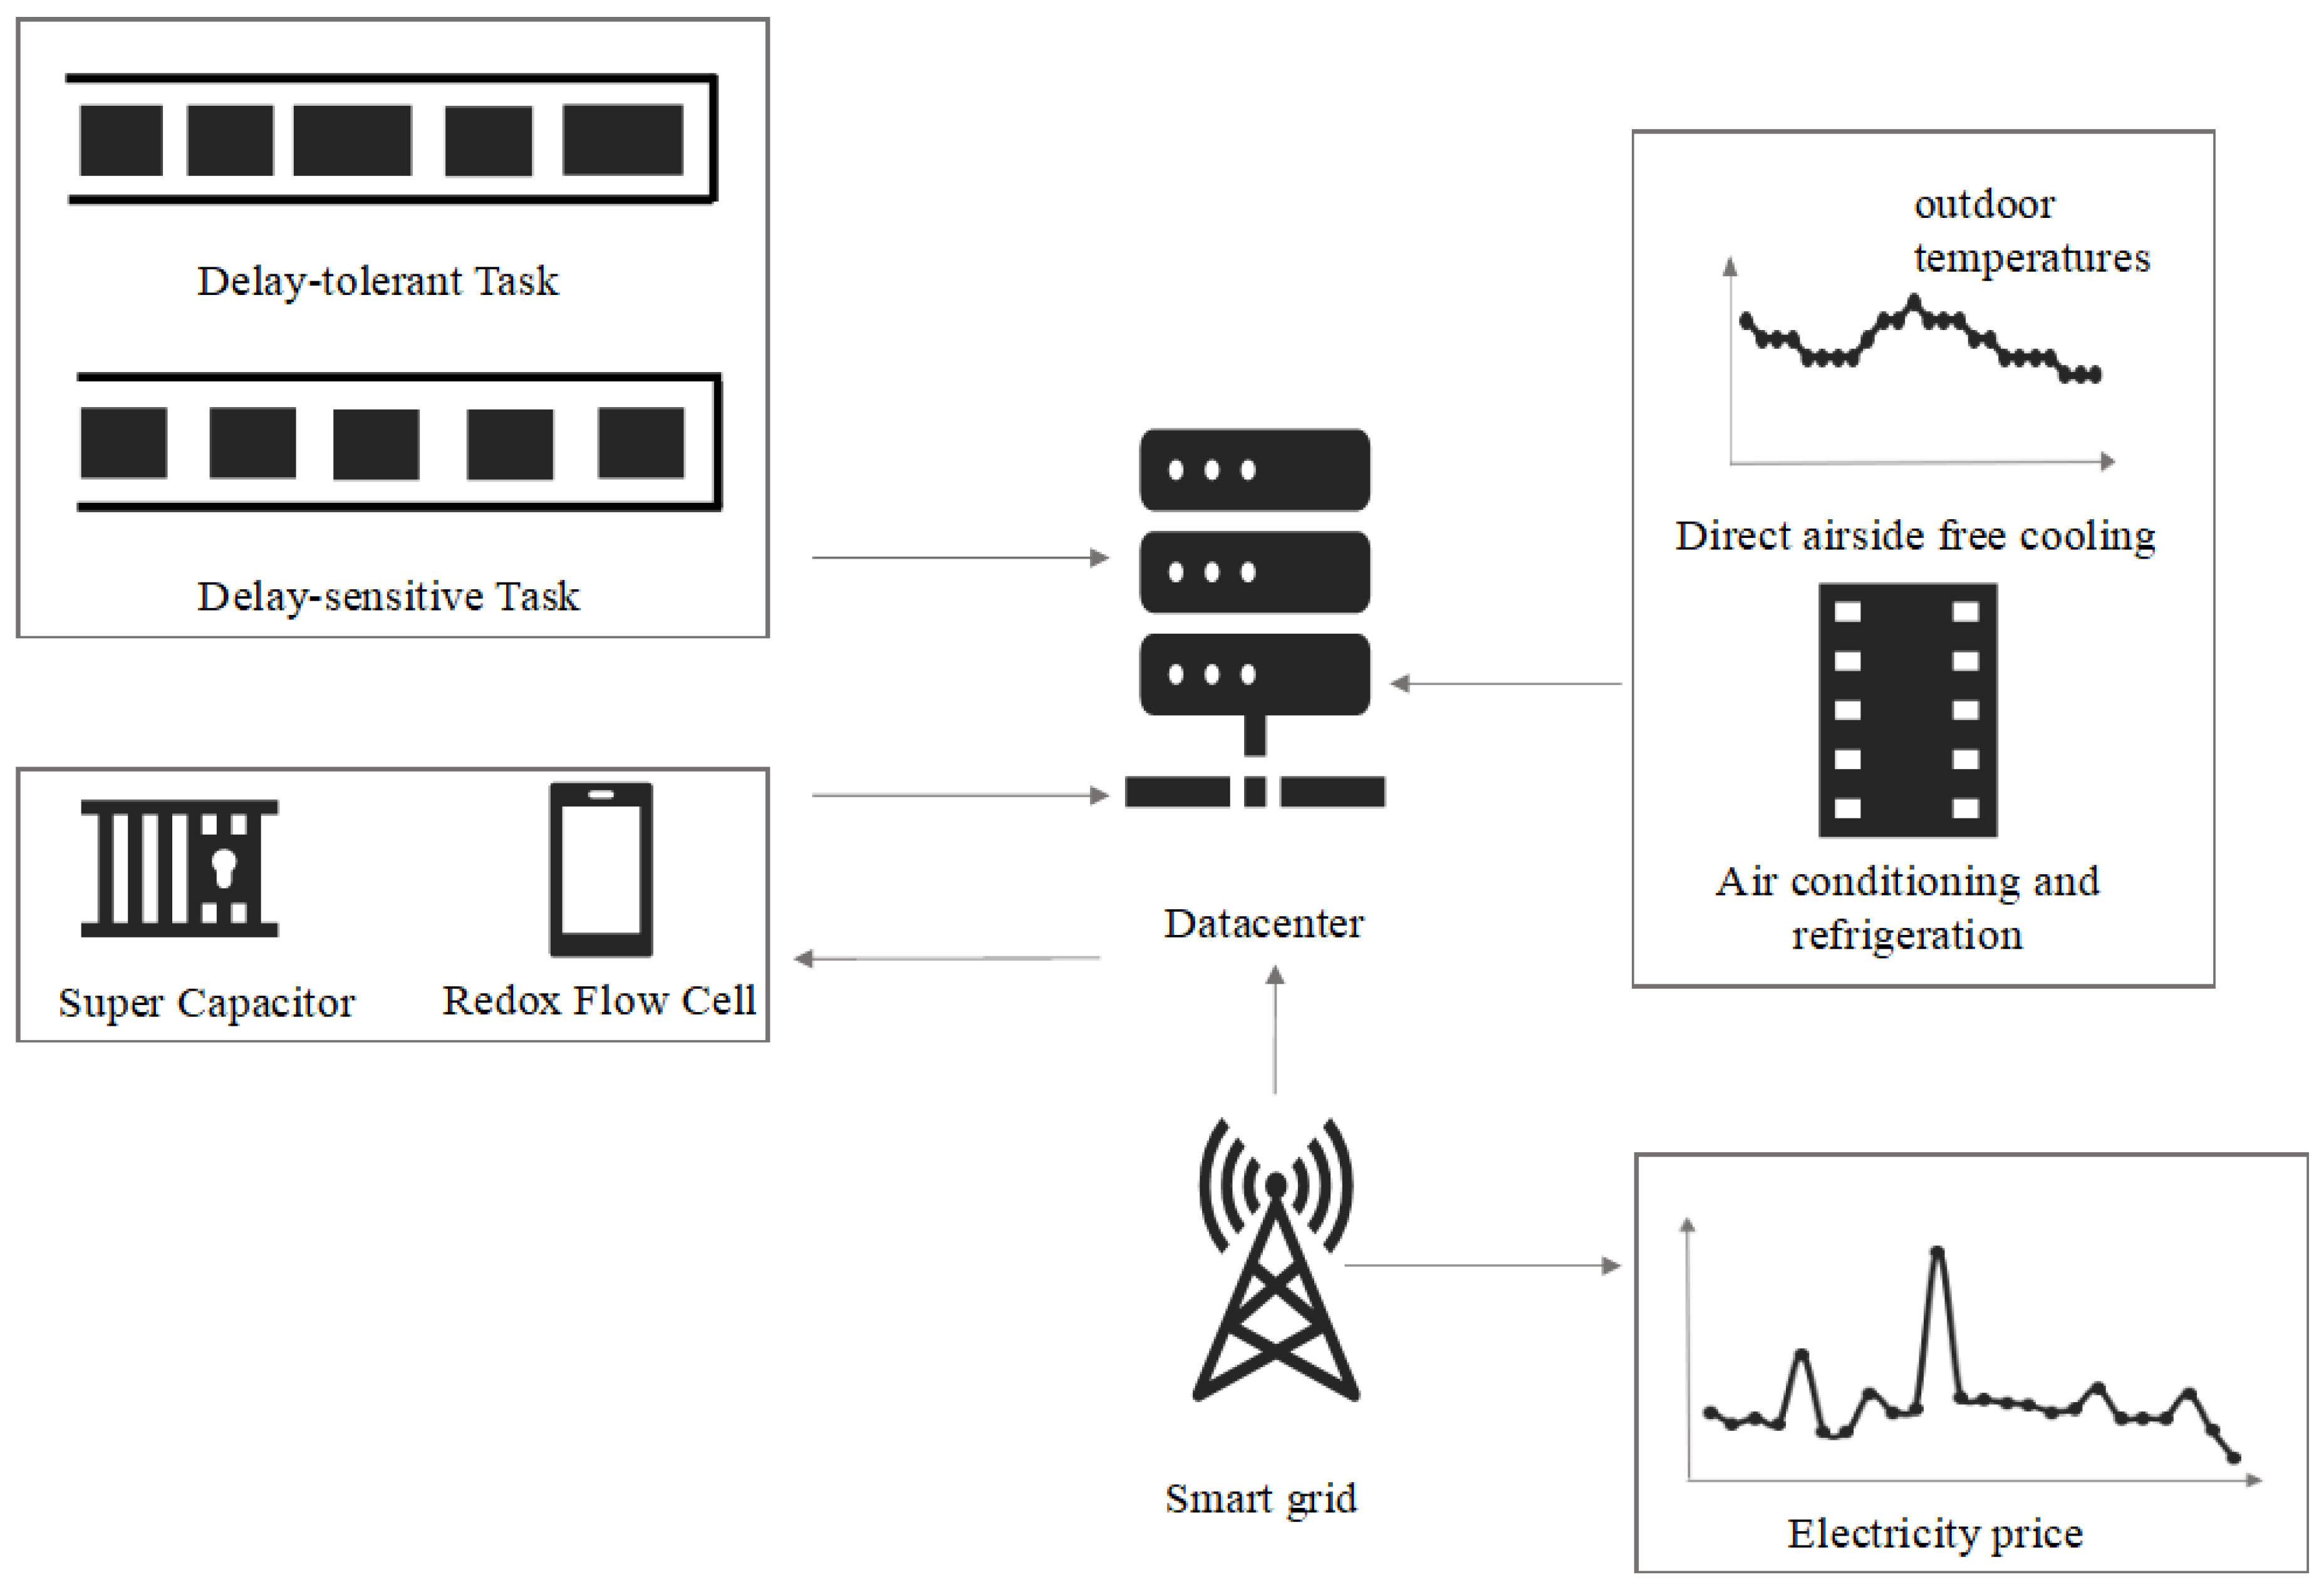
3.1. System Architecture

The overall system architecture studied in this paper is shown in Figure 1, which includes the datacenter and the smart grid. In order to participate in the DR programs of the smart grid, the datacenter will combine multiple methods together, including cooling control, energy storage device charging/discharging, task scheduling, and DVFS techniques, to accurately adjust its own power consumption. During the whole regulation process, the total cost spent on datacenter power consumption adjustment should be minimized. Firstly, the smart grid sends DR signals specifying the load regulation requirements. Then, the datacenter receives the DR signal. Then, according to the current outdoor temperature, the datacenter could conduct an appropriate cooling strategy to adjust the power consumption of its own cooling system. When the tasks submitted by the users arrive at the datacenter, they are first classified and then be scheduled under appropriate strategies. During these procedures, DVFS techniques could be used to adjust the server power consumption. The datacenter might also charge or discharge the super capacitors and flow batteries to adjust its own power demand to the grid. Overall, the datacenter can use a variety of different methods to meet the DR requirements from the smart grid, and at the same time try to minimize the adjustment cost for performing the power regulation actions.

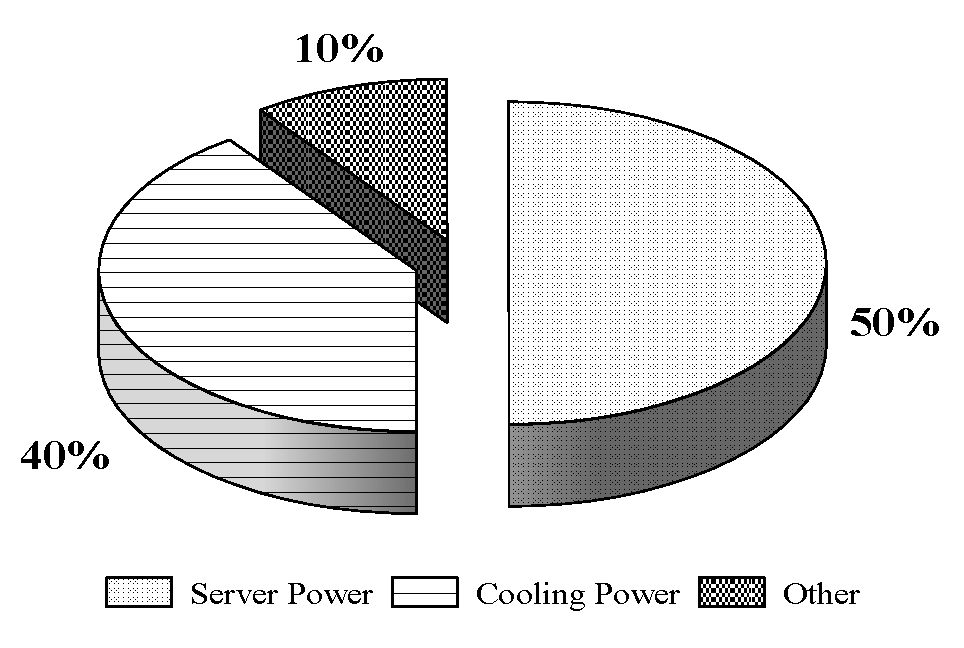
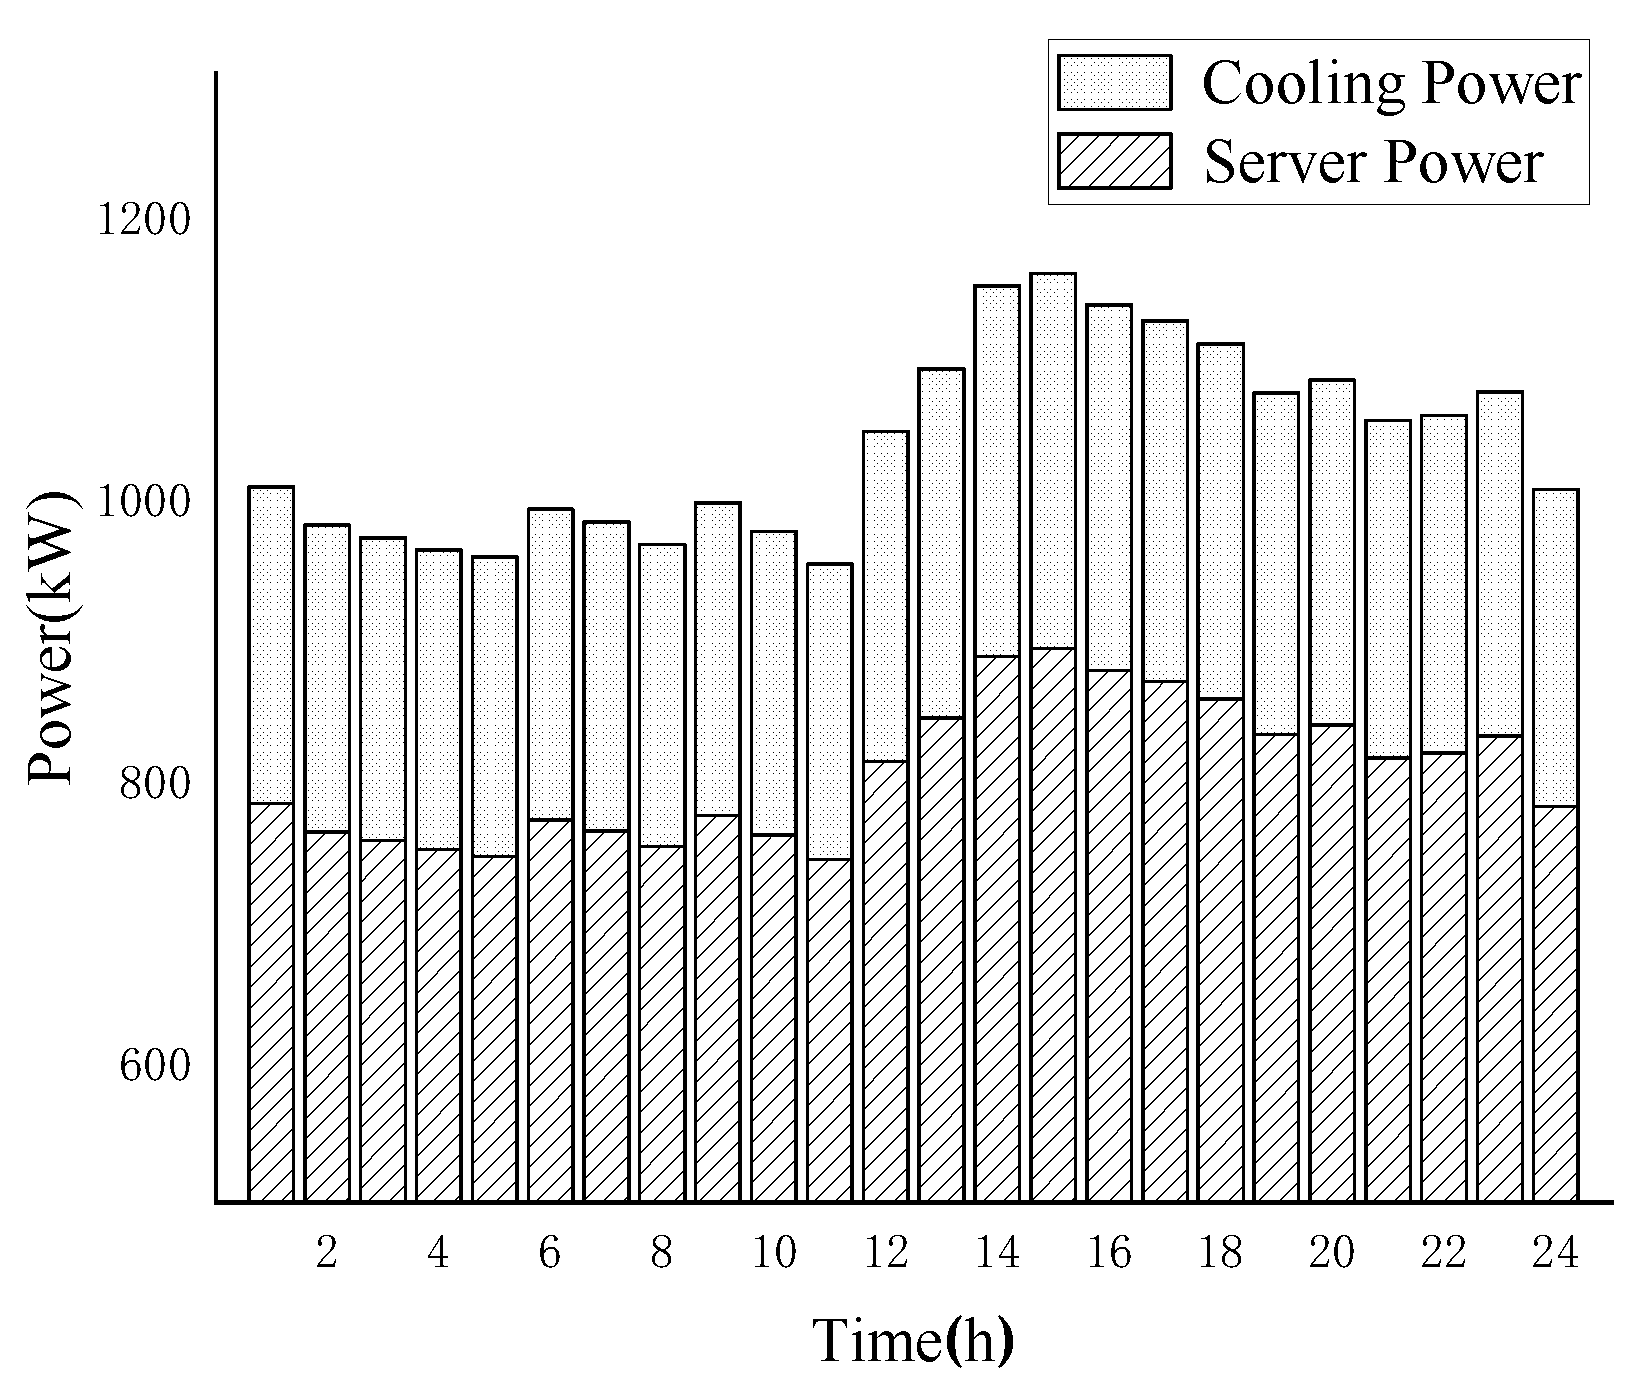
3.2. Modeling Datacenter Power Consumption

According to the opinion of Yang et al. [28], the power consumption of IT equipment is mainly composed of three parts, including server power consumption, storage power consumption, and communication power consumption. The power consumption of the datacenter is mainly from the servers and the cooling system [29]. Usually, the energy consumption of IT equipment accounts for 50% of the energy consumption of the datacenter, and the cooling system accounts for 40% [18,30,31], as shown in Figure 2. Wang et al. [32] show that the power cost of the cooling system is usually as high as 30% of the total power cost of the datacenter. Therefore, in this paper, we ignored the power consumption of lighting, monitoring, storage, and communication consumption, and mainly considered and calculated the power consumption of IT equipment and the cooling system.
According to related research from Saadi et al. [33], the power consumption of a server depends on the utilization rate of the CPU, and the power consumed by an idle server is about 70% that of a fully utilized server. Here, in this paper, we use the power model related to CPU utilization, server idle power, and peak power [16,28,34,35,36,37], as follows:
P s = α · u c p u + β
wherein P s is the power consumption of the server, α is the difference between the peak power and the idle power of the server, u c p u is the current CPU utilization, and β is the idle power of the server.
For the cooling system of the datacenter, the energy cost of cooling equipment is related to its coefficient of performance (CoP) [38], which is defined as the ratio of the cooling energy provided to the electrical energy consumed for cooling [34]. Akbari et al. [34] give the relationship between the energy consumption of the server and the corresponding cooling energy consumption required, as follows:
C o P = E s E c
wherein E s and E c denote the energy consumption of the server and the energy consumption of the cooling system, respectively.
According to Equation (2), during the period when the server is working, CoP can be represented by the power consumption of the server and its corresponding cooling power consumption, which can be expressed as:
C o P = P s P c
wherein P c is the cooling power of the datacenter.
The value of CoP is not constant. From the model of water-cooled CoP and air conditioning supply temperature given by HP Laboratory [38,39,40], it can be seen that CoP usually increases with the temperature of the cooling air provided. According to the air conditioning supply temperature, the value of CoP can be calculated as:
C o P = 0.0068 T s u p 2 + 0.0008 T s u p + 0.458
wherein T s u p is the air conditioning supply temperature (°C).
Then, the total power consumption of the datacenter is:
P D C = P s + P c
wherein P D C is the total power of the datacenter.

3.3. Modeling Energy Storage Devices

The study [41] indicates that energy storage devices used in datacenters include lead–acid batteries, lithium batteries, flow batteries, super capacitors, and flywheel energy storage. Lead–acid batteries and lithium batteries have low power density, short cycle life, and frequent charging and discharging, which will greatly shorten their lifetime. Flow batteries (FBs) have high energy conversion efficiency, fast starting speed [42,43], strong overload capability, and deep discharge capability. Moreover, the cost of FB power generation is low [44], and the self-discharge rate is low [22]. In addition, the independent design of power and capacity of FBs [42,45] could avoid cross-contamination between metals. On the other hand, super capacitors (SCs) are usually divided into high-power SCs and high-energy SCs [46]. High-power super capacitors can be used as backup power, while high-energy super capacitors can be used as voltage compensators or energy storage devices for storing solar energy. In addition, SCs can be integrated into any layer of servers, racks, and datacenters as the ESD to reduce the energy loss caused by AC/DC conversion. Both flywheels and SCs can release a large amount of energy in a short period of time. However, compared to the commonly used lead–acid batteries, the backup time of the flywheel is extremely short [47].
By comprehensively judging the power density, life cycle, conversion efficiency, and other characteristics of various energy storage devices [22,48,49,50,51], here, in this paper, we use the combination of FBs and SCs as the backup power of the datacenter. SCs and FBs can be employed as an uninterruptible power supply (UPS), and can be combined with wind turbines, power grids, and solar panels to be used as regenerative power. By considering the ESD self-discharge rate and energy conversion efficiency, the conversion relationship between the device capacity and the stored energy could be obtained [49] as follows:
Dev re = ESD re / ( η E S D D × ( 1 ε ESD ) )
wherein Dev re is the device capacity, ESD re is the energy that needs to be stored by the energy storage device, and η E S D D and ε ESD are the discharging efficiency and self-discharge rate of the energy storage device, respectively.
SCs usually have a high self-discharging rate and are not suitable for long-term energy storage. When SCs and FBs participate in the datacenter DR according to their own charging and discharging characteristics, in order to ensure the normal operation of the datacenter under sudden power outages, they need to store a certain amount of energy during the whole DR procedure. Therefore, hereafter, we assume that FBs keep half of the stored energy to deal with emergency situations.
When charging energy storage devices, the energy stored by SCs and FBs is always limited by the capacity of the energy storage device itself. In this paper, the depth of discharge (DoD) of an ESD is used to constrain the energy stored by the ESD during charging and discharging, which means the following constraint:
( 1 D o D E S D ) × D e v r e E E S D t D e v r e
wherein D o D E S D is the depth of discharge of the ESD, and E E S D t is the energy stored by the energy storage device at time t .
After the energy storage device has been charged and discharged several times, the stored energy will be [22]:
E E S D t = ( 1 ε E S D ) × E E S D t 1 + ( r E S D t d E S D t ) × Δ t
wherein r E S D t and d E S D t denote the actual charging power and the discharging power of the ESD at time t , respectively, and Δ t represents the length of a time interval.
When an ESD is discharged, it should meet following constraints:
d E S D t × η E S D D = D E S D t
d E S D t P E S D m
d E S D t d E S D t 1 Δ t P E S D m T r a m p
wherein D E S D t is the effective discharging power of the ESD at time t , P E S D m is the maximum power of the ESD, and Tramp is the ramp rate of the ESD, which reflects the start-up waiting time of power output. During the usage of some energy storage devices, it takes several minutes or hours to generate power [52]. For example, compressed air energy storage devices may take several minutes to meet power requirements [53]. However, for most ESDs, it takes at most a few milliseconds to start providing necessary power.
When charging an ESD, the following constraints [22,37] should be met:
R E S D t × η E S D C = r E S D t
r E S D t R E S D t
r E S D t P E S D m ω E S D
wherein R E S D t denotes the rechargeable power of the ESD at time t , η E S D C is the charging efficiency of the ESD [37], and ω E S D is the ratio of the discharging rate to the charging rate of ESD.

3.4. Task Scheduling and Frequency Scaling Models

3.4.1. Task Scheduling Model

When the datacenter adjusts the power consumed by the server, it can try different methods to schedule tasks, according to the delay tolerance and time flexibility of the tasks. Here, two types of load were considered in our study, including delay-sensitive tasks and delay-tolerant tasks. Delay-sensitive tasks refer to workloads that require immediate response. Delay-tolerant tasks refer to the workloads submitted which can wait for the datacenter to have sufficient resources before responding. For a server node, multiple tasks can be executed simultaneously in one time interval. Here, we assume that a task might comprise one or more basic tasklets. For each basic tasklet, its processing time unit is Δ t u , then the execution time of any task is an integer n times the basic tasklet unit. In order to ensure the QoS, the task processing needs to be completed before the deadline time [28]. For a delay-sensitive task Taskds, the task arrival time is denoted as t d s a , then the deadline for finishing the task could be calculated as
t d s d = t d s a + n × Δ t u
wherein t d s d is the deadline for finishing the delay-sensitive task.
For a delay-tolerant task Taskdt, the arrival time is denoted as t d t a , and the maximum tolerable delay time length as t max i , then, in order to ensure the QoS, the latest start time t d t m should be:
t d t m = t d t a + t max i
wherein t d t m is the latest start time of the delay-tolerant task.
Then, the deadline for finishing the task should be calculated as
t d t d = t d t m + n × Δ t u
wherein t d t d is the deadline for finishing the delay-tolerant task.
In order to use the task delay scheduling method to achieve the power control purpose of the datacenter, here, we use the number of tasks executed to calculate the server resource utilization as [28]:
u c p u , i = t b u s y , i Δ t = [ ( λ i + i m i e m i ) ] / ( c h e a d l e · M ) Δ t
wherein Δ t represents the length of the time slot, u c p u , i is the average resource utilization of the server in the i-th time slot, t b u s y , i is the busy time of the server in the i-th time slot, and c h e a d l e is the maximum processing capacity of the server which is also the maximum number of basic tasks processed by the server in one time slot. M is the number of active servers in the datacenter. λ i is the initial average number of tasks in the i-th time slot. Taking into account the time-shift characteristics of delay-tolerant tasks, i m i and e m i represent the number of tasks moving in and out in the i-th time slot, respectively. Then, ( λ i + i m i e m i ) represents the number of tasks actually processed in the i-th time slot.
The number of tasks i m i migrating in the i-th time slot is determined by the number of tasks e m i 1 migrating out during the previous time slot as
i m i = e m i 1
wherein e m i refers to the number of tasks that can be postponed in the i-th time slot, and it should not be greater than the total number of delay-tolerant tasks at the current moment, calculated as
e m i ( λ i + i m i )

3.4.2. Frequency Scaling Model

By using DVFS techniques, a datacenter could dynamically adjust the frequency and voltage of the server nodes according to the changes in the resource utilization of the dynamic load, thereby further reducing power consumption [15]. According to related studies of Zhang et al. [12], when the CPU is not fully utilized, this technique can bring cubic orders of magnitude of power reduction in the application process of DVFS. Wu et al. [13] proposed to use the actual voltage and frequency of the CPU to calculate the power consumption of the server at the current moment. However, there is a certain error in the model using the approximate linear relationship between voltage and frequency. Therefore, this paper uses the current server operating frequency and CPU utilization to calculate power consumption [15] as:
u c p u ( m , k ) = f o p ( m , k ) f m a x ( m )
f o p ( m , k ) { f 1 ( m ) , f 2 ( m ) ,   , f k ( m ) ,   , f m a x ( m ) }
wherein f o p ( m , k ) is the current operating frequency of server node m , k refers to a specific DVFS operation mode, f m a x ( m ) is the highest operating frequency of node m , u c p u ( m , k ) is the CPU utilization of the node m. If the value of f o p ( m , k ) is in the valid frequency set, it means that no SLA violation will occur.

3.5. Modeling the Cooling System

3.5.1. Air Conditioning Cooling Model

The server continuously generates heat when it is working. Therefore, the inlet temperature of the server is not only affected by the supplying temperature of the cooling system, but also by the power consumption of the server itself. Here, the server chassis is used as the heat source, and then its inlet temperature could be expressed as [34]:
T i n = T s u p D · P s
wherein T i n is the inlet temperature of the server and D is the heat distribution matrix. D can be calculated as follows:
D = ( K A T · K ) 1 K 1
K = m f · C p
wherein m f is the mass flow rate of air between racks [40], C p is the specific heat capacity of air [38], K is the product of m f and C p , and the matrix A is a constant matrix which represents the interference of heat flow between server nodes [40].
The server continuously generates heat during the working process, which increases the temperature in the computer room. In order to ensure that the server can work normally, the supplying temperature of the air conditioner needs to be adjusted according to the inlet temperature of the server [39] as follows:
T s u p = T s u p + T a d j
T a d j = T i n s a f e T i n m a x
T l s a f e T i n s a f e T h s a f e
wherein T i n s a f e is the safe temperature of the server entrance, T l s a f e and T h s a f e are the critical values of the safe temperature at the entrance of the server, T i n s a f e is the maximum temperature of the server entrance, and T a d j represents the difference between the safe temperature and the maximum temperature of the server entrance. When the difference is less than zero, the air conditioner needs to lower the supplying temperature, and vice versa.

3.5.2. Direct Airside Free Cooling Model

Many studies have shown that the direct airside free cooling has a significant effect on saving datacenter energy costs [18,54], and hence it has already been applied in the datacenters of Google, Facebook, and Alibaba Zhangbei [30]. A direct airside free cooling system uses a fan to compress cold air into the computer room through blinds [55]. Generally, it can be used when the temperature difference between indoor and outdoor areas is less than 1 °C [56]. However, if the dew point temperature in this area exceeds the recommended threshold [57] by 20 °C, then a backup system needs to be considered [58].
Considering the influence of air humidity, here, we establish a dual-source cooling system for the datacenter in hybrid cooling mode [15]. The working principle of this mode includes: (1) when the outdoor air temperature is greater than Thigh, all the cooling capacity is generated by the air conditioning cooling model. (2) When the outdoor air temperature is higher than Tlow and lower than Thigh, the cooling system uses direct airside free cooling. At this time, a lot of power of the datacenter cooling system could be saved [59]. According to [59], the expression of the mass flow of cold air G (kg/s) is calculated as:
G = P c C p × ( T m a x T o )
wherein T m a x is the temperature after the air is heated, and T o is the value of the outdoor temperature at the current moment. Therefore, the power consumption of the fan in the direct airside free cooling system can be expressed as:
P m f a n = Δ p × G ρ × η m f a n
wherein P m f a n is the power of the fan (W), Δ p is the pressure drop (Pa), ρ is the air density (kg/m3), and η m f a n is working efficiency of the fan.

3.6. Cost Model

3.6.1. Operating Cost Model

An energy storage device is affected by the energy conversion efficiency and self-discharge rate. When the datacenter uses ESDs to adjust its own power for DR, certain management costs will be incurred. This is defined as the operating cost [22,44,49,60], which is determined by the electricity price and the energy loss of the energy storage device itself, as follows:
O p E x E S D = p r i c e × E l o s s
wherein O p E x E S D is the operating cost of the ESD, price is the electricity price provided by the smart grid.
The difference is that most of the previous studies [22] used constant electricity prices, but the price in the paper refers to real-time electricity prices. In other words, the price refers to the electricity price updated by the grid every hour. E l o s s is the energy loss of the ESD, which can be calculated as
E l o s s = ( 1 η E S D D ) × d E S D t × Δ t + ε E S D × E E S D t
wherein d E S D t is the discharging power of ESD at time t , E E S D t is the energy stored by the energy storage device at time t .
During the operation of the datacenter, the annual cost of its cooling system (mainly air conditioning) includes water, electricity, managerial salaries, management fees, sewage charges, equipment depreciation fees, and equipment maintenance fees. In order to simplify the calculation of the operating cost of the cooling system, here, we only consider the cost of electricity, so the operating cost of the cooling system can be calculated as follows [61]:
O p E x a i r = P c C o P × Δ t × p r i c e
wherein O p E x a i r is the operating cost of the cooling system.

3.6.2. Penalty Model

Datacenters provide services to users and guarantee their QoS, while adjusting their power usage for DR. In this paper, we use the response time of the datacenter server as a metric to measure the quality of service. When the datacenter uses task delay scheduling and DVFS techniques for DR, some tasks need to be postponed. If the execution time of such a task exceeds the deadline, the SLA will be violated, leading to a certain number of penalties [62]. Equation (34) gives the penalty model of the datacenter if the execution of a certain task violates the deadline constraint, as follows:
P e E x T D = ( t e x e c t s u b ) · τ T D
wherein P e E x T D is the penalty of task delay scheduling, t e x e c and t s u b represent the actual execution time and submission time of the task, respectively, and τ T D is the penalty coefficient factor.
As presented above, when the datacenter uses multiple methods to adjust its own power for DR, besides violating SLA, it is also possible that the power adjustment target may not be accurately achieved by combining different methods. If the actual power after adjustment is too high or low, it will also bring a certain penalty. Therefore, when the adjusted power of the datacenter deviates from the target power, the penalty is calculated as follows:
P e E x d i f f = Δ P d i f f × p r i c e × Δ t
wherein P e E x d i f f is the penalty of inaccurate adjustment, and Δ P d i f f is the deviation between the actual achieved power and the target power.

4. Problem Definition and Solution

In this section, we establish the optimization problem for the power regulation issues of the datacenter towards specific targets for DR, and try to solve the problem.

4.1. Problem Definition

As described previously, the datacenter can combine multiple different methods to regulate its own power consumption for DR, including task scheduling, charging/discharging ESDs, and cooling power adjustment. In the entire adjustment process, when the adjusted power of the datacenter deviates from the target power, a certain penalty will be incurred. Finally, the adjustment cost of different methods and the penalty of inaccurate adjustment are incorporated into the total cost of power regulation. Table 1 shows all the notations used throughout this paper and their corresponding meanings, and Table 2 summarizes the acronyms used in this paper.
Based on the power regulation model described in Section 3, when the smart grid sends out a DR signal, the datacenter can use hybrid methods to regulate its own power consumption. The key problem is to determine the power consumption allocated to each regulation method in order to minimize the total cost of such an action. Assume that the DR signal given by the smart grid requires adjustment of the power consumption to Paims, and Pair and Pfan are the adjustable power consumption of the air conditioning cooling and the direct airside free cooling, respectively. Assume that PSC and PFB are the adjustable power consumption of the super capacitors and the flow batteries as ESDs, respectively. The adjustable power consumption of the datacenter for task scheduling and DVFS methods are PTD and PDVFS, respectively, and Δ P d i f f is the deviation between the adjusted power and the target power, then:
P a i m s = P s + P c P a i r P f a n P S C P F B P D V F S P T D Δ P d i f f
It should be noted that when the DR signal requires power reduction, the power amount to be adjusted should be a positive value and vice versa. Finally, incorporating the adjustment costs of multiple adjustment methods and the inaccurate adjustment penalties of the datacenter, the objective function can be obtained. Then, the optimization problem can be formalized as:
Minimize:
O p E x E S D + O p E x a i r + P e E x T D + P e E x d i f f
subject to: Equations (7), (9)–(14), (20), (22), (28), wherein Equation (7) limits the energy stored after the ESD charging and discharging, Equations (9)–(11) and Equations (12)–(14) limit the discharge power and charging power of the ESD, respectively, Equation (20) limits the number of delayed tasks, Equation (22) limits the current operating frequency of the host, and Equation (28) limits the safe temperature of the server entrance.

4.2. Solution to the Optimization Problem

4.2.1. Model Simplification

In order to solve the problem, we have to first analyze the objective function and constraint conditions. We found that in the process of calculating P a i r , the air conditioning supply temperature T s u p can be obtained by Equations (3), (4), (25), and (26), as follows:
T s u p = T s u p + ( T i n s a f e T i n m a x ) ,
then P a i r can be calculated by
P a i r = P c P s ( 0.0068 T s u p 2 + 0.0008 T s u p + 0.458   ) ,
As Equations (38) and (39) show, the variable P a i r is a nonlinear function of the variable T i n s a f e . In this case, the final optimization problem defined in Section 4.1 becomes a mixed integer nonlinear problem since it contains both integer and noninteger decision variables. In order to facilitate the solution, we first linearize the problem to generate a mixed integer linear optimization problem, and then try to solve it.
Through the above analysis, it is found that the variable T i n s a f e is the cause of the nonlinearity of the P a i r constraint. Since Equation (38) is a linear function of the variable T i n s a f e , the upper and lower bounds of the variable T i n s a f e can be substituted into Equation (38). Then, the value range of P a i r can be calculated by Equation (39). Since the extreme value problem of the quadratic function can be solved by eliminating the variable T i n s a f e and increasing the value constraint of the variable P a i r , the final optimization problem with the objective defined as Equation (37) can be transformed into a mixed integer linear programming problem.

4.2.2. Design of Solution Approaches

For solving the mixed integer linear programming problem we obtained, as above, a dynamic optimal scheduling method (DOSM) is proposed here, which aims to achieve the goal of using multiple methods to regulate the power consumption for DR and minimize the adjustment cost. In addition, we also compare the proposed approach with other alternative strategies.
  • Dynamic Optimal Scheduling Method (DOSM)
In Section 3, we present six possible methods for the datacenters to change their own power consumption in terms of temperature control, charging/discharging energy storage devices, and server power management, including the use of super capacitors, flow batteries, air conditioning cooling, direct airside free cooling, task delay scheduling, and DVFS techniques. In order to adjust the power consumption of the datacenter to the target power Paims, there are infinite possible combinations of the six different methods. Hence, it is necessary to find the optimal combination with the least cost. Therefore, we designed a dynamic optimal scheduling method (DOSM), which attempted to reasonably allocate the power adjustment amount among multiple methods, so that the total cost of participating DR could be minimized while satisfying all the constraints. Specifically, DOSM was implemented based on the solving process of linear optimization.
For constrained optimization problems, methods can be divided into direct methods and indirect methods, according to different solving principles. The interior point method is an indirect algorithm for solving optimization problems. It converts the constraint problem into an unconstrained problem by introducing a utility function, and then uses the optimization iteration process to continuously update the utility function to make the algorithm converge. The specific steps of the DOSM are as follows:
(a)
Choose an appropriate penalty factor r(0), expected error ξ and decline factor c;
(b)
Select the initial point X(0) in the feasible region and set k = 0;
(c)
Establish the penalty function φ ( X k , r ( k ) ) , starting from the point X(k−1), and use the unconstrained optimization method to find the extreme points of the penalty function ( X k * , r ( k ) ) ;
(d)
Use termination criterion | X k * · r ( k ) X k * · r ( k 1 ) | ε to judge the convergence; if the conditions are met, stop the iteration, and then the best point of the objective function is X * = X k * ; otherwise, let X ( 0 ) = X k * · r ( k ) , r ( k + 1 ) = c · r ( k ) , k = k + 1, and go to (c).
When the termination criterion is met, the extreme point obtained in the iterative process will be the output as the optimal solution. In this algorithm, the initial point X ( 0 ) is randomly generated. The initial value of the penalty factor r ( 0 ) will affect the number of iterations. The decline factor c plays an important role in making the penalty factor decrease successively.
2.
Alternative Strategies.
In order to evaluate and compare the effects of our approach, other alternative strategies are also implemented here. Baseline1 means that the datacenter only uses four methods, including management of air conditioning cooling, direct airside free cooling, task delay scheduling, and DVFS for DR. For the DR target given by the smart grid, the optimization method is used to determine the most suitable adjustment method. Similarly, Baseline2 means that the datacenter uses four methods, including managing SC, FB, task delay scheduling, and DVFS for DR. Under Baseline3, the datacenter uses four methods without task scheduling and DVFS. We also implemented a heuristic method (Heuristic), which preferentially uses the direct airside free cooling adjustment method first, and then tries to manage air conditioning cooling, super capacitors, flow batteries, task delay scheduling, and DVFS in order until the preset target is met.

5. Evaluation and Analysis

In this section, we conduct a series of experiments to evaluate our synthetic approach and analyze the corresponding results compared with other alternative strategies.

5.1. Environment and Parameter Setting

In the experiment, the datacenter workload used comes from a load sample data set published by Alibaba in 2018 [63]. The data set records the detailed load information of a cluster with 4000 servers over a period of 8 days. According to related research [40], the control interval was set to one minute in the experiments. Referring to the setting of Zheng et al. [35], it was assumed that the idle power of each server is 150 W, and the power was 285 W when running at full load. The effective frequency set of the server in the experiment was set to {1.73, 1.86, 2.13, 2.26, 2.39, 2.40} GHz, and the safe temperature of the server entrance was limited to between 18 °C and 27 °C. Correspondingly, we simulated a datacenter comprising 4000 servers, in which 10 racks are arranged, and each rack has 8 rows [39]. The mass flow rate mf of the racks was 5.7 m3/s [37], the specific heat capacity of the air Cp was set to a constant value of 1005 J/(kg·K) [38], the pressure drop ∆p was set to 500 Pa, the air density ρ was set to 0.96 kg/m3, and the fan efficiency ηmfan was set to 70%. Taking into account the air humidity and other reasons, the critical temperature Tlow and Thigh of the hybrid cooling mode were set to 5 °C and 20 °C, respectively.
Super capacitors cannot be used to store energy for a long time. Therefore, we assumed that the super capacitor could fully use its own energy for discharging (DoDSC is 100%). In order to ensure that the datacenter was not affected in emergencies, the flow battery always stored the energy that can support the datacenter for 1 h (DoDFB is 50%). Referring to [64], we assumed that the SC can independently power the datacenter for 5 min, the FB can independently power the datacenter for 2 h, and the daily self-discharging rate of SC was set to 20%. In order to reduce the energy loss caused by AC/DC conversion, the SC and FB were integrated as ESDs into the server layer and datacenter layer [48], respectively.
According to the established power consumption model, the power consumption of the datacenter server every ten seconds could be obtained. Then, the load sample data for a day was generated from it, and the average hourly server power and cooling system power were calculated during the day. The results are shown in Figure 3, where the lower part of the histogram represents the power of 4000 servers in the datacenter and the upper part represents the power consumption of the corresponding cooling system.
According to Equation (18), the number of tasks arriving per minute in the server could be obtained. Combining the characteristics of Alibaba’s task load data in 2018 [63], the delay-sensitive tasks and the delay-tolerant tasks that met the experimental requirements were randomly generated. The task distribution is shown in Figure 4, where the higher part of the column represents the delay-tolerant task, and the lower part of the column represents the delay-sensitive task. In addition, in the direct airside free cooling model, the operating cost model, and penalty cost model, we used the outdoor temperature data of Xining City on 8 July 2018 [65] and the real-time electricity price of one day in Chicago, Illinois, USA [66], as shown in Figure 5 and Figure 6.

5.2. Experimental Setup

According to the objectives and constraints of the proposed optimization problem, MATLab, yalmip, and mosek toolboxes were used to solve the mixed integer linear optimization problem. In order to verify the effectiveness of the proposed method, in the following experiments, three test cases were designed according to the load management measures issued by the Taiwan power company [67], as shown in Figure 7. Case1 requires adjusting the original power to 1050 kW for one hour and adjusting to 850 kW for one hour, as shown in Figure 7a. Case2 requires adjusting to 1100 kW for half an hour and adjusting to 880 kW for forty minutes, as shown in Figure 7b. Case3 requires adjusting to 1060 kW for half an hour, and adjusting to 950 kW for fifty-five minutes, as shown in Figure 7c.

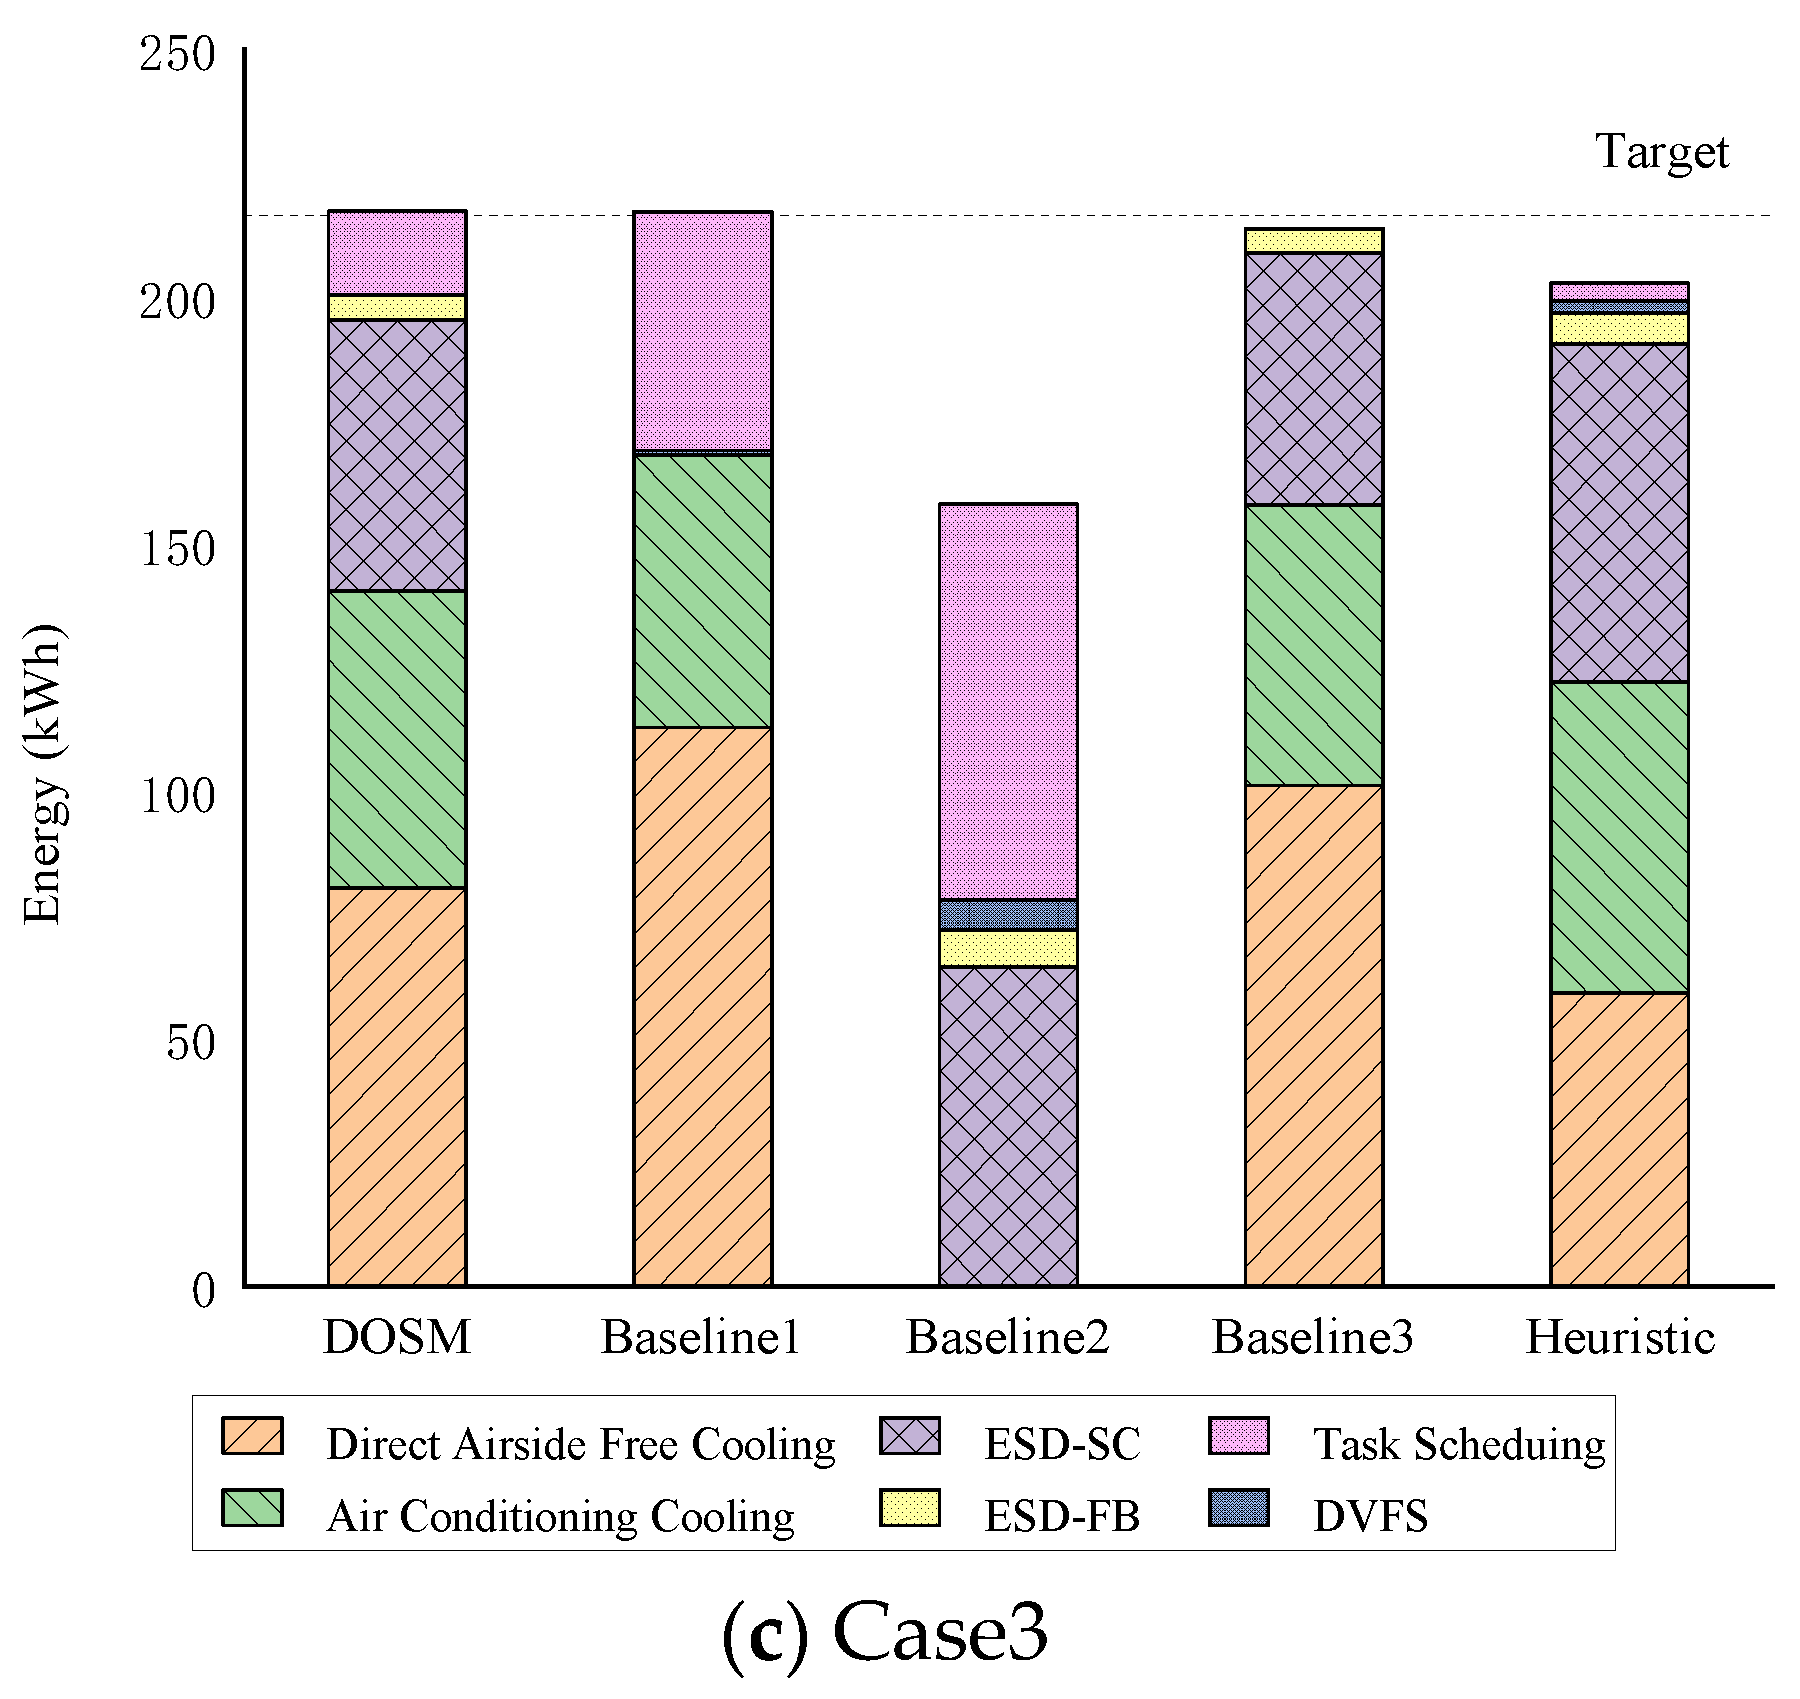
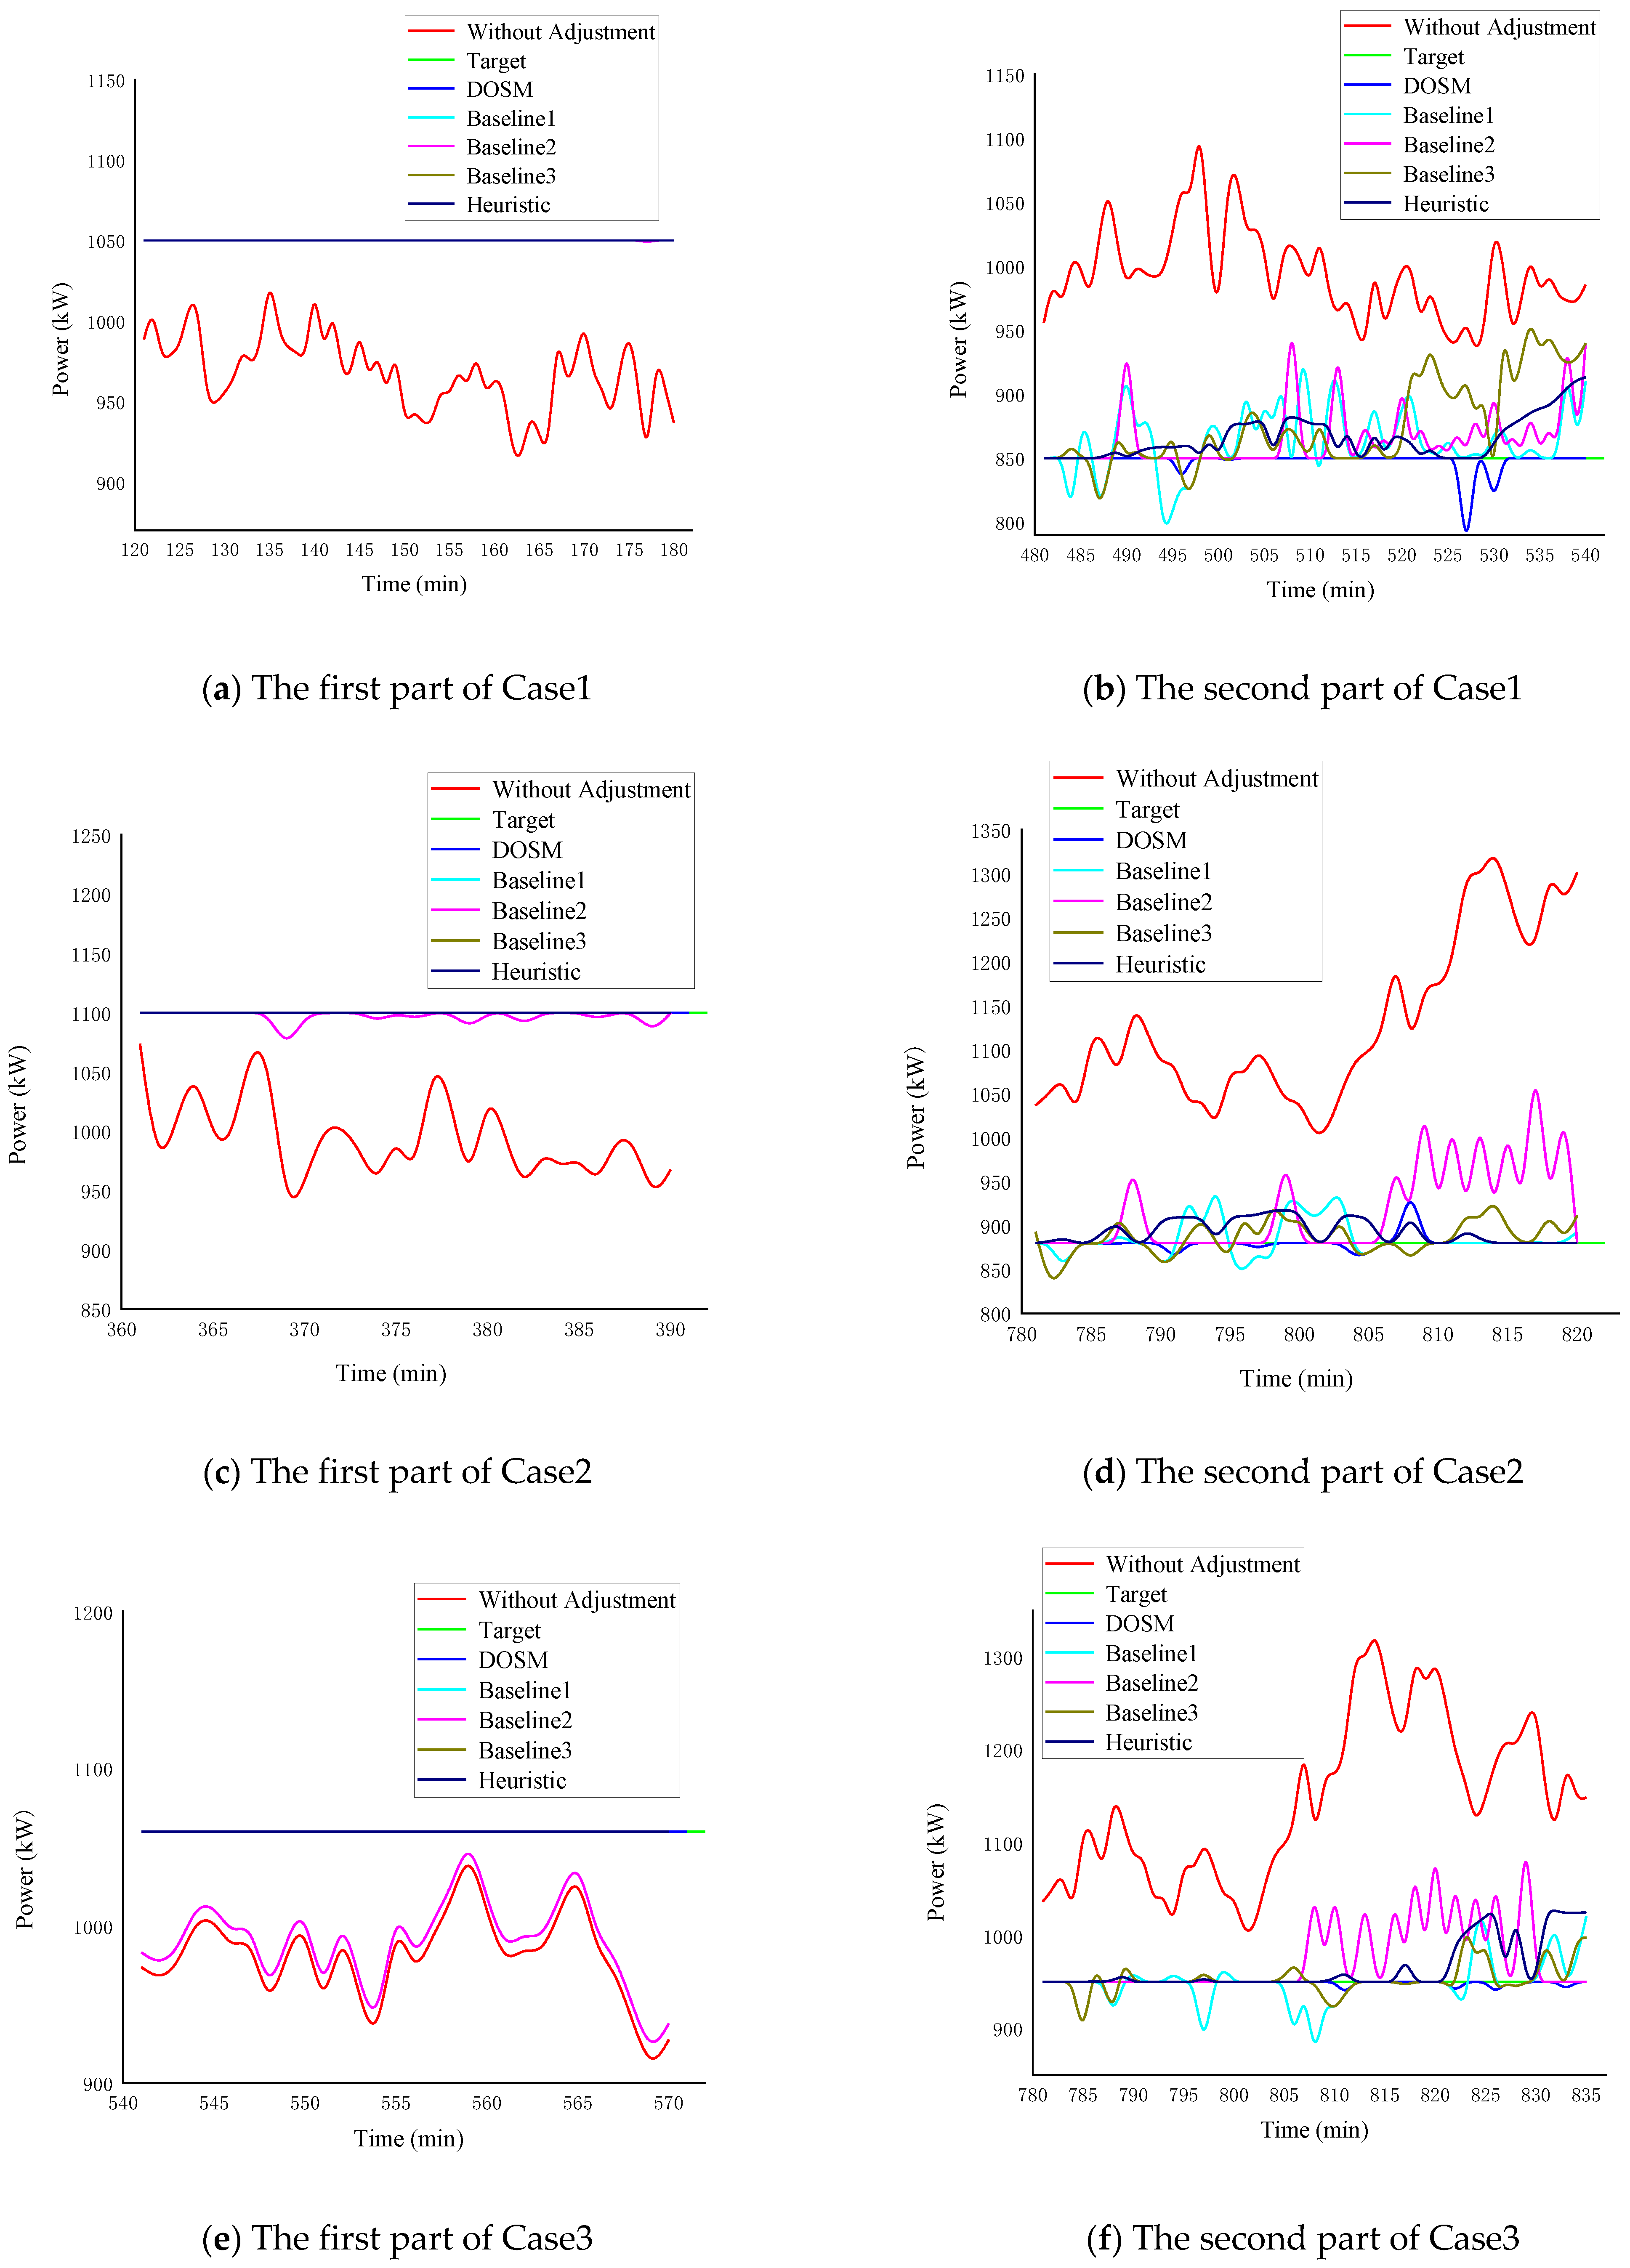
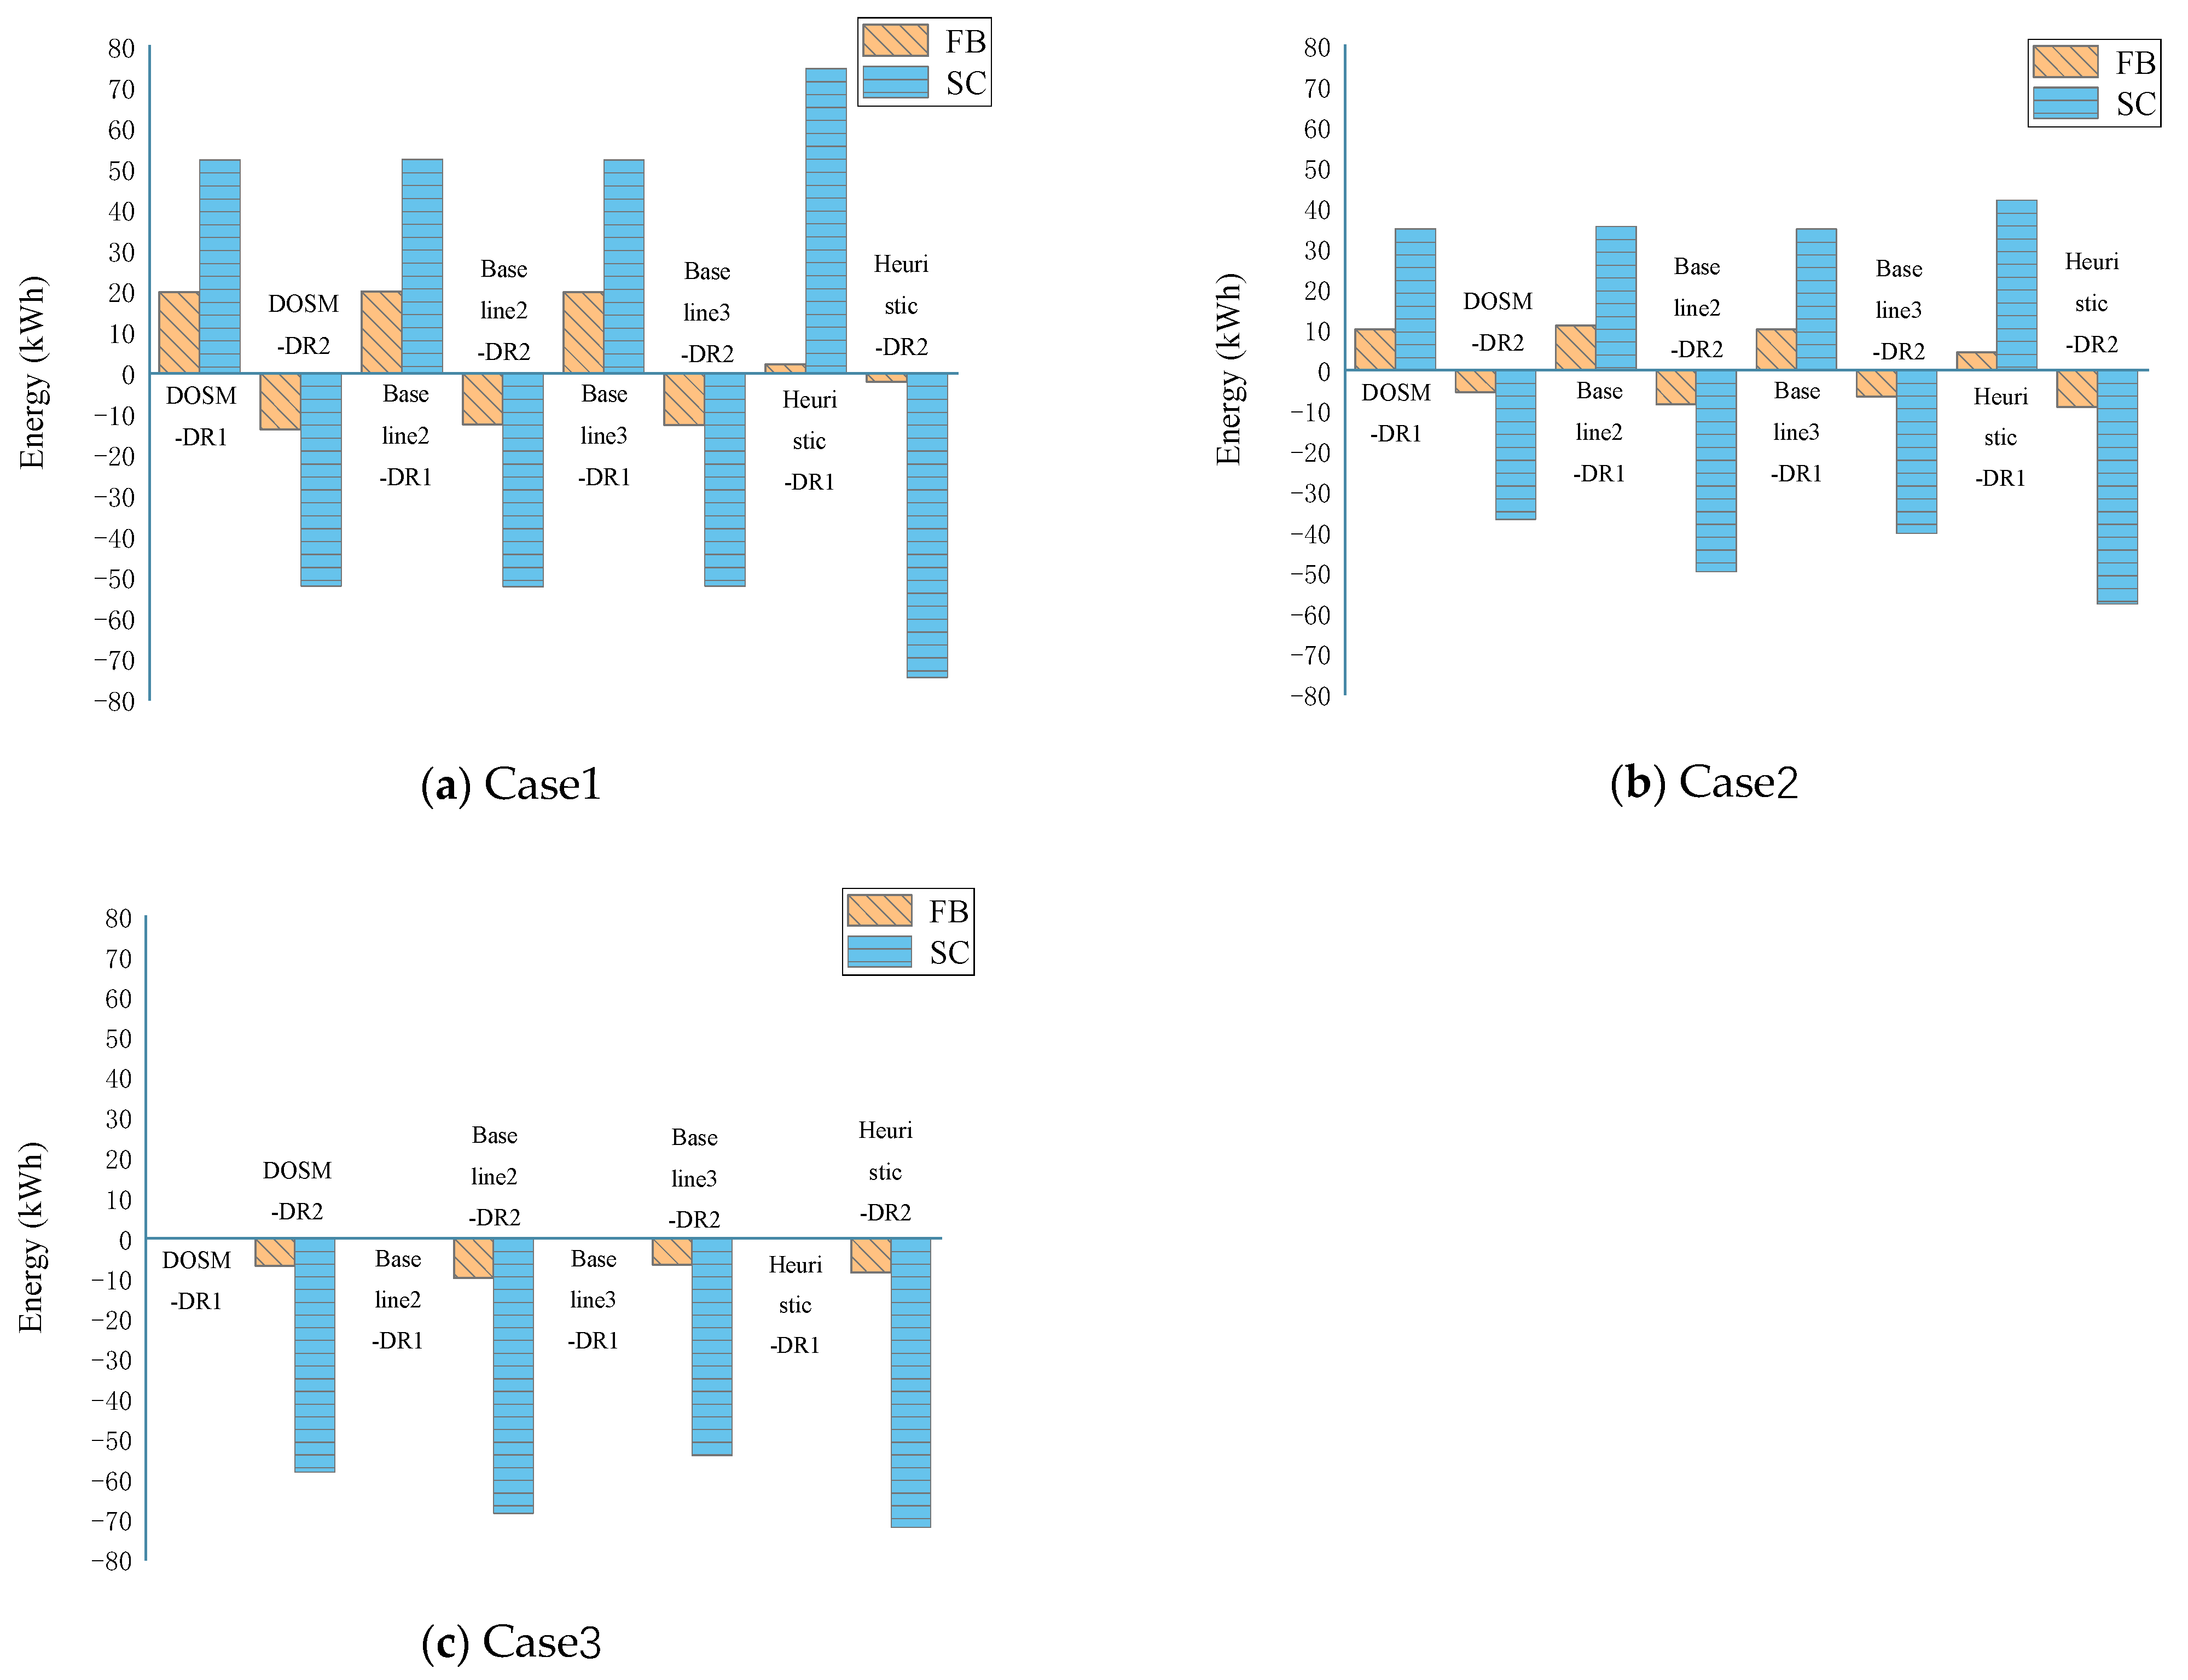
5.3. Analysis of Experimental Results

The simulation experiment compared the adjustment costs of Baseline1, Baseline2, Baseline3, Heuristic, and the DOSM strategy proposed in this paper during the DR process of Case1–3. The results of the three tests are shown in Table 3. It can be seen that, compared with the other four alternative methods, the approach proposed in this paper has obvious advantages in accurately adjusting the power of the datacenter while minimizing the adjustment cost. Compared with the other four methods, Baseline1 has the highest adjustment cost, which shows the important role of energy storage devices in power adjustment.
In order to fully illustrate the advantages and disadvantages of the model proposed in this paper, Figure 8 shows the distribution of power adjusted by different methods in each strategy during the DR process of Case1–3 in the datacenter. It can be seen from Figure 8a,c that the power consumption regulated under some strategies exceeds the target, which implies that the power after adjustment is lower than the target power. By analyzing the results, it is found that when direct airside free cooling is used for adjustment, the power after adjustment might be lower than the target power due to the low outdoor temperature. On the contrary, in some situations, the power after adjustment will be higher than the target if more power has been regulated up or down. In Figure 8b, the target is not reached under any strategy. By our analysis, the reason is that Case2 has higher requirements for power regulation. Furthermore, although using DVFS can forcibly reduce the number of tasks to be executed, it will seriously affect the QoS and increase the penalty. Therefore, DOSM tries to lower the adjustment cost within the acceptable accuracy error range.
In the process of datacenter work, its power consumption will always fluctuate over time. In order to illustrate the power adjustment deviation of different strategies during the DR procedure under different strategies, Figure 9 shows the real-time variation of datacenter power consumption in Case1–3. In Figure 9a,c,e, Baseline2 could not reach the target curve as well as other strategies. In Case1 and Case2, the power of the energy storage device is not saturated at the initial moment. Therefore, after the first DR signal arrives, Baseline2 could use the energy storage device, task delay scheduling, and DVFS technology to increase the power of the datacenter. However, the initial power state of ESDs in Case3 is saturated, and hence only task delay scheduling and DVFS could be used by Baseline2 to adjust the power of the datacenter. Therefore, Figure 9e shows a larger deviation from the target power. In contrast, other adjustment strategies could achieve the target power well. It can also be seen that the temperature control method plays an important role in changing the power of the datacenter. Figure 9b,d,f shows the adjustment of datacenter power by different strategies during the second DR procedure in Case1–3. In this figure, when the adjusted power value is higher than the target, it indicates that the current strategy cannot reduce the power to the target power using all kinds of adjustment methods. The adjusted power below the target is usually due to the outdoor temperature which has an impact on the power of direct airside free cooling. When the outdoor cold air temperature is low, it will lead to a greater reduction in the power consumption of the cooling system.
Overall, it can be observed that DOSM meets the target better than other alternative strategies. Moreover, Heuristic behaves better than Baseline1–3 in adjusting the real-time power consumption of the datacenter. However, when the outdoor temperature cannot meet the requirements of direct airside free cooling, or ESDs cannot meet the discharging constraints, only using task delay scheduling and DVFS technology will not only increase the penalty cost, but also fail to achieve the target power.
Figure 10 shows the changes of the stored energy in the ESDs when the datacenters uses different adjustment strategies to adjust its own power in Case1–3. In Case1, FBs and SCs are set to half full and empty in the initial state, respectively. In Case2, FBs and SCs are set to two-thirds full and half full in the initial state, respectively. When the datacenter receives an increasing signal of the smart grid, both SCs and FBs start to store energy. On the contrary, when the datacenter receives the power reduction signal of the smart grid, both SCs and FBs start to release energy. In Case3, FBs and SCs are set to full in the initial state. Therefore, when the datacenter receives an increasing signal of the smart grid, the energy stored by the FBs and SCs does not change. As can be seen in Figure 10a–c, the energy storage of ESDs changed more under Heuristic than other strategies. The reason is that Heuristic regulated the power in the preset order of temperature control, energy storage device, task delay scheduling, and DVFS. In addition, regardless of whether the datacenter receives a DR signal to increase or decrease power, the energy change in the energy of SCs is always more than that of FBs. This is determined by the characteristics of the ESD itself, since the maximum discharging power of SCs is higher than FBs. This characteristic of SCs can be leveraged to actively participate in the power regulation of the datacenter.

6. Summary and Future Work

Due to the variable and intermittent characteristics of renewable sources and the uncertainty of power generation, the sudden increase or decrease in power on the supply side increases the requirements for guaranteeing the stability of the power system. Since the power consumption of the datacenter is usually variable and controllable, it becomes a potential load for the smart grid system. Therefore, on the demand side, the datacenter can adjust its own power consumption to meet the needs of the smart grid, thereby helping the grid optimize itself. From the perspective of the datacenter, it should decide whether to participate in the DR program by calculating the total net revenue which might be impacted by various factors including the profit from executing user tasks, electricity prices, the penalty for degrading the service quality, etc. On this basis, we proposed a synthetic datacenter power consumption regulation method towards specific targets in this paper to instruct the datacenter to fulfill the task of adjusting power consumption towards the grid requirements. Based on the consideration of temperature control, energy storage device usage, and the server characteristics, a detailed and precise datacenter power consumption regulation approach was proposed while minimizing the total adjustment cost. We not only considered the impact of load changes on cooling system power consumption, but also used direct airside free cooling technology to save cooling power consumption. The task scheduling model is formulated by analyzing the type of loads, and the DVFS technique is also used to reduce the power consumption of the server. Different from the above methods, it is based on the charging and discharging characteristics the ESDs, and the dependence of the datacenter on the grid can be adjusted. Finally, the cost of these control methods and the penalty of inaccurate adjustment are incorporated into the total cost of power adjustment operation. In this way, the goal of accurately adjusting the power consumption of the datacenter while minimizing the adjustment cost could be achieved. The experimental results showed that the approach proposed in this paper could accurately control the power consumption of the datacenter while lowering the total cost incurred by the adjustment as much as possible. Generally, our approach is applicable to all kinds of datacenters which can use task delay scheduling methods according to the task characteristics. Various kinds of applications in industrial fields, especially CPU-intensive tasks, could be compatible here as the controllable load for power regulation of the datacenter on the premise of guaranteeing the QoS.
At present, the experiment in this paper only considered the cost of precise power adjustment of a datacenter. With the increase in datacenter energy consumption and wide-ranging establishment, datacenters in different geographical locations will be integrated into the smart grid, which might affect the stability of the entire grid and could be jointly considered in a systematic view. Therefore, in the future, we plan to continue to carry out related research on the power management of multiple geographically distributed datacenters and study their interactions with the smart grid. Naturally, in addition to the distributed datacenters adjusting its own power, we also consider increasing the utilization ratio of renewable energy supplied to the datacenters through the participation in the DR process according to the actual power generation of renewable energy in different regions, thereby reducing local carbon emissions.

Author Contributions

Conceptualization X.W. and M.Z.; methodology, X.W.; validation, X.W.; formal analysis, X.W.; investigation, M.Z.; writing—original draft preparation, M.Z.; writing—review and editing, X.W.; supervision, X.W.; project administration, X.W.; funding acquisition, X.W. All authors have read and agreed to the published version of the manuscript.

Funding

This paper is partially supported by the National Natural Science Foundation of China (No. 61762074) and National Natural Science Foundation of Qinghai Province (No.2019-ZJ-7034).

Data Availability Statement

The raw data of the datacenter load, the real-time electricity price of the grid and the raw data of outdoor air temperature used in this paper were obtained from the following links, including https://github.com/alibaba/clusterdata/blob/v2018/cluster-trace-v2018/trace_2018.md (accessed on 20 August 2020), https://hourlypricing.comed.com/live-prices/?date=20201008 (accessed on 8 October 2020), and https://www.nowapi.com/api/weather.history (accessed on 8 July 2018).

Conflicts of Interest

The authors declare no conflict of interest. The funders had no role in the design of the study; in the collection, analyses, or interpretation of data; in the writing of the manuscript, or in the decision to publish the results.

References

  1. Yang, F.; Chien, A.A. Extreme scaling of supercomputing with stranded power: Costs and capabilities. arXiv 2016, arXiv:1607.02133. [Google Scholar]
  2. Xu, J. Design and Implementation of IDC Virtualization Energy-Saving Environmental Dispatch Based on Cloud Computing Solutions; Fudan University: Shanghai, China, 2013. [Google Scholar]
  3. Du, Z.; Hu, J.; Chen, Y.; Cheng, Z.; Wang, X. Optimized QoS-aware replica placement heuristics and applications in astronomy data grid. J. Syst. Softw. 2011, 84, 1224–1232. [Google Scholar] [CrossRef]
  4. Bahrami, S.; Wong, V.W.S.; Huang, J. Data Center Demand Response in Deregulated Electricity Markets. IEEE Trans. Smart Grid 2019, 10, 2820–2832. [Google Scholar] [CrossRef]
  5. Zhang, Z.; Shen, C.; Fu, G.; Li, Y. Renewable power accommodation capability evaluation based on regional power balance. Hebei J. Ind. Sci. Technol. 2016, 33, 120–125. [Google Scholar]
  6. Liu, P.; Chu, P. Wind power and photovoltaic power: How to improve the accommodation capability of renewable electricity generation in China? Int. J. Energy Res. 2018. [Google Scholar] [CrossRef]
  7. Celik, B.; Rostirolla, G.; Caux, S.; Stolf, P. Analysis of demand response for datacenter energy management using GA and time-of-use prices, In Proceedings of the 2019 IEEE PES Innovative Smart Grid Technologies Europe (ISGT-Europe), Bucharest, Romania, 29 September–2 October 2019.
  8. Jung, H.; Wang, H.; Hu, T. Control design for robust tracking and smooth transition in power systems with battery/supercapacitor hybrid energy storage devices. J. Power Sources 2014, 267, 566–575. [Google Scholar] [CrossRef]
  9. Huang, Y.; Zeng, G.; Lu, D.; Fang, Z.; Huang, B. Voltage Stabilization in Micro Grid Based on Flexible Characteristic of Data Center Power. Electron. Sci. Technol. 2017, 30, 100–103. [Google Scholar]
  10. Wu, S.L.; Li, S.S.; Gu, F.C.; Chen, P.H.; Chen, H.C. Application of Super-Capacitor in Photovoltaic Power Generation System. In Proceedings of the 2019 IEEE International Conference of Intelligent Applied Systems on Engineering (ICIASE), Fuzhou, China, 26–29 April 2019. [Google Scholar]
  11. Zhao, M.; Wang, X. Datacenter Power Consumption Regulation towards Specific Targets in Smart Grid Environment. In Proceedings of the 2021 Asia-Pacific Conference on Communications Technology and Computer Science (ACCTCS), Shenyang, China, 22–24 January 2021; pp. 33–36. [Google Scholar]
  12. Zhang, X.; He, Z.; Li, C. Research on energy saving algorithms for datacenter in cloud computing systems. Appl. Res. Comput. 2013, 30, 961–964. [Google Scholar]
  13. Wu, W. Research on Data Center Energy Saving Based on DVFS; Harbin Institute of Technology: Harbin, China, 2017. [Google Scholar]
  14. Huai, W. Research on DVFS-Based Task Scheduling Problem in Data Centers; Nanjing University: Nanjing, China, 2014. [Google Scholar]
  15. Wu, W.; Yang, R.; Li, M. Energy efficiency strategy in cloud data center based on DVFS-aware and dynamic virtual machines consolidation. Appl. Res. Comput. 2018, 35, 2484–2488. [Google Scholar]
  16. Tang, C.J.; Dai, M.R.; Chuang, C.C.; Chiu, F.S.; Lin, W.S. A load control method for small data centers participating in demand response programs. Future Gener. Comput. Syst. 2014, 32, 232–245. [Google Scholar] [CrossRef]
  17. Ko, J.S.; Huh, J.H.; Kim, J.C. Improvement of Energy Efficiency and Control Performance of Cooling System Fan Applied to Industry 4.0 Data Center. Electronics 2019, 8, 582. [Google Scholar] [CrossRef] [Green Version]
  18. Nadjahi, C.; Louahlia, H.; Stéphane, L. A review of thermal management and innovative cooling strategies for data center. Sustain. Comput. Inform. Syst. 2018, 19, 14–28. [Google Scholar] [CrossRef]
  19. Li, Z.; Lin, Y. Energy-saving study of green data center based on the natural cold source. In Proceedings of the International Conference on Information Management, Xi’an, China, 23–24 November 2013. [Google Scholar]
  20. TakahashI, M.; Takamatu, T.; Shunsuke, O. Indirect External Air Cooling Type Energy-Saving Hybrid Air Conditioner for Data Centers, “F-COOL NEO”. Fuji Electr. Rev. 2014, 60, 59–64. [Google Scholar]
  21. Chen, H.; Coskun, A.K.; Caramanis, M.C. Real-time power control of data centers for providing Regulation Service. In Proceedings of the 52nd IEEE Conference on Decision and Control, Firenze, Italy, 10–13 December 2013. [Google Scholar]
  22. Narayanan, I.; Wang, D.; Mamun, A.A.; Fathy, H.K.; James, S. Evaluating energy storage for a multitude of uses in the datacenter. In Proceedings of the 2017 IEEE International Symposium on Workload Characterization (IISWC), Seattle, WA, USA, 1–3 October 2017. [Google Scholar]
  23. Guruprasad, R.; Murali, P.; Krishnaswamy, D.; Kalyanaraman, S. Coupling a small battery with a datacenter for frequency regulation. In Proceedings of the 2017 IEEE Power & Energy Society General Meeting, Chicago, IL, USA, 16–20 July 2017. [Google Scholar]
  24. Longjun, L.; Hongbin, S.; Chao, L.; Tao, L.; Zheng, Z. Exploring Customizable Heterogeneous Power Distribution and Management for Datacenter. IEEE Trans. Parallel Distrib. Syst. 2018, 29, 2798–2813. [Google Scholar]
  25. Mamun, A.; Narayanan, I.; Wang, D.; Sivasubramaniam, A.; Fathy, H.K. Multi-objective optimization of demand response in a datacenter with lithium-ion battery storage. J. Energy Storage 2016, 7, 38. [Google Scholar] [CrossRef] [Green Version]
  26. Yuan, L. Research on Precise Power Control Technology Based on Request Tracing; University of Chinese Academy of Sciences: Huairou District, Beijing, China, 2011. [Google Scholar]
  27. Huang, Y.; Wang, P.; Xie, G.; An, J.X. Data Center Energy Cost Optimization in smart grid: A review. J. Zhejiang Univ. (Eng. Sci. Ed.) 2016, 50, 2386–2399. [Google Scholar] [CrossRef]
  28. Yang, T.; Zhao, Y.; Pen, H.; Wang, Z. Data center holistic demand response algorithm to smooth microgrid tie-line power fluctuation. Appl. Energy 2018, 231, 277–287. [Google Scholar] [CrossRef]
  29. Zhang, X.; Li, Z. Development of data center cooling technology. J. Eng. Thermophys. 2017, 38, 226–227. [Google Scholar]
  30. Su, L.; Dong, K.; Sun, Q.; Huang, Z.; Liu, J. Research Progress on Energy Saving of Data Center Cooling System. Adv. New Renew. Energy 2019, 7, 93–104. [Google Scholar]
  31. Zhang, H.; Shao, S.; Tian, C. Research Advances in Free Cooling Technology of Data Centers. J. Refrig. 2016, 37, 46–57. [Google Scholar]
  32. Wang, Y.; Wang, X.; Zhang, Y. Leveraging thermal storage to cut the electricity bill for datacenter cooling. Workshop Power-aware Comput. Syst. ACM 2011, 8, 1–5. [Google Scholar]
  33. Saadi, Y.; Kafhali, S.E. Energy-efficient strategy for virtual machine consolidation in cloud environment. Soft Comput. 2020, 2, 14845–14859. [Google Scholar] [CrossRef]
  34. Akbari, A.; Khonsari, A.; Ghoreyshi, S.M. Thermal-Aware Virtual Machine Allocation for Heterogeneous Cloud Data Centers. Energies 2020, 13, 2880. [Google Scholar] [CrossRef]
  35. Zheng, W.; Ma, K.; Wang, X. Exploiting thermal energy storage to reduce data center capital and operating expenses. In Proceedings of the 2014 IEEE 20th International Symposium on High Performance Computer Architecture (HPCA), Orlando, FL, USA, 15–19 February 2014; pp. 132–141. [Google Scholar]
  36. Guo, Y.; Gong, Y.; Fang, Y.; Geng, X. Energy and Network Aware Workload Management for Sustainable Data Centers with Thermal Storage. Parallel and Distributed Systems. IEEE Trans. 2014, 25, 2030–2042. [Google Scholar]
  37. Chen, S.; Pedram, M. Efficient Peak Shaving in a Data Center by Joint Optimization of Task Assignment and Energy Storage Management. In Proceedings of the 2016 IEEE 9th International Conference on Cloud Computing (CLOUD), San Francisco, CA, USA, 27 June–2 July 2016. [Google Scholar]
  38. Tang, Q.; Gupta, S.K.S.; Stanzione, D.; Cayton, P. Thermal-Aware Task Scheduling to Minimize Energy Usage of Blade Server Based Datacenters. In Proceedings of the 2006 2nd IEEE International Symposium on Dependable, Autonomic and Secure Computing, Indianapolis, IN, USA, 29 September–1 October 2006. [Google Scholar]
  39. Moore, J.; Chase, J.S.; Ranganathan, P.; Sharma, R. Making scheduling cool: Temperature-aware workload placement in data centers. In Proceedings of the Usenix Annual Technical Conference, Anaheim, CA, USA, 10–15 April 2005; p. 5. [Google Scholar]
  40. Yang, Y.; Yang, Z. The Requirement of Data Center Equipment and the Selection of Cooling System. Refrig. Air-Cond. 2015, 9, 95–100. [Google Scholar]
  41. Zhao, M.; Wang, X. A Survey of Research on Datacenters Using Energy Storage Devices to Participate in Smart Grid Demand Response. In Proceedings of the 2020 IEEE International Conference on Power, Intelligent Computing and Systems (ICPICS), Shenyang, China, 28–30 July 2020. [Google Scholar]
  42. You, Y. Introduction to flow battery. Ups Appl. 2015, 9, 17–19. [Google Scholar]
  43. Chang, Z.; Wang, Z.; Yuan, T.; Wang, Q.; Li, G.; Wang, N. Research on comprehensive modeling of vanadium redox flow battery. Adv. Technol. Electr. Eng. Energy 2019, 38, 73–80. [Google Scholar]
  44. Skyllas-Kazacos, M.; Chakrabarti, M.H.; Hajimolana, S.A.; Mjalli, F.S. Progress in Flow Battery Research and Development. J. Electrochem. Soc. 2011, 158, R55. [Google Scholar] [CrossRef]
  45. Shigematsu, T. Redox flow battery for energy storage. S Tech. Rev. 2011, 73, 4–13. [Google Scholar]
  46. Lin, H.; Xie, Y. Application of Different Energy Storage Components in UPS. World Power Supply 2014, 11, 49–55. [Google Scholar]
  47. Ou, Y.; Luo, W. Application of Flywheel Energy Storage Technology in Data Center and Communication Station. Telecom Power Technol. 2019, 36, 72–74. [Google Scholar]
  48. Mengshu, S.; Yuankun, X.; Paul, B.; Tang, J.; Wang, Y.; Lin, X. Hierarchical and hybrid energy storage devices in data centers: Architecture, control and provisioning. PLoS ONE 2018, 13, e0191450. [Google Scholar]
  49. Zheng, W.; Ma, K.; Wang, X. Hybrid Energy Storage with Supercapacitor for Cost-efficient Data Center Power Shaving and Capping. IEEE Trans. Parallel Distrib. Syst. 2016, 1, 1. [Google Scholar] [CrossRef]
  50. Cong, T.N. Progress in electrical energy storage system: A critical review. Prog. Nat. Sci. 2009, 3, 23–44. [Google Scholar]
  51. Ding, N.; Huang, X. Analysis on the Trend of Storage Lithium Battery Application in the Data Central Computer Rooms. Fin. Tech. Time 2018, 10, 82–85. [Google Scholar]
  52. Pierson, J.M.; Baudic, G.; Caux, S.; Celik, S.; Costa, G.D.; Grange, L.; Haddad, M. DATAZERO: Datacenter with Zero Emission and Robust management using renewable energy. IEEE Access 2019, 99, 1. [Google Scholar] [CrossRef]
  53. Wang, D.; Ren, C.; Sivasubramaniam, A.; Urgaonkar, B.; Fathy, H. Energy Storage in Datacenters: What, Where, and How much? ACM SIGMETRICS Perform. Eval. Rev. 2012, 40, 1. [Google Scholar] [CrossRef]
  54. Hainan, Z.; Shao, S.; Xu, H.; Zou, H.; Tian, C. Free cooling of data centers: A review. Renew. Sustain. Energy Rev. 2014, 35, 171–182. [Google Scholar]
  55. Cupelli, L.; Thomas, S.; Jahangiri, P.; Fuchs, M.; Monti, F.; Muller, D. Data Center Control Strategy for Participation in Demand Response Programs. IEEE Trans. Ind. Inf. 2018, 11, 1. [Google Scholar] [CrossRef]
  56. Gao, T. Research on Cooling Methods Optimization of Data Center in North China; North China Electric Power University: Beijing, China, 2019. [Google Scholar]
  57. Yang, F. Analysis of Natural Cooling Methods in Data Center. China Sci. Technol. 2015, 9, 2. [Google Scholar]
  58. Yu, H. Discussion on the Energy Saving Scheme of Wind Side Natural Cooling in Data center. Intell. Build. Smart City 2018, 2, 40–41. [Google Scholar]
  59. Geng, H.; Li, J.; Zou, C. Discussion on Outdoor Air Cooling Energy Saving Technology of Data Center in Temperate Zone. Heat. Vent. Air Cond. 2017, 10, 19–25. [Google Scholar]
  60. Li, X.; Si, Y. Control strategy of UPS for Data Center Based on Economic Dispatch. Power Grid Anal. Study 2019, 47, 31–37. [Google Scholar]
  61. Lu, J. Energy Saving and Economy Analysis of Data Center Air Conditioning System Based on Application of Natural Cooling Technology; Hefei University of Technology: Hefei, China, 2016. [Google Scholar]
  62. Garg, S.K.; Gopalaiyengar, S.K.; Buyya, R. SLA-Based Resource Provisioning for Heterogeneous Workloads in a Virtualized Cloud Datacenter. In Proceedings of the 11th International Conference, ICA3PP, Melbourne, Australia, 24–26 October 2011. [Google Scholar]
  63. Available online: https://github.com/alibaba/clusterdata/blob/v2018/cluster-trace-v2018/trace_2018.md (accessed on 20 August 2020).
  64. Zhang, Y. A QoS-Based Energy-Aware Task Scheduling Method in Cloud Environment; Nanjing University of Information Science and Technology: Nanjing, China, 2018. [Google Scholar]
  65. Zhongshan Nuopi Information Technology Co., Ltd. Available online: https://www.nowapi.com/api/weather.history (accessed on 8 July 2018).
  66. An Exelon Company. Available online: https://hourlypricing.comed.com/live-prices/?date=20201008 (accessed on 8 October 2020).
  67. Taiwan Power Company. Available online: https://www.taipower.com.tw/tc/index.aspx (accessed on 20 August 2020).
Figure 1. System architecture.
Energies 14 02602 g001
Figure 2. Power consumption breakdown of datacenters.
Energies 14 02602 g002
Figure 3. Datacenter power consumption in a day.
Energies 14 02602 g003
Figure 4. Number of tasks in the datacenter.
Energies 14 02602 g004
Figure 5. Changes in outdoor temperature in a day (taking Xining City, Qinghai Province, 8 July 2018 as an example).
Energies 14 02602 g005
Figure 6. The real-time power price changes in one day (taking Chicago, Illinois, USA, 8 October 2020 as an example).
Energies 14 02602 g006
Figure 7. Demand response requirements of different cases.
Energies 14 02602 g007
Figure 8. Distribution of the power regulated under different strategies in Case1–3.
Energies 14 02602 g008aEnergies 14 02602 g008b
Figure 9. The power consumption variation in Case1–3.
Energies 14 02602 g009
Figure 10. Charging/discharging energy of ESD storage energy in different cases.
Energies 14 02602 g010
Table 1. Notations of parameters.
NotationDescriptionUnit
Constant
α The difference between peak power and idle power of the server kW
β The idle power of the server kW
η E S D D The discharging efficiency of the ESD %
η E S D C The charging efficiency of the ESD %
ε E S D Self-discharge rate of the ESD %
T r a m p The ramp rate s
ω E S D The ratio of discharge rate to recharge rate %
P E S D m The maximum power kW
τ T D The penalty coefficient
f m a x The highest operating frequency of the server GHz
m f The mass flow rate m 3 / s
C p The specific heat capacity of air J / ( kg · K )
ρ The air density kg / m 3
Δ p The pressure drop Pa
η m f a n The fan efficiency %
T l s a f e The minimum value of safe temperature ° C
T h s a f e The maximum value of safe temperature ° C
M The number of servers #
c h e a d l e The maximum processing capacity of the server # (tasks)/s
Δ t The length of a time interval s
Variables
P D C The power of the datacenter kW
P s The power of the server kW
E s The energy consumption of the server kWh
u c p u CPU utilization %
P c The power consumption of the cooling system kW
E c The energy consumption of the cooling system kWh
D e v re The device capacity kWh
E S D re Needed energy stored by ESD kWh
E E S D t The energy stored at time t kWh
D o D E S D Depth of discharge %
E l o s s The energy loss %
t d s a The task arrival time of delay-sensitive task s
t d t a The arrival time of delay-tolerant task s
t m a x i The tolerable delay time interval s
t b u s y The busy time of the server s
λ i The initial average number of tasks in the i-th time slot #
T i n The inlet temperature of the server ° C
D The heat distribution matrix
G The mass flow kg / s
T o The outdoor temperature ° C
P m f a n The power of the fan W
p r i c e The electricity price$/kWh
T s u p The air conditioning supply temperature ° C
T i n s a f e The safe temperature of the server entrance ° C
r E S D t The actual charging power at time t kW
d E S D t The discharging power at time t kW
D E S D t The effective discharging power kW
R E S D t The rechargeable power kW
i m i The number of tasks moving in in the i-th time slot #
e m i The number of tasks moving out in the i-th time slot #
f o p The operating frequency of the host GHz
P a i r The adjustable power consumption of the air conditioning cooling kW
P f a n The adjustable power consumption of the direct airside free cooling kW
P S C The adjustable power consumption of the super capacitor kW
P F B The adjustable power consumption of the flow battery kW
P T D The adjustable power consumption of the task scheduling kW
P D V F S The adjustable power consumption of the DVFS method kW
P d i f f The deviation between the adjusted power and the target power kW
O p E x E S D The operating cost of ESD$
O p E x a i r The operating cost of the cooling system$
P e E x T D The penalty of task delay scheduling$
P e E x d i f f The penalty of inaccurate adjustment$
Table 2. Abbreviations table.
DescriptionAbbreviation
Energy Storage DevicesESD
Demand ResponseDR
Dynamic Voltage and Frequency ScalingDVFS
Quality of Service QoS
Service Level AgreementSLA
Virtual MachineVM
Coefficient of PerformanceCoP
Flow BatteryFB
Super CapacitorSC
Uninterruptible Power SupplyUPS
Depth of Discharge DoD
Dynamic Optimal Scheduling MethodDOSM
Table 3. Comparison of adjustment costs under different strategies.
Cost ($)DOSMBaseline1Baseline2Baseline3Heuristic
Case11096.076455.681567.962438.271372.38
Case2458.663165.082360.591693.05864.97
Case3652.465225.014700.421721.831405.42
Publisher’s Note: MDPI stays neutral with regard to jurisdictional claims in published maps and institutional affiliations.

