1. Introduction
Energy is a key factor in the development of modern industrial civilization. It covers all types of human economic activity, from mining, industrial production, agriculture and transport to the service sector. It has a decisive influence on the growth of the economy and increasing the well-being of mankind. In the 20th century, the world GDP grew in direct proportion to the volume of energy production:
[
1]. As a result, the level of world energy consumption increased by 15 times with a 3.8-fold an increase in the Earth’s population [
2]. The decoupling of energy use and economic growth is demonstrated by many scientists, including [
3,
4,
5,
6], and others. Certainly, it is also of great interest to compare the growth of the population with the growth of energy consumption as the principal resource for development. Such a study, with the aim of establishing a functional relationship between the value of global energy consumption and world population growth, was first performed by J. Holdren [
7]. He demonstrated that the total energy consumption
throughout the 20th century was proportional to the square of the world population
:
Economic growth, income, price level, foreign direct investment, trade openness, human development index, and technological innovations are also considered as the factors that impact energy consumption [
8,
9,
10,
11,
12]. However, the population is one of the most important factors. In 1994, Mazur also analyzed statistical data for the period 1947–1991 in America and concluded that population growth may have a key role in the long-term energy consumption growth [
13]. Kadoshin and his colleagues statistically proved that besides economic development, population growth also significantly influences energy consumption using examples of the USA, Latin America, China, India, and other countries [
11]. Studying energy consumption in buildings, Pérez-Lombard reported that population growth and increasing demand for building services and comfort levels as a result, along with the rise in time spent inside buildings also increase energy demand [
14]. Wang and Li also showed that in India energy use growth in 1970–2012 was a result of the relatively rapid increase in population and the relatively slow increase in income [
15].
Most of people’s life and activity aspects are associated with the use of one or another type of energy. Therefore, an increase in human energy consumption led to an improvement in the comfort of his life, which in turn had a positive effect on an increase in the population. These two factors led to the rapid growth of world energy consumption and production in the 20th century [
1]. The leading role of the energy sector in the formation and development of the information-digital society will certainly remain in the 21st century.
The growing world population causes a subsequent increase in the need for fuel and energy resources, ensuring modern industrial development and the increase of food production. At the same time, energy has become the main source of environmental pollution—land, atmosphere and water resources, which has led to unprecedented degradation of the human environment. Moreover, the Earth’s biosphere is being intensively destroyed, partially losing the most important function of stabilizing the environment and climate. Hence, energy-ecological development is the most important factor for sustainable development and global security in the 21st century. Greenhouse gases emitted into the atmosphere from the combustion of fossil hydrocarbon fuels—coal, oil and natural gas in power plants—have caused global warming, which has already exceeded 1 °C (2018) compared to the pre-industrial level (1850) [
16]. Climatologists argue that an increase in global warming by 2 °C can lead to a global environmental crisis with unpredictable negative consequences for human existence.
Therefore, the UN recognized the stabilization of the Earth’s climate as the main environmental imperative of the century and in 2015 at the climate conference in Paris adopted a historic agreement requiring the increase in the average global temperature be kept below 1.5–2 °C, which, in turn, requires a decrease in greenhouse gases emissions by 2050 or, in extreme cases, by 2070 by two-thirds, from the current 33.3 Gt to 11.1 Gt [
17,
18]. This means that any energy strategy of the 21th century should be aimed at the transition to the predominant use of renewable energy sources (RES) and the displacement of fossil hydrocarbon fuels. Thus, humanity first of all needs to make an energy transition to carbon-free renewable energy sources for the transition to sustainable development.
The Paris Climate Agreement has already contributed to the energy transition to the predominant use of renewable energy sources and the displacement of hydrocarbon fuels, especially coal. This has also been facilitated by a significant reduction in the cost of building renewable energy sources in recent years, so that in many countries they have become competitive with gas and coal power plants [
19]. For example, the cost of wind energy in the Unites States declined by more than 65% from 2009 to 2016 [
20]. Solar installation cost was reduced by 70 percent from 2010 to 2017 [
21]. According to [
22] the global weighted-average price of electricity generation from geothermal and offshore wind declined by 1% in 2018, hydropower by 12%, solar photovoltaics and onshore wind by 13%, bioenergy by 14%, and solar power by 26%. Now the challenge is to accelerate this process everywhere. In the three previous energy transitions it took about 60 years on average to switch to a new dominant energy source [
23,
24]. In this work, the first energy transition is the transition from firewood and waste to coal, the second is from coal to oil, and the third is from oil to gas. The forthcoming 4th energy transition needs to be accelerated by 2–3 times and complete in the 2040s–2050s [
23,
24]. But the energy transition is largely an evolutionary process, characterized by a long period of development and not always allowing excessive acceleration. In addition, if natural economic incentives and increased energy value of new fuel, which worked automatically, served as the driver of the transition earlier, then now the state energy policy should serve as a driver—the policy of decarbonization of energy in order to stabilize the Earth’s climate. Without state energy policies it’s almost impossible to realize the new energy transition [
25]. One of the main reasons is socio-economic ambitions that include the increase in the number of vehicles, additional heating, cooling and lighting, additional production of goods and services, and so on. State policy also includes investment in energy technologies that contribute to their fast development. Many examples demonstrate how state energy policy determines countries’ energy transition paths. Norway and Iceland already produce more than 98% of their energy from renewable sources [
26]. China being the world’s number one polluter at the same time addresses the biggest investment to renewable energy. In 2018 China’s renewable energy capacity reached almost 40% of total installed power capacity [
27]. State energy policies of Costa Rica, Denmark, Germany, Kenya, Morocco, Nicaragua, Scotland, Sweden, Uruguay, and the USA, are also aimed to eliminate fossil fuels from electricity generation [
28]. Therefore, the success of the upcoming energy transition will depend on urgent and consistent measures to strengthen and intensify the policy of decarbonization of energy around the world within the framework of the requirements of the Paris Agreement.
2. Transition to a New Paradigm of Energy Consumption
As we saw above, in the 20th century, humanity was very wasteful of energy [
29]. In this regard, the question naturally arises: will the indicated quadratic dependence of the growth of energy consumption in the world remain in the 21st century, or is it transformed into a more economical dependence, for example, a linear one, due to an increase in energy efficiency? To give an answer to this question, discuss the general patterns of energy consumption in the modern world. First of all, it should be noted that the classification of the world into developed and developing countries significantly affects the amount of energy produced and the nature of its distribution. Currently, 40% of all energy generated in the world is consumed in industrialized countries with a population of slightly more than 1 billion people, and 60% falls to the remaining 6 billion people [
30] (pp. 7–9). Moreover, most developed countries have a similar structure of production and consumption of primary energy: about 25% of the total energy consumption is spent on industrial production; 30% for transport of all types and the rest 45% for heating, lighting and cooking [
31].
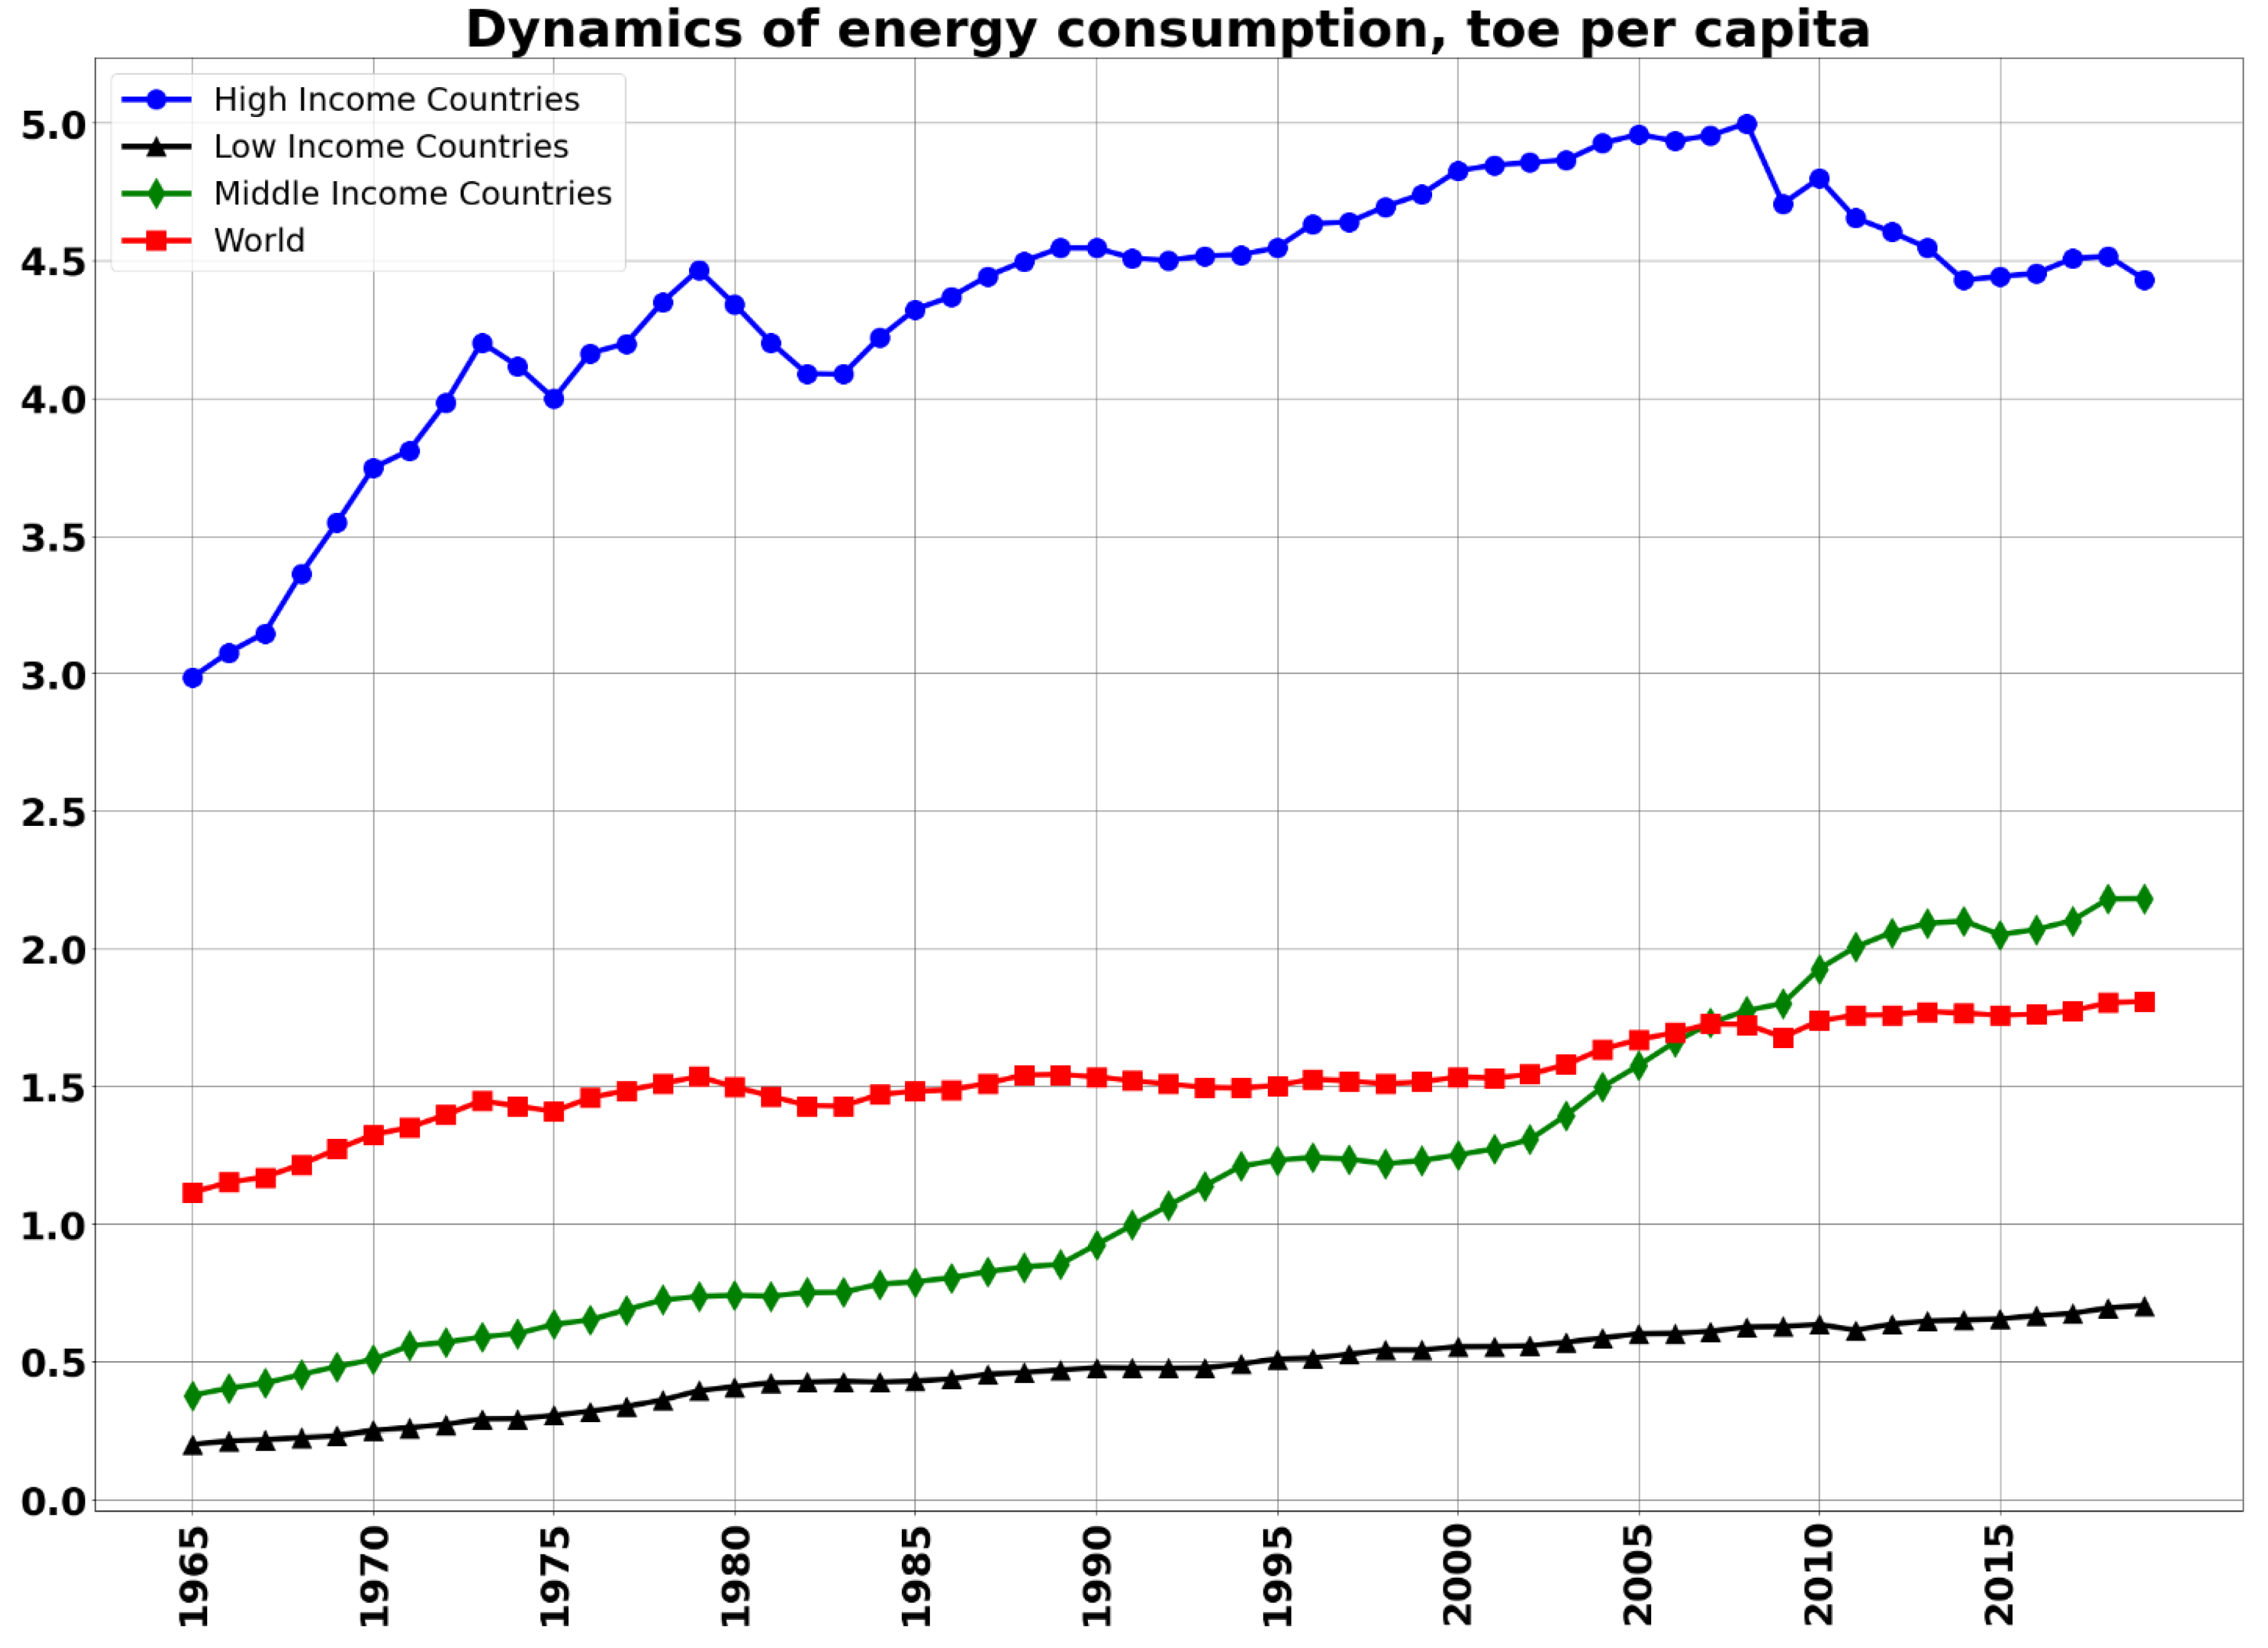
One of the indicators showing the level of consumption and needs is energy consumption per capita. Without reaching a certain critical level of energy consumption, it is impossible to achieve the required development of productive forces and economic well-being in most countries. Given that different countries currently have different levels of energy consumption, a significant differentiation of per capita energy consumption can be noted, as shown in
Table 1. (in tonnes of oil equivalent—toe per capita).
For example, energy consumption per capita in developed countries is almost 3 times greater than the world average. However, developing countries have energy consumption per capita more than 2.4 times less than the world average. The gap between the countries of the world in per capita energy consumption reaches 7 times the level.
Nevertheless, an assessment of the dynamics of global energy consumption over the past century shows a constantly narrowing gap between per capita energy consumption in developed and developing countries [
32], so, if at the beginning of the last century per capita energy consumption in developed countries was 52 times bigger than in developing countries, then at the end of the century it became seven times bigger (see
Table 2). Moreover, developing countries are characterized by a tendency of rapidly narrowing gap in actual per capita energy consumption relative to the world average. So, if at the beginning of the century it was more than 22 times gap, then at the end of the century its multiplicity equaled to 2.5 (see
Table 2). The consideration of
Table 2 also shows that the ratio of per capita energy consumption in developed countries to average per capita energy consumption in the world as a whole remained practically constant throughout the 20th century and approximately equals to 2.65.
Thus, the dynamics of distribution is focused on equalizing the specific energy consumption between the two groups of countries. The most significant conclusion is that the reduction in the difference in specific energy consumption between the two groups of countries with low (developing countries) and high (developed countries) energy consumption is an objective trend of our time. One of the main reasons leading to the growth of energy consumption is the process associated with the growth of the economies of developing countries. If this trend towards leveling will continue in the coming decades, then per capita energy consumption in developing countries will be comparable to its current global average level around the 2040s. This follows from the extrapolation of the current growth trajectory of energy consumption in developing countries according to the logistic function [
32] (p. 14). If energy consumption in developed countries remains at the current level, then according to the BP Evolving transition scenario the demand for energy resources may reach about 16 billion toe, while the amount of fossil fuels production projected by 2030 is about 12.4 billion toe [
33] (p. 15). It should be noted that over the past thirty years, the world consumption of energy resources has doubled from 7.5 billion toe in the end of 1980-s to today 14 billion toe [
30] (p. 8), [
1] (Table “Primary Energy: Consumption”).
It follows from this that developed countries must certainly continue to reduce energy consumption and assist developing countries in adopting energy-saving and energy-efficient technologies, so that they also reduce the growth rate of energy consumption from the current approximately 3% per year by 2030 [
1] (Table “Primary Energy Consumption”). The vanguard developing countries carrying out large-scale industrialization could only restrain unlimited growth in energy consumption if there will be reciprocal movement of developed countries to reduce energy consumption per capita. As it will be shown below, the acceptable global per capita energy consumption rate is approximately 1.8 toe per capita, i.e., half the actual value for developed countries.
Over the past 40 years, significant changes have taken place in the world energy sector, associated primarily with the transition from extensive ways of its development, from energy euphoria to a pragmatic energy policy based on increasing the efficiency of energy use and its all-round saving. In the first half or even most of the 20th century until the global oil crisis of the 1970s energy resources (coal, oil, gas) were used significantly. At the beginning of the 20th century, when coal and oil were easily accessible, and their reserves seemed unlimited, there was real euphoria, and environmental problems were not at their full scale as they are today, developed countries followed the path of a wasteful extensive (quantitative, not qualitative) increase in energy consumption which was expressed in the Holdren Formula (1): . The real concern for energy efficiency appeared after the oil crises of the 1970s. Then there was a real revolution in technologies for the production and consumption of energy. The energy system transformed. As a result, the quadratic formula for energy consumption (1) was changed into a linear Equation (2): . It is this process that we call the transition from extensive ways of its development, from energy euphoria to a pragmatic energy policy based on increasing energy efficiency in the use of energy and saving it worldwide. Besides the energy crises of 1973 and 1979, the reasons for these changes include the noticeable depletion of fossil fuels reserves and the rise in the cost of their mining, and, lastly, not least, concerns about the deterioration of the ecological situation both on land and in the Earth’s atmosphere, and climate change, so starting from the 80s of the last century, the growth factor of per capita consumption began to decline, gradually being replaced by a factor of increasing energy use coefficient.
Thus, the logic of the development of energy consumption in the 21st century requires minimizing the gap of innovations and, first of all, due to a significant decrease in per capita energy consumption in developed countries and the necessary increase in energy consumption in developing countries. It is obvious that such vanguard countries with dynamically developing markets as India and China will significantly increase their per capita energy consumption in the 21st century. In general, developing countries are expected to increase per capita energy consumption to the world average of 1.8 toe, which will ensure the industrialization of the economy with the widespread use of energy-saving and energy-efficient technologies.
After the energy crisis of 1973–1979 developed countries dramatically increased the efficiency of energy use through the widespread use of energy-saving technologies. The actual decline and stabilization of per capita energy consumption in developed countries began in the 1980s, as can be seen in
Figure 1. According to the [
34] the medium variant assumes that the population of developed countries in the 21st century may decrease and stabilize at the level of 1.3 billion people, so the energy consumption decline is likely to continue throughout the 21st century. By the middle of the 21st century, per capita energy consumption in developed countries will presumably decrease by 40–45% and then stabilize, reaching the stationary levels indicated in
Table 1. It is supposed that the level of per capita energy consumption that is higher than 2.5 toe is very comfortable for the citizens of developed countries. As can be seen from
Table 1, the actual per capita energy consumption in the USA (6.8 toe) and EU countries (3.6 toe) is much higher than the comfort level. On average for OECD countries, the actual level is 4.9 toe. Since in the developed countries today a very wasteful energy consumption is observed, it is logical to demand from them a certain reduction in the level of energy consumption in the interests of all mankind. Before the 2015 Paris Conference the EU countries themselves made a commitment to reduce energy consumption by 2050 to the level of 2.5 toe (see
Table 1), which is higher than the world average of 1.8 toe. The latter could become standards for the future for developed countries. It also meets the commitments made by developed countries at the UN Copenhagen Conference on the Environment (2009).
Researching the indicated trends in per capita energy consumption in various groups of countries (HI—high-income countries, MI—middle-income countries, and LI—low-income countries), presented in
Figure 1, a number of authors at the turn of the century developed scenarios in which the average world energy consumption per capita (
) by already 2030 may stabilize at the level of 1.8–1.9 toe per person per year [
35]. This can be seen in
Figure 1. Studying the dynamics of per capita energy consumption depending on the world’s population, Plakitkin [
32] also introduced a scenario where in the 21st century, per capita energy consumption in the world may stabilize and occupy the energy “shelf” at the level of approximately 1.8–1.9 toe per person per year. This indicates that we are dealing with a process of stabilization of per capita energy consumption in the world.
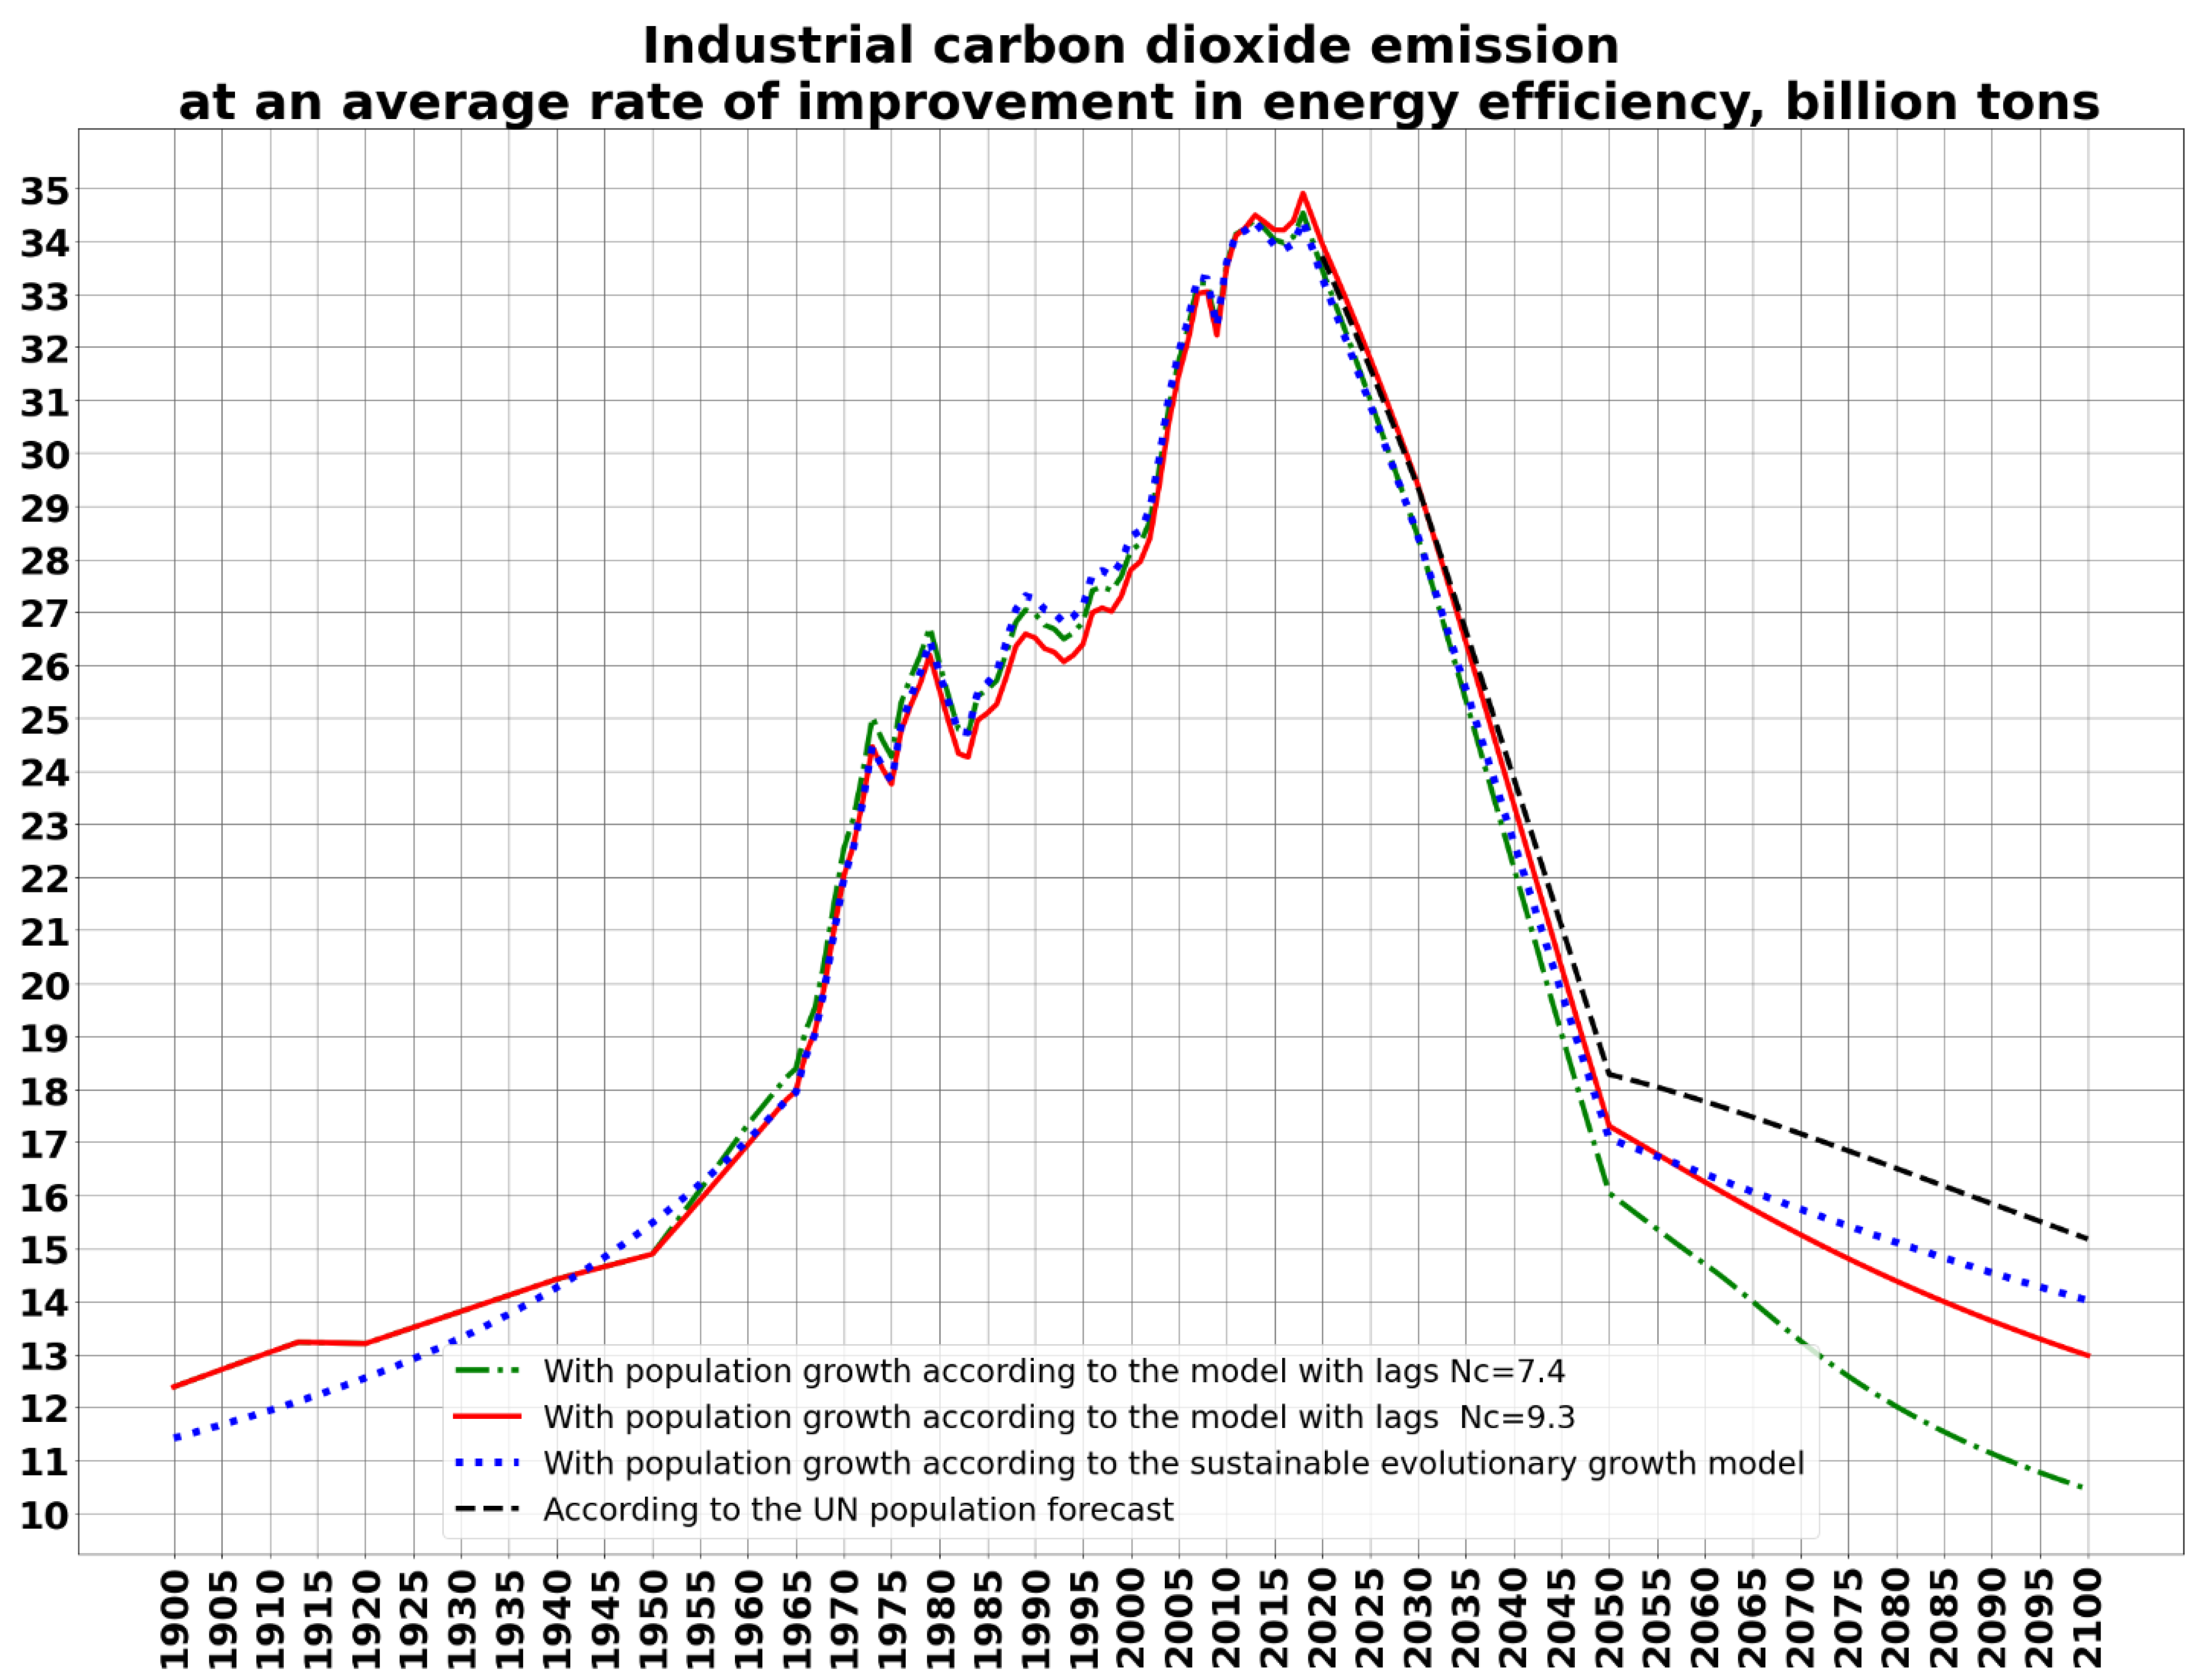
The transition to a regime of stabilization of per capita energy consumption in the world in the 21st century will be called the transition to a new paradigm of energy consumption. Assuming a fair trend towards stabilization of per capita energy consumption in all countries of the world without exception, we note that the level of stabilization and the timing of its achievement will be significantly different for each country. So, according to the new paradigm of energy consumption in the 21st century, global energy production may grow in direct proportion to the population of the Earth:
Thus, having a long-term scenario of the world population growth , using Equation (2), we can easily calculate the scenario of world energy consumption in the 21st century.
To realize per capita energy consumption, it is necessary that the efficiency of using the consumed energy, as stated above, has priority growth rates. It is assumed that the use rate of the consumed energy will increase along the logistic curve, as shown in
Figure 2 [
32]. The energy use rate reflects the level of technological development in the energy sector. All this is true for both developed and developing countries with some time shift, which gradually decreases. This may stabilize the per capita energy consumption at 1.8 toe per year. This, in the authors’ opinions, is quite enough for a comfortable living in modern conditions.
As proposed by Plakitkin (see
Figure 2), the energy use rate (energy efficiency rate)
also changes according to the logistic law. It can be seen in
Figure 2 that in 1900 it was 0.1, and in 2200 it is supposed to be 0.9. Therefore, it may reach a value of approximately 0.5 in 2050.
The parameter
c in Equation (3) determines the level of saturation (limitation) of the value of the coefficient
kee (t) for
t → ∞, as is directly observed in
Figure 2. The parameter
d determines the rate of growth of the energy use factor. It is not difficult to calculate the parameters
d and
c using the procedure for identifying parameters, given that
Tee0 = 1900,
kee0 = 0.1:
c= 9;
. Using Equation (3) the relative increase in the utility of energy consumption may be expressed through the normalized coefficient:
There is a large cluster of various energy efficiency technologies that provide a significant slowdown in the growth of global energy consumption. According to the work [
36], energy saving bulbs and LEDs are 75–90% more efficient than incandescent bulbs (90% refers to LEDs). Thus, if we replace traditional incandescent light bulbs with LEDs everywhere, we get a 9/10 reduction in the consumed energy for lighting purposes. Lighting only demonstrates one of the numerous existing energy technologies, but much more of them exist. The house heating systems could be a good example of energy-efficient technologies, so geothermal heat pumps can collect obtained from the sun heat that is located in water or earth. Programmable thermostats continue to save energy even at night or when people are away from their houses. Even ENERGY STAR-qualified windows that regulate heat loss and gain are now available [
37]. Active solar heating systems already supply the houses with hot water and floor heating [
38]. Modern gas furnaces and gas-fired boilers can provide more than 95% heating efficiency [
39]. If the technology contributes to RES development and transition toward renewable energy sources takes place, it will be possible to save between USD 65 trillion and USD 160 trillion worldwide over the period to 2050, according to [
40] (p. 8). Additional modern example of significant energy savings is the widespread use of smart digital technologies for energy consumption management. The data collected by “smart sensors” is a key factor in the energy system, which is optimized by smart digital devices by regulating supply and demand in real time [
41] (p. 38). “Smart grids” provide the effective functioning of electricity producers, consumers, storage equipment, and network infrastructure in real-time. So-called “smart devices-consumers of energy” allows not only receive electricity, but also give it to the network depending on the load of the system.
Thus, the advantages of “smart grids” are the following [
42]
- -
high reliability, including the ability to self-organizing and optimizing the entire electrical system as well as fast restore after power disturbances;
- -
high efficiency in electricity transmission;
- -
integration of different types of power generation systems;
- -
low operational costs and electricity consumption decrease;
- -
full automation;
- -
high degree of security.
- -
The disadvantages of “smart grids” are
- -
the high cost of installation;
- -
the necessity of using storage capacities;
- -
a continuous communication channel is needed;
- -
sufficient regulatory norms and documentations do not exist, and so on.
The energy industry is currently experiencing a wave of such disruptive technologies that are fundamentally changing the situation in the energy consumption market. They help to decouple the growth in energy consumption from the economic growth required to improve the well-being of the population.
In many of the most technologically advanced countries, the volume of primary energy consumption has already stabilized, and in some of them, for example, in the USA, Germany, Japan and Sweden, even began to decline. It is important that developed countries promote the widespread diffusion of disruptive technologies with high energy efficiency and low carbon emissions through the mechanisms of the Paris Agreement. Improvements in energy efficiency around the world will contribute to a significant slowdown in global primary energy consumption by the middle of the century.
3. What the Paris Climate Agreement Gave
Following the 21st UN Climate Change Conference according to the UN Framework Convention on Climate Change (UN FCCC), adopted in Rio de Janeiro back in 1992, a new climate agreement [
34] which immediately began to be called historical, was reached on 12 December 2015 in Paris. This was due to the unprecedented scale of global support: for the first time, a climate agreement was adopted almost unanimously, it was signed by 195 of the 198 countries participating in the conference. Less than a year later, on 4 November 2016, it legally came into force, since by that time it had already been ratified by 111 states (57% of the signatories to the agreement), which account for 77% of global carbon dioxide emissions, i.e., significantly more than required by the terms of the agreement (55%; 55%). By now, the Paris Agreement has already been ratified by over 190 countries around the world. The Paris Agreement replaces the Kyoto Protocol of 1997 to the UN FCCC, which, according to prominent experts, also played a significant role, changing the attitude of many countries of the world to the problem of reducing greenhouse gas emissions into the Earth’s atmosphere for the better [
43].
The main outcomes of the UN Paris Climate Change Conference can be summarized in five points:
- (1)
Adoption of a climate agreement that sets the ambitious goal of keeping the average global surface temperature of the atmosphere within 1.5–2 °C by the end of the 21st century in relation to its level of +14 °C in the pre-industrial era (up to 1850) and prescribing to all countries the development and adoption of national long-term strategies for the development of low-carbon energy and the reduction of greenhouse gas emissions into the atmosphere, as well as plans for adaptation to climate change for the next 15–20 years;
- (2)
Adoption by all countries participating in the conference of the scientifically based conclusion of the UN Intergovernmental Panel on Climate Change (IPCC) that global warming in the 20th–21st centuries is mainly caused by anthropogenic emissions of greenhouse gases and, first of all, carbon dioxide (CO2), due to the combustion of fossil hydrocarbon fuels—coal, oil and gas;
- (3)
Launching a downward trend in the consumption of coal for energy purposes, as the “dirtiest” fossil fuel;
- (4)
Making decisions by international and large national banks, financial organizations and investment companies on preferential and privileged crediting to low-carbon energy projects and, first of all, those based on renewable energy sources (RES) and at the same time on coal projects investments termination;
- (5)
Reaching an agreement that developed countries, starting in 2021, will provide $100 billion annually to the underdeveloped and most vulnerable to climate change countries to help them develop green economies and adapt to the effects of climate change.
It can be argued that the Paris Agreement has already made a turning point in the nature of the fight against climate warming, gave a powerful impetus to the process of decarbonization of energy. A global irreversible trend towards the predominant development of carbon-free energy based on renewable energy sources, and the freezing of coal projects was formed. The rapid growth of both investments in renewable energy sources around the world and the volume of energy generated from such sources [
44] has become a forcible evidence confirming this trend. Since 2015, more renewable energy capacities than fossil fuels have been commissioned annually. In 2017, the total capacity of renewable energy sources worldwide exceeded 1000 GW. In 2018, renewable energy accounted for about 64% of global investments in the electric power industry and about the same share of new commissioning of generating capacities. Over the entire 2018, the total capacity of renewable energy installations increased by 181 GW, or 15%, to 1360 GW. Moreover, half of this increase came from solar power plants. In 2019, already 26% of global electricity production came from renewable energy sources [
45].
It was already noted above that the Paris Agreement gave an impulse to reduce the consumption of coal for energy purposes. This was one of the most important achievements of the Paris Conference, as coal is the main source of carbon dioxide emissions among fossil fuels. In addition, coal is also the leader in emissions of other extremely harmful substances, such as oxides of sulfur and nitrogen, solid ash particles, as well as radioactive substances (thorium, uranium isotopes, etc.). However, the question now is whether the started decline in coal consumption will become an irreversible trend? Indeed, despite the fact that coal is the “dirtiest” source of energy, in the last decade the world has experienced a coal renaissance, primarily due to the energy hunger of developing countries, for which coal is the cheapest and most affordable fuel. After the global economic crisis of 2008–2009 and soaring oil prices, even wealthy European countries have pounced on coal. Thus, in 2011, coal consumption in Europe increased by 3.3% compared to 2010, and in 2012—by another 3% compared to the previous year [
1] (Table “Coal: Consumption”). In addition, in some countries of the European Union, the amount of electricity produced using coal increased by 50% in just a year at that time. In 2010, coal provided about 30% of the world’s primary energy, slightly less than oil (34%), and in the production of electricity, coal became the main energy source (40%) [
1] (Table “Electricity Generation from coal”). Suffice it to say that over the past ten years, almost half of the global increase in energy consumption has been covered by coal.
Nevertheless, we observe numerous facts indicating that after Paris, a tendency towards a decrease in coal consumption in the world energy sector begins to take shape. Indeed, only four countries in the world—Vietnam, India, Indonesia, and China—have plans for large-scale construction of coal-fired power plants now. However, China in 2015 already announced a strategy to reduce the share of coal in the energy sector, and from 2025—a significant reduction in its use in absolute terms [
46]. If over the past 30 years China’s coal-fired thermal power plants have provided up to 75–80% of electricity generation, today this indicator has already dropped to 65% [
47]. In 2016, Vietnam also announced a revision of coal plans, deciding to focus on gas energy and renewable energy sources. In October 2016, the Dutch parliament voted to decrease national CO
2 emissions by 55% by 2030, which would require the closure of all five of the country’s remaining coal-fired power plants. France plans to close all coal-fired power plants by 2022. Certainly, a decisive turning point came when countries such as Germany, Poland and the UK had decided to drastically reduce coal-based electricity generation. It is encouraging that Germany closed its last coal mine on 21 December 2018, and Deutsche Bank pulled out of investment in coal mining [
48]. This year, the Japanese government announced its intention to close 110 of its 140 coal-fired power plants by 2030 in order to reduce carbon dioxide emissions [
49]. Today, in Japan’s energy balance, coal accounts for 32% of electricity generation, and renewable energy sources—only 17% [
50]. Australia, China, Denmark, Finland, Ireland, Netherlands, New Zealand, South Korea, Turkey, United Kingdom, USA, and majority of European countries already reduced significantly coal shares in their electricity generation [
51]. Thus, we see that all over the world there is a reduction in the volume of thermal coal.
Renewable energy is becoming more and more competitive every year. The reduction in the cost of renewable energy sources is proceeding at a rapid pace: in only eight post-crisis years (2011–2019), the cost of solar power plants (SPP) has decreased by 35%, and wind power plants (WPP)—by 20%. Already today, the cost of renewable energy sources is comparable to indicators of traditional hydrocarbon energy sources, and in a few years, it will be much lower [
45]. An important advantage of renewable energy sources is their proximity to final energy consumers, which also reduces transport costs. The successes in the practical development of solar power plants are especially impressive. For a long time, the development of solar energy depended on subsidies and government support. However, the rapid decline in the cost of solar panels and the investment flows in this promising industry have fundamentally changed the situation. In many countries of the world, solar power plants have already become more profitable than coal-fired power plants, and in India they have become the cheapest sources of electricity. If 10 years ago, the share of solar energy accounted for less than 1% of the world’s power generation capacity, by the beginning of 2020 it was already 9%, and, in many respects, these capacities increased thanks to India, where the cost of building a solar power plant over the past ten years has decreased by almost 90% [
52]. The costs of building solar power plants have also dropped significantly in the USA, China and Australia, and today the cost of solar electricity in these countries is one of the lowest in the world [
53].
Thus, renewable energy is becoming one of the main resources of the global power generation structure. In recent years, it is renewable energy sources that provide the main increase in generating capacities, they account for approximately two-thirds of all commissioned capacities [
45]. Renewable energy technologies have proven their reliability and competitiveness in practice. They currently provide the cheapest power generation options in many countries around the world. It turned out that renewable energy generating stations can be successfully integrated into existing energy systems. The positive experience of Germany and Denmark in integrating distributed and variable unstable generation of electricity based on RES into existing electrical networks has shown that this problem is quite solvable even with a further increase in the share of RES in the fuel energy balance (FEB). For example, the share of wind power plants in the annual electricity generation in Denmark is already about 40%, nevertheless, the Danish energy system is one of the most stable and reliable in Europe [
54]. Currently, at least nine countries generate more than 20% of their electricity using renewable energy sources and the unstable nature of electricity generation [
45].
4. A Long-Term Outlook on the Development of Renewable Energy Sources Considering the Requirements of the Paris Agreement
The question immediately arises about the medium and long-term outlooks for the development of renewable energy sources. Will they be able to so rapidly displace enough capacities operating on fossil hydrocarbon fuel sources from the global energy system to reduce greenhouse gas emissions into the atmosphere to the required minimum and in the required period of time? It should be noted that all energy development strategies in the 21st century aimed at achieving the climate targets set in the Paris Agreement provide for the widest use of renewable energy sources, inevitably combined with a rapid increase in energy efficiency of end users. For example, the International Renewable Energy Agency (IRENA) has calculated that in order to achieve the goal of keeping the average global temperature rise below 2 °C, it is necessary—(1) to increase the total share of renewable energy sources in the total reserves of primary energy by 2050 from 15% in 2015 to about 65%; (2) reduce the total volume of primary energy consumption by 2050 to levels lower than the level of consumption in 2015 (13.37 billion tonnes of oil equivalent), by significantly increasing energy efficiency [
55]. This, as we will see later, is a very difficult task.
But the modeling carried out by the IPCC shows that to keep the global average temperature at 1.5 °C, it is necessary to achieve a purely zero value of emissions by about 2050 (in the period from 2045 to 2055), and to keep it at 2 °C—by about 2070 (from 2065 to 2080) [
16] (p. 12). Here, purely zero value of emissions refers to emissions that are completely absorbed by the oceans and terrestrial ecosystems. This is currently roughly 3.1 billion tonnes (Gt) of carbon per year, or 11.36 Gt of carbon dioxide. For comparison, CO
2 emissions in 2019 amounted to 33.3 Gt that is almost 3 times more. Moreover, CO
2 emissions remained stable at this level for three consecutive years (2017–2019), which gave the impression that we are passing the peak of emissions. Indeed, as our further calculations show, if the international community takes vigorous measures to decarbonize the energy sector in full compliance with the requirements of the Paris Agreement, then anthropogenic carbon dioxide emissions in 2018–2019 may well turn out to be the peak for the entire industrial era.
The current national plans of many countries for the development of renewable energy sources and national commitments to reduce CO
2 emissions do not correspond to the requirements of the Paris Agreement at all—this is the conclusion of IRENA [
52]. This conclusion is also confirmed by the calculations of the IPCC [
56]. The IPCC estimates that current national commitments will lead to global warming of about 3 °C by 2100, after which warming will continue. Therefore, the UN notes that now more than ever before, all states are required to move to unprecedented and urgent action to prepare radically renewed upward commitments on Nationally Determined Contributions (NDCs) due in 2020. Moreover, the main efforts should be made precisely in the 2020s, since according to the IPCC calculations, in order to keep global warming within less than 2 °C and 1.5 °C, as early as 2030, global greenhouse gas emissions must be reduced from the 2017 level by 25% and 55% respectively [
56]. In this regard, IRENA has developed a highly ambitious scenario for an accelerated transformation of the energy system called REMap Case, which requires a much faster deployment of renewable energy technologies, combined with energy efficiency improvements [
52] (p. 4). It is argued that this scenario will keep the global temperature rise at 1.5 °C.
For the practical implementation of this ambitious scenario, investments in the energy sector by 2050 in the amount of USD 110 trillion will be required, including USD 37 trillion in energy efficiency and USD 27 trillion in renewable energy sources. The key indicators for the ambitious scenario of accelerated transformation of the global energy system, along with similar indicators of the conservative scenario of transformation, driven by the current plans and commitments of the countries of the world, are presented in
Table 3 and
Table 4. As we can see from
Table 3 and
Table 4, the ambitious IRENA scenario requires an increase in the share of the electric power industry in final energy consumption by 2.5 times, to almost 50%, and the share of renewable energy sources in electricity production—by more than three times, to 86% by 2050. Such a radical increase in the share of renewable energy sources, in turn, will require a further radical reduction in the cost of construction of SPP and WPP.
Since RES, constantly and rapidly expanding, will replace and displace traditional fossil fuels, the share of the latter in the fuel and energy balance will decrease, and, consequently, CO
2 emissions into the atmosphere will also decrease. In the scenario [
41], made by Makarov and Mitrova with a horizon up to 2040, it is assumed that coal will reduce its share from the current 28% to 19–23% by 2040, and oil from 30% to 21–22%. Only gas will be able to increase its share to 26%, since natural gas is currently seen as an effective replacement for coal in power generation. However, Makarov and Mitrova adhere to conservative positions in scenario writing of the development of renewable energy sources and believe that they will provide only 35–50% of world electricity production and 19–25% of total energy consumption by 2040 (compare with the data in
Table 3 and
Table 4).
On the other hand, there are scenarios of the International Energy Agency (IEA) [
44], which are encouraging in the feasibility of the ambitious goals of IRENA (see
Table 4). The IEA believes that in the next 20 years, the capacity of wind power plants will grow at an average rate of 13% per year and by 2040 it will reach about 8,000 GW, while in 2017 the total capacity of all power plants in the world was 6765 GW. The key factors for the growth of wind energy will be their growing capacity, an increase in their operating life and a decrease in installation costs by 40% by 2040. Solar generation will grow at an average rate of 15% per year, and by 2040 its total capacity in the world will be about 12,000 GW. Thus, SPP and WPP will generate three times more electricity in the 2040s than all existing power plants in the world at present. Solar energy, due to its rapidly increasing competitiveness, will overtake wind energy in terms of installed capacity by 2025, hydropower—around 2030, and coal-fired thermal power—by 2040 [
44] (p. 4).
5. Transformation of the Infrastructure of Consumption and Production of Electricity in the World
Since an explosive growth in the generation of carbon-free and low-carbon electricity is planned in the next two to three decades, there is an urgent need for an accelerated large-scale electrification of the entire sphere of final energy consumption. This process turned out to be not easy and is proceeding slowly. Thus, from 1990 to the present, the level of electrification of primary energy consumption in the world has grown from 31% to 36%, i.e., by only 5 percentage points. But it is important that there is already a long-term trend [
41] (p. 25). Today the share of electricity in global final consumption is only 20%. Electricity demand in developing countries is expected to double by 2040 though, while demand growth in developed countries will be modest [
44] (p. 3).
The growth in demand for electricity will depend on how quickly it can increase its role as the preferred energy carrier in heating homes, offices and businesses, as well as for transportation. It is these areas that consume the bulk of energy: heating and cooling—about 35%, and transport—about 25%. Today renewable energy sources generate only 10% of the energy used for heating and cooling and 3.5% of the energy used for transport [
45] (pp. 12–13). Therefore, it is necessary to stimulate an accelerated program for the integration of renewable energy into these areas of the national economy. The IEA considers it possible and advisable to significantly increase these indicators by 2040: in the heat supply sector up to 25%, and in the transport sector—up to 19% [
44] (p. 7). The latter means that more than half of the world’s car fleet should be switched to electric motors by 2040 [
44] (p. 5). Electric vehicles should become the main vehicle.
Another problem that hinders the accelerated introduction of renewable energy is the variable unstable nature of electricity generation both at wind power plants and solar power plants, caused by changes in weather, day and night, and seasons. The latter cause large surges in the generated power. To stabilize the power intended for delivery to the consumer, energy storage devices are used, which make it possible to provide controlled power delivery from renewable energy sources, taking into account the needs of the power system and, in particular, to meet peak demand. The characteristics of the storage device should give renewable energy sources sufficient flexibility and adaptability, which is extremely important to ensure their stable operation. Pumped hydroelectric energy storage power plants are the most common industrial storage of electricity today. They provide 99% of the world’s energy accumulation and storage capacity [
41] (p. 30). In 2017, their total capacity was estimated at about 140 GW, which was only about 15% of the total global capacity of SPP and WPP.
Recently, alternative energy storage systems, for example, lithium-ion batteries, which are widely used in electric vehicles, are increasingly being leveraged. They are still expensive, but have already fallen in price by 85% over the past 10 years, but still account for about a third of the cost of an electric vehicle [
57]. The solid electrolyte battery has not yet become a commercial reality. When this happens, the mileage of the electric vehicle will double—from 500 to 1000 km [
58]. This will be the beginning of the era of electric vehicles. The expected technological breakthrough in the field of innovative energy storage technologies can significantly reduce the constraints on the path of accelerated development of renewable energy sources and their integration into the existing energy system.
The third problem standing on the path of large-scale use of renewable energy sources is the decentralization of electricity generation due to the use of SPP and WPP, while at present the centralized production of electricity by large power plants dominates the world. The deployment of a large number of relatively small solar power plants and wind power plants will require a qualitative leap in the development of technologies for creating and managing distributed energy. We will have to deal with such complex distributed energy systems and electrical distribution grids that they will only be managed by smart digital technologies. The purpose of the digitalization of the energy sector should be the creation of “smart grids” that ensure optimal synchronization of supply and demand based on an array of data of producers and consumers in real time [
41,
42,
59].
“Smart grids” also need to be able to flexibly manage the flow of electricity over long distances from one region to another, taking into account the current data on weather conditions. Supra-regional networks reduce the need for expensive storage capacity for renewable energy sources. “Smart grids” will become a key element of the energy system of the future, ensuring the successful integration and effective functioning of an increasing number of distributed renewable energy sources as part of existing national energy systems. One of the important requirements for “smart grids” is the reliability of the network and the provision of the possibility of quick self-recovery in case of failures, which is achieved by using artificial intelligence technologies.
Thus, an extensive network of a huge variety of renewable energy sources and a number of large base power plants with the help of a “smart grid” makes it possible to establish an affordable, reliable and stable energy supply for a large region of the world.
6. The World Is Facing a Difficult, but “Great Energy Transition”
So, in order to achieve the goals of the Paris Agreement, the global energy system could undergo a revolutionary transformation from a low-efficiency and high-carbon energy system, mainly based on fossil fuels (coal, oil and gas), into a highly efficient energy system mostly based on renewable energy sources. This process is called energy transition. According to Smil’s definition, the energy transition covers the time period from the introduction of new primary energy resources to their gaining of a significant share in the world energy market, sufficient for further dominance [
60] (p. 203). The value of the initial share of a new resource is usually taken as 3–5%. Smil sets the value of the “significant share” over 25% if there are four competing resources on the market, and over 33% when there are three of them. In order to become an absolute leader, it is necessary to have a share of more than 50%. Since the share of coal will steadily decrease, and natural gas and oil, according to all sustainable development scenarios, will continue to provide the bulk of global energy demand in the 2040s [
44] (p. 7), the share of RES in the fuel and energy complex by this time should exceed 35% in order to become dominant. This is exactly what the ambitious renewable energy scenario «REMap Case» from IRENA is aimed at [
52].
Thus, the global energy system has now entered the 4th stage of a fundamental transformation—the transition to large-scale use of renewable energy sources and the gradual displacement of fossil fuels. The share of renewable energy sources in the fuel and energy complex by 2020 has just reached the initial level of 5%, sufficient to start widespread distribution in all spheres of the national economy. The transition time to the dominance of a new resource in the previous transformations of the world energy system associated with the transition from firewood and waste to coal, from coal to oil and from oil to gas, was approximately 60 years [
61]. This time it is required to reduce this time by 2–3 times to 20–30 years (up to 2040–2050), which is due to the requirements of climate stabilization. But is it possible?
The diffusion of a new energy resource is an evolutionary process, as is the case with other innovations, and it is described by a non-linear S-shaped function, in this case representing the Verhulst’s logistic function. This was first shown by Marchetti and Nakicenovic in their work [
61], where they analyzed with great success the evolution of energy resources in the modern world, starting from the moment of the industrial revolution, using logistic equations. They calculated the scenario of changes in the share of oil and coal for 50 years ahead with an accuracy of 2–3%.
For example, when oil prices have reached historic highs of
$147 per barrel in July 2008, former US Vice President Al Gore said the following: “Today I call on our people to make a commitment to produce 100% of electricity from renewable sources within ten years. This goal is feasible and achievable” [
62].
It is very difficult to predict such nonlinear dynamic processes as the spread of innovations, so even professional scientists and highly qualified experts can often make mistakes. Such examples are always instructive. In particular, Smil only 12 years ago considered it a myth that renewable energy would ever become a sustainable energy base for the development of human civilization [
60] (p. 89). However, the progress in the field of renewable energy sources over the past decade has become a very impressive response to this erroneous scenario by Smil: electricity generation based on renewable energy sources increased by an order of magnitude, by 10 times, from 136 GW in 2008 to 1360 GW by the end of 2018 [
45] (p. 20). The huge growth potential of renewable energy sources has become more obvious, so today there are few doubts about the prospects of renewable energy sources as one of the main energy resources in the middle of the 21st century. This is the nature of the nonlinear process of the evolutionary spread of all innovations: at first, over a long period of time of the order of 30 years it is very slow; and then, upon reaching a certain critical moment, it grows sharply and explosively to a certain level and, finally, smoothly passes to the saturation stage, thereby fixing the completion of the energy transition time. The first period was the incubation period for the technological development of renewable energy sources. And now we are at the beginning of the second dynamic diffusion period.
The upcoming energy transition will be very difficult for a number of reasons. First of all, it is required to create a new infrastructure for renewable energy sources, which can be quite costly. The displacement of traditional fossil fuels from the energy sector will be associated with the need to restructure the already existing expensive infrastructure, which most states cannot afford. For example, the average age of coal-fired power plants in Asia is less than 15 years, while in developed countries it is about 40 years. So global coal consumption will decline slowly, at least until 2040, with the decline in China, Europe and North America offset by an increase in India and South East Asia [
44] (p. 5). Therefore, it is necessary to fight hard against the realization of new coal projects in the 2020s, so that the entire increase in energy capacities in the future is made at the expense of renewable energy sources and nuclear power plants. But here we face with a change in the energy transition driver.
If in the periods of previous transitions, the main driver was economic attractiveness, the high energy value of a new resource in comparison with existing competing resources, now it is a state energy policy—a decarbonization policy aimed at reducing greenhouse gas emissions in accordance with the requirements of the Paris Agreement. Therefore, for the accelerated development of RES, active political and regulatory decisions of the governments of all countries that have signed and ratified the Paris Agreement of 2015 are needed. Since government policy is influenced by various groups of lobbyists, among which a powerful circle of lobbyists in the oil and gas sector stands out, a number of the world’s vanguard countries cannot pursue a firm and consistent policy of decarbonization. Unfortunately, these countries include the United States, which is one of the leaders in terms of greenhouse gas emissions in the world. Considering all the above difficulties standing on the path of an accelerated transition to renewable energy sources, WEC calls the upcoming energy transition “The Great Energy Transition” [
63].


