1. Introduction
Fenestration could be defined as a physical connection of the indoor to the outdoor. It is referred to as a means to allow solar radiation into a space via natural lighting and also to allow heat gain to the space [
1]. Studies have been conducted in order to find an optimum window dimension to the façade dimension. Early studies investigated the effect of Window-to-Wall Ratio (WWR) on the total energy saving of buildings in Austin, Texas, and concluded that sky illuminance strongly affects the calculations, and the optimal WWR was in the range of 10–40%, depending on the zone’s size. It was also concluded that the total annual energy use, when employing the optimal WWR, could be halved compared to the windowless configuration, i.e., WWR = 0 [
2]. Johnson et al. [
3] investigated the impact of daylight on the energy use of the building. They concluded that effective use of daylight through an optimal WWR could help reducing the energy use of the building.
The effect of WWR on the energy use of a residential building was studied in different cities of Turkey [
4]. The south- and north-facing windows were considered for the study. The results showed that different WWR values are needed for different climates ranging from 25–90%.
Natural lighting can help in reducing the amount of energy used to artificially light a space. A study was conducted in order to find an ideal WWR to reduce the use of artificial lighting in two different climates (Leeds, in the UK, and Florianapólis, in Brazil) [
5]. Optimal WWR ranges of 10.8–44% and 20.6–86.2% were reported for Leeds and Florianapólis, respectively. It is to be noted that only lighting energy use was considered to drive the optimal WWR.
In order to study the effect of climate on WWR more precisely for an office building, four different regions (Miami, Florida; Las Vegas, Nevada; Sheffield, the United Kingdom; and Saint Petersburg, Russia) were chosen, and an optimal WWR range of 20–32% was reported [
6]. As seen from the results of the studies, optimal WWR was strongly dependent on building type, U-values, and climate.
Recent research projects have investigated different glazing sizes and their influence on buildings energy use in a more detailed context. Apart from WWR, different specifications, such as façade, construction material, insulation, window orientation, and glazing type, were considered. In office buildings, lighting, heating/cooling, and air conditioning are the most important factors in energy use [
7]. Integrating artificial lighting with natural lighting can contribute to energy use reduction as windows are considered as the source of natural lighting and heat gain [
7,
8]
.The need to balance thermal and visual comfort has been investigated by Ochoa et al. [
9]. A reference office was chosen as a basis for the simulation for the climate of Amsterdam, the Netherlands. In order for the building to meet illuminance required by the building codes, WWRs have to be considered larger compared to the energy optimal WWR. The following WWRs were reported as acceptable from energy and illuminance points of view for north 70%, south 60%, east, and west 60% [
9].
Kim et al. [
10] studied the effect of window position, size, and orientation on the energy use of a residential building in Vancouver, Canada. With an increase in WWR, energy use also increases; however, the window position appears to be important as the energy use is minimized when all windows are placed in the mid-height of the façade in all orientations. A study presented by Susorova et al. [
11] evaluated the importance of the geometric factors of a building in fenestration design. The effect of several factors such as WWR, orientation, and width to depth ratio of the room on energy use were analyzed. A room in a commercial building was chosen and modelled in DesignBuilder for six climate zones of the United States. A combination of different parameters yielding to the minimum energy use in the building were reported.
More research projects have been carried out to study different factors influencing WWR, such as climate condition and window and building geometry [
10,
12,
13].
The importance of shutters and their effect on indoor illuminance level and heat gain has been investigated by Alawadhi [
14]. In this research, only the effect of shutters in the hot climate region of Kuwait for a residential building was considered. According to the results presented, the best option is to completely close the shutters and rely on artificial lighting. This shows the importance of implementing shading systems in certain climates.
The importance of thermal transmittance of the wall and its effect on the glazing size in a timber building in Ljubljana, Slovenia was studied by Leskovar et al. [
15]. Different thermal values for windows were also studied in order to find the optimal area of window on south-facing façades. It was concluded that optimal WWR is dependent on the thermal transmittance (U-value) of walls.
Ma et al. [
16] studied the optimal WWR as a function of outdoor temperature and envelope U-value while keeping the indoor temperature range within 2 °C. The study was carried out in seven U.S cities, and for each city a range of optimal WWR was reported.
Thalfeldt et al. [
17] performed a life cycle analysis and studied different factors such as window properties, WWR, external shades, and wall insulation for low and Near Zero Energy Building (NZEB) in Estonia. Different WWRs were reported, depending on the window’s U-values. For double and triple pane windows, optimal WWR was in the range of 22–24%, and by increasing the number of panes, this range increased to up to 60% (for quintuple glazing).
More studies on the effect of a window’s thermal value have been carried out. Research conducted by Bastien et al. [
18] in a building in Montreal, Canada, devised a methodology to find an optimal fenestration system (windows with shades) in a climate dominated by heating demand. The method generates a diagram indicating the net energy balance of different fenestration systems for a specific climate and orientation. Different glazing systems were considered, and each glazing system was employed with different shading systems to depict the accuracy of the result. This methodology helps in choosing the right fenestration system in the early design stage. Jaber et al. [
19] also studied the effect of the U-value of glazing systems in different climates and reported a well optimized glazing system.
Studies have been conducted to investigate the effect of a combination of more parameters to find the optimal fenestration system. Bülow-Hübe [
20] studied the effect of glazing size, daylight utilization, orientation, and ventilation in an office building in Lund, Sweden, in order to find the best combination of the named parameters to reduce the cooling and heating demand. A more recent research was carried out in Sweden on well insulated buildings in Gothenburg as a part of a terraced houses project [
21]. The main aim of the research was to study the effect of window sizes facing north and south on the energy use of well insulated buildings. Different orientations and window types were also considered in the study. According to the results presented in the study, larger north-facing windows are possible; however, to minimize the annual energy use, an optimum WWR was reported.
A study conducted by Goia [
22] considered the effect of artificial lighting integrated with natural lighting in different climates to find the optimal WWR. Later, the robustness of the results was tested. Different climate conditions were chosen, and a range of optimum WWR was reported for each city. However, a range of 30–45% was found optimal in most cases. Potentials of energy reduction by employing the optimal WWR were also considered in the results.
The amount of solar irradiation can be divided into visible light and heat [
23].
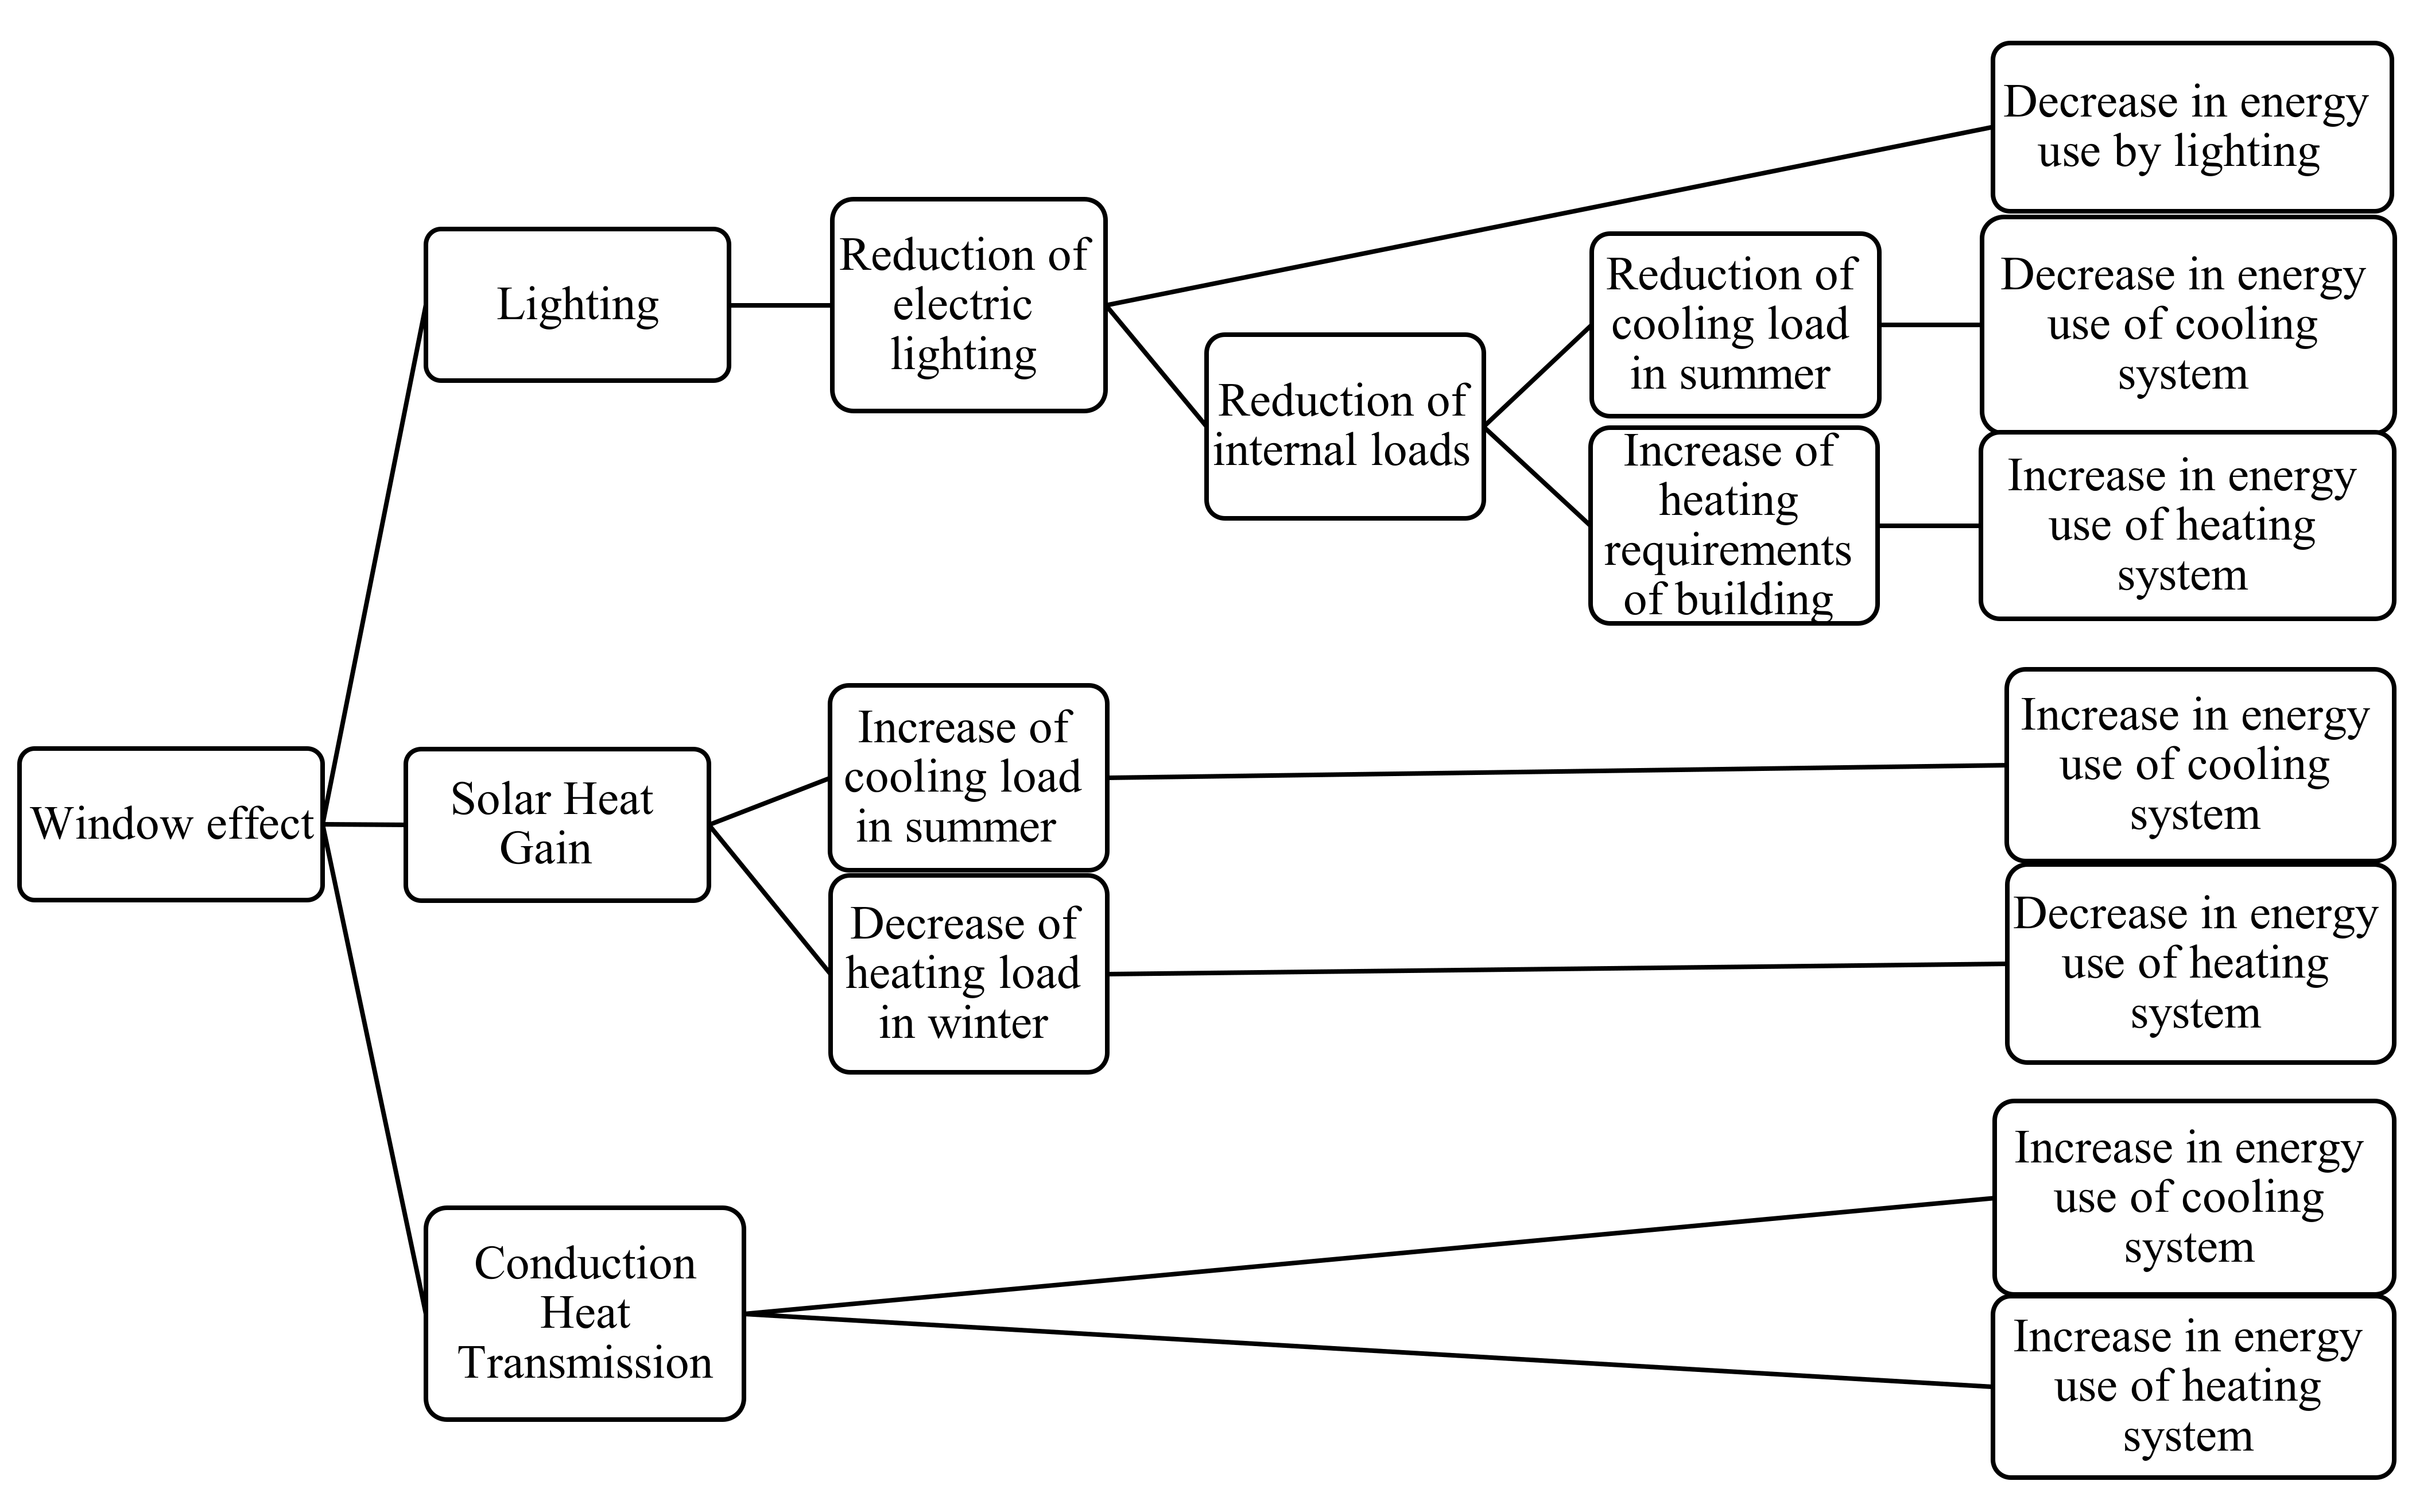
Figure 1 emphasizes the importance of all factors affecting the energy use of a building that are affected by windows. As shown in
Figure 1, the visible light emitted from the sun is being used as day lighting to reduce the electricity needed for the lighting system, which, consequently, also decreases the amount of cooling demand because of a lower internal load. However, a lower internal load causes higher energy use of heating systems in the winter. Solar radiation heats the building all the time. This heating role of the sun is useful during the wintertime and decreases the heating load, though it is not useful during the summer because it increases the cooling load and consequently increases the energy use of the cooling system. Heat loss in winter and heat gain in summer due to conduction heat transmission through windows increases the amount of energy used by the heating and cooling systems to compensate for the respective lost and gained heat. Therefore, the window affects the energy use of lighting, heating, and cooling systems of the building. Now, this question arises: Is there an optimal window size that is more beneficial for the energy use of the building. As seen in other studies, different climates adopt a certain range of optimal WWR. Based on
Figure 1, including a window on a façade can have positive and negative roles in the energy use of a building during the year. In order to decide the optimal area of windows, total energy use (summation of lighting, heating, and cooling) is taken into consideration.
This paper aims to study the influence of several factors such as window size; orientation; and specifications such as thermal conductivity, solar heat gain (SHGC), etc., on the annual total energy use of buildings. Integration of natural and artificial lightning is also taken in consideration. Different shading systems were implemented to study their effect on different WWRs and total annual energy use. Thermal comfort is later investigated in order to evaluate the effect of WWR on the occupant’s comfort level. The research is carried out in seven different climate conditions belonging to Iran and Sweden to assess the effect of completely different climates. The effect of window design on annual energy use and its coordination with minimum daylight requirements has also been considered.
3. Results
The result of the simulations are shown in
Section 3.1,
Section 3.2,
Section 3.3,
Section 3.4,
Section 3.5,
Section 3.6 and
Section 3.7. Figures depict the total amount of energy used as a function of WWR for all the windows employed for each of the cases for south, west, and east façades. Stacked columns are used in order to present the results. The x-axis represents the WWR in percentage terms and the y-axis represents energy use during a year in kWh/m
2 for the three case studies.
3.1. Steppe, Cold Arid Climate (Bsk)
Annual lighting, heating, and cooling are depicted in
Figure 7 for the three studied orientations. In this climate, by looking at the breakdown of energy aspects for south-facing windows, heating energy decreases with the increase in WWR, which shows the possibility to use solar passive heating. However, cooling energy increases as a function of WWR. Lighting energy has the negligible amount of energy use due to the high energy efficient lighting units. Hence, optimization based on only one aspect of energy use is not possible.
For the southern exposure, when 2/air and 3/air were used, with the increase in WWR, the amount of total annual energy (sum of lighting, cooling, and heating energy) also increases in all three cases (base case, window with shade, and window with blind). Nevertheless, by employing the 2/Arg window, unlike the other two studied window types, slight variations are observed in the total annual energy use as a function of WWR.
As can be seen from
Figure 7, the 2/Arg window appears to be the most effective option among the three different window types used. For this window, the amount of cooling energy required during a year shows a greater reduction compared to the other two windows. This is mainly due to the glass specifications and the gas type. As mentioned previously, the Arctic blue and the Optitherm glass prevent the space from overheating due to the lower SHGC (0.33) compared to the other two windows (SHGC = 0.789 and 0.69 for 2/air and three-pane window, respectively). Apart from that, Argon has a lower thermal conductivity (0.016 W/ (m·k) at 25 °C) compared to the thermal conductivity of air (0.026 W/ (m·k) at 25 °C).
Employing the 3/air window also shows the same trend as that of the 2/air window. For the southern exposure, a combination of the 2/Arg window with shades and blinds is the most favorable combinations. However, the addition of shade appears to be the best combination, as the total annual energy is the least among all the cases and the employed windows. The trend of annual total energy use does not show fluctuation, especially when larger WWRs were used. Because the trend of the result does not show any significant changes, a range of 20–70% (with 5% variation in total annual energy use) could be considered when the 2/Arg window is used with shade. The addition of shades reduces the heat gained from solar radiation, therefore reducing the cooling requirement, especially for the larger WWR. However, when using the 2/air, a WWR range of 20–40% appears optimal when shades are employed. For the 3/air window, the optimal WWR range of 20–50% for the second case is the best option. Nevertheless, from the minimum daylight point of view [
24], the minimum WWR required for this space is between 22–27%. Therefore, a WWR of 20% is rejected from this range.
Figure 8 depicts the solar heat gained for the southern exposure for the three studied cases when the 2/Arg window is used. As can be seen from the figure, the amount of heat gained from direct and diffuse solar radiation for the base case and the second case reduces during summer, when cooling energy is the main requirement. Hence, it helps in reducing the energy needed to cool the space. However, for the third case (window with blind), the amount of solar heat gain slightly increases during the summer period, compared to the gain throughout the year. On the other hand, solar heat gain is somewhat lower during winter period for the third case, which consequently increases the heating requirements.
Based on
Figure 7, in the case of the eastern exposure, with increases in WWR, total annual energy use increases for all the studied windows in all cases. Nevertheless, the combination of the 2/Arg window with shades and blinds appears to be the best option as the total annual energy use is the lowest compared to the other two studied windows. The trend of the result remains relatively similar for the range of 20–70%; however, a range of 30–70% could be considered as the optimum WWR due to the minimum daylight requirements mentioned above. For the 3/air, a range of 30–50% for the second and third case is optimal. In the case of the western exposure, shades were not implemented, as per the Iranian National Building Regulations [
43]. Accordingly, the western exposure consists of two graphs because the combination of window with shade is not considered. Therefore, a combination of the 2/Arg window with blinds is the most effective approach. The trend of the result shows the same behavior as that of the eastern exposure. By using the BESTEST window, WWR 30% is the best option, while using 3/air larger WWRs (30–50%) could be used.
3.2. Hot, Arid, Desert Climate (Bwh)
As it can be seen in
Figure 9, for all the cases, cooling energy use is the main aspect, and optimization can be made based on that factor, because the amount of heating and lighting energy use is negligible.
For the south facing window, the cooling energy, which is the dominant energy use aspect, increases as the function of WWR in all cases, for all the studied windows. However, the trend of the result is steeper when 2/air and 3/air windows were used for all three studied cases. A combination of the 2/Arg window with shade or blinds shows the least amount of cooling energy used. Additionally, these combinations do not show significant fluctuations in the amount of energy used for cooling for the studied WWRs. A range of 20–60% could be considered optimal as the cooling energy use (and also the total annual energy use) is the lowest. The difference between a WWR of 20% and a WWR of 60% in the total annual energy use is 5%; however, this difference increases to more than 7% when comparing a WWR of 20% with a WWR of 70%. Therefore, a WWR of 70% was excluded from the optimal range. Nevertheless, minimum WWR should be between 22–27% based on the minimum daylight point of view. Therefore, the second and third case for 2/Arg, with a WWR range of 30–60% are considered optimal. Because the cooling energy use is the main aspect, approaches to reduce the solar heat gain are advantageous. For the 2/air window, the smallest ratio, 30%, could be considered.
For the eastern exposure, the cooling energy, which is the dominant aspect of the energy, increases as a function of WWR in all the cases for all the employed windows. However, the trend of the result for the 2/Arg window is not as steep as the other two studied windows. A combination of the 2/Arg and the 3/air window with blinds shows a promising result. As in the previous section, an extended WWR range could be used for the mentioned window types; however, for the 2/air window, the smallest ratio is the best option. A WWR or 20% uses the least amount of energy; however, it is rejected due to minimum daylight requirements. Therefore a WWR range 30–70% in the case of the 2/Arg window and a range of 30–50% for the 3/air with blinds for the eastern exposure could be considered.
For the western exposure, as in the previous section (
Section 3.1), shades (overhangs) were not used based on the national regulations; this makes the 2/Arg window with blinds a considerable option. A WWR of 20% has the least amount of cooling energy use; however, it does not meet the minimum daylight requirements. The same WWR optimal range as the eastern exposure could also be considered for the western exposure.
3.3. Steppe, Hot, Arid Climate (Bsh)
Based on the results depicted in
Figure 10, cooling has the higher share of the total energy use in a year for all cases and orientations. However, the amount of heating required is a considerable amount; therefore, optimization cannot be based on only cooling or heating energy use, as in the previous climate condition (
Section 3.2). Lighting energy has a negligible amount of energy use, which is mainly due to the high efficiency of the present lighting units. It can be seen from the figure that, with the increase in WWR, the amount of cooling energy increases and the heating energy reduces.
For the south facing window, an optimal range of 30–70% is depicted for the combination of the 2/Arg window with shade, because the total annual energy is the lowest for this case. It could be concluded that, by using a high quality window, larger WWRs could be selected, as in the previous sections. As mentioned previously, the 2/Arg window consists of an outer glass that prevents the space from heating, and the gap is filled with Argon, which further helps in insulating the space. The optimal range for the 3/air window corresponds to 30–50%, and for the 2/air window, 30–40%, for the second case. It could be concluded that, by using windows with higher U-values for the same building, smaller WWR ranges could be considered optimal.
For the eastern and western orientations, the trend of the result for the 2/Arg window is not as steep as the other two studied windows, as in the previous climates. A combination of the 2/Arg window with blind is the best option, with a WWR range of 20–70%. The optimal WWR range for the 2/air and 3/air windows corresponds to 20–30% and 20–40%, respectively when combined with blinds. As mentioned previously, total annual energy use variation within the reported optimal range is within 5%. It is to be noted that, even though a WWR of 20% uses the least amount of energy, it is rejected due to illumination requirements.
3.4. Warm, Fully Humid Climate with Hot Summer (Cfa)
By analyzing the individual aspects of energy use in
Figure 11, both heating and cooling energy use are equally effective in determining the optimal WWR. However, analyzing each parameter individually does not lead to an optimal WWR. Heating energy use slightly decreases as a function of WWR. However, cooling energy use, on the other hand, increases. Hence, optimization has to be made based on the total effect of the energy aspects. By examining the total energy use, the following conclusions can be acquired.
A combination of the 2/Arg window with shade and blinds appears to be advantageous; nevertheless, shade is the most favorable. A WWR range of 30–70% appears optimal. The smallest WWR range (20–30%) would be the best option for the 2/air window type, and for 3/air window, a range of 20–50% is the optimal range for the second and third case.
For the east and west facing windows, the third case (window with blinds), when employing 2/Arg, could be considered as the most favorable condition, with an optimal range of 20–70%. The total energy use is the lowest for this case and combination. For the 3/air window, the optimal range of 20–40% is regarded when combined with blinds. The smallest possible WWR (20–30%) could be chosen for the 2/air window, when blinds are added, as the optimal WWR. However, due to minimum daylight requirements, WWR 20% is rejected.
3.5. Snow, Fully Humid Climate with Cold Summer (Dfc)
As it can be seen from
Figure 12, heating is the main energy use parameter in this climate; cooling and lighting have a negligible amount of energy use. By looking at the acquired result for the southern exposure, the addition of shades or blinds does not have a positive effect on the total annual energy use. For the base case, for which there is neither an overhang nor an automatic blind system, with the increase in WWR, the amount of energy used for heating reduces. This is mainly due to the dominancy of the solar heat gain over the transmission heat loss. This shows the positive energy saving role of sun for the southern façade. The whole range of 20–70% WWR could be considered (with 5% variation in total annual energy use within this range) when employing 2/Arg and 3/air window types. Nevertheless, the larger WWR of 40–70% appears to perform better for both window types, as the total annual energy use reduces in this range. The three-pane window (3/air) consists of glass with a high solar transmittance and SHGC (0.6 and 0.69, respectively). Therefore, bigger windows increase solar heat gain, consequently reducing the heating energy required during the heating season, as this climate is dominated by heating demand throughout the year. However, increasing WWR for this window (3/air window) increases the cooling energy required, which in turn increases the annual total energy. On the other hand, cooling energy does not increase by employing a 2/Arg window; however, the heating requirement is slightly higher than the 3/air window due to its lower solar transmittance and SHGC (0.26 and 0.33, respectively). The addition of shades or blinds reduces the positive impact of the sun during winter, which has the dominant energy use during the year. Blinds adversely affect the energy use because they are scheduled to cover the windows when the amount of solar radiation exceeds 100 W/m
2, regardless of the season. Therefore, they interfere with the positive effect of solar insolation during the heating season. It is noteworthy to mention that, because the studied climate categories (belonging to two climate conditions of warm and cold) are situated in different latitudes, defining a consistent winter period is a complication. Therefore, the blinds are implemented throughout the entire year.
In the case of the eastern and western exposures, a WWR range of 20–70% could be considered because the total annual energy variation is a maximum of 5% within this range for the base case when using 2/Arg and 3/air windows. However, the larger WWR is more favorable in this climate condition for the 2/Arg window type because, in this climate condition, the solar gain is dominant compared to the transmission loss of the windows. However, due to minimum daylight requirements, a WWR of 20% is rejected. A range of 30–50% is the best choice when using the 2/air window for the base case. A smaller WWR range has to be chosen for this window due to its high U-value (3 W/m2·K), which increases the heat transmission loss from the window. As with the southern exposure, the addition of shade (second case) and blinds (third case) has an adverse effect on the total annual energy, and this is therefore not considered as an effective approach.
3.6. Snow, Fully Humid Climate with Warm Summer (Dfb)
Based on the result shown in
Figure 13, as in the previous section, heating is the main aspect of total energy use. For the southern exposure, the first case, where no shade or blind is employed, appears to be the most agreeable situation. The WWR range of 20–70% is considered for the 2/Arg and 3/air windows, as the fluctuation in heating as well as total energy use is negligible (5%). As in the previous section, in this climate condition, the larger WWR is more favorable when using the 2/Arg window for the base case. A more appropriate WWR range of 50–70% for the 2/Arg window could be considered. Because the heat gain is dominant compared to the heat transmission from the window, the larger windows appear to be the better option. This is mainly due to the low U-value (1.1 W/m
2·K) of the window, which reduces the heat transmission loss. A range of 30–70% and 30–50% also could be considered for 3/air and 2/air windows.
For the eastern and western façades, when using the 2/Arg window, a WWR of 20–70% does not show significant fluctuation, and this range shows the least amount of total annual energy use for the base case. For 3/air and 2/air windows, for the base case, a WWR of 30–50% and 30–40% are the optimal ranges, respectively. The addition of shade and blinds has an adverse effect on all orientations, as explained in the previous section.
3.7. Temperate, Fully Humid Climate with Warm Summer (Cfb)
The analysis of
Figure 14 shows the following conclusions. For the southern exposure for the base case (without shade or blinds), the whole WWR range of 30–70% (considering the minimum daylight requirements) could be considered for 2/Arg and 3/air window types. For the 2/air window, a WWR range of 30–50% for the base case is the optimal range.
For the eastern and western exposures, the base case is the best option, and the whole range of WWR (30–70%) could be considered for the 2/Arg window. For the 3/air and 2/air windows, a WWR of 30–50% and 30–40%, respectively, are the optimal ranges for the base case. It should be noted that minimum daylight requirement is considered in the reported WWRs.
3.8. Investigation of Thermal Comfort for South Facing Windows
The thermal comfort of the two window types, 2/Arg and 3/air, have been investigated. The mentioned window types were chosen due to their better performance compared to the 2/air window. For each climate condition, the optimal WWR range, from the energy and minimum daylight requirements (ranges discovered in
Section 3.1,
Section 3.2,
Section 3.3,
Section 3.4,
Section 3.5,
Section 3.6 and
Section 3.7), was considered for the analyses of thermal comfort for each climate condition. The thermal comfort result of the specified WWR ranges were investigated for the occupied period throughout a year;
Figure 4 shows the occupancy rate. The WWR with the best and worst thermal comfort indices, within the considered range, were reported. The WWR with the least number of unacceptable hours and PPD is considered as the best condition within the considered WWR range. Conversely, the WWR with the highest number of unacceptable hours and PPD is considered as the worst condition within the considered WWR range.
Table 4 shows the result for the worst and best WWR based on its thermal comfort performance for Iran (warm climate) within the selected energy optimal range.
Table 5 shows the same results for Sweden (cold climate). A WWR of 20% was excluded from the analyses due to minimum daylight requirements. The percentage of the unacceptable and the best occupant hours are depicted. The rest of the occupied hours are within an acceptable range. Unacceptable, acceptable, and best hours were defined based on ISO 15251 [
45], and they are available in
Section 2.4.4 of this study. The results of the comfort analysis were gathered with the help of IDA-ICE software. The software has the ability to calculate the mentioned thermal comfort indices.
The optimal WWR range for the warm climate appears when employing fixed shade (Case 2) for the southern exposure, and the optimal WWR range for the cold climate appears within the base case, where no shade or blinds were employed (for the south facing windows).
As can be seen from
Table 4, when employing the 2/Arg window in warm climates, a larger WWR could be chosen, not only based on the energy performance of the window, but also based on the comfort conditions of it. Based on the analyses shown in
Table 5, when using 2/Arg and 3/air windows in cold climates, the larger WWR provides better comfort conditions for the occupants.
4. Discussion
Based on the result presented, finding a WWR that minimizes the amount of total energy use is possible. Total energy use was defined as the sum of heating, cooling, and lighting. However, it is notable that, in certain climates, only one aspect of energy (heating or cooling) was the dominant energy use. By studying different cases in each orientation, a dedicated optimal value or range was depicted. The optimal values for each of the studied conditions for warm climates are shown in
Table 6, and those for cold climate are shown in
Table 7. It can be seen from the data presented in the tables that the size of the fenestration is limited in some cases and, in other cases, a broader WWR range is reported. On the other hand, in some cases it is possible to choose a larger fenestration but have an optimized energy use. Within these optimal ranges or values, the amount of energy use is the lowest compared to the other cases of the same climate and orientation.
In some climate categories of the warm climate, WWR is limited and cannot be enlarged, as shown in
Table 6 for 3/air and 2/air windows. For the southern exposure, the addition of shade is more advantageous because the energy use shows more reduction compared to the combination of window with blind, as depicted in
Figure 8. However, in the case of the Bwh climate category, the total energy use variation when implementing blinds does not exceed 5% compared to the second case. This climate has an average maximum summer temperature of 39 °C and a winter temperature of 13 °C; therefore, preventing the solar irradiation from entering the space is of importance, which consequently reduces the heat gain from solar. However, in other cases, western and eastern orientations depict the priority of blinds over shades. Unlike the southern orientation, where shades decreased solar gain during summer to a larger extent (as shown in
Figure 8), for western and eastern exposures, shades reduce solar gain during summer and winter to the same extent. In a colder climate, as in that of Sweden, the addition of blinds or shade is not an appropriate option as it prevents the solar irradiations into the occupied space; therefore, the interior does not benefit from the solar passive heating during the heating season. In such climate conditions, the best option is the base case, where no overhangs or blinds are used, especially during the heating season, which is the dominant period throughout the year. It is noteworthy to mention that the automated blinds were scheduled to work throughout the entire year in order to maintain the consistency of the results. As each climate category belongs to a different latitude, defining a fixed winter/summer period was a complication. Liu et al. [
29] employed shading systems as an energy saving measure in mid-Sweden, which was confined to only the summer period. Further investigations of the effect of shades/blinds, as in that of in the latter mentioned study, as energy saving measures, will be considered for a future research project. In these climates, larger WWR could be considered when using windows with lower U-values as that of the 2/Arg window (U-value = 1.1 W/(m
2·k)) as can be seen from
Table 7. The obtained result is similar to that of the study carried out by Thalfeldt et al. [
17] in Estonia. Nevertheless, the gap between the panes for three-pane windows in their study was also Argon and the glazing was mostly Low E with small U-values. Therefore, for three-pane windows, a larger WWR was depicted in their study. From the presented result in
Table 6 and
Table 7, it can be concluded that a larger WWR could be chosen when using windows with lower solar gains and heat transmission loss in the studied climate types. Additionally, from the thermal comfort investigation, the same conclusion can be drawn. From the depicted result in
Table 4 and
Table 5, when using the 2/Arg window, a larger WWR leads to better comfort conditions in both the warm and cold climates studied in this research project.
It is noteworthy to mention that, even though IDA-ICE has been validated by numerous researches and the simulated results were proven to be in agreement with measured data, no measurement analysis has been carried out specifically for the presented cases in this study. There always is an uncertainty range in the program, the measurement of solar heat gain, and transmission loss. Moreover, the ideal heating and cooling systems are used in this study in order to generalize the results, which is useful in the design stage and, depending on the choice of the heating and cooling systems, there might be slight changes in the results. Therefore, it is advised to handle results with caution and as general indicators to choose the appropriate WWR.
5. Conclusions
Simulations were carried out in seven different climate zones for three different cases (Case 1: window with automatic lighting control, Case 2: window with overhangs and automatic lighting control, Case 3: window with automatic blind and automatic lighting control) for three different window types (3/air, 2/air, and 2/Arg). An attempt was made to optimize window to wall ratio (WWR) based on the total energy use, lighting, and thermal comfort, considering a threshold of minimum daylight requirement as the constraint. Optimal WWR has the least total annual energy use and the optimal WWR range has 5% variation in total annual energy use compared to the optimal WWR. Climate conditions were chosen based on Köppen–Geiger climate classifications. Investigations were carried out for southern, western, and eastern orientations. Three different windows with different solar properties and features (2/air: clear 3 mm glass for both panes; 2/Arg: outer glass with high visibility and daylight transmittance property, inner glass with daylight transmittance of 48%; and 3/air: 4 mm clear glass for all three panes) were chosen to investigate the effect of window U-value on WWR performance. It was concluded that a combination of shade or blinds appeared effective in warm climates. On average, in the warm climates of the studied climate conditions, a WWR range of 30–50% for the 3/air window, 30% for the 2/air window, and 30–70% for the 2/Arg window were found optimal for the second and third cases. For colder climates, the first case, where no blind or shade was implemented throughout a complete year, appeared optimal. Separate investigations of energy use during summer and winter when employing shade/blinds was not carried out. This is due to the diversity of the chosen climate conditions, as each belongs to a different latitude. Defining a consistent winter/summer period in order to have a fair comparison was a complication. For the colder climates, the southern orientation showed the possibility of having a larger optimal range with the following ranges, on average: 30–70% for the 3/air window and 30–50% for the 2/air window. In the case of the 2/Arg window, based on each climate condition, an optimal range was reported. For instance, in the case of the Cfb climate condition (temperate, fully humid condition), a WWR range of 50–70% for the southern exposure appears optimal.
Table 6 and
Table 7 present the optimal ranges. It could be inferred from the gathered results from the simulations that the choice of WWR is less sensitive for windows with lower U-values.
In colder climates, the solar heat gain can dominate the transmission losses through windows, which decreases the heating demand in winter periods. On the other hand, the cooling demand in summer increases; nevertheless, the increase in cooling demand does not have a considerable effect on the total energy use. Therefore, a larger WWR could be chosen for the colder climates. Based on the thermal comfort indices, for the south facing exposure, optimal WWRs for the 2/Arg window for warm and cold climates are 60% and 70%, respectively. The optimal WWR for the 3/air window for warm climates is 40% or 50%, based on the climate condition, and for cold climates it is 70%.


