Article

Power Management Strategy of a Parallel Hybrid Three-Wheeler for Fuel and Emission Reduction

1
Faculty of Engineering, Sri Lanka Institute of Information Technology, Malabe 10115, Sri Lanka
2
Faculty of Graduate Studies and Research, Sri Lanka Institute of Information Technology, Malabe 10115, Sri Lanka
3
Wolfson School of Mechanical, Electrical and Manufacturing Engineering, Loughborough University, Loughborough LE11 3TU, UK
*
Author to whom correspondence should be addressed.
Energies 2021, 14(7), 1833; https://doi.org/10.3390/en14071833
Submission received: 21 November 2020 / Revised: 15 March 2021 / Accepted: 16 March 2021 / Published: 25 March 2021
(This article belongs to the Special Issue Electric Vehicle Efficient Power and Propulsion Systems)

Abstract

:
Millions of three-wheelers in large cities of Asia and Africa contribute to the already increasing urban air pollutants. An emerging method to reduce adverse effects of the growing three-wheeler fleet is hybrid-electric technology. The overall efficiency of a hybrid electric vehicle heavily depends on the power management strategy used in controlling the main powertrain components of the vehicle. Recent studies highlight the need for a comprehensive report on developing an easy-to-implement and efficient control strategy for hybrid electric three-wheelers. Thus, in the present study, a design methodology for a rule-based supervisory controller of a pre-transmission parallel hybrid three-wheeler based on an optimal control strategy (i.e., dynamic programming) is proposed. The optimal control problem for minimizing fuel, emissions (i.e., HC, CO and NOx) and gear shift frequency are solved using dynamic programming (DP). Numerical issues of DP are analyzed and trade-offs between optimizing objectives are presented. Since DP strategy cannot be implemented as a real-time controller, useful strategies are extracted to develop the proposed rule-based strategy. The developed rule-based strategy show performance within 10% of the DP results on WLTC and UDC-NEDC drive cycles and has the clear advantage of being near-optimal, easy-to-implement and computationally less demanding.

1. Introduction

The ever-increasing cost of fuel, air pollution and consumer market trends have forced the automobile industry towards investing in greener vehicles. Currently, over 90% of the transport sector is reliant on oil and 49% of the total oil production is consumed by the transportation sector alone. Responsible for one-quarter of energy-related unwanted greenhouse gas emissions in 2009, the transport sector is the fastest-growing energy-consuming source in the world [1]. Among the transportation sector, three-wheelers show a significant growth rate. In India alone, during 2018–2019 fiscal year, domestic sales of three-wheelers increased by 10% and exports of manufactured three-wheelers increased by 49%; overall sales increased from 1.017 million units to 1.269 million units [2]. Even though considerable work is being done in four-wheel category to reduce emissions and fuel consumption, little work is been conducted on three-wheelers. Figure 1 shows a typical motorized three-wheeler by Bajaj Motor company.
Three-wheelers are found in most Asian, South American and African countries [4]. In large cities of Asia and Africa, millions of auto-rickshaw three-wheelers function as taxicabs [5]. Three-wheelers in developing countries offer a low volume, but high-frequency service and they are efficient feeders that can connect bigger public transport systems and provide last-mile connectivity to the doorstep. Three-wheelers can weave through dense urban traffic conditions and a solution for the growing parking problem in urban cities due to its small size. Even though three-wheelers are known to be highly pollutant vehicles due to the use of two-stroke engines and small-scale diesel engines, with stringent government regulations most of the three-wheeler fleet has moved to use four-stroke engines and fuels such as Petrol, CNG and LPG to reduce overall emissions. However, to improve the air quality of worlds most polluted cities such as Delhi, Mumbai and Jakarta, emission levels of the growing three-wheeler fleet should be further reduced and Electric Vehicle (EV) technology is an emerging solution to address this issue.
Hybrid EVs, plug-in EVs and battery EVs are common types of electric vehicles [1]. However, only the battery EVs can give potentially zero emissions. In recent years, the battery EV three-wheelers market has grown considerably. In India alone, during 2018–2019 fiscal year, the sale of battery EV three-wheelers was 630,000 units [2]. However, the emission reduction from battery EVs is offset by coal-burning power plants since these vehicles are charged using the national power grid. A case study made in West Bengal state, India show that when the emissions from the coal-fired thermal power plants are considered, the use of battery EV three-wheelers reduced the specific CO2 emissions (gm/passenger-km) by only 11% compared to a diesel three-wheeler [6]. In addition, to the carbon intensity of electricity generation, battery manufacturing and disposal must be considered. An effective alternative option is the reuse of batteries and it is found that the carbon emission reduction potential of reusing batteries is similar to moving from an oil-based vehicle to an EV [7]. In the global context, high infrastructure cost, anxiety on the resale market value, increase in demand for power generation, strong oil-base vehicle market and unit cost are some of the resistive forces for EVs in developing countries [8]. For instance, developing countries like Pakistan cannot transition directly from oil-based vehicles to battery EVs due to factors like charging infrastructure, load shedding of electricity and high cost of non-renewable energy [9]. In addition, battery EV three-wheeler owners in developing countries face challenges such as poor drivability characteristics [6], electricity blackouts, limited driving range and long charging times. An interim solution that mitigates these challenges and reduces overall fuel consumption and emissions is hybrid-electric technology.
The benefits of a fuel-efficient and eco-friendly hybrid electric three-wheeler to reduce adverse effects from the growing motorized three-wheeler fleet is well understood. Thus, the design of hybrid electric three-wheelers has been extensively investigated in the literature under different hybrid configurations. For instance, Vezzini et al. investigated a series hybrid electric three-wheeler and developed a prototype in [10]. Developing on the series hybrid concept, Amjad et al. investigated plug-in series hybrid technology for three-wheelers in [11]. Another popular hybrid configuration studied for three-wheelers is the parallel powertrain configuration. For example, Hofman et al. in [5] studied parallel micro-hybrid architecture for three-wheelers. Roy and Indulal in [12] extended the study of parallel hybrid technology for three-wheelers by investigating a parallel configuration where motor and engine power is coupled through road. Use of plug-in technology for parallel hybrid electric three-wheelers is studied by Padmanaban et al. [13]. Comparative analysis of hybrid configurations of three-wheelers is carried out by a recent study from Maddumage et al. [14]. The study examines the effect of hybrid configuration on fuel and emissions by studying conventional, parallel, series and complex powertrain designs for hybrid electric three-wheelers. These studies indicate that the use of hybrid technology for three-wheelers is a viable solution to reduce overall fuel consumption and exhaust emissions of the vehicle.
Regardless of the intensive studies on developing hybrid-electric three-wheelers, reports on parallel hybrid electric three-wheelers have not thoroughly dealt with designing an efficient and easy-to-implement power management strategy. The power management strategy of a parallel hybrid mainly involves in the management of power flow, namely, the power split strategy between the motor and engine. Various methods in developing power management strategies for hybrid electric vehicles have been proposed in the literature. These methods can be classified into two main groups, i.e., optimal control-based strategies and heuristic control strategies. Optimal control-based strategies use global optimization and instantaneous optimization methods based on optimal control tools. Limitations of optimal control-based strategies are that their solutions rely on future unknown information [15] and require high computational power. An alternate approach is heuristic control strategies. Heuristic power management strategies do not employ explicit optimization; instead, power management is carried out through heuristic rules [15]. Heuristic control methods have monopolized the production vehicle market due to the low computational power demand, natural adaptability to online-applications, good reliability and satisfactory fuel consumption results [16]. Fuzzy logic [17] and deterministic rule-based control belong in this category. One of the main limitations of this type of control strategies is the sub-optimal results compared to optimal control-based strategies. Nevertheless, by using results of a global optimization algorithm like dynamic programming (DP) as a template to design empirical rules for the control strategy, it is possible to improve the results of the rule-based control [18].
The possibility of deriving useful real-time control strategies from the global optimal results of the DP algorithm has been widely investigated in literature [19,20,21,22]. For instance, Wang and Lukic [23], applied DP to find the real-time optimal split between engine and motor in a series-parallel powertrain. Similarly, Lin et al. [24], found that optimal control rules can be extracted from DP results and used to design a near-optimal rule-based control strategy for a parallel hybrid. Results show a 28% increase in fuel economy with the near-optimal rule-based strategy, compared to a conventional vehicle. In another study by Lin et al. [18], a simple approach (based on the power request ratio from engine and motor to transmission speed) for extracting empirical rules for the control strategy from DP results is investigated. Results from the study showed a 50–70% reduction in the performance gap between the DP results. The combination of DP results and empirical rules of the rule-based strategy for real-time charge sustaining control of hybrid vehicles is studied by Biasini et al. in [15]. This study used a penalty function to control power split ratio in relation to battery state of charge (SoC) level. Results show that the performance of the improved control strategy is within 3% of the DP results. These studies show, extracting empirical rules from the DP results (optimal controller) is a viable approach to improve overall performance of a rule-based controller.
In spite of the research advances made, some of these power management strategies have been found to yield selective performance, which is charge-depleting in highway driving conditions and charge-hoarding in urban driving conditions [16]. In general, three-wheelers are used in urban areas. Thus, the use of DP to design a rule-based controller for hybrid electric three-wheelers should be carried out carefully to avoid charge-hoarding. A recent study from Asghar et al. [25] has attempted to implement a sub-optimal rule-based power management strategy based on DP results for a parallel hybrid electric three-wheeler. Despite the extensive methodology followed in extracting rules from the DP results; report has not thoroughly dealt with transmission gear strategy, numerical issues of DP, exhaust emissions and powertrain component sizing techniques in designing the control strategy of the hybrid electric three-wheeler.
The aim of the present paper is to design a rule-based control strategy for a parallel hybrid electric three-wheeler based on DP results to reduce fuel consumption and exhaust emissions, i.e., HC, CO and NOx. These exhaust emissions have serious impact on the urban air quality and public health [26]. Although HC, CO and NOx emissions can be reduced with emission control technologies [27]; in general, motorized three-wheelers on the market are not equipped with such measures. Three-wheelers are low-cost price-sensitive vehicles with a high price elasticity of demand. Larger social benefits such as harmful emissions are not relevant to the average user [28]. This is one of the factors for not having a stringent emission control strategy in motorized three-wheelers yet. Therefore, in the present study, reduction of HC, CO and NOx emission via hybrid technology is investigated in addition to the fuel economy. Overall fuel consumption and emissions of the powertrain are affected by gear shift strategy and component sizes of the hybrid power train. Since parallel hybrid electric vehicles use a motor and an engine in harmony to propel the vehicle, it is harder to develop an efficient gear shift strategy based on traditional methodologies. Thus, in the present study transmission gear strategy is developed based on DP results. In addition, a sequential design methodology [29] (sizing and control is solved separately in a sequential manner) is used in developing the hybrid powertrain. The power management strategy is developed in the present study for the sized parallel hybrid powertrain from [14].
Contributions of the study is of interest due to the systematic procedure presented to establish an easy to implement real time control strategy for parallel hybrid three-wheelers; which can be used by a developer to implement an eco-friendly parallel hybrid three-wheeler. The proposed control strategy uses only 2D maps and simple rules. Unlike with control strategies such as time delay neural network (TDNN) [30] and model predictive control (MPC) [31], proposed control law requires low computational power to operate. Furthermore, online control approaches like adaptive equivalent consumption minimization strategy (ECMS) [32] require predictive equipment like GPS; which add cost and complexity to vehicle development. The proposed strategy can be implemented without such equipment or sensors. The developed strategy is easy to implement and it does not require specialize knowledge to install for a practical application.
Striking a good balance to optimize all the objectives is difficult in a high dimensional objective space with more than three objectives using rule-based control law. Usually, three or less multi-objective are considered in developing DP based heuristic control laws [18,19,21,23,25]. The present study considers a multi-objective optimization problem with more than three objectives; which are defined as many objective optimization problems [33]. In addition, the DP method use quantization and interpolation techniques and these methods introduce numerical errors. Therefore, present study investigates numerical issues of DP in implementing the optimal control strategy. Furthermore, rules extracted from DP results does not necessarily constitute a comprehensive control law that can be implemented in a real-life vehicle. Thus, present study considers additional rules such as gearshift strategy in full EV mode.
The contributions of the study can be summarized as follows:
  • Investigation of numerical errors of the DP algorithm in implementing an optimal control strategy for hybrid vehicles.
  • Comprehensive rule extraction from DP results to establish a near optimal rule-based strategy for multi-objective (many objectives).
  • Establish additional rules to overcome shortcomings of the useful strategies extracted from DP results.
  • A systematic methodology to develop an easy to implement, real time, near optimal power management strategy for parallel hybrid three-wheelers.
This paper is organized as follows: In Section 2, simulation models for the control strategy analysis is developed. First, the main powertrain components of a parallel hybrid are modelled. Using the modelled powertrain components two quasi-static hybrid electric vehicle models, i.e., a backward-facing model and forward-facing model, are developed to simulate the DP-based optimal controller and proposed rule-based controller, respectively. In Section 3, the DP-based optimal controller is implemented. DP for the optimal control problem of the parallel hybrid is formulated and numerical issues of the DP algorithm are analyzed. The controller is simulated to reduce five objectives (i.e., gear shift frequency, fuel, HC, CO and NOx) and the trade-offs between the objectives are presented. In Section 4, results from the DP-based controller are extracted and used to develop the proposed rule-based strategy. In addition, the performance of the proposed rule-based strategy is analyzed and compared with DP results. Finally, conclusions are presented in Section 5.

2. Hybrid Electric Three-Wheeler Models

DP results are used to identify the empirical rules for the rule-based control strategy proposed for the hybrid electric three-wheeler. DP algorithm requires knowledge of future driving characteristics. Thus, the DP controller is implemented in a backward-facing hybrid powertrain model. Based on the DP results, a sub-optimal rule-based strategy is developed. To perform the energy analysis and the fuel consumption evaluation of the control strategies, the simulation method is generally used and the quasi-static models are usually selected [34,35]. Since only the energy flow is focused, the accuracy of the quasi-static models is sufficient for the simulation time step as large as 1 s [36]. Thus, in the present study to evaluate the proposed sub-optimal rule-based strategy a forward-facing quasi-static model is developed (time step of the used drive cycles is 1 s). Note, the developed quasi-static models do not consider dynamic characteristics such as response time of the engine and motor. The operational characteristics of the powertrain components are taken as instantaneous. Even though quasi-static models are adequate to analyze and optimize fuel economy and performance it is not sufficient to evaluate drivability characteristics.
In this section, mathematical models for main powertrain components of a parallel hybrid electric vehicle are modelled and based on the powertrain models two hybrid electric vehicle models are developed, i.e., forward-facing model and backward-facing model. [18,22,25,36,37] used a similar methodology.

2.1. Parallel Hybrid Electric Powertrain Model

Control strategy investigation is conducted for a pre-transmission parallel hybrid powertrain with a degree of hybridization of 0.3, the powertrain configuration is shown in Figure 2. Type of powertrain configuration is chosen by considering the volume required and cost. The three-wheeler is a small low-power and low-cost vehicle used in developing countries. The design of the hybrid powertrain should be carried out within the volume constraints of the existing three-wheeler design. Thus, the volume and cost required are major concerns in selecting the hybrid configuration.
Both hybrid and plug-in hybrid topologies have excellent fuel economy and environmental benefits [38]. In addition, to the electricity generation from the motor in a hybrid, the plug-in hybrids can externally charge the battery by connecting to the electrical grid. Although plug-in hybrids have a high fuel economy compared to a hybrid [39], plug-in hybrids are equipped with a large energy storage system [38]. In addition, the batteries account for a significant amount of the initial cost of a plug-in hybrid [39,40]. Thus, in the present study a non-plug-in hybrid topology is selected.
Out of the three traditional hybrid configurations (i.e., series, parallel and series-parallel), the parallel hybrid configuration has the least number of powertrain components. In general, the series-parallel configuration requires two electric motors, engine and a planetary gear set, which make the powertrain complex and costly [41]. The series hybrid also requires two motors and an engine. Even though for short trips engine can be downsized relatively easily, sizing the motors and battery is still a challenge, making the series hybrids expensive [41]. The parallel hybrid has the advantage of a downsized motor and drive compared to the series configuration [42]. Since the mechanical power is shared between the engine and motor, the parallel configuration does not require a large motor [43].
The powertrain consists of an internal combustion engine, an electric motor, a battery pack, a clutch and an automatically controlled manual transmission. As mentioned before, powertrain design follows a sequential design approach, component sizing and design of power management strategy is carried out successively [29]. Powertrain component sizes are found from previous work [14]. Basic parameters of the hybrid powertrain components and the vehicle are summarized in Table 1.
As shown in Figure 2, the output of the engine is connected to a motor via a clutch operated by the control unit. The automatically controllable clutch is used to connect or disconnect the engine torque with the electric motor torque. The clutch between the motor and internal combustion engine allows the powertrain to operate in full electric mode (motor only) without the engine. When the powertrain is operating on parallel mode (motor and engine operate in harmony) both electric motor torque and engine torque are coupled. Furthermore, the engine, motor and battery models are developed based on ADvanced VehIcle SimulatOR (ADVISOR) library maps/data. This approach already known in literature, is used to develop hybrid vehicle simulation models for the present study. Some examples where ADVISOR powertrain models are used for similar hybrid powertrain investigations are [18,20,22,23,24,44].

2.1.1. Longitudinal Vehicle Model

The vehicle model is defined with the characteristics of a motorized three-wheeler, with a glider mass of m g m (without the powertrain components). The total mass of the vehicle is,
m v e h =   m g m + m i c e + m m o t + m b a t t + m g b + m c a r g o
where m i c e mass of the engine, m m o t mass of the motor, m b a t t mass of the battery, m g b mass of the gearbox (transmission) and m c a r g o mass of three passengers including the driver.
The movement characteristics of a vehicle along its moving direction are determined by all the forces acting in that direction. Forces acting on the vehicle are modelled as a representation of the force balance at the tire patch. In the longitudinal direction, the main external forces acting on the vehicle are aerodynamic drag force F a , rolling resistance force F r , climbing resistance F c , acceleration resistance force F i and traction force at the wheel F t . The dynamic equation for the longitudinal hybrid electric vehicle model is expressed by,
F t = F a + F r + F c + F i
F t = 1 2 ·   C d · A ρ · v v e h 2 + m v e h g C r · cos α + m v e h g · sin α + m v e h · d v d t
where C d is the aerodynamic drag coefficient, A is the frontal area of the vehicle, ρ is the air density, v v e h is the linear velocity of the vehicle, g is the acceleration due to gravity, C r is the rolling resistance coefficient, α is the road gradient and d v d t is the linear acceleration of the vehicle.
For the simulation, the vehicle speed is extracted from the drive cycle at each time interval. Traction force required to overcome driving resistance forces depend on the current characteristics of the vehicle and driver demand at the next moment.
The vehicle simulation is a discrete-time system; therefore, the current acceleration a v e h , k is defined as a discrete function as follows,
a v e h , k = v v e h , k + 1 v v e h , k t s t e p
where v v e h , k is the current vehicle velocity. v v e h , k + 1 is the target velocity in the next moment and t s t e p is the time step of the simulation.
By considering Equations (1) and (3), traction torque required by the powertrain at the vehicle wheel during the current step in the discrete-time space T w h , is expressed as,
T w h = r w h (   1 2 ·   C d A ρ v v e h , k 2 + m v e h g C r · cos α k + m v e h g · sin α k + m v e h · a v e h , k )
where α k is the road gradient at the particular timestamp and r w h is the vehicle’s wheel radius. The angular velocity ω w h and angular acceleration ω ˙ w h of the wheel is expressed as,
ω w h = v v e h r w h
ω ˙ w h = a v e h , k r w h
The vehicle model assumes a constant rolling resistance coefficient and a constant tire radius. Effect of rotational inertia in the linear direction is taken as negligible. In addition, system vibrations and wheel slip are neglected.

2.1.2. Transmission Model
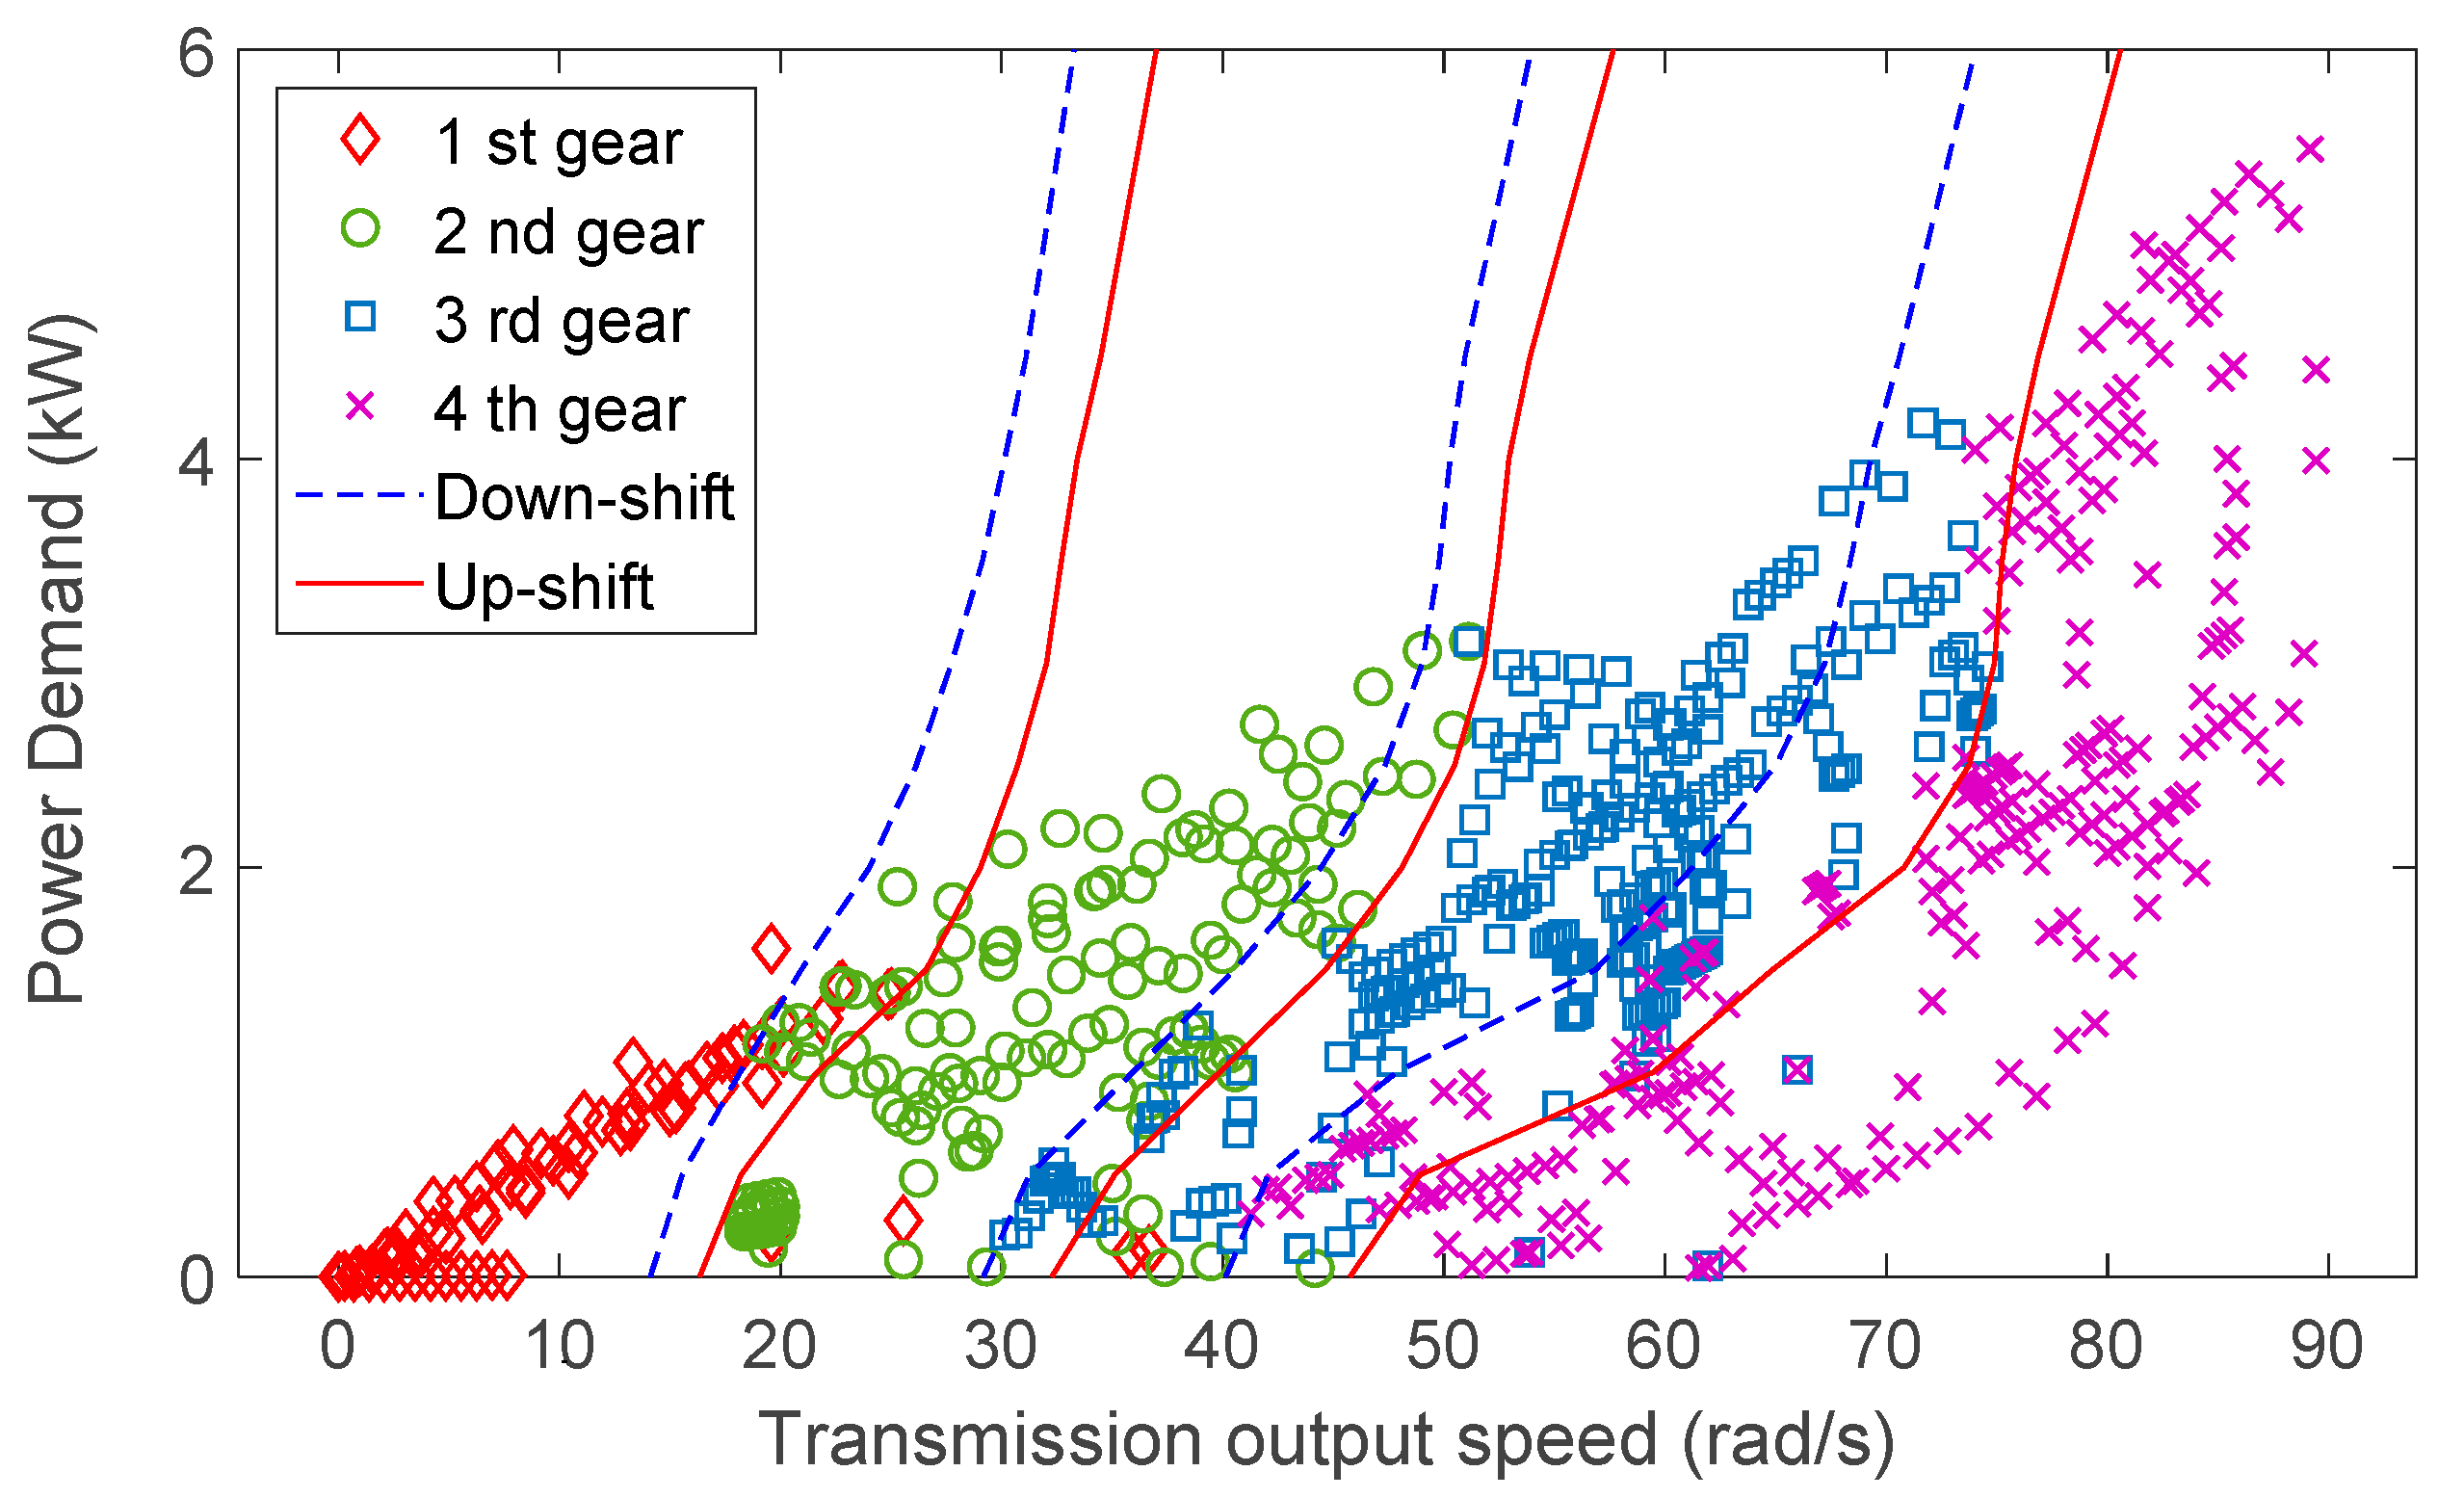
The transmission assembly is modelled as a four-gear automatically controlled manual transmission. The gearbox efficiency is considered equal for all the gears η g b = 0.95 . The powertrain torque on the clutch side of the gearbox T g b , is modelled as,
T g b = T w h η g b · γ ( i )   ,   T w h     0
T g b = T w h · η g b γ ( i )   ,   T w h   <   0
where γ ( i ) is the gear ratio for each gear including the final drive ratio. The angular velocity ω c and angular acceleration ω ˙ c of the crankshaft is expressed as,
ω c =   γ ( i ) · ω w h
ω ˙ c = γ ( i ) · ω ˙ w h
The gear switching strategy for the transmission is modelled using a discrete-time dynamic model. The transmission gear number at k + 1 time step,   N g e a r ( k + 1 ) is expressed as,
N g e a r ( k + 1 ) = { 4 ,                                                       N g e a r ( k + 1 ) + s h i f t ( k ) > 4 , 1 ,                                                       N g e a r ( k + 1 ) + s h i f t ( k ) < 1 ,   N g e a r ( k ) + s h i f t ( k ) ,                                                       o t h e r w i s e
where N g e a r ( k ) is the transmission gear number at kth time step and s h i f t ( k ) is the gear shift command, defined as s h i f t ( k ) { 1 ,   0 ,   1 } .
  • s h i f t ( k ) = 1 , gear downshift.
  • s h i f t ( k ) = 1 , gear upshift.
  • s h i f t ( k ) = 0 , maintain the current gear.
The gearbox model assumes no energy losses during gear shifting and inertia of the gearbox and final drive (differential) is neglected.

2.1.3. Clutch Model

The clutch between the motor and internal combustion engine allows the powertrain to operate in full electric mode without the resistive inertial torque of the engine. During the parallel operational mode, both electric motor resistive inertial torque T m o t _ 0 and engine resistive inertial torque T i c e _ 0 , are considered. The total torque demand from the electric motor and engine T d e m , is expressed as follows,
T d e m = T g b + T m o t _ 0   ,   c l u t c h   d i s e n g a g e d  
T d e m = T g b + T m o t _ 0 + T i c e _ 0   ,   c l u t c h   e n g a g e d  
T i c e _ 0 = I i c e · ω ˙ c
T m o t _ 0 = I m o t · ω ˙ c
where I i c e is the moment of inertia of the engine and I m o t is the moment of inertia of the motor. T d e m is split between the internal combustion engine and electric motor depending on the torque ratio determined by the power management strategy. The model assumes dynamics of the clutch are negligible.

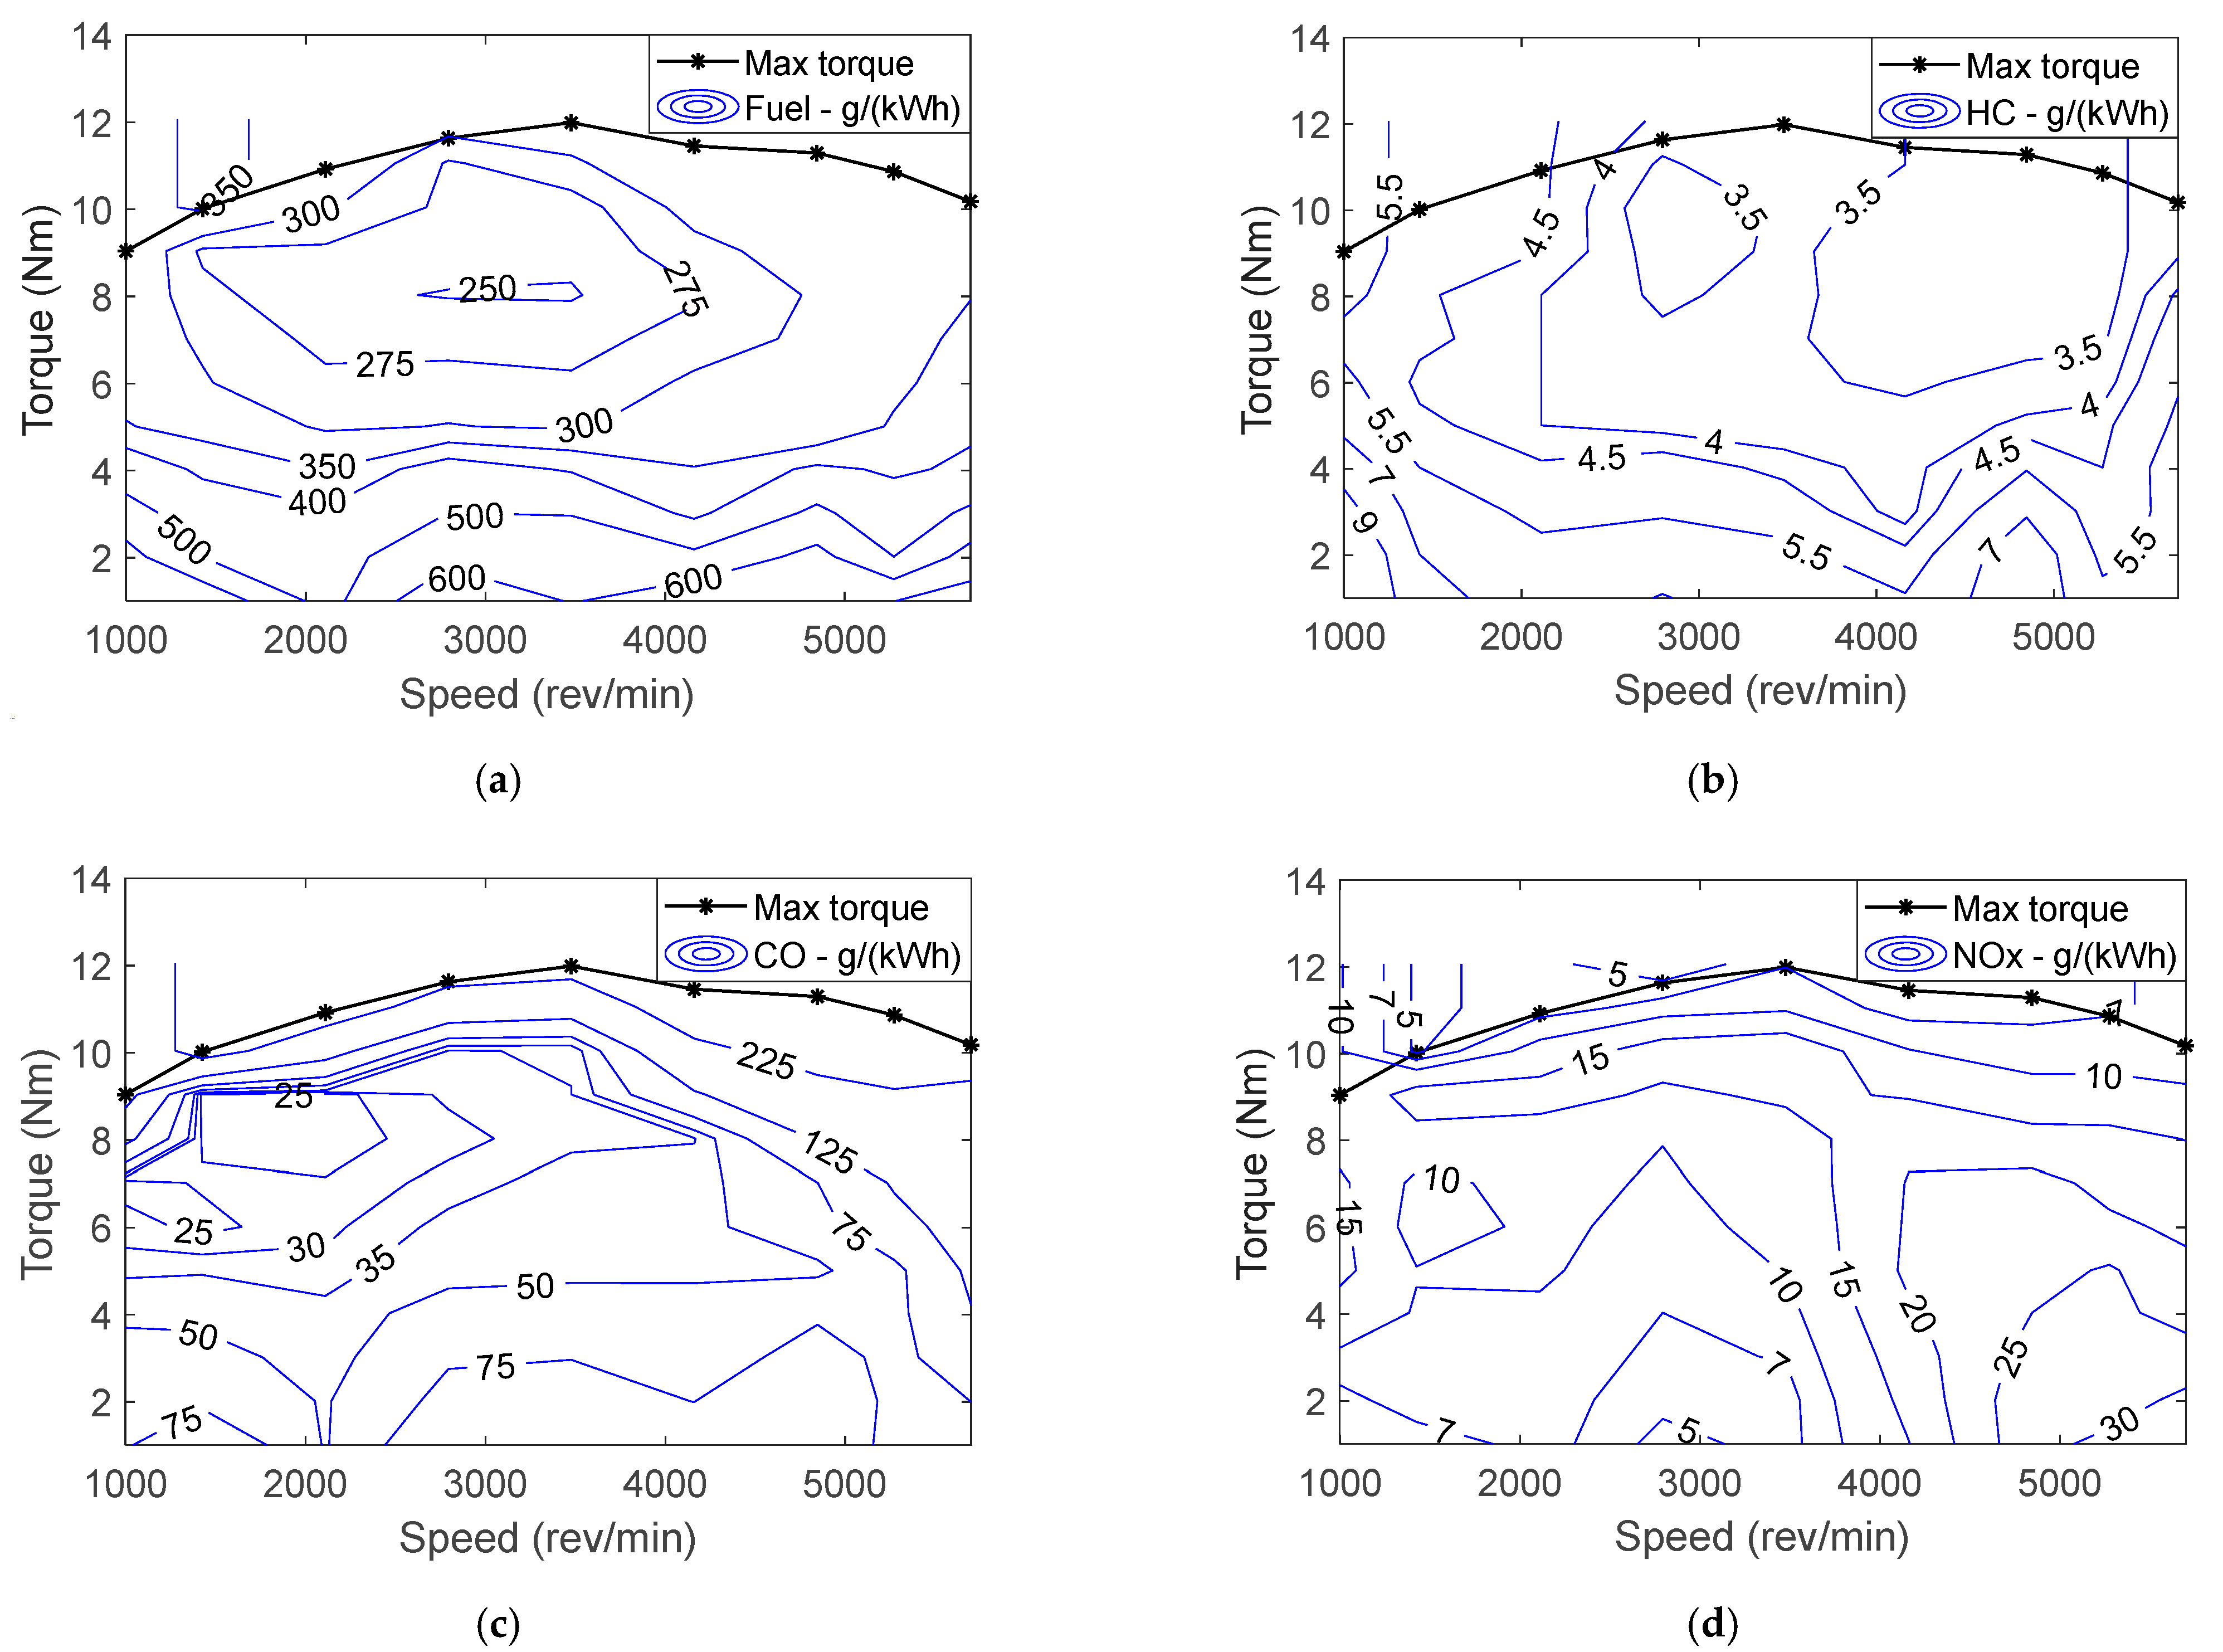
2.1.4. Internal Combustion Engine Model

The internal combustion engine model is generated with a static fuel consumption map, developed using experimental modelling method based on the Willians approximation. By using Willians line scaling approach, based on known steady-state efficiency data of a reference machine, efficiency of a new machine in the same category can be estimated [35]. In the present work, the engine model uses a scaled fuel consumption map of a gasoline SI Geo Metro 1.0 L engine from the ADVISOR library. The fuel consumption map of the engine is expressed as a relationship between engine torque, speed and brake specific fuel consumption (BSFC) as shown in Figure 3a. BSFC is a measure of fuel efficiency: the rate of fuel consumption divided by the power produced. Like fuel consumption of the engine, exhaust gas emissions (i.e., HC, CO and NOx) are estimated using experimental static gas emission maps. As shown in Figure 3b–d the emissions maps are expressed as a relationship between engine torque, speed and brake specific exhaust gas emission.
The engine model obtains the brake specific fuel consumption O B S F C ( ω e , T e ) at the engine operating point ( ω e , T e ) , where the engine outputs torque T e and speed ω e , using cubic spline data interpolation method,
O B S F C ( ω e , T e ) = f ( ω e , T e )
Fuel consumption rate m f ˙ (g/s) is expressed as,
m f ˙ = 1 3600 × 1000 · ω e · T e · O B S F C ( ω e , T e )
The fuel power P f u e l given to the engine is calculated by,
P f u e l = m f ˙ · Q l h v
Engine model considers exhaust gas emissions: HC, CO and NOx. The brake specific exhaust gas emission rate E a ( ω e , T e ) , “ a ” represent the emission gas (i.e., HC, CO and NOx), at the engine operating point ( ω e , T e ) is obtained using the cubic spline data interpolation method,
E a ( ω e , T e ) = f ( ω e , T e )
Exhaust gas rate m e x h , a ˙ (g/s), “ a ” represent the emission gas (i.e., HC, CO and NOx), is expressed as,
m e x h , a ˙ = 1 3600 × 1000 · ω e · T e · E a ( ω e , T e )
Engine model assumes the effect of change of temperature on the engine and frictional force of the engine are negligible. In addition, the dynamic characteristics of the engine are not considered.

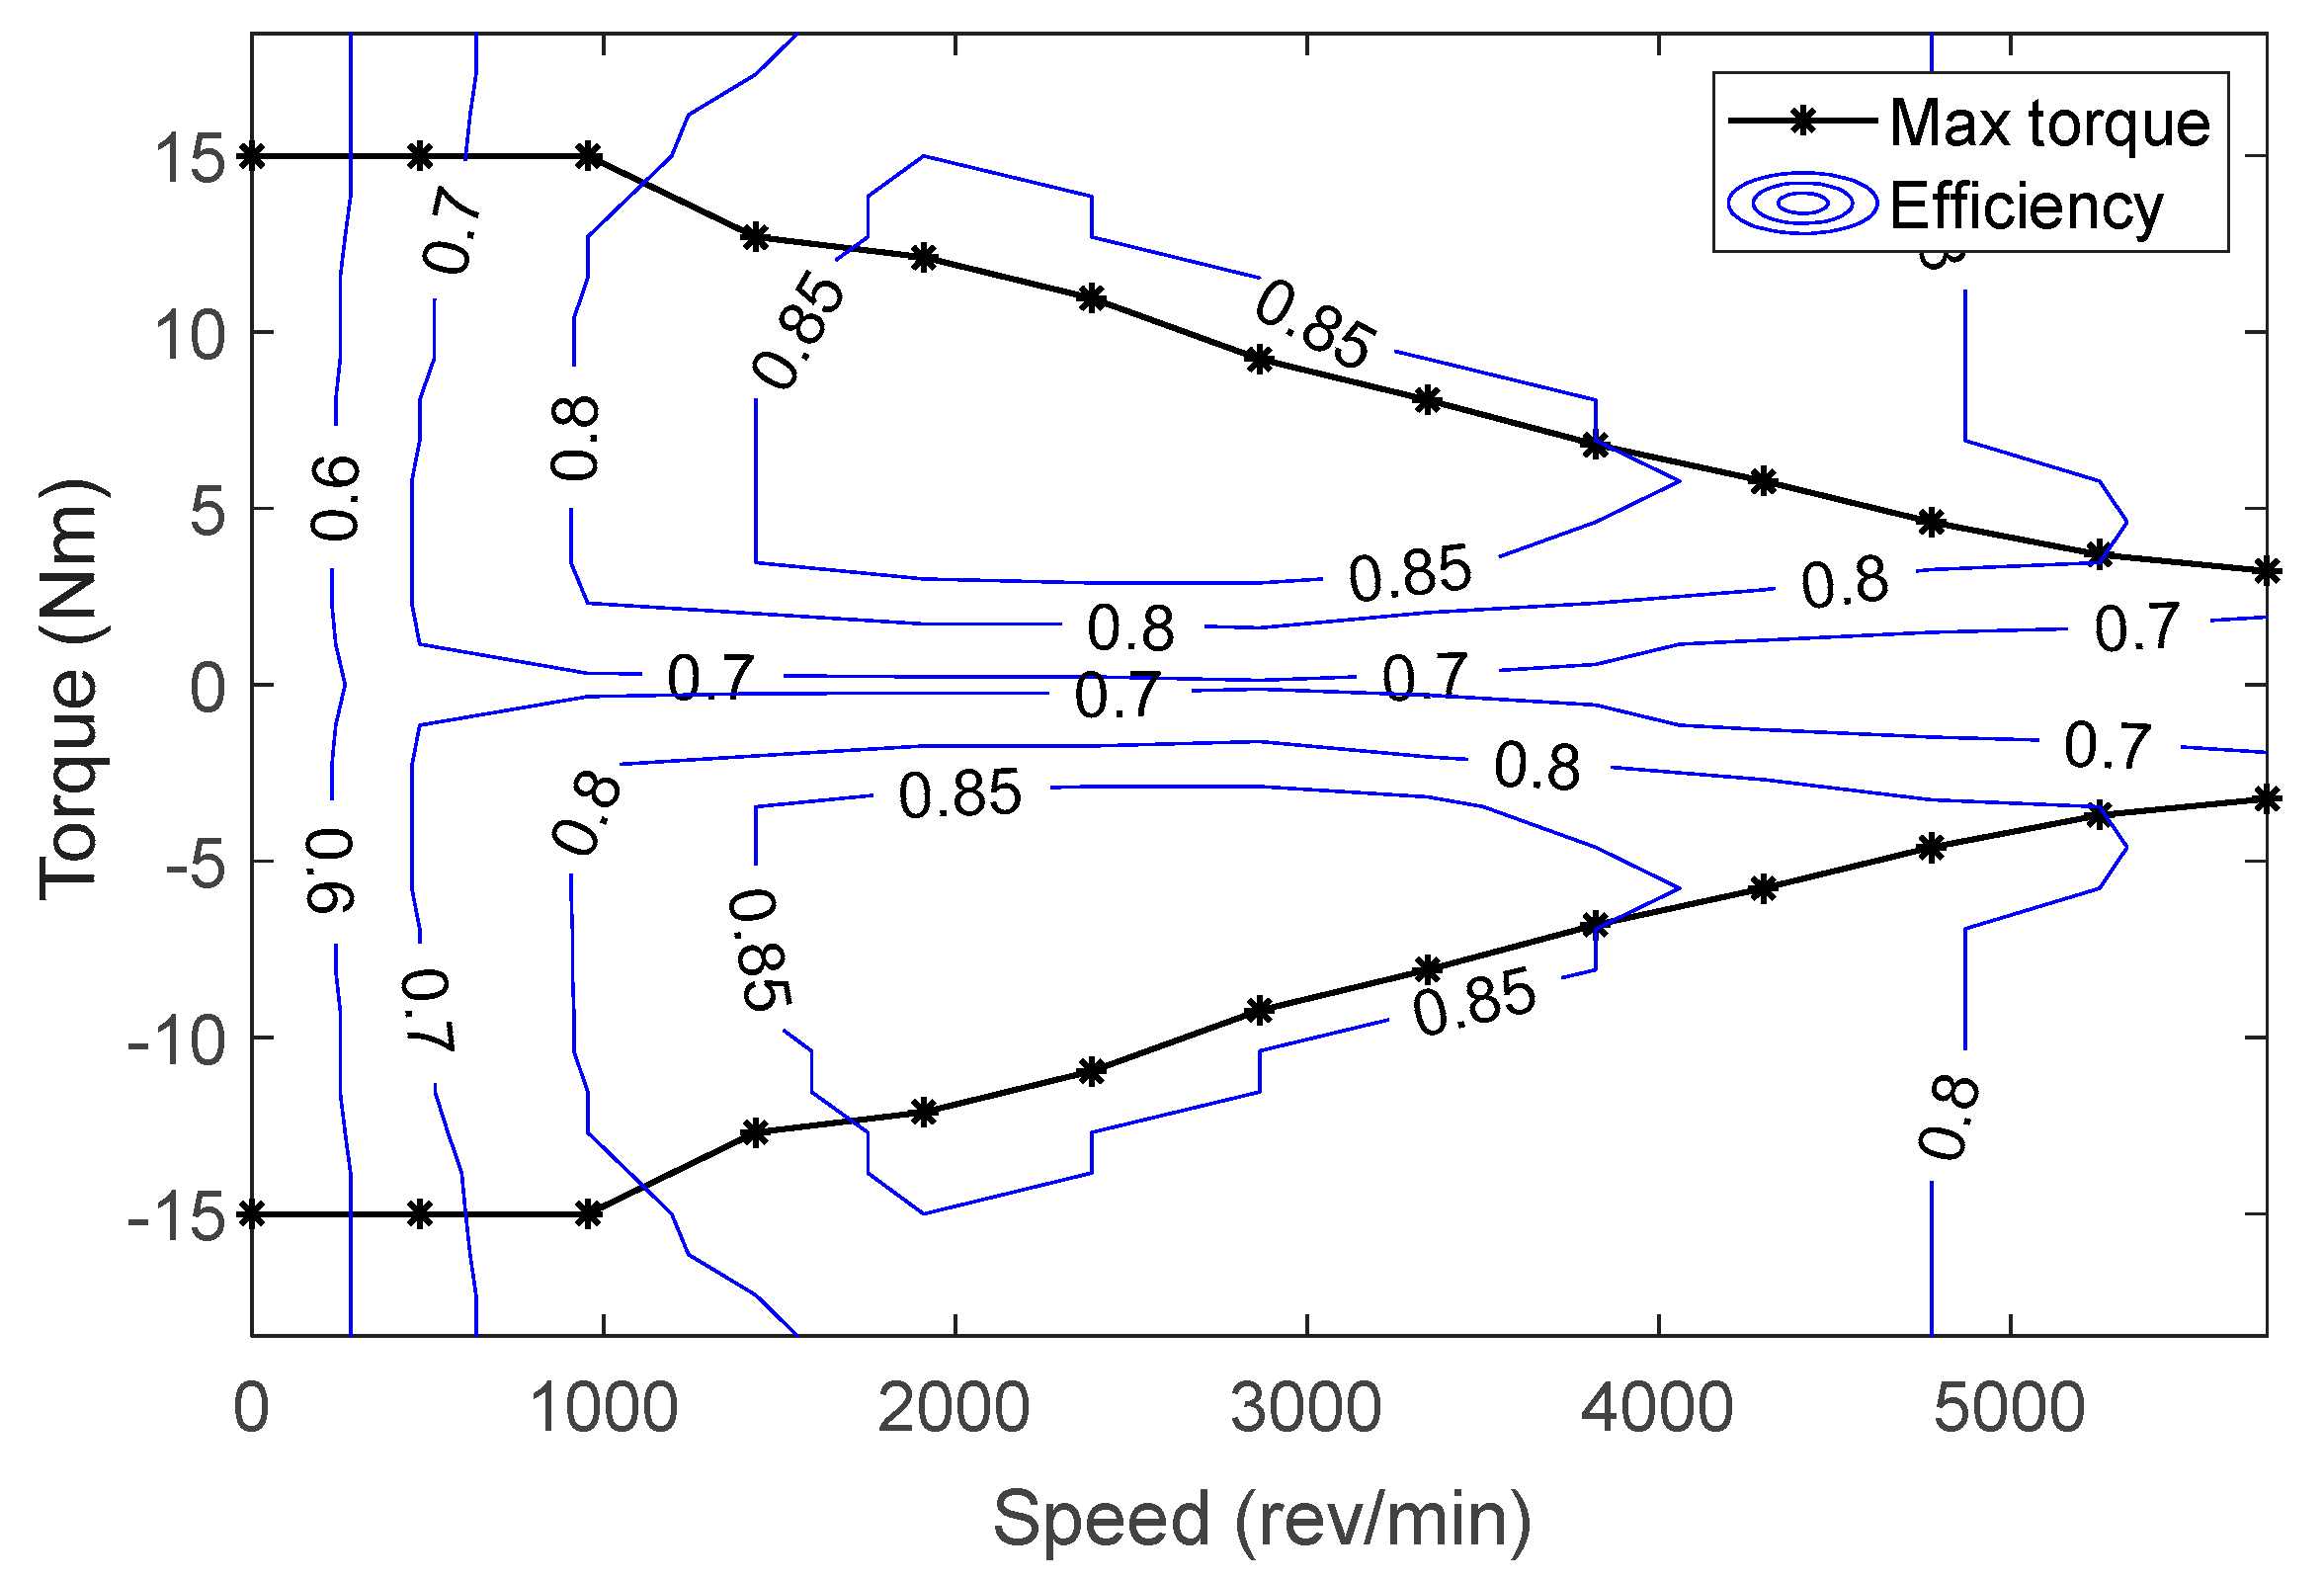
2.1.5. Electric Motor Model

The motor model is also developed using a static efficiency map. As shown in Figure 4, the efficiency map is expressed as a relationship between engine torque, speed and motor efficiency.
The electric motor efficiency η m o t ( ω m o t , T m o t ) , at the motor operating point ( ω m o t , T m o t ) , where the motor outputs torque T m o t and speed ω m o t , is obtained using the cubic spline data interpolation method:
η m o t ( ω m o t , T m o t ) = f ( ω m o t , T m o t )
The electric power needed from or supplied to the battery by the electric motor P e l e c _ m o t , is expressed by
P e l e c _ m o t = η m o t ( ω m o t , T m o t ) · ω m o t · T m o t ,   T m o t < 0
P e l e c _ m o t = ω m o t · T m o t η m o t ( ω m o t , T m o t ) ,   T m o t > 0
The electric motor model does not consider the dynamics of the machine. In addition, the model assumes the frictional force of the electric motor is negligible.

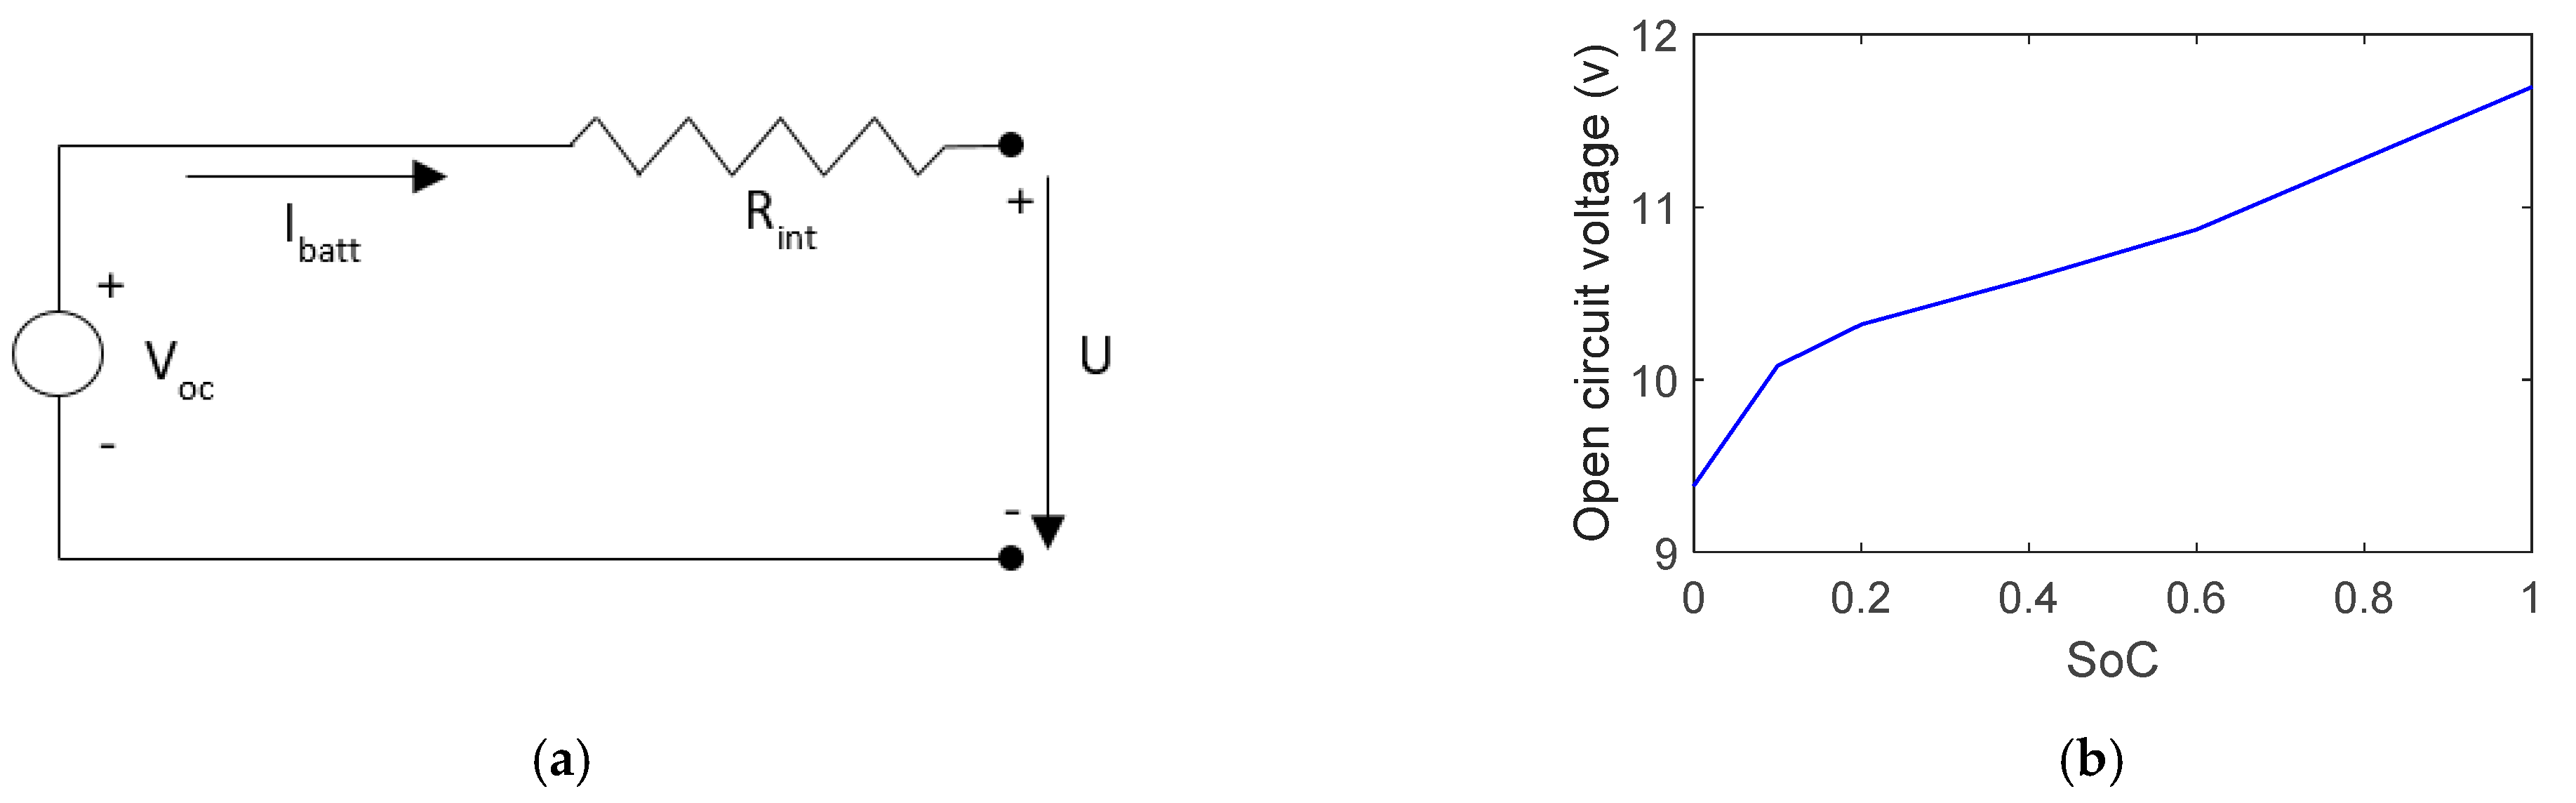
2.1.6. Battery Model

The battery model is generated as multiple modules with a combination of parallel and series cells to represent the 6 Ah Saft Li-Ion battery from the ADVISOR library. The battery input or output power P b a t t , is expressed by,
P b a t t = P e l e c _ m o t + P a u x
where P a u x is a constant auxiliary power demand that represents the power consumption of all the secondary systems of the vehicle. The battery pack is modelled as an equivalent circuit comprising an open circuit voltage V o c in series with an internal resistance R i n t as illustrated in Figure 5. In addition, U is the terminal voltage of the battery. The model is based on experimental data of battery charging-discharging.
In general, three-wheelers are widely used in countries such as India, Sri Lanka and Pakistan. Where temperature variation over the year is not significant. Thus, in the present study a constant temperature of 41 °C is considered to model the battery. The battery open-circuit voltage V o c , which is a function of battery   S o C and battery temperature T b a t t , is shown in Figure 5b and expressed by the interpolation function,
V o c = f ( S o C , T b a t t )
Battery internal resistance R i n t , which include Ohmic resistance R o and polarization resistance R p , is expressed by the interpolation function,
R i n t = f ( S o C , T b a t t )
Charging and discharging current of the battery, which is defined as positive during discharging and negative during charging, is expressed by,
I b a t t = V o c V o c 2 4 R i n t · P b a t t 2 R i n t
The battery state of charge S o C , in the discrete system, is expressed as,
S o C k + 1 = S o C k ( V o c , k V o c , k 2 4 R i n t , k · P b a t t , k 2 R i n t , k ) · η b a t t 3600 ·   Q b a t t
where S o C k + 1 is the battery SoC at the (k + 1) time step and S o C k , V o c , k , R i n t , k and P b a t t , k are the battery SoC, open-circuit voltage, the internal resistance of the battery and battery power at the kth time step, respectively. In addition, Q b a t t is the battery capacity and η b a t t is the battery charging-discharging efficiency. Similar to [22] η b a t t is defined as,
η b a t t = { 1.0   ,   I b a t t 0 0.9   ,   I b a t t < 0
Note that an alternate approach to calculate battery efficiency is using battery circuit equivalent model data. Similar to [45] open-circuit voltage, internal resistance and output power can be used to better approximate the battery charging-discharging efficiency.

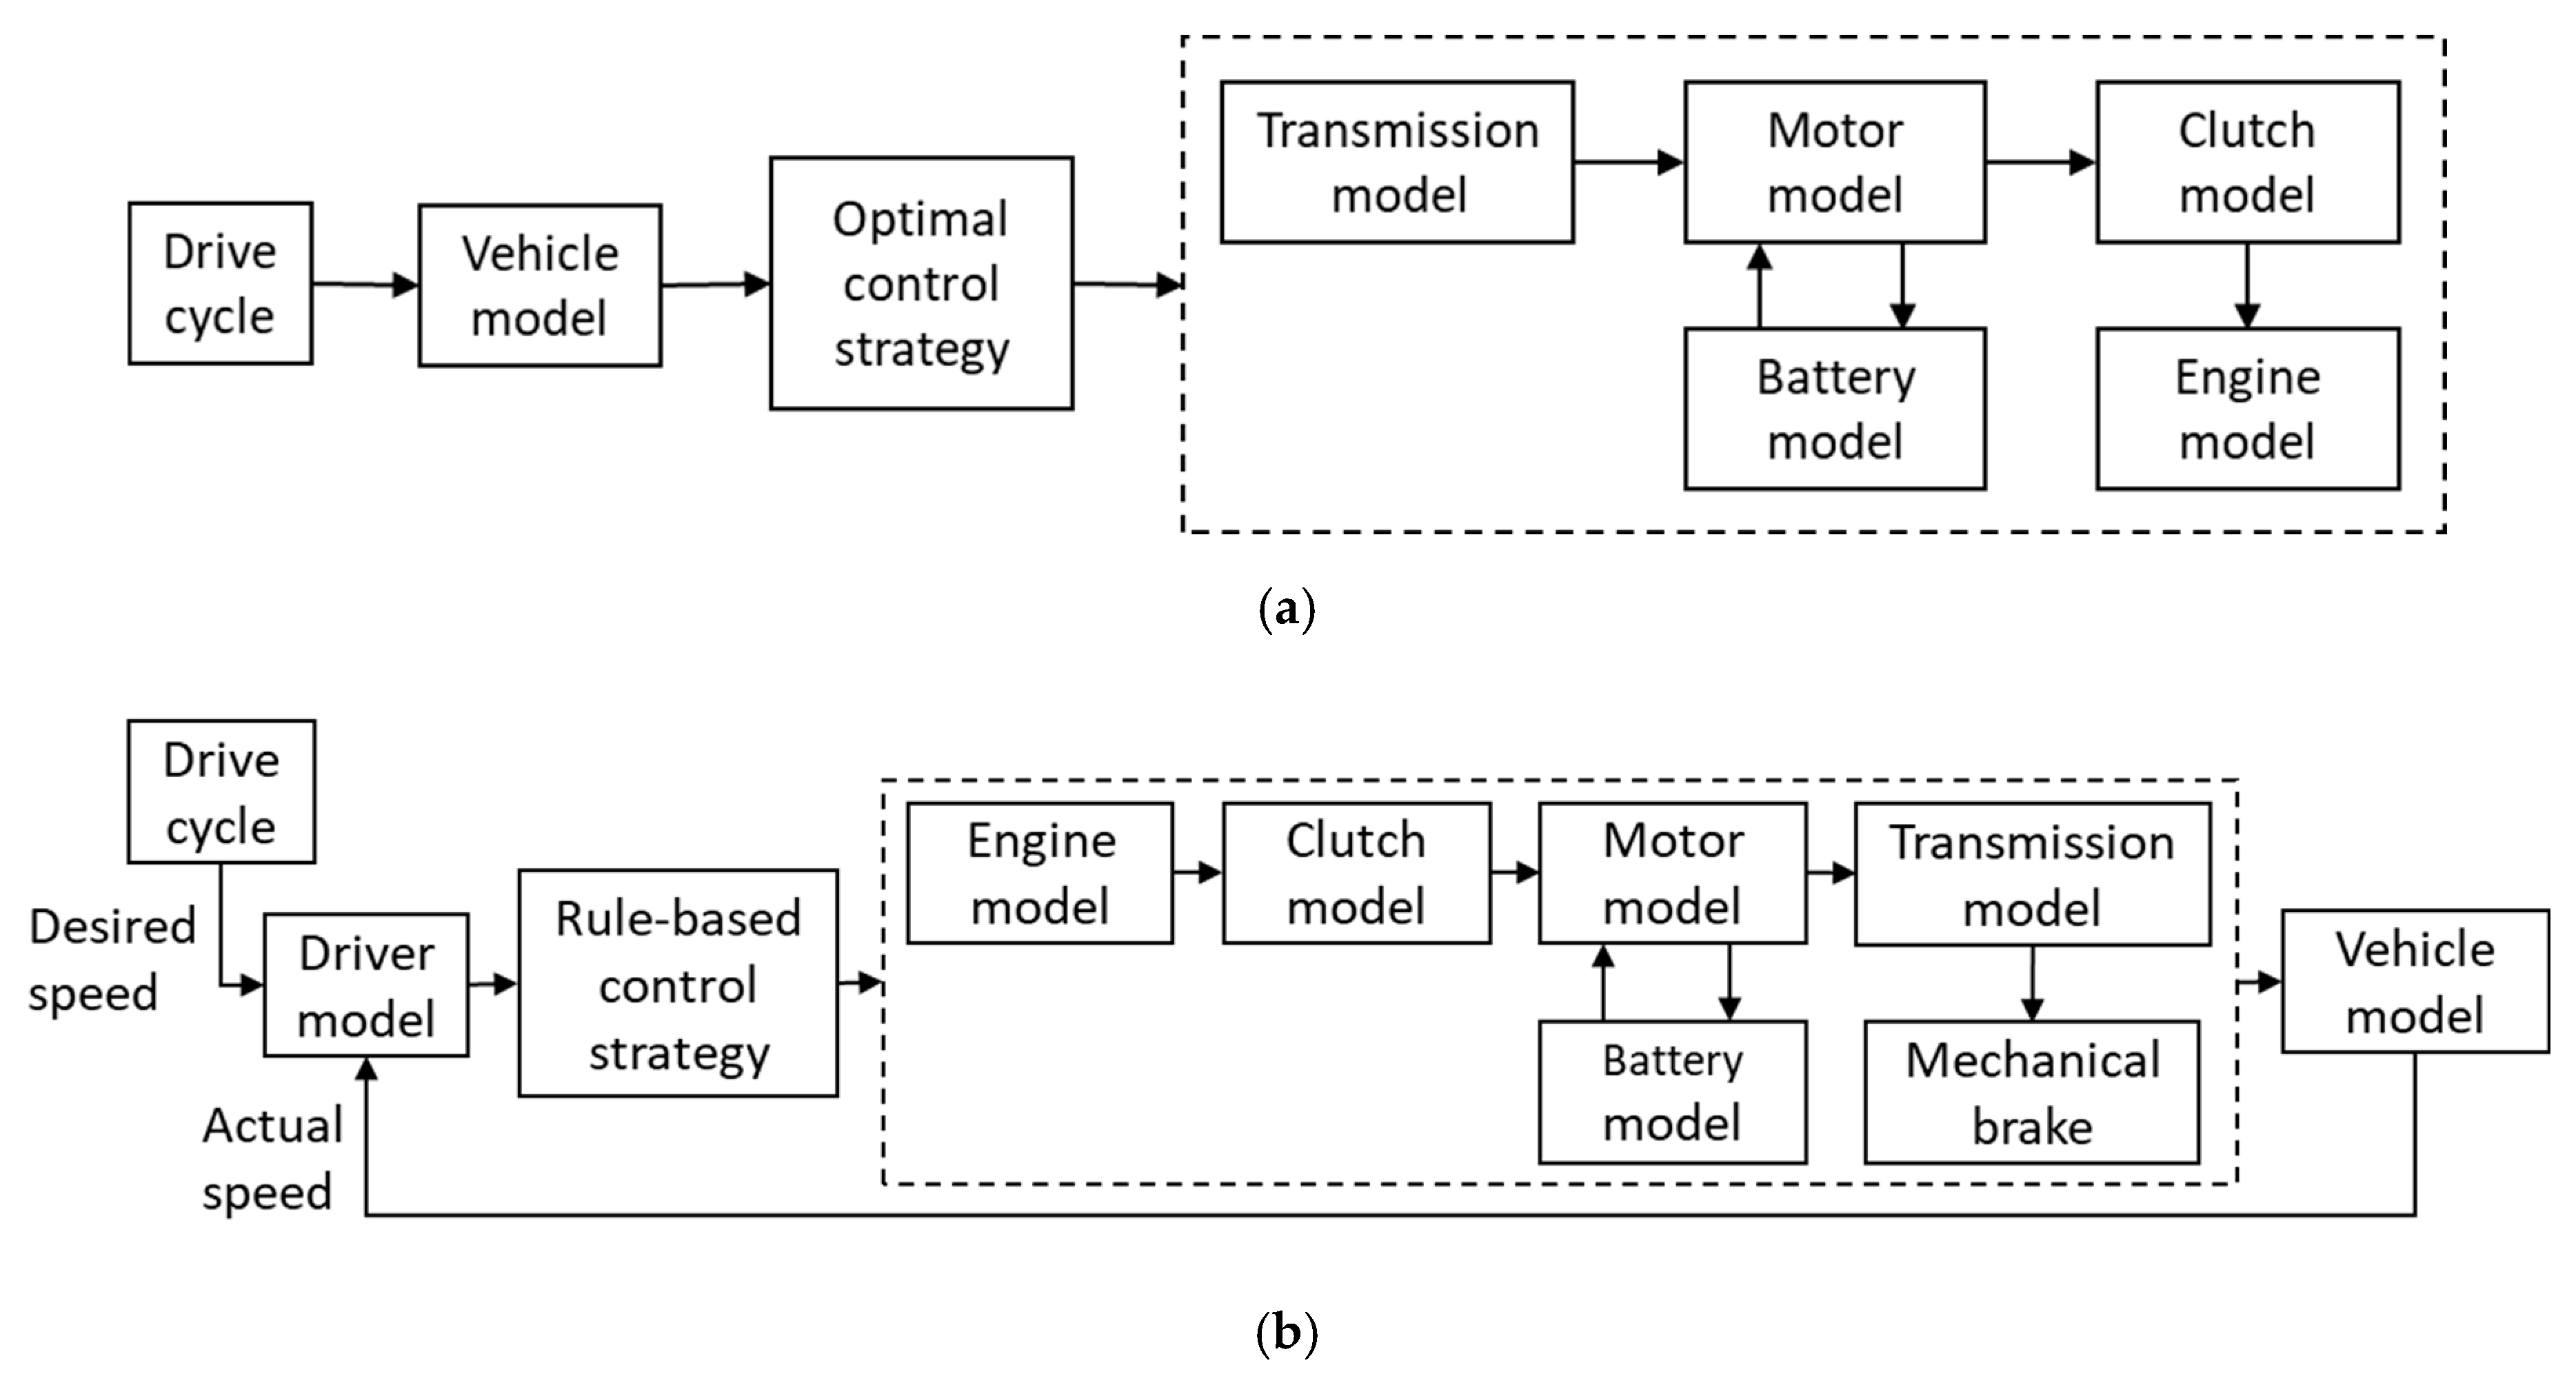
2.2. Quasi-Static Hybrid Electric Vehicle Models

Forward-facing model and backward-facing model [46] are developed with the above powertrain component models. The forward-facing model is developed in MATLAB/Simulink environment and backward-facing model is developed in MATLAB application. As mentioned above, the optimal controller (DP based) is simulated on the backward-facing model and the proposed rule-based controller is simulated on the forward-facing model. Figure 6 shows the basic schematics of the backward-facing model and forward-facing model.
As shown in Figure 6b, the forward-facing model is implemented with a driver model. The driver model simulates the manipulation of the accelerator pedal and the brake pedal by the driver. The model is implemented as a PI controller, which compares the actual velocity (velocity of the model) with the desired velocity (velocity from the drive cycle) to generate acceleration and brake commands. Acceleration and brake commands are given to the supervisory controller which formulates the clutch command, gear shift command, engine torque command and the motor torque command.
The backward-facing model is implemented with two control commands, i.e., gear shift command and torque split command (torque split factor between motor and engine). These commands are generated by the optimal controller (DP-based controller). The torque split factor is defined as a continuous variable u [ 1   1 ] .
  • u = 1 , only the motor provides necessary torque or full brake energy recuperation;
  • 0 < u < 1 , both the motor and engine provide the necessary torque;
  • u = 0 , only the engine provides the necessary torque;
  • 1 < u < 0 , engine provides surplus torque and motor is in generator mode;
  • u = 1 , engine provides surplus torque and motor is in maximum generator mode (full recharge).
To gauge the comparability of the two models, the backward-facing model and forward-facing model is simulated with the same parameters. The cumulative error on fuel consumption, drive cycle and battery SoC are 1.7%, 0.75% and 0.01%, respectively.

3. Global Optimal Control Strategy Based on DP

DP is a powerful numerical method for solving optimal control problems. One of the main advantages of the DP technique is that global optimality of the found solution is guaranteed even for nonlinear dynamic systems with constraints [21]. The main limitations of the technique are the in-ability to solve causal problems and the exponential computational power requirement growth with the increase of state variables and input variables of the analyzing dynamic problem [47].
In the present study, the dynamic program algorithm is implemented based on the MATLAB DP function developed by Sundstrom and Guzzella in [48]. DP technique is used to design the control strategy of the hybrid electric three-wheeler. Using a drive cycle, DP based optimizing algorithm can find the optimal power management strategy. Thus, the results of the DP optimization can be used for developing less computationally demanding online control strategies. The drive cycle used in this study, is the worldwide harmonized light vehicles test cycle (WLTC) class 1 test cycle. In this section, firstly, the theoretical framework of the implemented DP controller is presented. Secondly, the formulation of the hybrid electric three-wheeler optimization problem is shown. Thirdly, the numerical issues of the implemented DP algorithm are analyzed. Finally, results of the multi-objective optimization are examined.

3.1. Implementation of DP

DP solves the complex optimal problem by breaking it down to a collection of subproblems. To solve the DP problem, the main continuous problem is discretized, i.e., hybrid vehicle model. The discrete hybrid vehicle model is expressed as,
x k + 1 = f k ( x k , u k ) ,   k = 0 , 1 , k , k + 1 , , N 1
where x k and u k are the state variables (such as: vehicle speed, transmission gear position, battery state of charge) and control variables (such as: gear shift command, motor torque, motor speed, engine speed and engine torque) at the kth time stamp, respectively. x k + 1 is the state variable at the k+1 time step. The goal of the DP algorithm is to minimize a cost function over a given test drive cycle by varying the control variables u ( k ) . The cost function of the optimization problem is expressed as,
J = g ( x N ) + ε ( x N ) + k = 0 N 1 h k ( x k , u k )
where g N ( x N ) + ε N ( x N ) is the cost at the terminal timestamp of the drive cycle. g N ( x N ) is the final cost and ε N ( x N ) is the additional cost incurred due to the partially constrained final state, x ( t f ) ( x f , m i n , x f , m a x ) . x ( t f ) is the state variable value at the terminal time step of the drive cycle. x f , m i n and x f , m a x is the final expected state variable range, minimum value of the final state variable and maximum value of the final state variable, respectively. h k ( x k , u k ) is the instantaneous cost incurred when the control policy represented by the control variable u k , is applied at x k , grid point. The grid points are the intersection of discretizing lines of the state space and time space [37]. N is the time length of the driving cycle.
DP algorithm solves the optimization problem by finding the optimal control signal map and optimal control sequence. Based on the principles of optimality, DP algorithm evaluates the optimal cost-to-go function J * k ( x k ) at every node in the discretized state time space by going backwards in time [49].
The final cost at the Nth time step is calculated by
J * N ( x N ) = g ( x N ) + ε ( x N )
For the kth (k = N−1, N−2, …, 0) time step, cost-to-go function is calculated by
J * k ( x k ) = m i n u k [ h k ( x k , u k ) + J * k + 1 ( f k ( x k , u k ) ) ]
The optimal control is given by the argument that gives the minimum value for Equation (34) at every grid point of the discretized state time space. By solving Equations (33) and (34), the optimal control signal map is found. Which is used to find the optimal control signal by a forward simulation of the model in Equation (31), starting from a given x 0 , to generate the optimal state trajectory [49]. Note that principles of the implemented DP algorithm are already reported in [22,48,49] and thus only a summary is presented here.

3.2. Problem Formulation

To implement DP technique to the hybrid electric three-wheeler model, state and control variables need to be found. State of the vehicle model can be expressed through state variables such as vehicle speed, transmission gear number and SoC. The vehicle speed is a known value at every stage of the drive cycle. Therefore, in the present study, the state of charge of the battery and transmission gear number are defined as the state variables.
SoC of the vehicle model over its drive cycle is continuous, for the DP, the continuous variable must be discretized. The continuous state variable SoC is discretized into finite number of points. Where the number of grid points of the discretized state variable, SoC, is expressed as
S g = S o C m a x S o C m i n Δ S o C
where S o C m a x is the maximum SoC value and S o C m i n is the minimum SoC value. Δ S o C is the increment value of the discretized SoC. The state variable, transmission gear number, N g e a r ( k ) , is defined as a discrete function with four values, to represent the gear number at kth time step:
N g e a r ( k ) [ 1 , 2 , 3 , 4 ]
Several control variables can be found for the vehicle model, such as gear shift command, motor torque, motor speed, engine speed and engine torque. In the present study, gear shift command, motor torque and engine torque are considered as control variables. The two variables, motor torque and engine torque are expressed by a single control variable defined as the torque split factor. The control variable torque split factor,   u [ 1   1 ] , is the ratio between the motor torque and engine torque. Torque split factor is a continuous variable. For the DP algorithm, it is necessary to discretize the control variable into finite number of points. The discretization resolution for the control variable is expressed by, Δ u , which is the increment value of the discretized control variable. The number of grid points of the discretized control variable, u , is expressed as
u g = u m a x u m i n Δ u
where u m a x is the maximum torque split factor value and u m i n is the minimum torque split factor value. The control variable, gear shift command, s h i f t ( k ) , is defined as a discrete function to represent the shift command at kth time stamp. Variable is restricted to three values, −1, 0 and 1, to represent downshift, same gear and upshift, respectively. Table 2 summarizes the key variables of the DP optimization algorithm.
In general, in optimizing hybrid electric vehicles, only the fuel consumption is considered. In the present work, both fuel consumption and exhaust emissions are considered. The multi-objective optimization approach results in Pareto optimal solutions instead of one single solution. To generate the Pareto front, a scalarization method is used. The multi-objective problem is transformed into a series of single objectives by the classic weighted sum approach [50]. Even though the cost of each objective, i.e., Fuel consumption, HC, CO and NOx emissions, have the same unit of measurement, i.e., grams per second, the range is different. Therefore, prior to the optimization process costs are normalized [51]. The normalized cost f i n o r m , where i { F u e l ,   H C , N O x , C O } , is expressed as,
f i n o r m = f i ( x k , u k ) min (   f i ) max (   f i ) min (   f i )
where f i ( x k , u k ) represents the cost incurred at kth time stamp, namely instantaneous fuel consumption rate for fuel and instantaneous exhaust emission rate for emissions, i.e., HC, CO, NOx. max (   f i ) and min (   f i ) is the maximum and minimum cost values of each objective, respectively. Normalized cost f i n o r m , is a non-dimensional function with upper and lower bounds.
The gear shifting control is governed by the DP algorithm and if the gear shift control is not restricted, DP chooses the gear position to reduce fuel consumption and emissions at each time step resulting in a gear position map with frequent shifting. Therefore, a fifth objective is added to restrict the gear shifting frequency.
f g e a r = | s h i f t ( x k , u k ) |
The cost-to-go function at kth time step is defined as
J k ( x k ) = m i n u k [   w i ·   f i n o r m + w g e a r ·   f g e a r + J k + 1 ( x k + 1 ) ]
where w i > 0   for all i { F u e l ,   H C , N O x , C O } , w g e a r   > 0 and w i + w g e a r = 1 [52]. The J k + 1 ( x k + 1 ) , is the cost of the cost-to-go function at k + 1 time step.
The objective of the dynamic program is to minimize the cost-to-go function within defined constraints by varying the control variables. During the optimization, constraints relating to power ratings and characteristics of the powertrain components should be guaranteed to ensure the smooth operation of components such as the engine, motor and battery. Following are the imposed constraints,
S o C m i n S o C S o C m i n ω e _ m i n ω e ω e _ m a x T e _ m i n T e T e _ m a x ω m o t _ m i n ω m o t ω m o t _ m a x T m o t _ m i n T m o t T m o t _ m a x
where ω e _ m i n , ω e _ m a x , T e _ m i n and T e _ m a x is the engine minimum speed, maximum speed, minimum torque and maximum torque, respectively. In addition, ω m o t _ m i n ,   ω m o t _ m a x , T m o t _ m i n and T m o t _ m a x is the motor minimum speed, maximum speed, minimum torque and maximum torque, respectively.

3.3. Numerical Issues of DP

DP is a numerical algorithm, which is generally solved using quantization and interpolation methods. To solve the optimization problem, continuous variables such as state, control and time are discretized. Discretization inherently introduces numerical errors, which degrade the accuracy of the DP results. Therefore, to avoid these numerical errors without increasing computational effort, careful implementation of the DP algorithm is important [47]. In this section, numerical issues of DP are investigated, i.e., the boundary line issue and resolution of the discretized variables.

3.3.1. Boundary Issue and Resolution of the Study

One of the numerical issues resulting from the interpolation is the boundary line error. Infeasible states and inputs are infinitely expensive. Therefore, the cost incurred at such a point should have an infinite cost. Using an infinite cost value make it impossible to use linear interpolation to calculate the boundary line of the infeasible region. Therefore, a finite cost, which is bigger than the maximum value of the cost-to-go function is used for the infeasible points to reduce the blurring effect of the boundary line.
The resolution of the total vehicle energy demand over a drive cycle increases with the resolution of the time space, thus increasing the resolution of the fuel consumption and amount of emissions released. However, the minimum sampling period of the time space is restricted by the sampling period of the drive cycle. Therefore, in the present study, the resolution of the time space is taken as the resolution of the drive cycle.

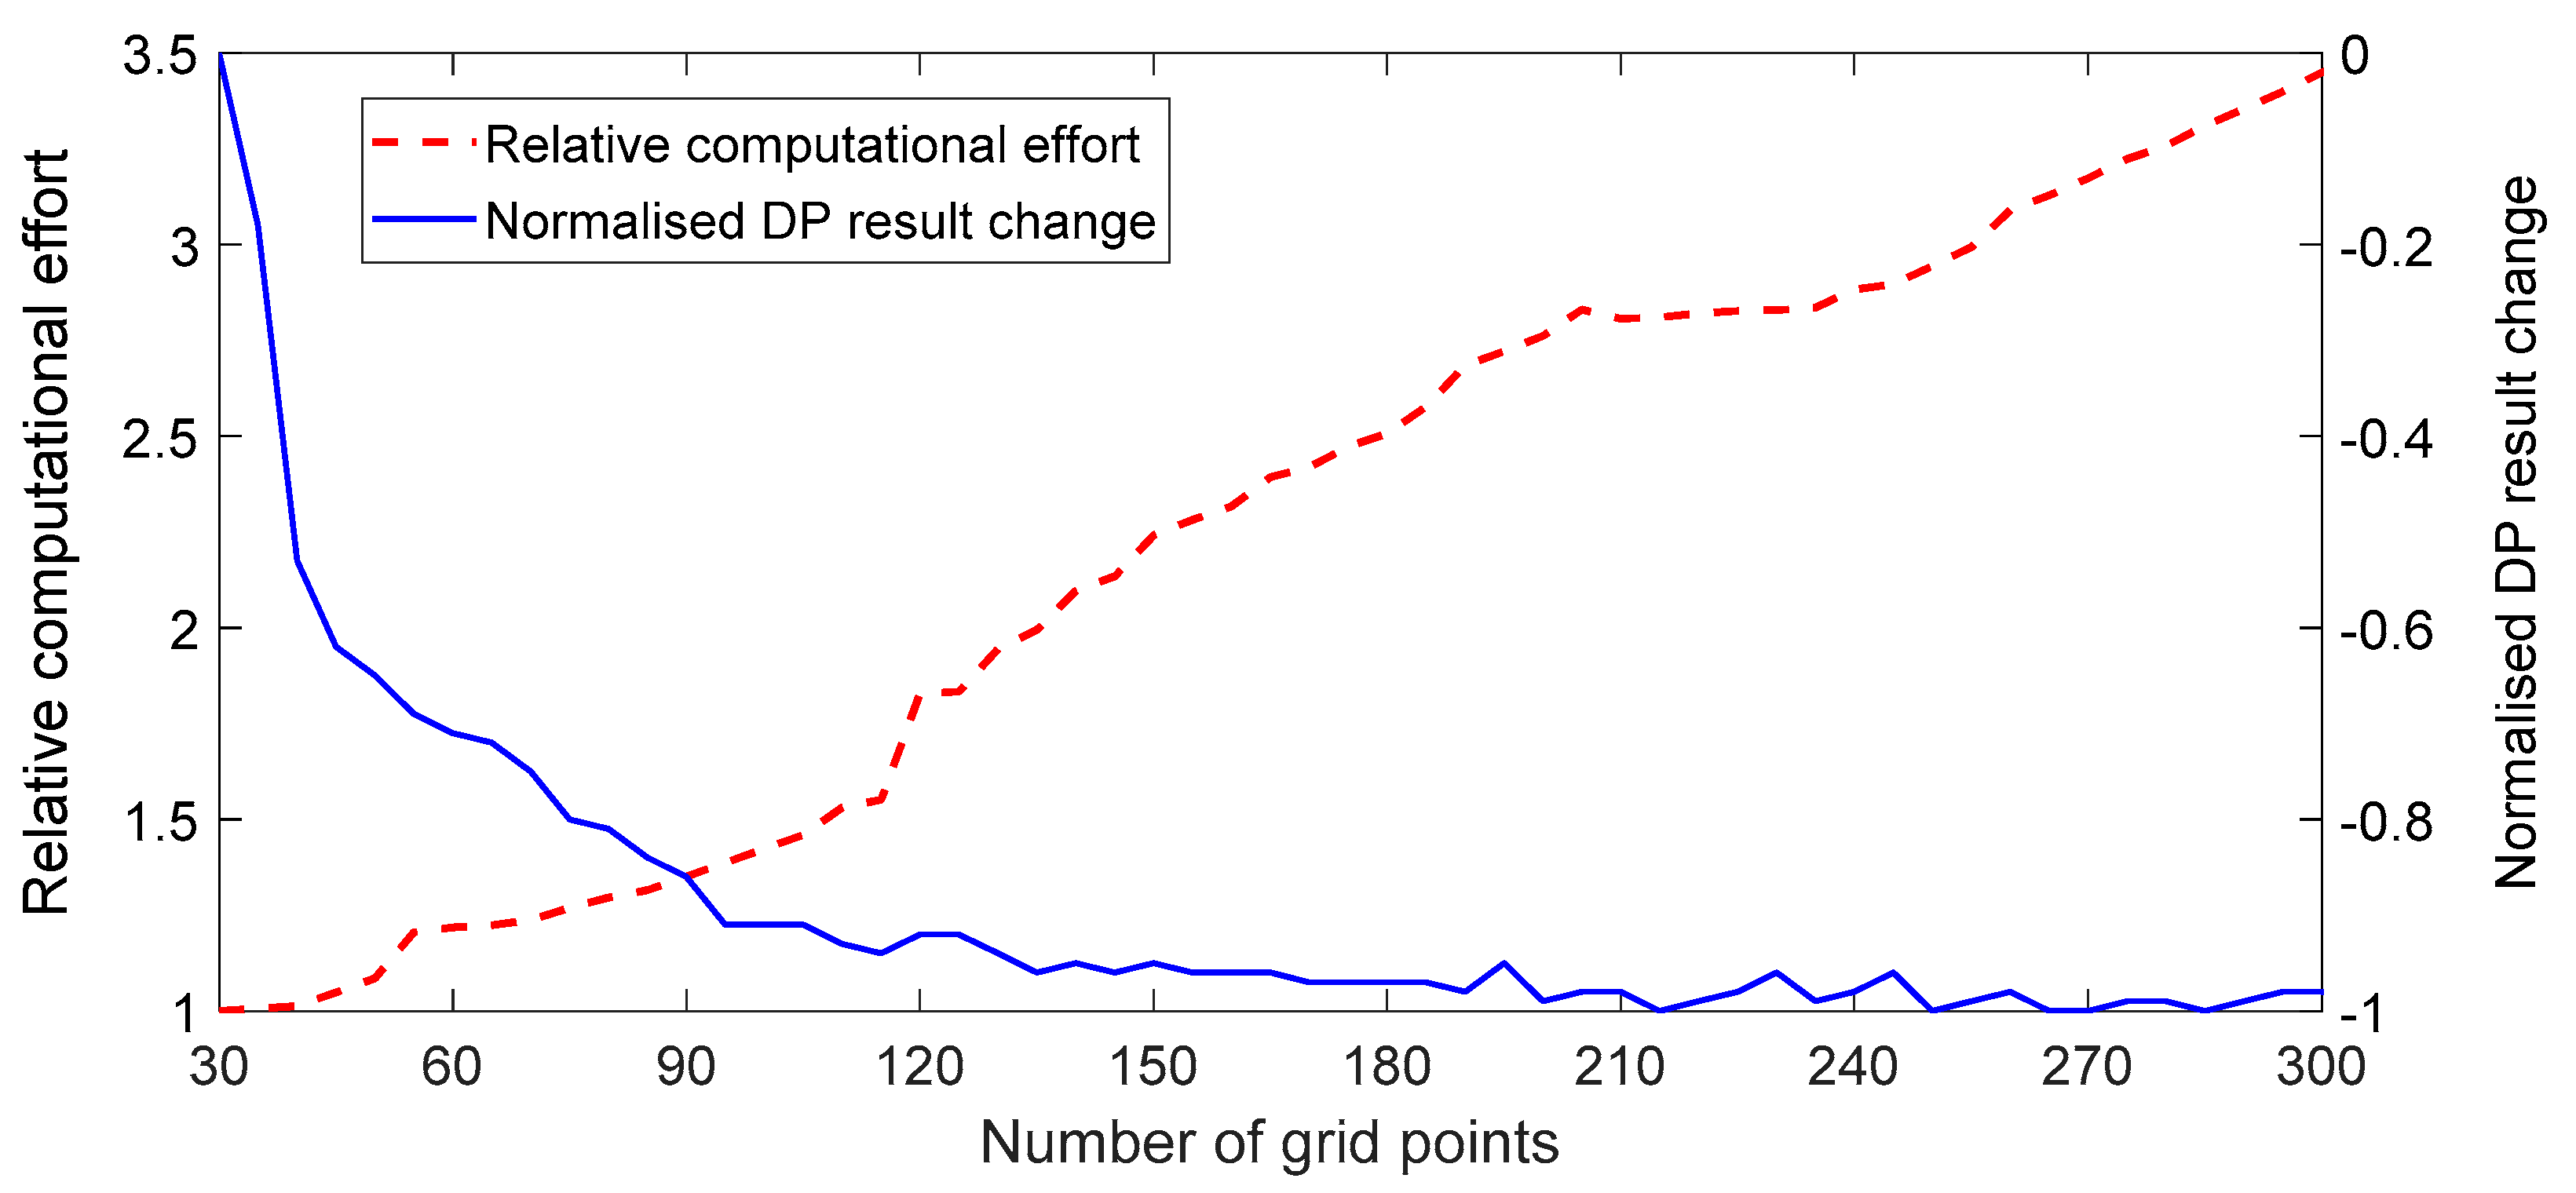
3.3.2. Resolution of State Variable

The only continuous state variable and control variable in the present study is the battery state of charge and torque split factor. According to the mathematical principles of DP, the discretization resolution of the state space and the discretization resolution of the control variables are independent [37]. Therefore, discretization resolution of the state variable SoC can be investigated independently of the control variable torque split factor and vice versa.
The resolution of the SoC is determined by the number of grid points S g , the state variable is divided. Figure 7 represents the relationship between the number of grid points in the state space, normalized DP results and computational effort. The number of grid points indicates the resolution of the state space. Higher the number of grid points, higher the resolution of the state space. Normalized DP result change represents the change of the solution of the optimization problem, namely the output of the cost function. The relative computational effort represents the change of the computational time requirement as a multiple of the computational time required for the minimum grid number analyzed. Note that DP problem is solved in the present study with an Intel® Core™ i7-7700HQ CPU and a 16 GB RAM.
Figure 7 shows that normalized DP results decrease with the increase of the number of grid points in the state space. However, when the resolution of the state space is sufficiently high, DP results tend to be stable. In contradiction, with increased state-space resolution, relative computational effort increases by many folds; computational effort increased from 30 grid points: 37 s to 300 grid points: 135 s. Even though the computational effort increases with the accuracy of the DP result, the appropriate number of grid points for the state variable that ensures a satisfactory DP result with a minimum computational load can be obtained. Onwards from 110 grid points, DP results change is less than 0.1, while computational effort increases by fourfold from 110 grid points to 300 grid points. In the present study, the number of grid points for the state space is selected as 110 points, resulting in a Δ S o C of 0.0027, the increment value of the discretized SoC.

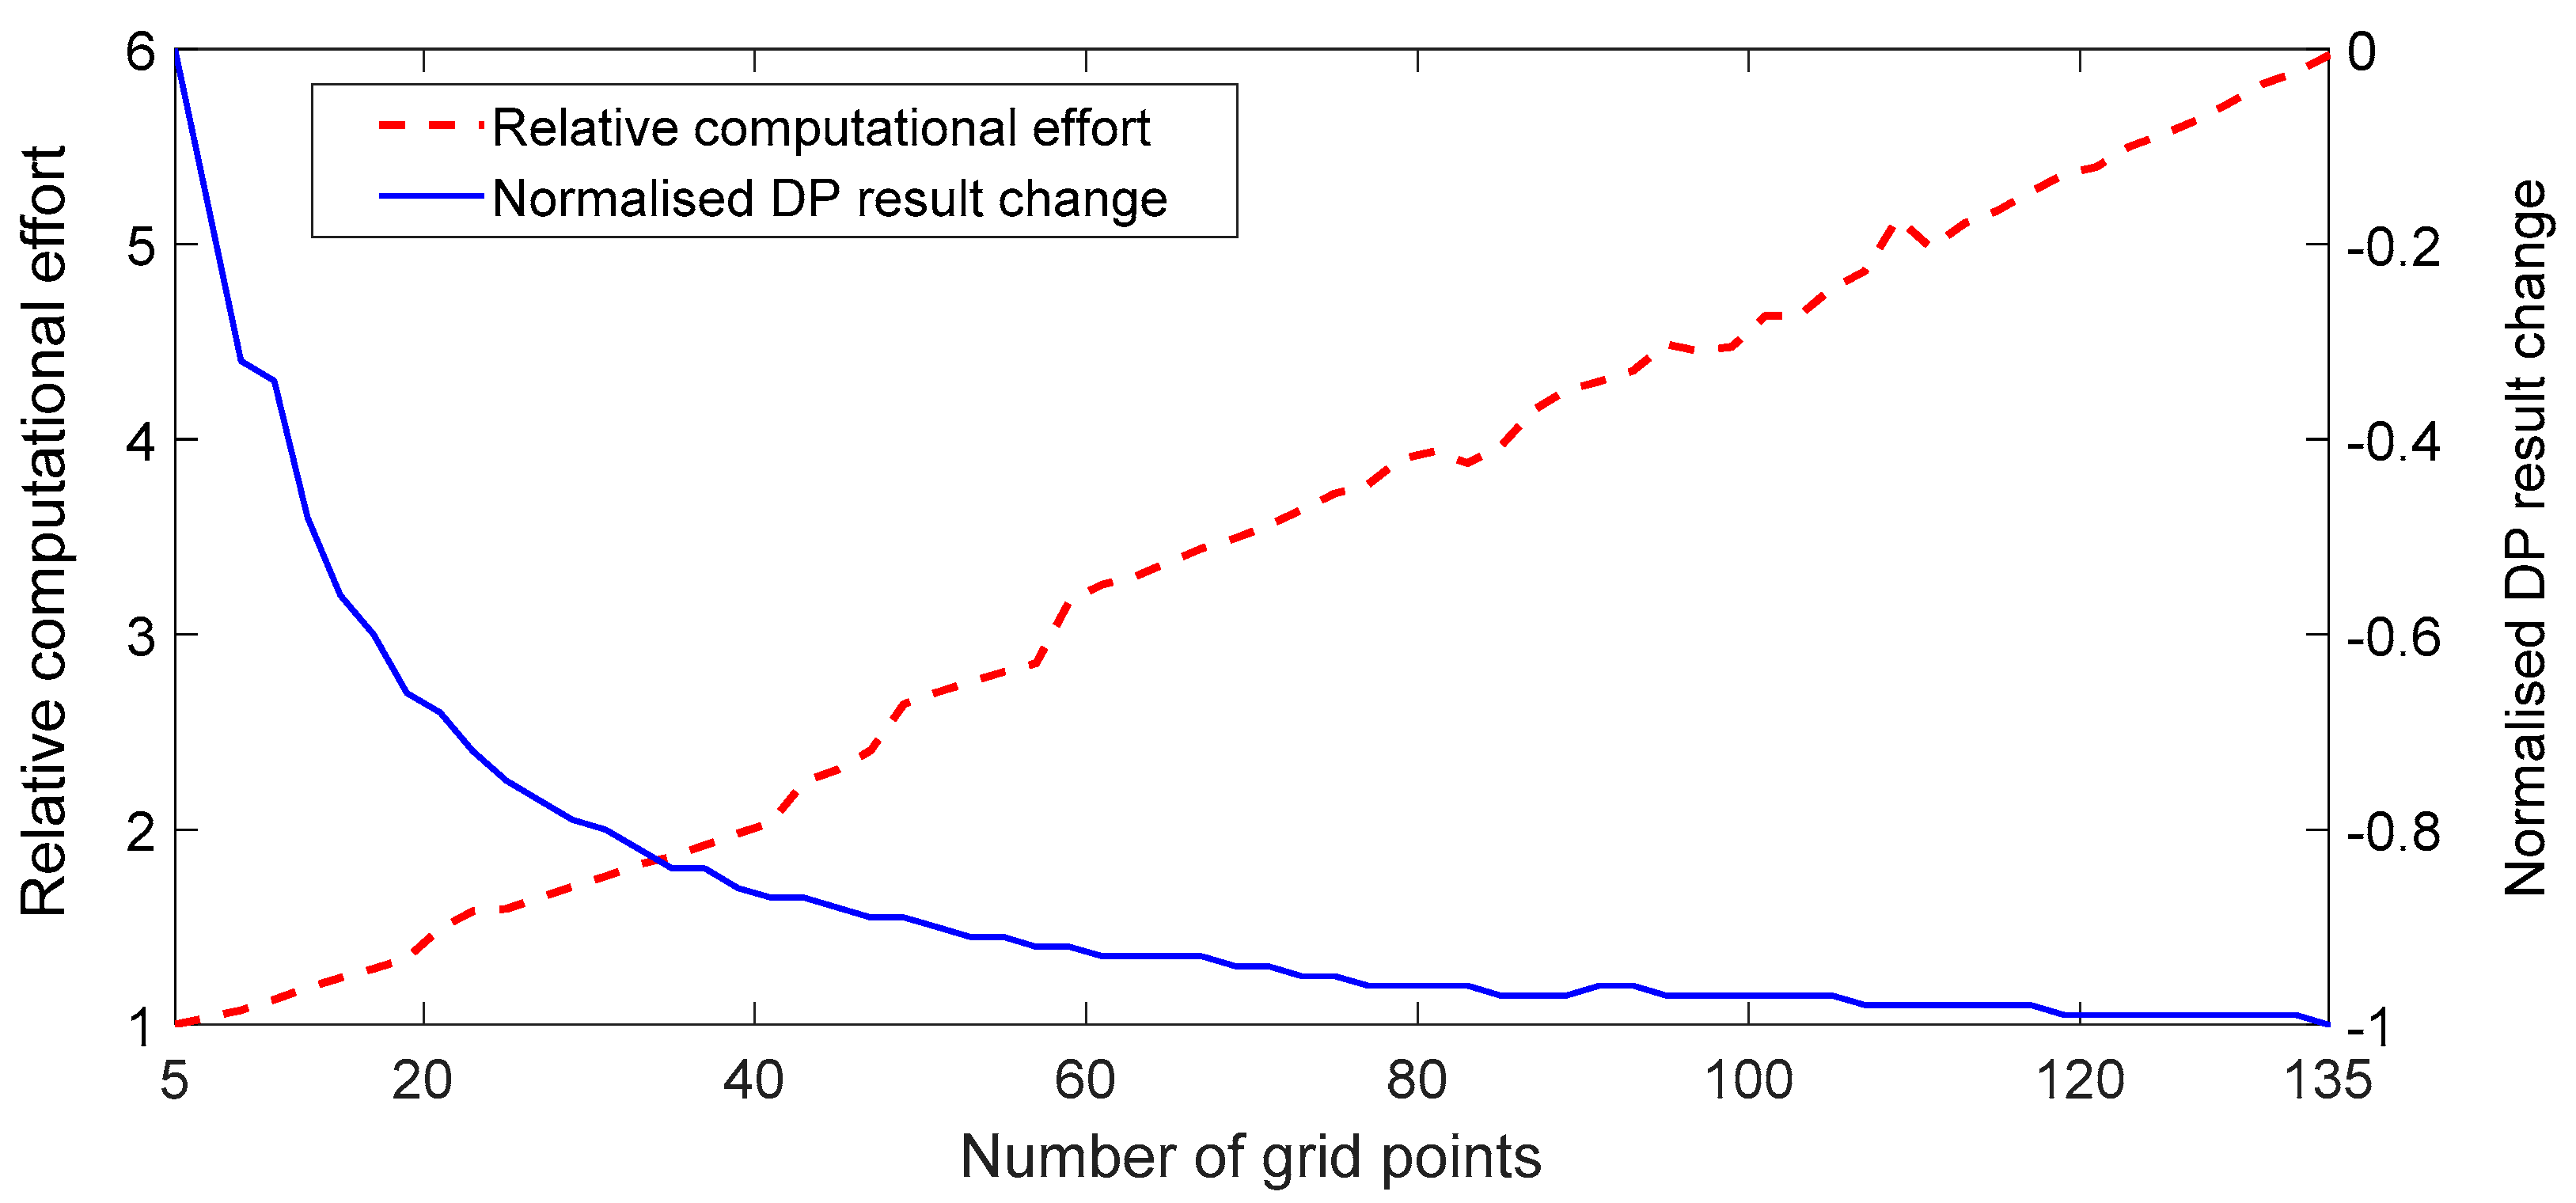
3.3.3. Resolution of Control Variable

The number of grid points of the control variable u g , indicate the resolution of the control variable. Higher the number of grid points of the control variable, higher the resolution. Figure 8 represents the relationship between the number of grid points of the control variable, DP results and computational effort. Similar to the analysis on the state space resolution, the number of grid points indicate the resolution of the control variable. Normalized relative DP result change represents the change of the solution of the optimization problem. The relative computational effort represents the change of the computational time requirement as a multiple of the computational time required for the minimum grid number analyzed.
Results show that the normalized DP result is improved with the resolution and tends to be stable after the resolution of the control variable is sufficiently high. In contradiction, the computational effort has increased six-fold from 5 grid points: 28 s to 135 grid points: 167 s. Even though the computational effort increases with the accuracy of the DP result, the appropriate number of grid points for the control variable that ensures a satisfactory DP result with a minimum computational load can be obtained. Between 71 and 135 grid points, DP result is improved by only 0.08, but computational effort doubled. In the present study, the number of grid points for the state space is selected as 71 points, resulting in a Δ u of 0.028, the increment value of the discretized torque split factor. Note that the fuel consumption map of the engine should be considered when selecting the discretization resolution of the control variable [37]. The amount of fuel consumed and emissions released are related to the characteristics of the engine. The relationship between DP results and the number of grid points of the control variable is affected by the fuel consumption map and emission maps of the engine.

3.4. Results of DP Based Control Strategy

The implemented DP algorithm produces Pareto optimal solutions for the cost function. Prior to running the DP algorithm weighting factors of the objective function should be determined. The weight selection procedure assumes that the solution set of the present work has a convex Pareto front [53]. The points of the Pareto front can be found by varying the weighting factors of the objective function. In the present study, 896 Pareto points were found by varying the weighting factors for the five objectives, i.e., gear shift, fuel, HC, CO and NOx. The sizes of the weighting factors are decided by comparing the cost incurred by each objective at each Pareto point except for the gear shift.
In the DP algorithm, gear shift command is a control variable and the optimization procedure identify the optimal gear position to reduce fuel consumption and exhaust emissions. However, each gear change increases the cost incurred by the gear shift objective. Therefore, lower the weightage of the gear shift objective, higher the frequency of gear shifting. Since there is no cost for changing gear positions, DP algorithm changes gears to reduce fuel consumption and emissions with no restrictions, resulting in a gear trajectory map with frequent shifting of gears. Since such a behavior is undesirable, the gear trajectory is observed with different weighting factors. Concurrently, the costs incurred by the remaining four objectives are observed to select the weighting factors for the study. Figure 9 shows the gear shift trajectory with a zero-weighting factor and the gear shift map for the selected Pareto point.
Figure 10 represents the relationship of the Pareto points with the four objectives, i.e., fuel, HC, CO and NOx via a parallel coordinate plot. In the parallel coordinate plot, the “crossing lines” indicate a conflict between the two adjacent objectives. The intensity or degree of conflict factor present can be determined by the number of crossed lines. Instead, lines that do not cross demonstrate objectives which are in relative harmony [54]. Figure 10 shows that fuel, HC and CO aims are in harmony compared to NOx. NOx emissions have a high degree of conflict with CO. For further investigation, the best and worst Pareto points for fuel, CO, HC and NOx are plotted in Figure 11a,b, respectively.
As shown in both Figure 11a,b, the Fuel consumption, HC and CO objectives are consistent, while NOx behaves in conflict. Fuel and HC have a low degree of conflict; the best Pareto points overlap and worst values are observed from the same Pareto point. In addition, both the best and worst Pareto points of CO and HC show a higher degree of harmony. In contrast, the best Pareto point of NOx has a higher cost for fuel, HC and CO. Similar trend can be observed with the worst Pareto point of NOx. Selected Pareto point overlaps with the best fuel, HC and CO Pareto points. With the selected Pareto point, compared to the best Pareto point of each objective, fuel, HC, CO and NOx increased by 3%, 32%, 15% and 37%, respectively.

4. Rule-Based Power Management Strategy

The DP algorithm is based on knowing future drive cycle characteristics, but in a real-world implementation, the drive cycle is unknown. In addition, the DP procedure requires higher computational power to solve the energy management problem. However, the DP results can be used to design a power management strategy based on empirical rules. A rule-based control strategy is computationally effective for an embedded control system of a hybrid electric three-wheeler. However, the implemented rule-based strategy can generate driving patterns that may not be optimal, especially when the vehicle is operated outside the drive cycle characteristics to which the control strategy is optimized. In this section results obtained from the DP algorithm, are used to extract rules for a sub-optimal rule-based strategy. This approach, already known in the literature, is used to design a computationally effective rule-based supervisory power management strategy to operate a hybrid electric three-wheeler efficiently during real vehicle driving conditions. [15,19,24,25] used a similar methodology.

4.1. Rule Extraction from DP Based Control Strategy

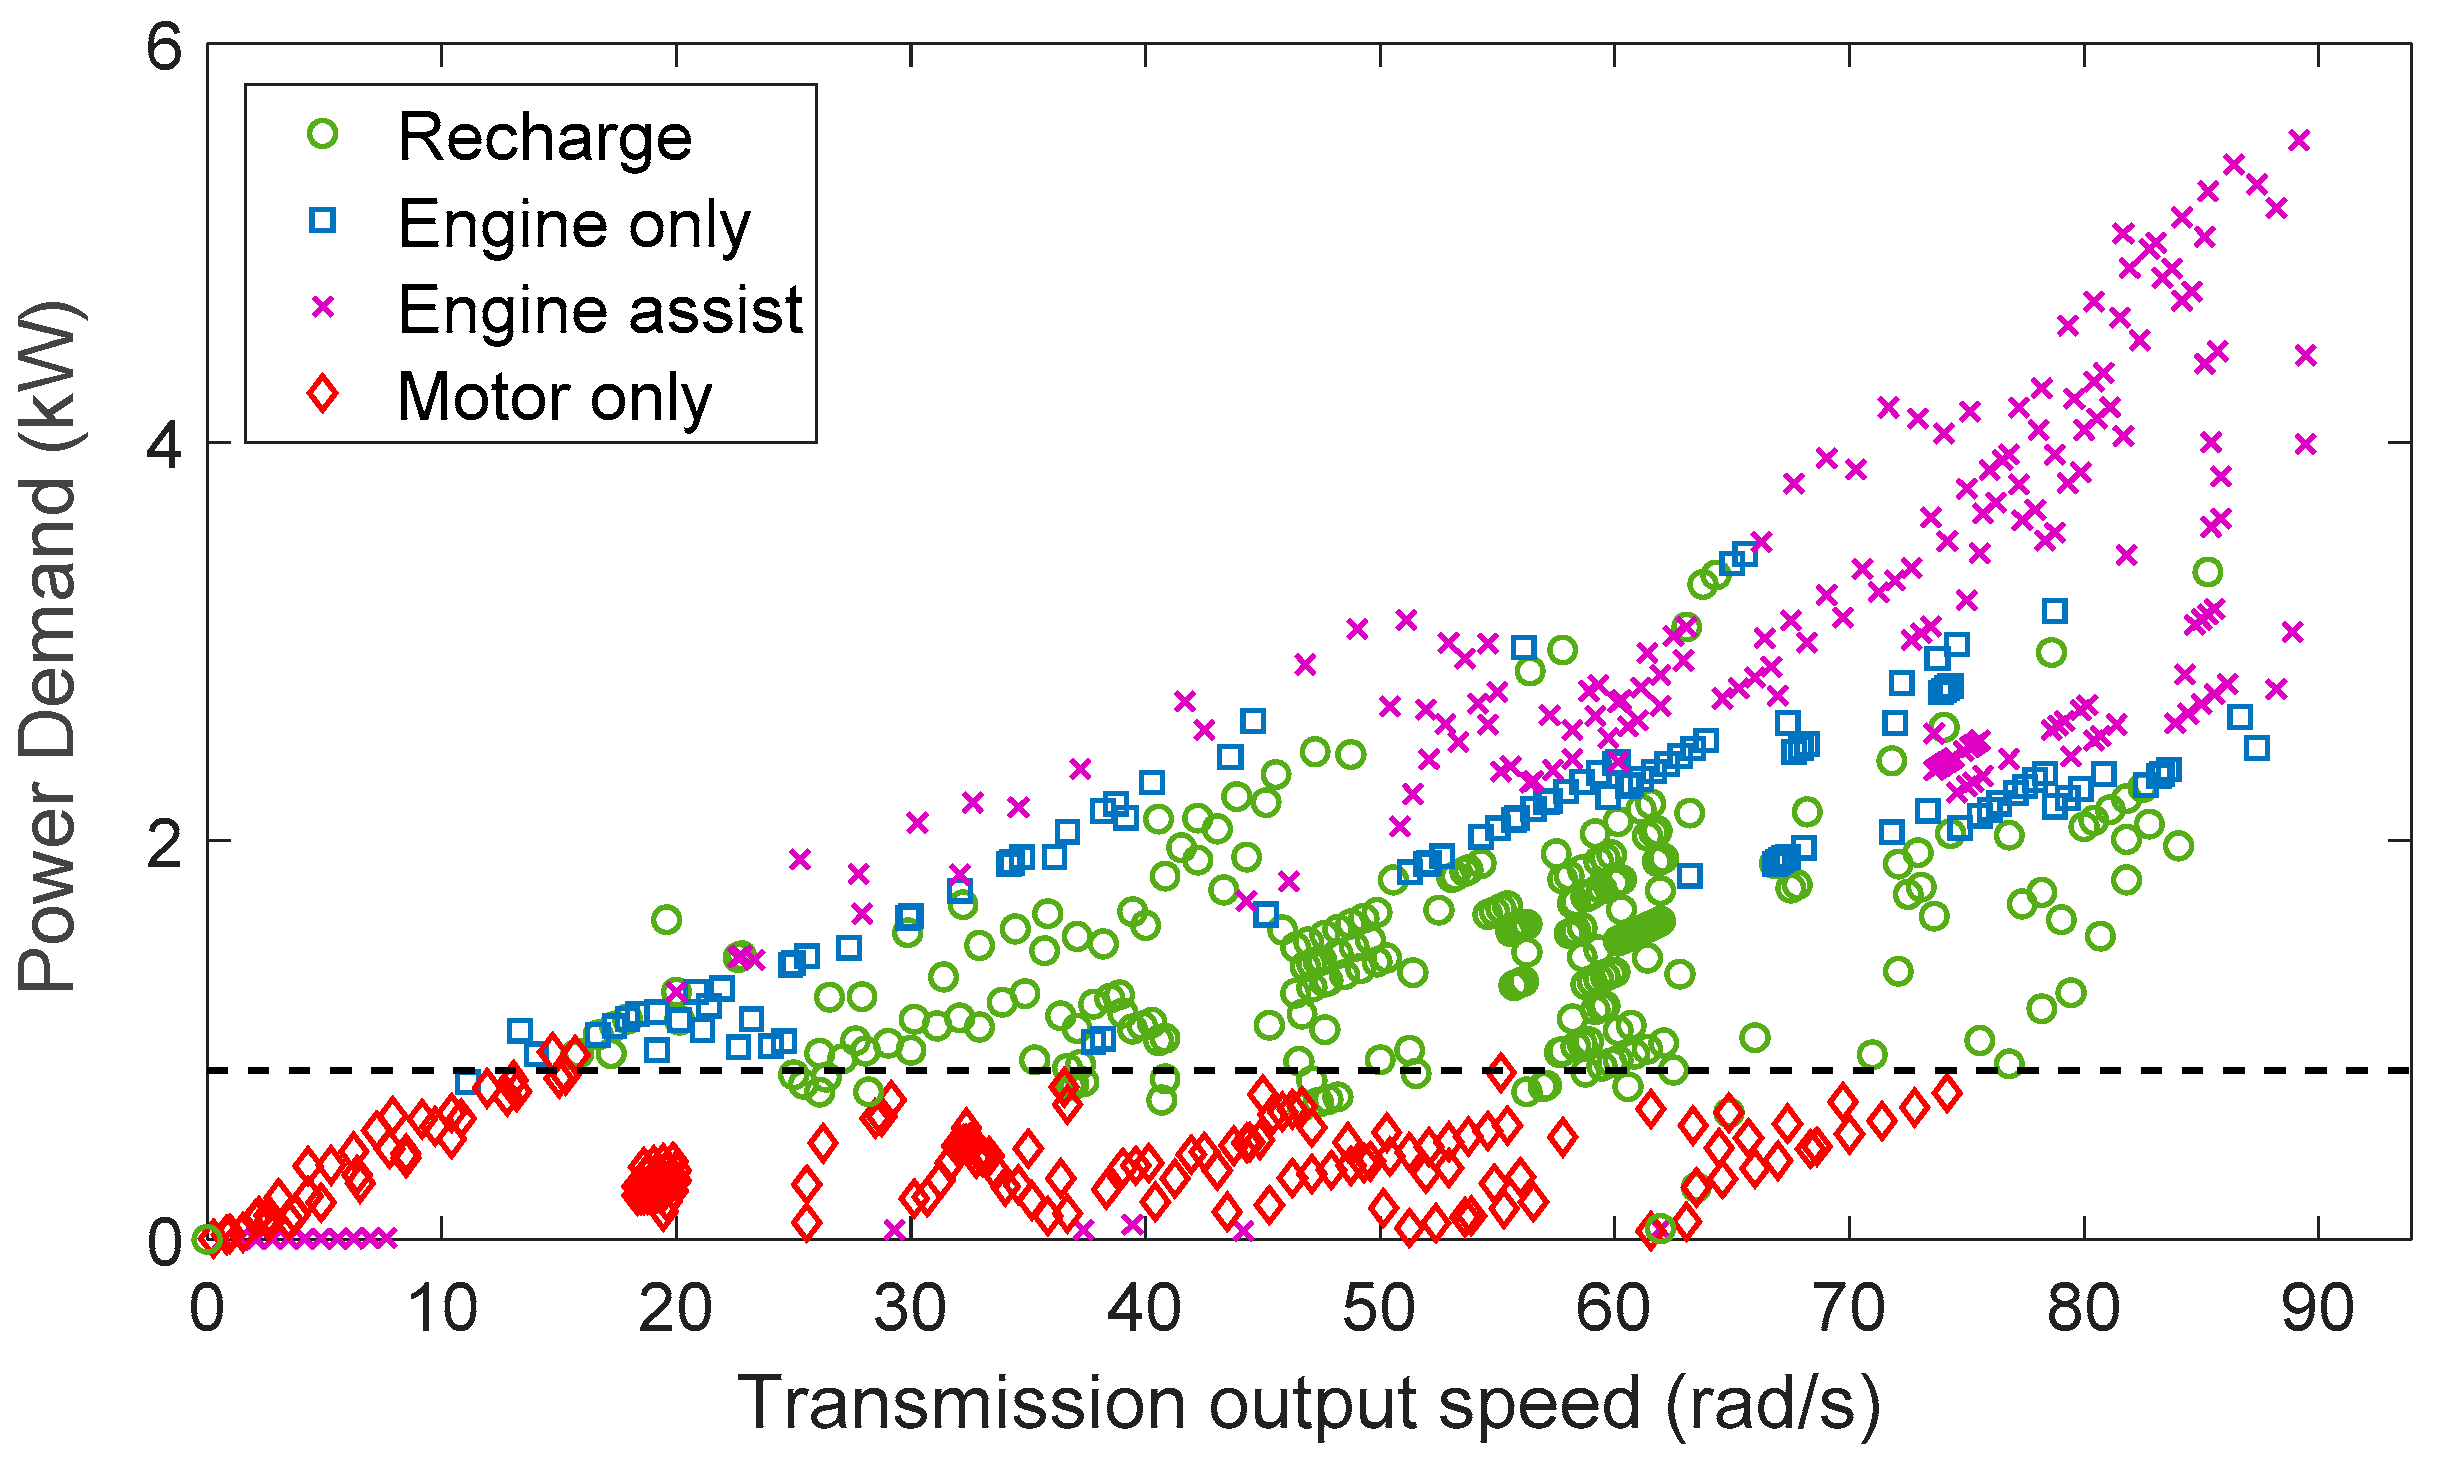
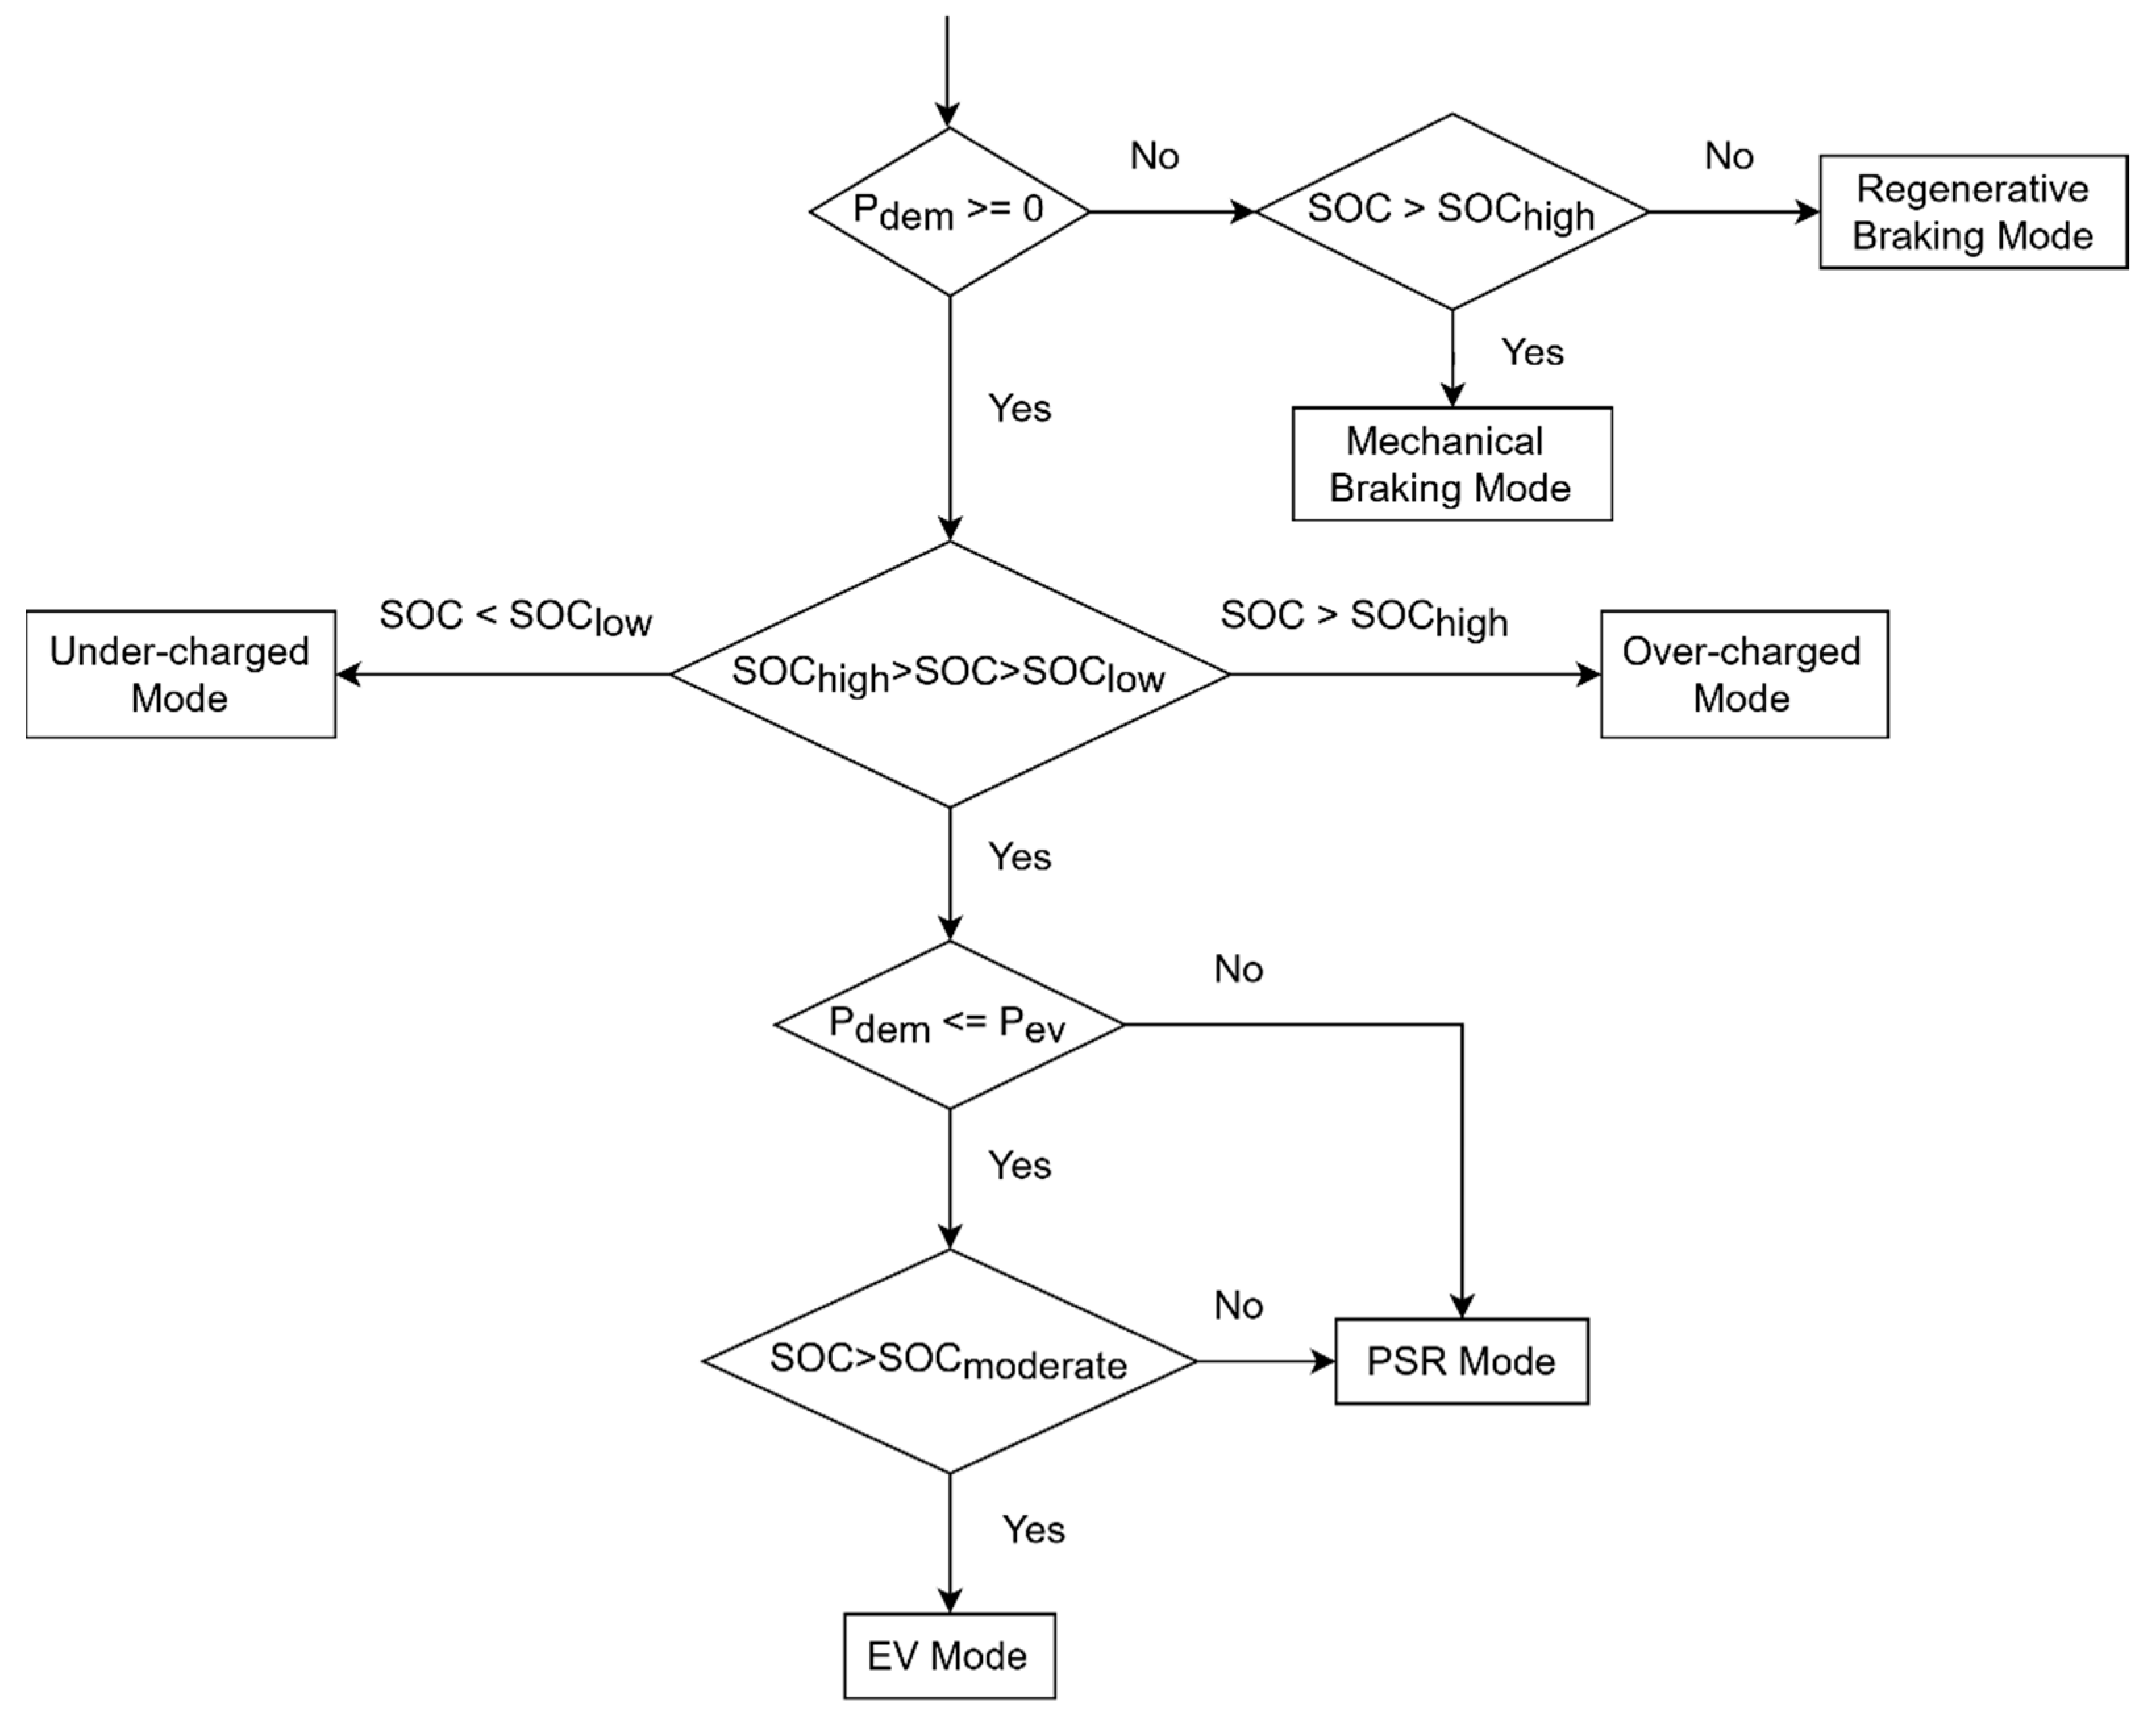
4.1.1. Power Configuration Selection Strategy

The power configuration of the powertrain determines the energy flow direction and operating status of the main powertrain components according to the power demand from the driver. When power demand is positive, the powertrain of a hybrid electric vehicle can operate under two main configurations. First, motor only or EV configuration, the engine is turned off and the vehicle is propelled by the motor alone. Secondly, parallel hybrid configuration. Three power flow methods are present in the parallel hybrid configuration. First, the engine assist, the engine and motor are used to meet the power demand. Secondly, engine only, the vehicle is propelled by the engine alone. Finally, recharge, the engine is operated at a higher point than the power demand. Excess power is stored in the battery by operating the motor as a generator. Figure 12 shows the different power flow methods selected by the DP algorithm as a relationship of total power demand and transmission output speed of the powertrain.
DP results show that a clear distinction is absent between recharging, engine only and parallel hybrid methods. However, between motor only and parallel hybrid configurations, a clear distinction is present. Below the power demand threshold shown by the black dashed line, DP algorithm gives priority to EV mode or motor only configuration. Results show a power demand threshold to select EV mode for the sub-optimal rule-based control strategy can be found using the power demand map of DP results.

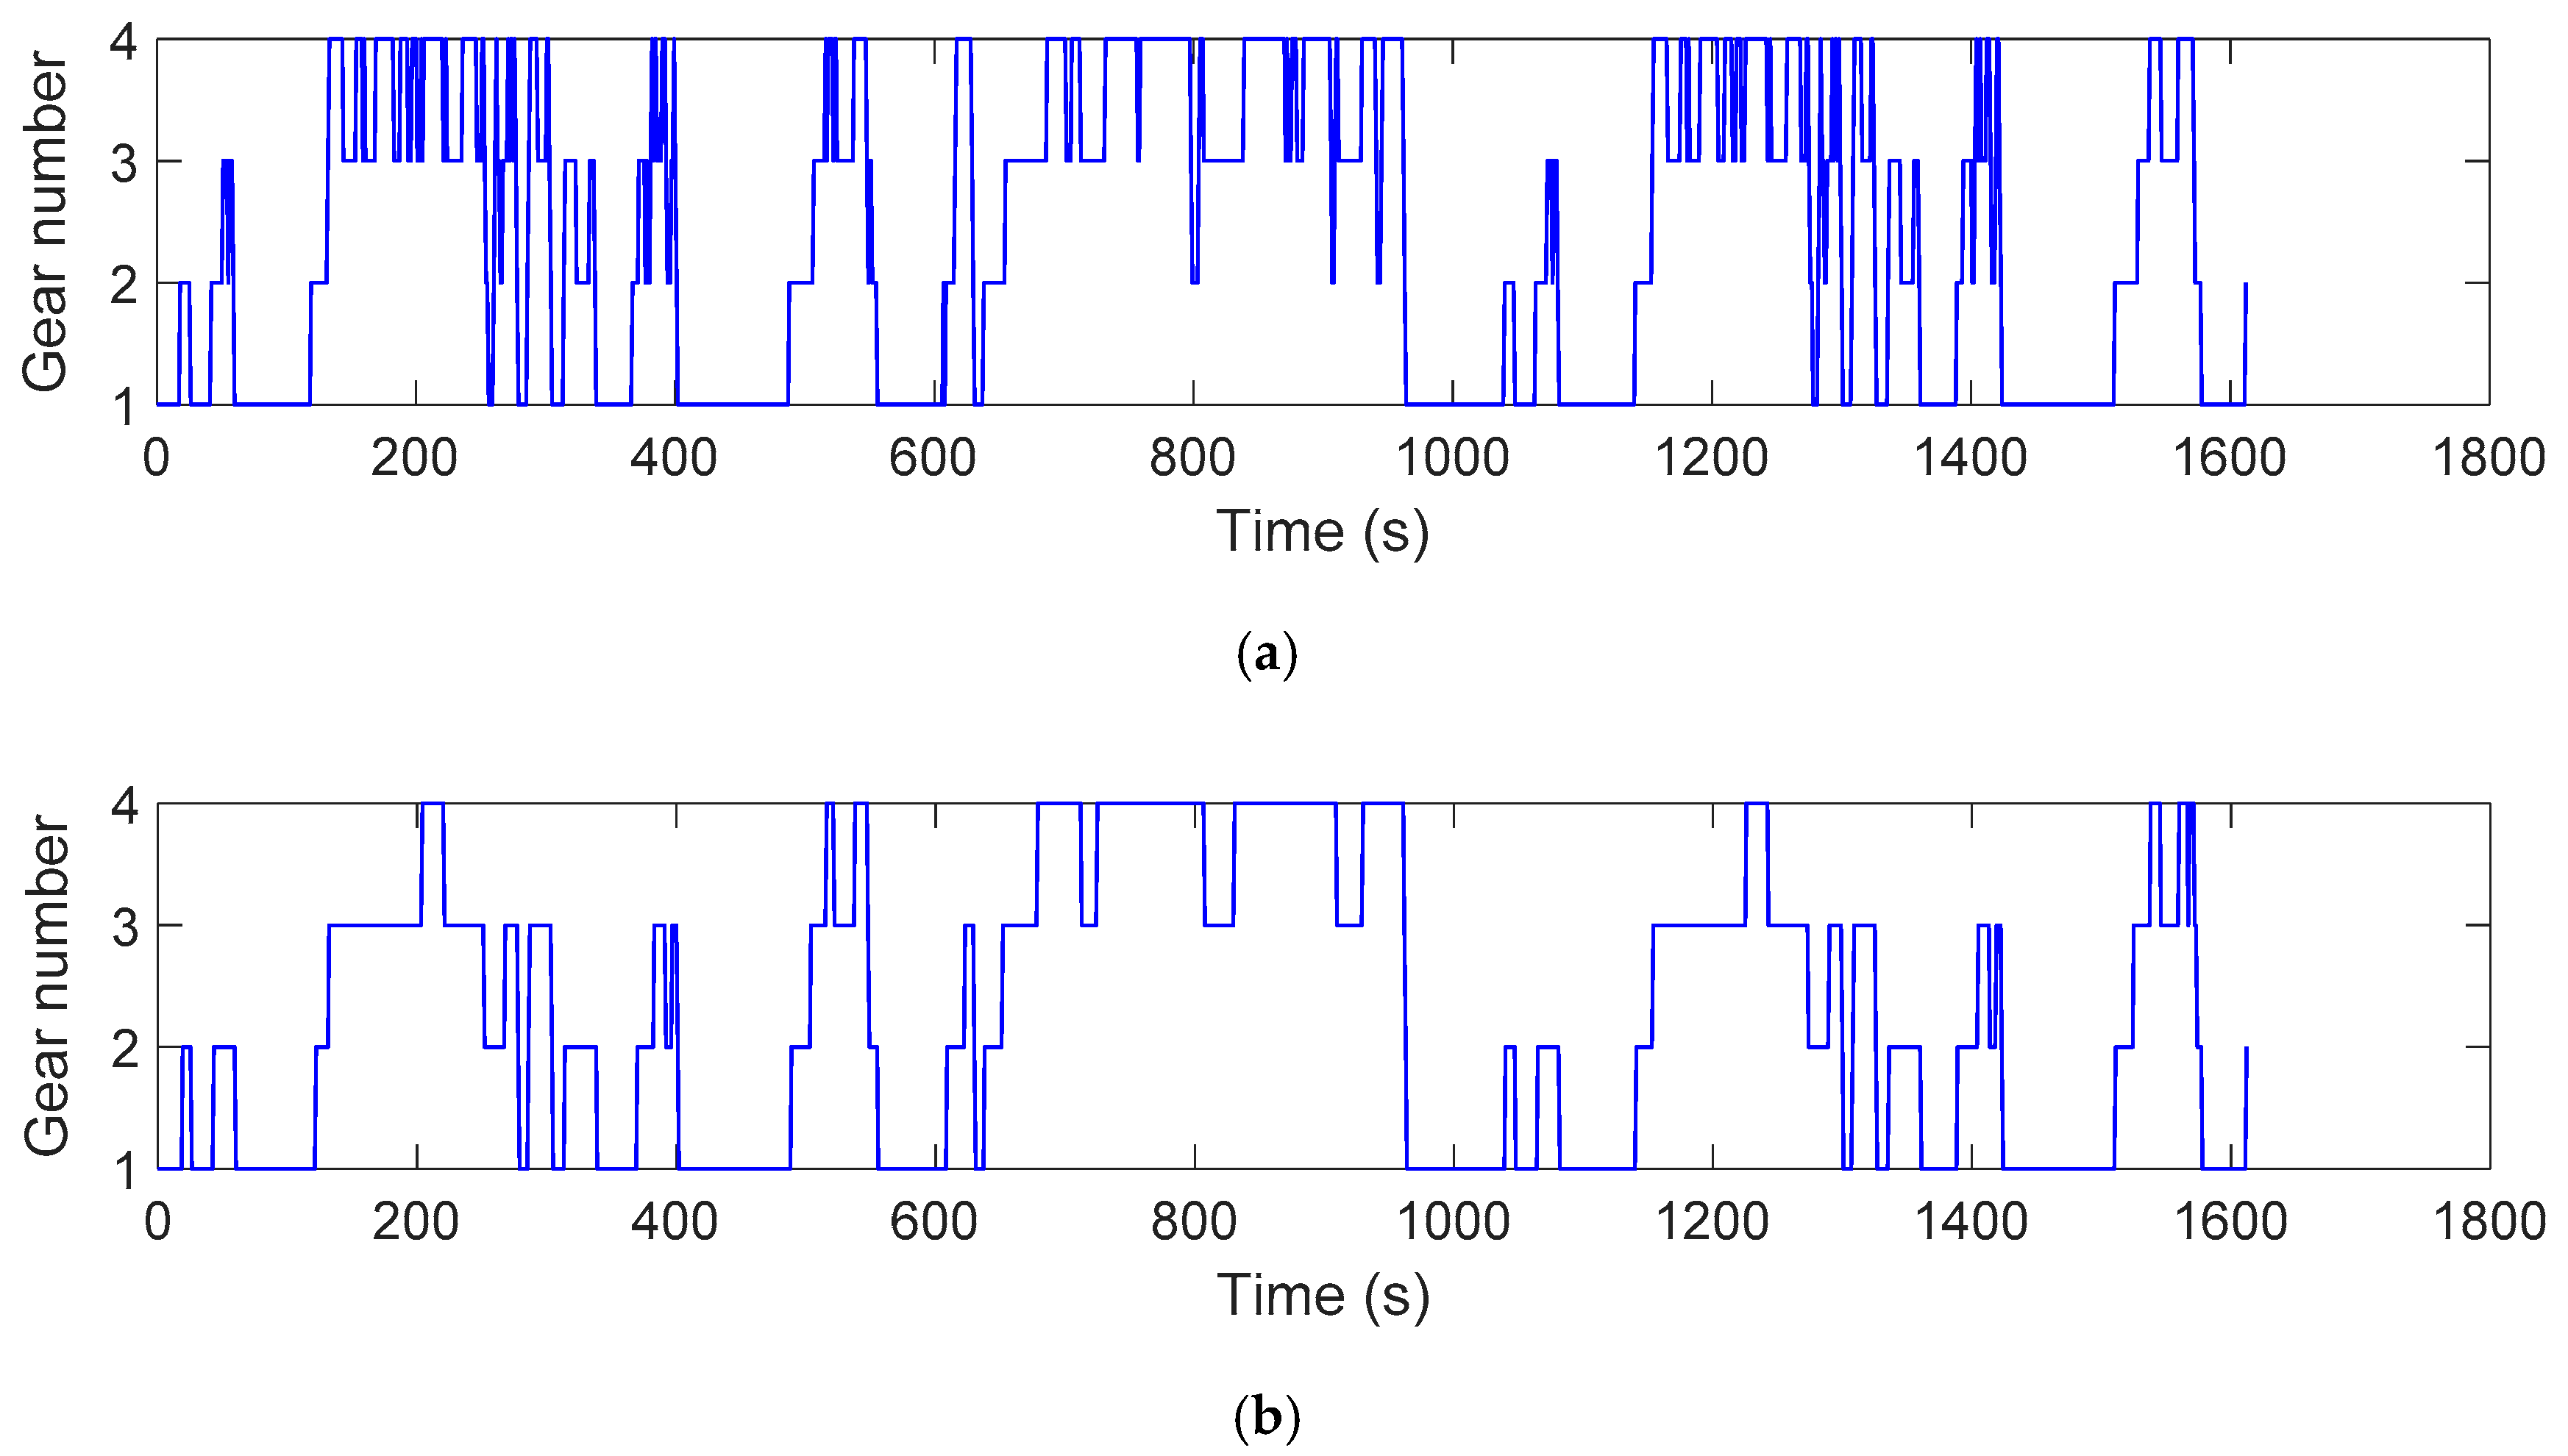
4.1.2. Gear Shift Logic

Determining the gear shift schedule of the transmission is paramount for efficient control of the internal combustion engine. For a parallel hybrid powertrain, it is harder to obtain an efficient gear shift map using traditional methodologies. Therefore, the DP algorithm is used to determine the gear shift strategy. As mentioned above, in the DP procedure gear shift command is given as a control input to the powertrain model. Figure 13 shows the gear shift strategy from the DP optimization results as a relationship between transmission output speed, engine power demand and gear number.
From the gear shift map of the DP results, four different regions can be found for each gear position. The boundaries between the regions can be used to determine gear shifting thresholds. Thresholds between each gear position are used to develop a gear shift map for the sub-optimal rule-based strategy. To avoid continuous shifting between gears, a hysteresis function is added to the shifting thresholds. Red solid lines and blue dashed lines show the up-shift and down-shift gear maps, respectively, for the proposed rule-based strategy.

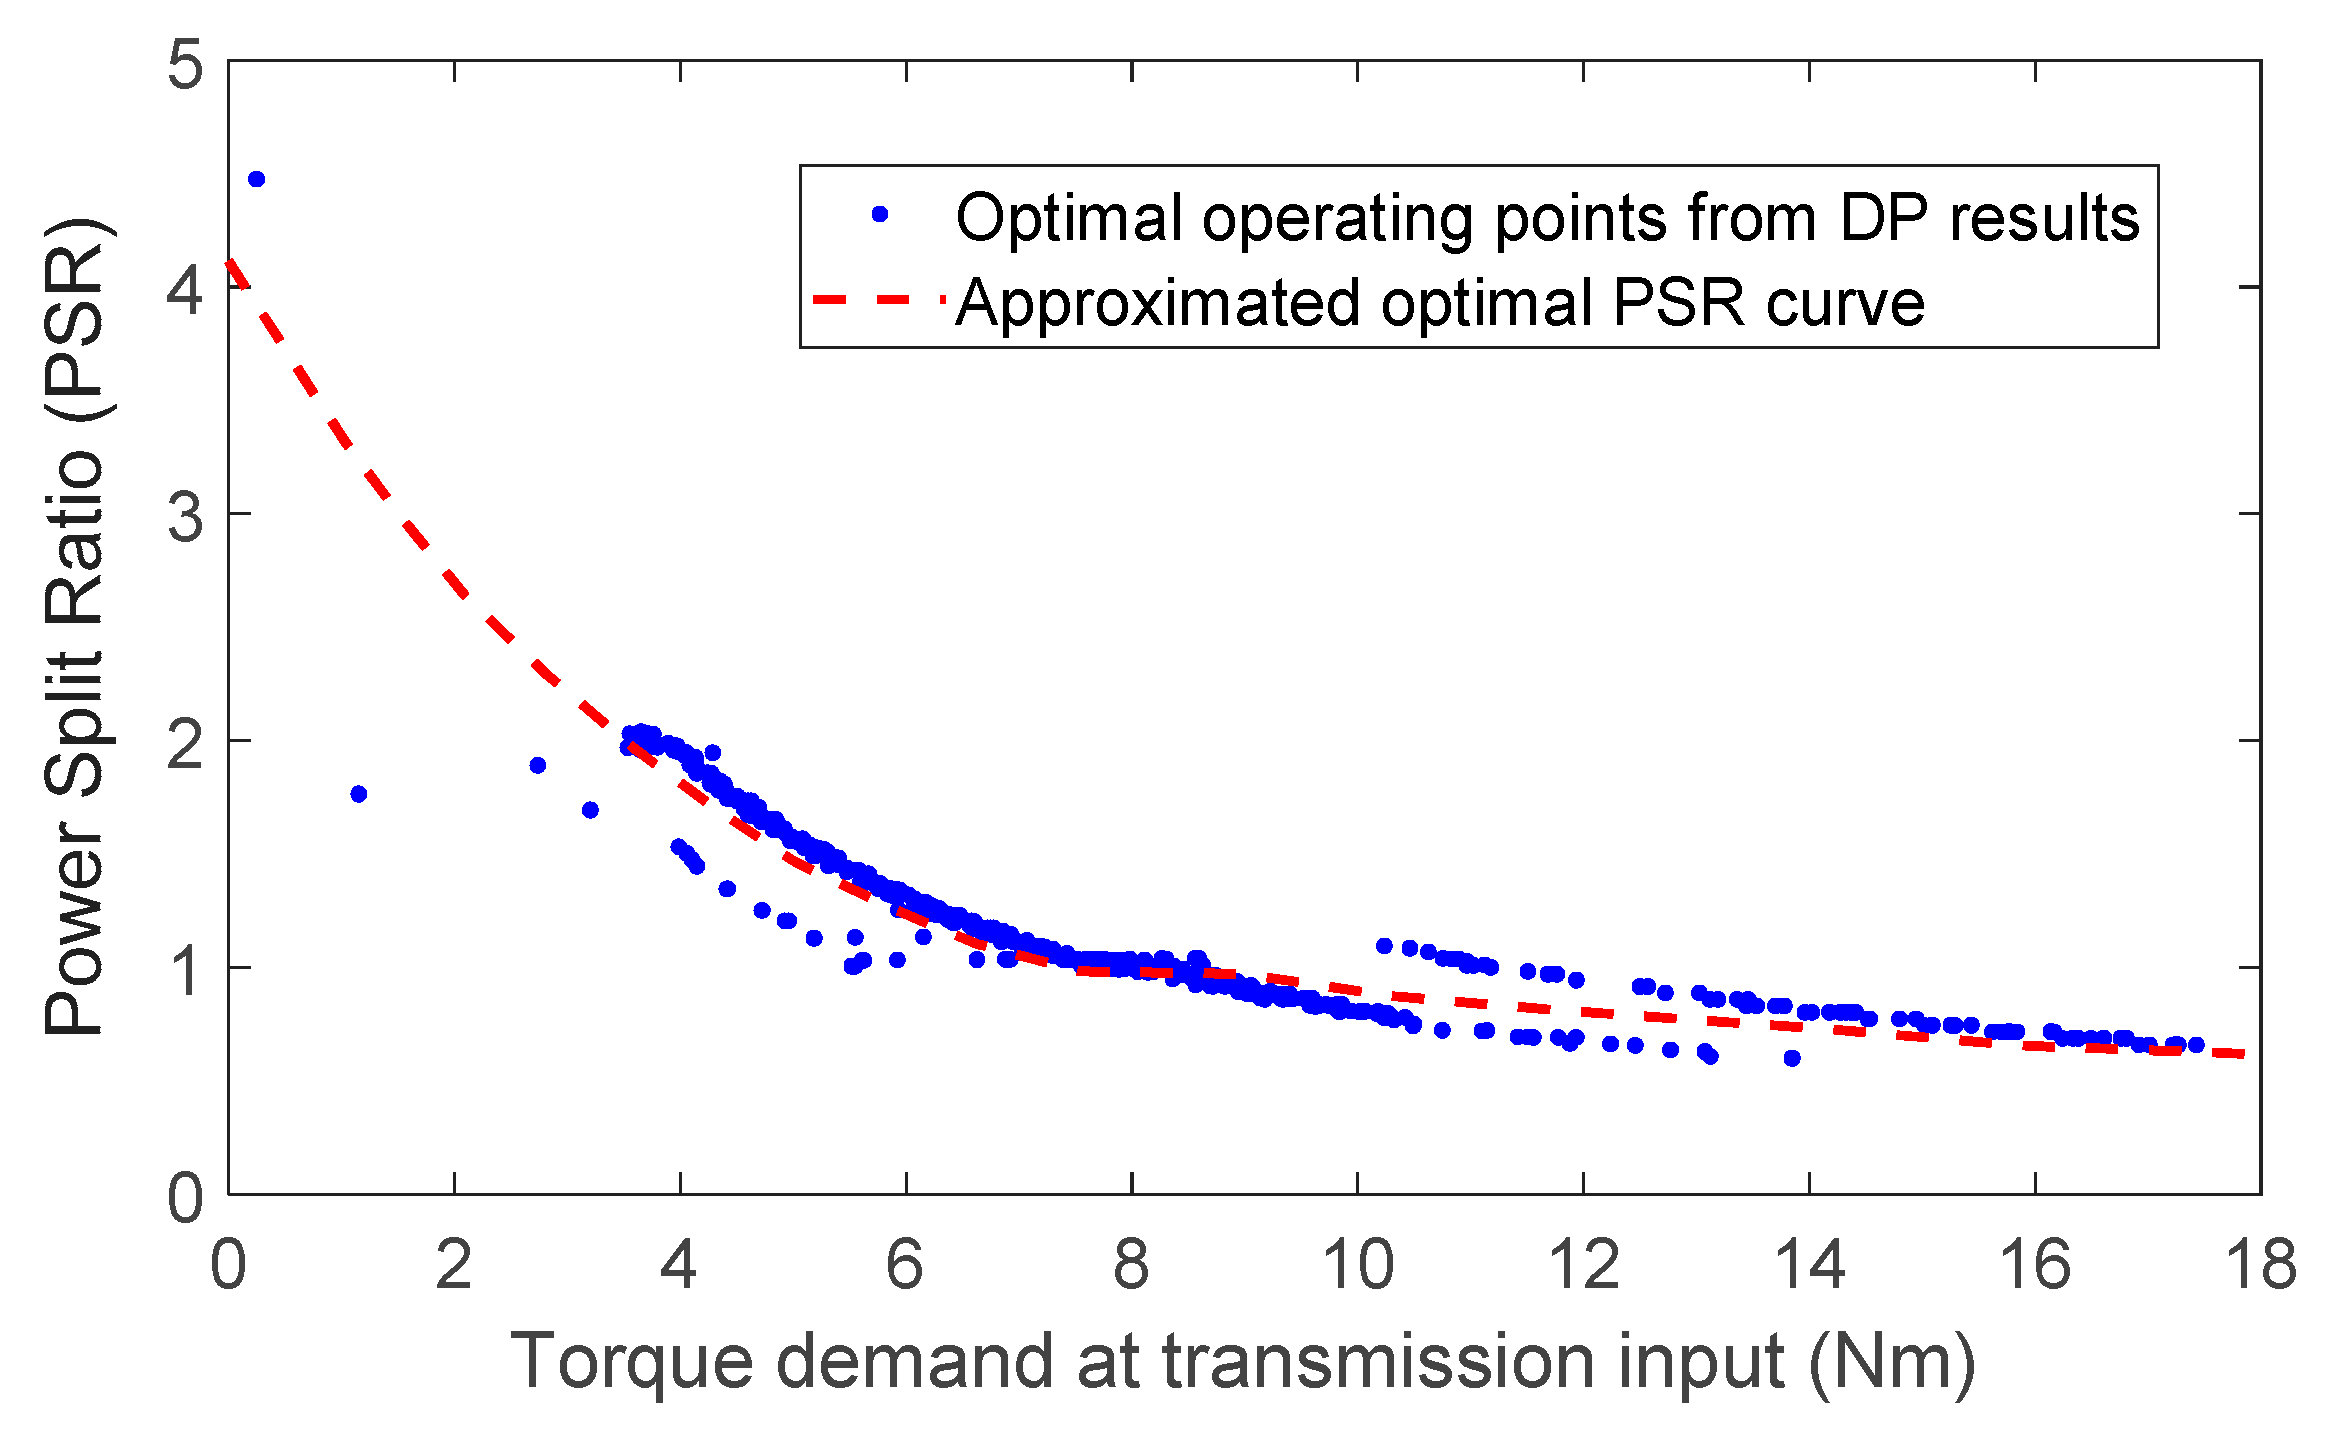
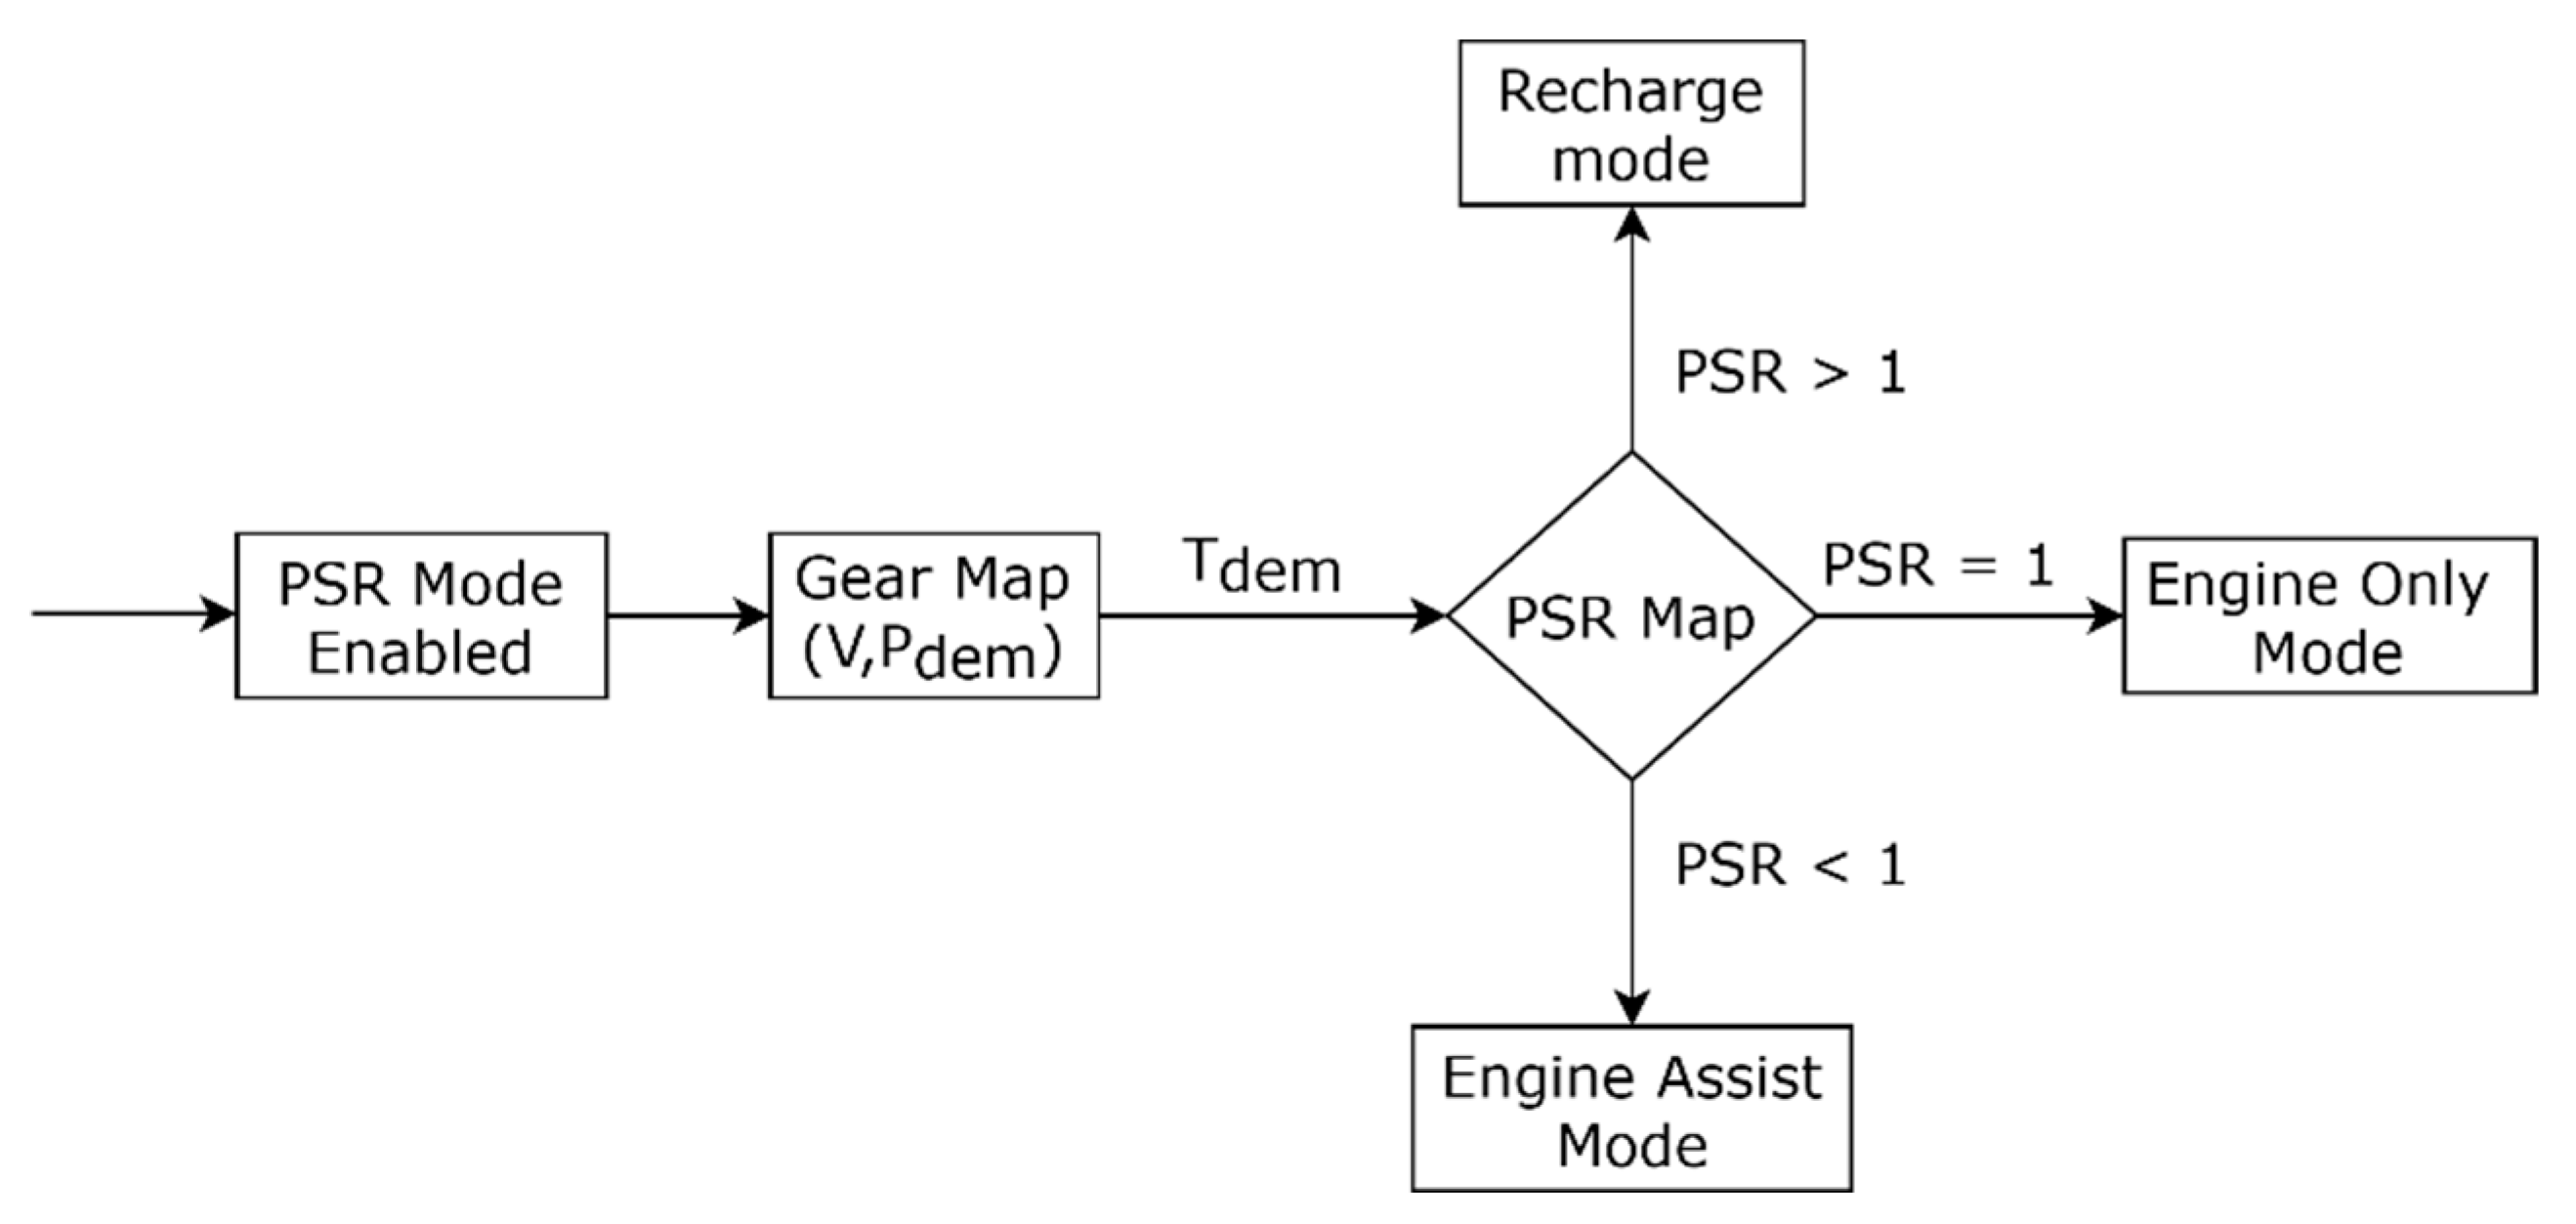
4.1.3. Power Split Logic

During hybrid configuration, motor and engine both operate in harmony. DP results are studied to understand the power split strategy between the power sources. To quantify the power flow from the powertrain components, i.e., motor and engine, a Power Split Ratio (PSR) is defined as,
P S R = P e n g / P d e m
where P e n g is the power demanded from the engine and P d e m is the total power demanded at the transmission input of the powertrain. During vehicle operation, four distinct powertrain operating modes can be found through power split ratio:
  • PSR = 0, only the motor provides the demanded power (EV mode);
  • PSR = 1, only the engine provides the demanded power (engine only mode);
  • 0 < PSR < 1, both engine and motor provide the demanded power (engine assist mode);
  • PSR > 1, the engine provides surplus power and motor acts as a generator (recharge mode).
The engine operating points from the DP results is represented in Figure 14 as a relationship between the transmission input speed and power split ratio.
PSR map shows that engine operating points from DP results can be approximated. The red dashed line in the above figure shows the approximated PSR curve. The approximated PSR curve is used in the proposed sub-optimal rule-based strategy to determine the power split between engine and motor. Mathematical expression for the approximated PSR curve is defined as,
f ( x ) = 0.0027 x 3 + 0.0769 x 2 0.845 x + 4.1139 ,         T < 7.5 f ( x ) = 1 ,                                                                                 7.5 T 9 f ( x ) = 0.0002 x 3 + 0.0055 x 2 0.0909 x + 1.0484 ,         T > 9
where T is the torque demand at transmission input. Note that similar to [23], PSR approximated line can be replaced with an optimal torque map. Where the relationship between the engine power demand is plotted with total power demand and transmission input speed to form optimal engine power surfaces. This method uses the transmission input speed axis for a better approximation of DP results.

4.2. Proposed Rule-Based Strategy

The extracted results from DP data indicate that power demand map, which determines PEV (power demand boundary between EV and parallel configurations) and the gear shift map contribute significantly to achieve an efficient power management logic in the hybrid electric vehicle. However, the PSR map approximation method is not a universal procedure for the power split strategy. The PSR method does not consider the battery SoC level when deciding the power contribution and operational mode of the power sources, i.e., motor and the engine. This could lead to a scenario where battery is depleted or overcharged than the recommended levels. Therefore, additional empirical rules should be determined to prevent the battery from depleting or overcharging. Note that alternative approaches to link power split strategy with battery SoC are already known in the literature. For example, Lin et al. [24] use a neural network approach and Biasini et al. in [15] use a penalty function to change the motor to power demand ratio with battery SoC level.
The logic of the DP based; sub-optimal power management strategy proposed for the hybrid electric three-wheeler is summarized in Figure 15.
Six main control modes are used for the proposed strategy. Depending on the battery SoC level and power demand, different modes are used to control the power flow. PSR mode propels the vehicle using both motor and engine in harmony. The power ratio is determined using the PSR map. For the charge sustaining policy, which assures that the SoC level is kept within predetermined levels, two SoC bounds are defined as SoClow and SoChigh. In addition, a third SoC level is predetermined as SoCmoderate to give priority to PSR mode. SoC thresholds are defined with a hysteresis function to avoid frequent shifting between different modes. Under charged and over-charged modes are used to ensure that SoC levels are kept within defined boundaries. During under-charged mode, priority is given to the IC engine and motor is operated as a generator. In contrast, during over-charged mode priority is given to the motor to propel the vehicle. EV mode is only used if SoC level is higher than SoCmoderate and power demand is below PEV values. In EV mode, vehicle is propelled by the motor alone. PSR mode is selected if SoC value is below SoCmoderate but above SoClow. If the power demand is negative, regenerative braking is applied. However, if the maximum brake torque supplied by the motor is below the torque demanded, additional torque is supplied by the mechanical brake system. In addition, if the SoC level is higher than SoChigh, only the mechanical brakes are used to decelerate the vehicle.
Core design parameters from the DP results used for the rule-based strategy are power demand map, which determines P EV, gear shift map, which determines the gear shift strategy and PSR map, which determine power split strategy between the motor and engine. The selection of EV/PSR mode, gear shift and PSR decisions are determined sequentially because PSR command decision requires the knowledge of torque demand and speed at the transmission input of the powertrain. These parameters can only be calculated after determining the gear position. Figure 16 summarizes the logic proposed for the PSR mode.
Gear shift strategy during vehicle operation is crucial to improve overall powertrain efficiency. Under the proposed control strategy if the vehicle is operated by both engine and motor or by engine alone the gear shift strategy adopted from the DP results is used. However, this strategy cannot be used during EV mode or regenerative braking mode. The procedure to derive an effective gearbox strategy for these modes is already known in the literature [55]. In the present work, the heuristic method proposed by Zhu at el in [56], is used to develop the gear shift strategy during regenerative braking and EV modes of the vehicle. To achieve a desirable gear shift strategy, maximum torque curve of the motor and motor efficiency characteristics are considered.

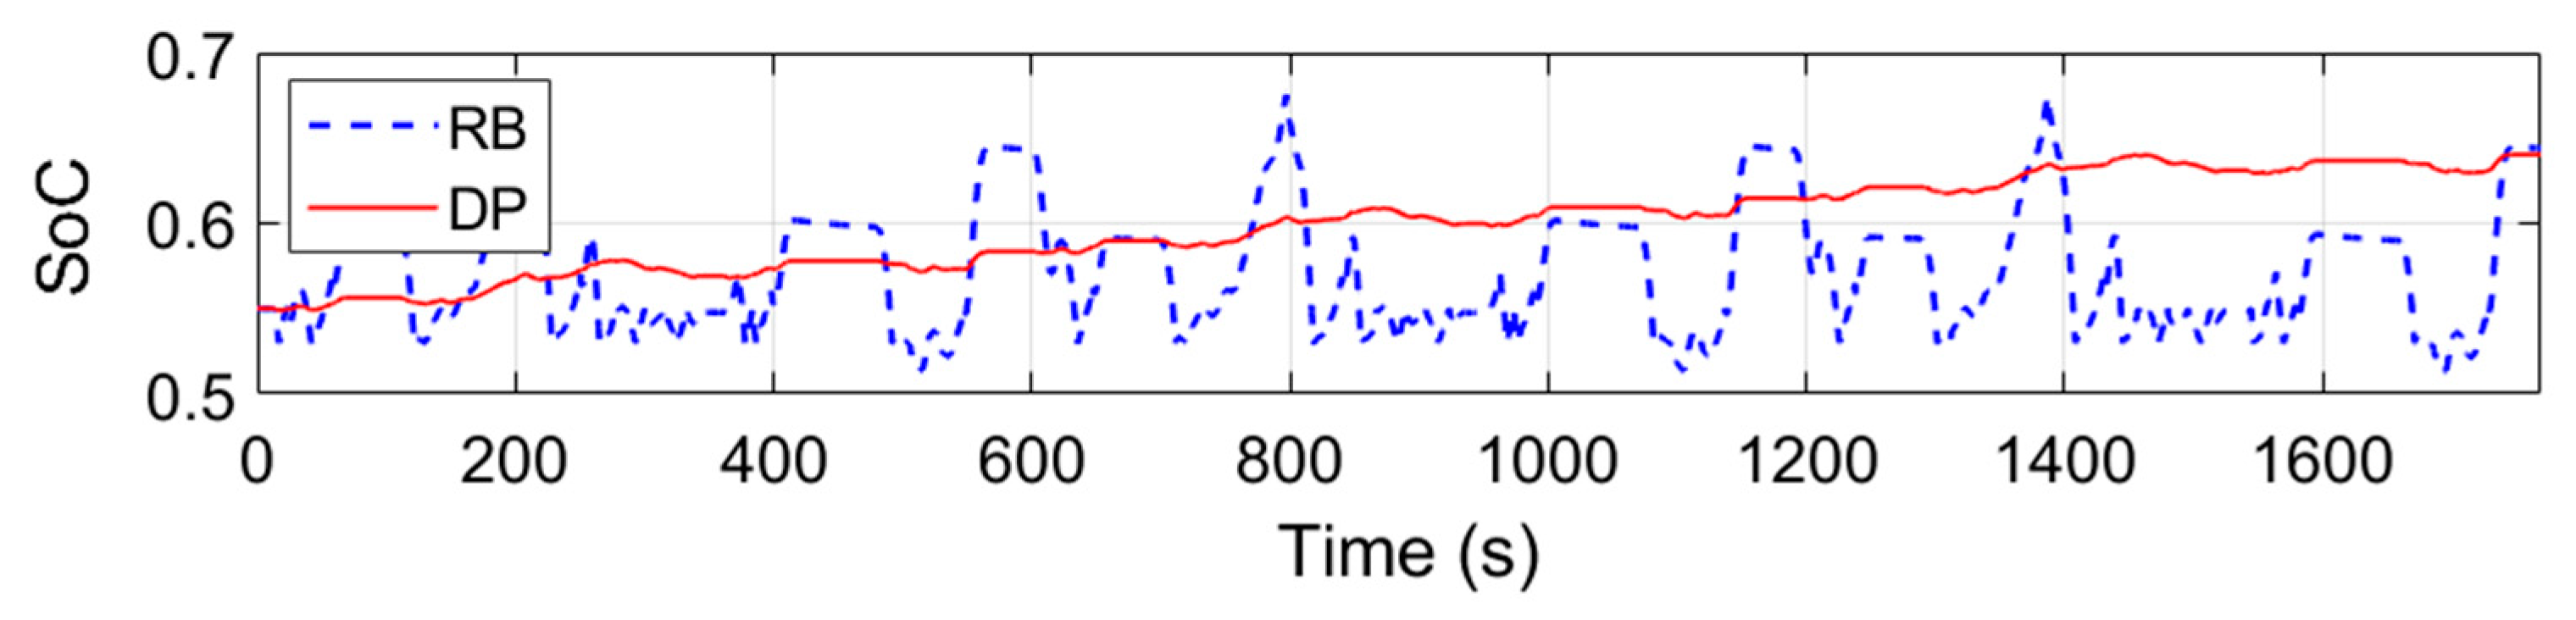
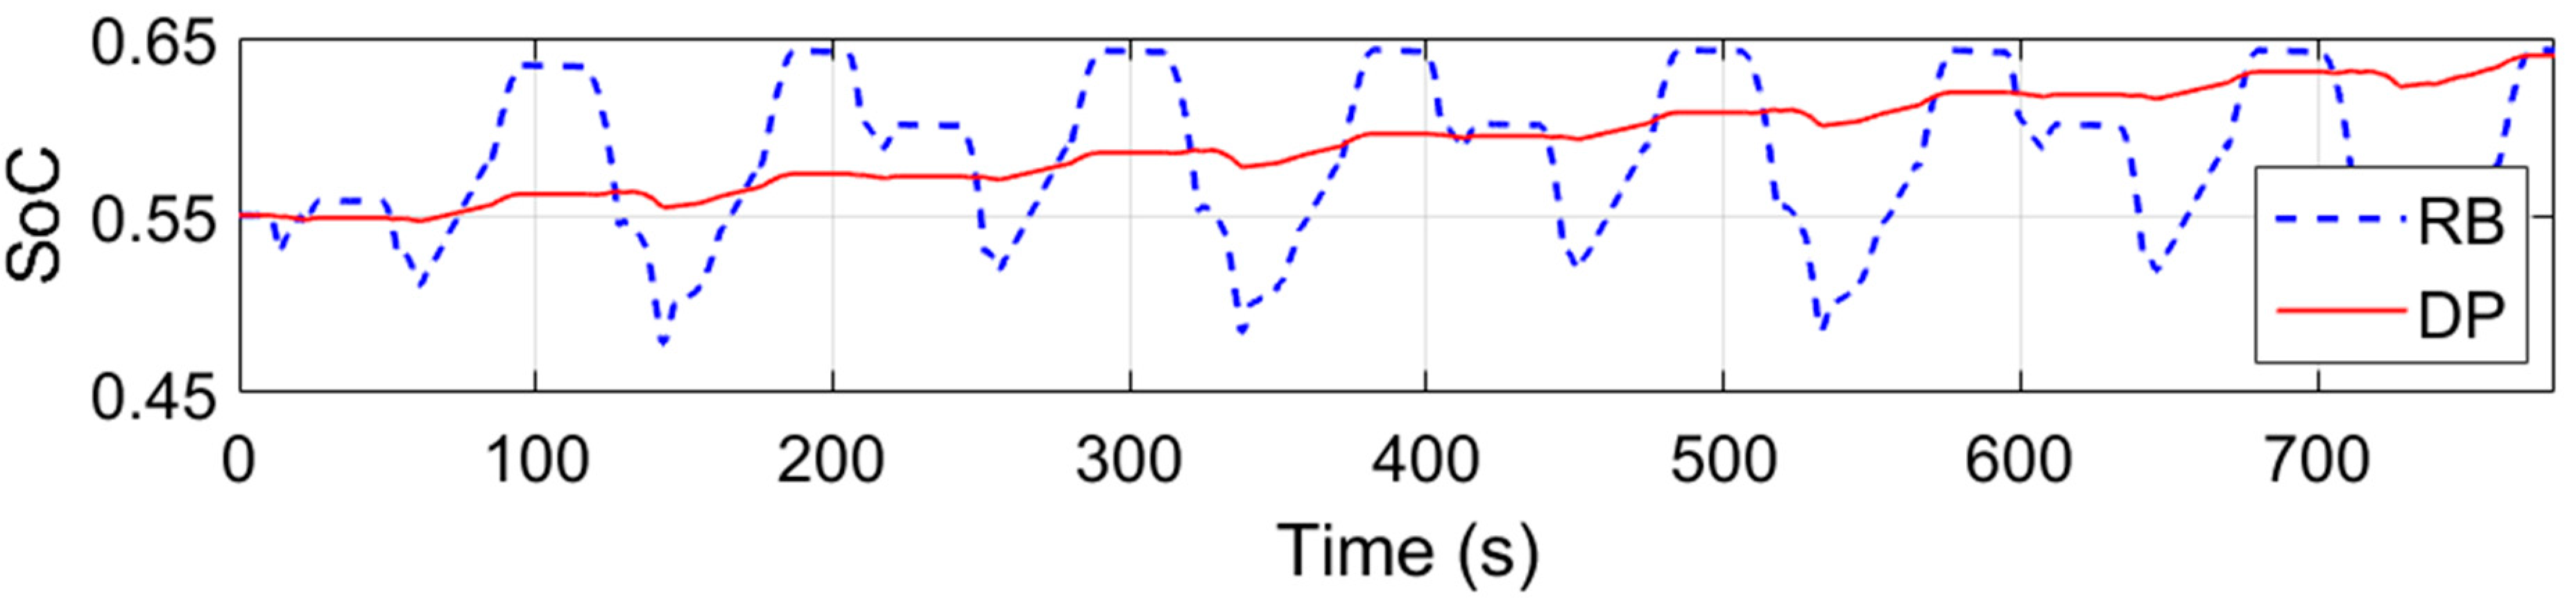
4.3. Comparison of Proposed Rule-Based and DP Based Control Strategy

The sub-optimal rule-based power management strategy developed above is integrated into the implemented forward-facing quasi-static model. The results obtained from the DP results are compared with the simulation results of the forward-facing model. For both control strategies starting SoC is taken as 0.55. The Worldwide Harmonized Light Vehicles Test Cycle (WLTC) class 1 cycle and the New European Drive Cycle (NEDC) is selected for the simulation experiment. In addition, the vehicle is loaded to simulate the weight of the driver and two passengers. Note that DP and rule-based (RB) strategies are simulated in two different models (i.e., backward-facing and forward-facing models). A comparison of the models is presented in Section 2.2. Since the cumulative energy bought to the wheels in the two models are different, certain errors can be introduced to the validation results.
Depending on the power to mass ratio and maximum speed of the testing vehicle, the WLTC test cycle is selected. Three-wheelers fall into class 1 category established for vehicles with the power to mass ratio below or equal to 22 W/kg. Test cycle includes three-speed phases, i.e., low, medium and low speed. In general, three-wheelers operate at low speeds. For instance, the maximum legal speed limit for three-wheelers for all roads in Sri Lanka is only 40 km/h [57] and the maximum speed of the 2019 Bajaj RE 4 s model (IC engine three-wheeler) is only 65 km/h [58]. Since maximum speed of the test vehicle is below the WLTC class 1 test exception limit of 70 km/h, the medium speed section of the WLTC is replaced with a low-speed section. The used WLTC class 1 drive cycle is represented in Figure 17.
The WLTC test cycle has a maximum speed of 49.1 km/h and an average speed without stops of 27.6 km/h. Overall results for the drive cycle are affected by the operating time of each control mode, i.e., EV, PSR, under-charged, over-charge, regenerative braking and mechanical braking. During the simulation, the rule-based strategy uses the EV mode for 43% and PSR mode for 42% of the time. Which contributes to 85% of the complete test. The regenerative mode was used for 15% of the time. Under-charged, over-charged, or mechanical braking modes are not used. Table 3 summarizes fuel and emission level change with the RB control strategy (sub-optimal rule-based strategy) compared to the DP results.
Figure 18 represents the SoC trajectory of the control strategies (i.e., RB and DP). Final SoC value difference is 0.004.
To gauge the performance of the proposed rule-based strategy on a never-seen-before drive cycle, both DP and proposed RB strategies are simulated with the Urban Drive Cycle (UDC) segments of the NEDC. Although NEDC is replaced by the WLTC, still in countries such as Sri Lanka NEDC drive cycle is used in emission standards for petrol light-duty vehicles [59]. In the present study, a modified NEDC is used due to the low power characteristics of three-wheelers. Extra urban driving cycle (EUDC) segment of the NEDC drive cycle consists of a maximum speed of 120 km/h and average speed (without stops) of 69 km/h; therefore, this drive cycle segment has been excluded from the simulation. UDC-NEDC drive cycle has a maximum speed of 50 km/h and average speed (without stops) of 26 km/h. The used UDC-NEDC drive cycle is represented in Figure 19.
During the simulation, the rule-based strategy used the PSR mode for 34% and EV mode for 45% of the time. Regenerative mode and under-charged mode are used for 19% and 3% of the time, respectively. Remaining modes are not used. Table 4 summarizes fuel and emission level change with the proposed rule-based strategy compared to the DP results.
Figure 20 represents the SoC trajectory of the control strategies (i.e., RB and DP). Final SoC value difference is 0.003.
To gauge the performance of the control strategy developed in real-life cycles, results are simulated in “Malabe” cycle from [14]. The “Malabe” real-life cycle is shown in Figure 21.
During the simulation, the rule-based strategy used the PSR mode for 50% and EV mode for 39% of the time. Regenerative mode and over-charged mode are used for 6% and 5% of the time, respectively. Remaining modes are not used. Table 5 summarizes fuel and emission level change with the proposed rule-based control strategy compared to the DP results.
Figure 22 represents the SoC trajectory of the control strategies (i.e., RB and DP). Final SoC value difference is 0.003.
The ADVISOR parallel hybrid three-wheeler model and conventional powertrain model (internal combustion engine (ICE) based) developed in [14] are simulated over “Malabe” cycle with the same parameters of the present study and fuel consumption results of the DP and proposed rule-based strategy are compared. Findings show that compared to the conventional (ICE-based) powertrain, fuel consumption of the parallel hybrid power train reduced 37.4% with ADIVISOR unoptimized strategy, 52.9% with the proposed optimized rule-base strategy and 57.0% with the DP.
The present work reveals a methodology to establish an easy-to-implement, near-optimal and real-time control strategy for parallel hybrid electric three-wheelers. However, additional studies are necessary to investigate the performance of the proposed strategy in real-life conditions. The simulation models are developed with simplified models with ADVISOR maps and data. Therefore, extensive studies on evaluating the control strategy on detailed simulation models including dynamic characteristics of the powertrain models and hardware-in-loop experiments should follow this study. Furthermore, the role of uncertainty in the performance of the proposed strategy could be realized in a future study by investigating the sensitivity of the control parameters used.

5. Conclusions

In this article, a rule-based power management strategy that is based on an optimal control strategy was designed for a pre-transmission parallel hybrid electric three-wheeler through a sequential design methodology. The optimal control strategy (DP based) was simulated in a backward-facing model to optimize fuel consumption, emissions (i.e., HC, CO and NOx) and gear shift frequency. Results from the DP based control strategy were used to extract rules to develop a sub-optimal rule-based algorithm. The proposed rule-based strategy was assessed with a forward-facing model of the hybrid electric three-wheeler. The main conclusions are as follows:
  • Numerical issues were observed during the DP optimization procedure. Thus, the effect of discretization resolution of the state and control variables were investigated. Results show that computational effort and accuracy of the optimal result from the DP optimization procedure increase with higher discretization resolutions of the state and control variables.
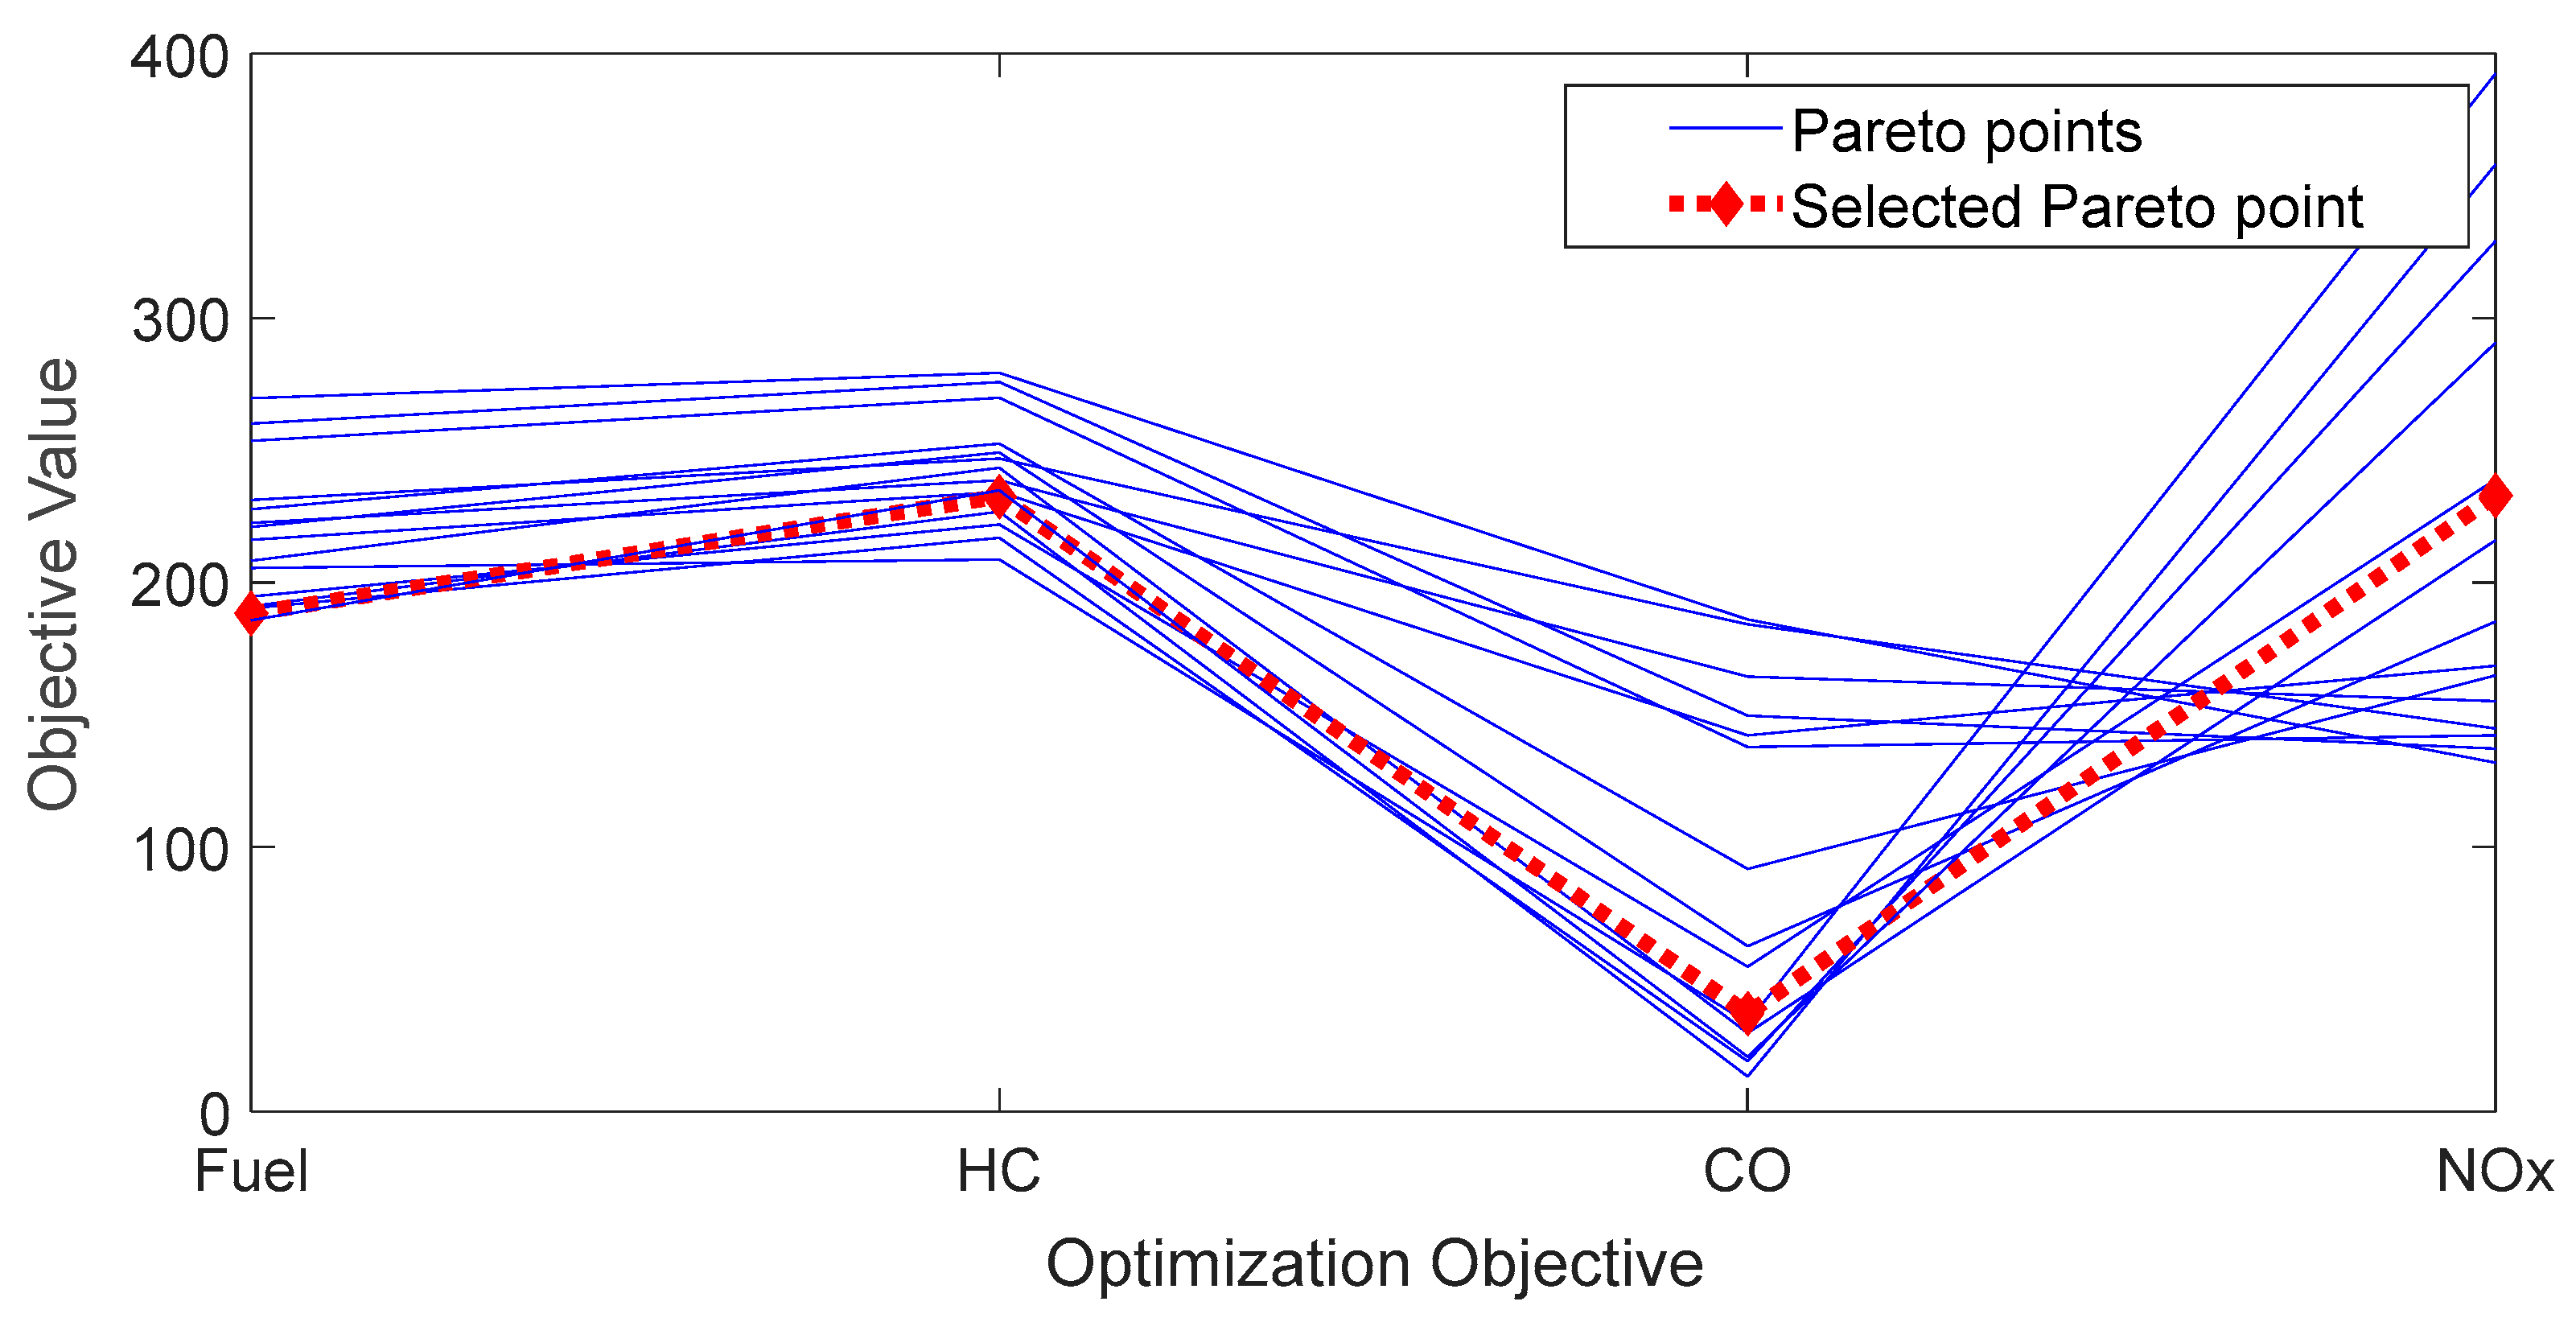
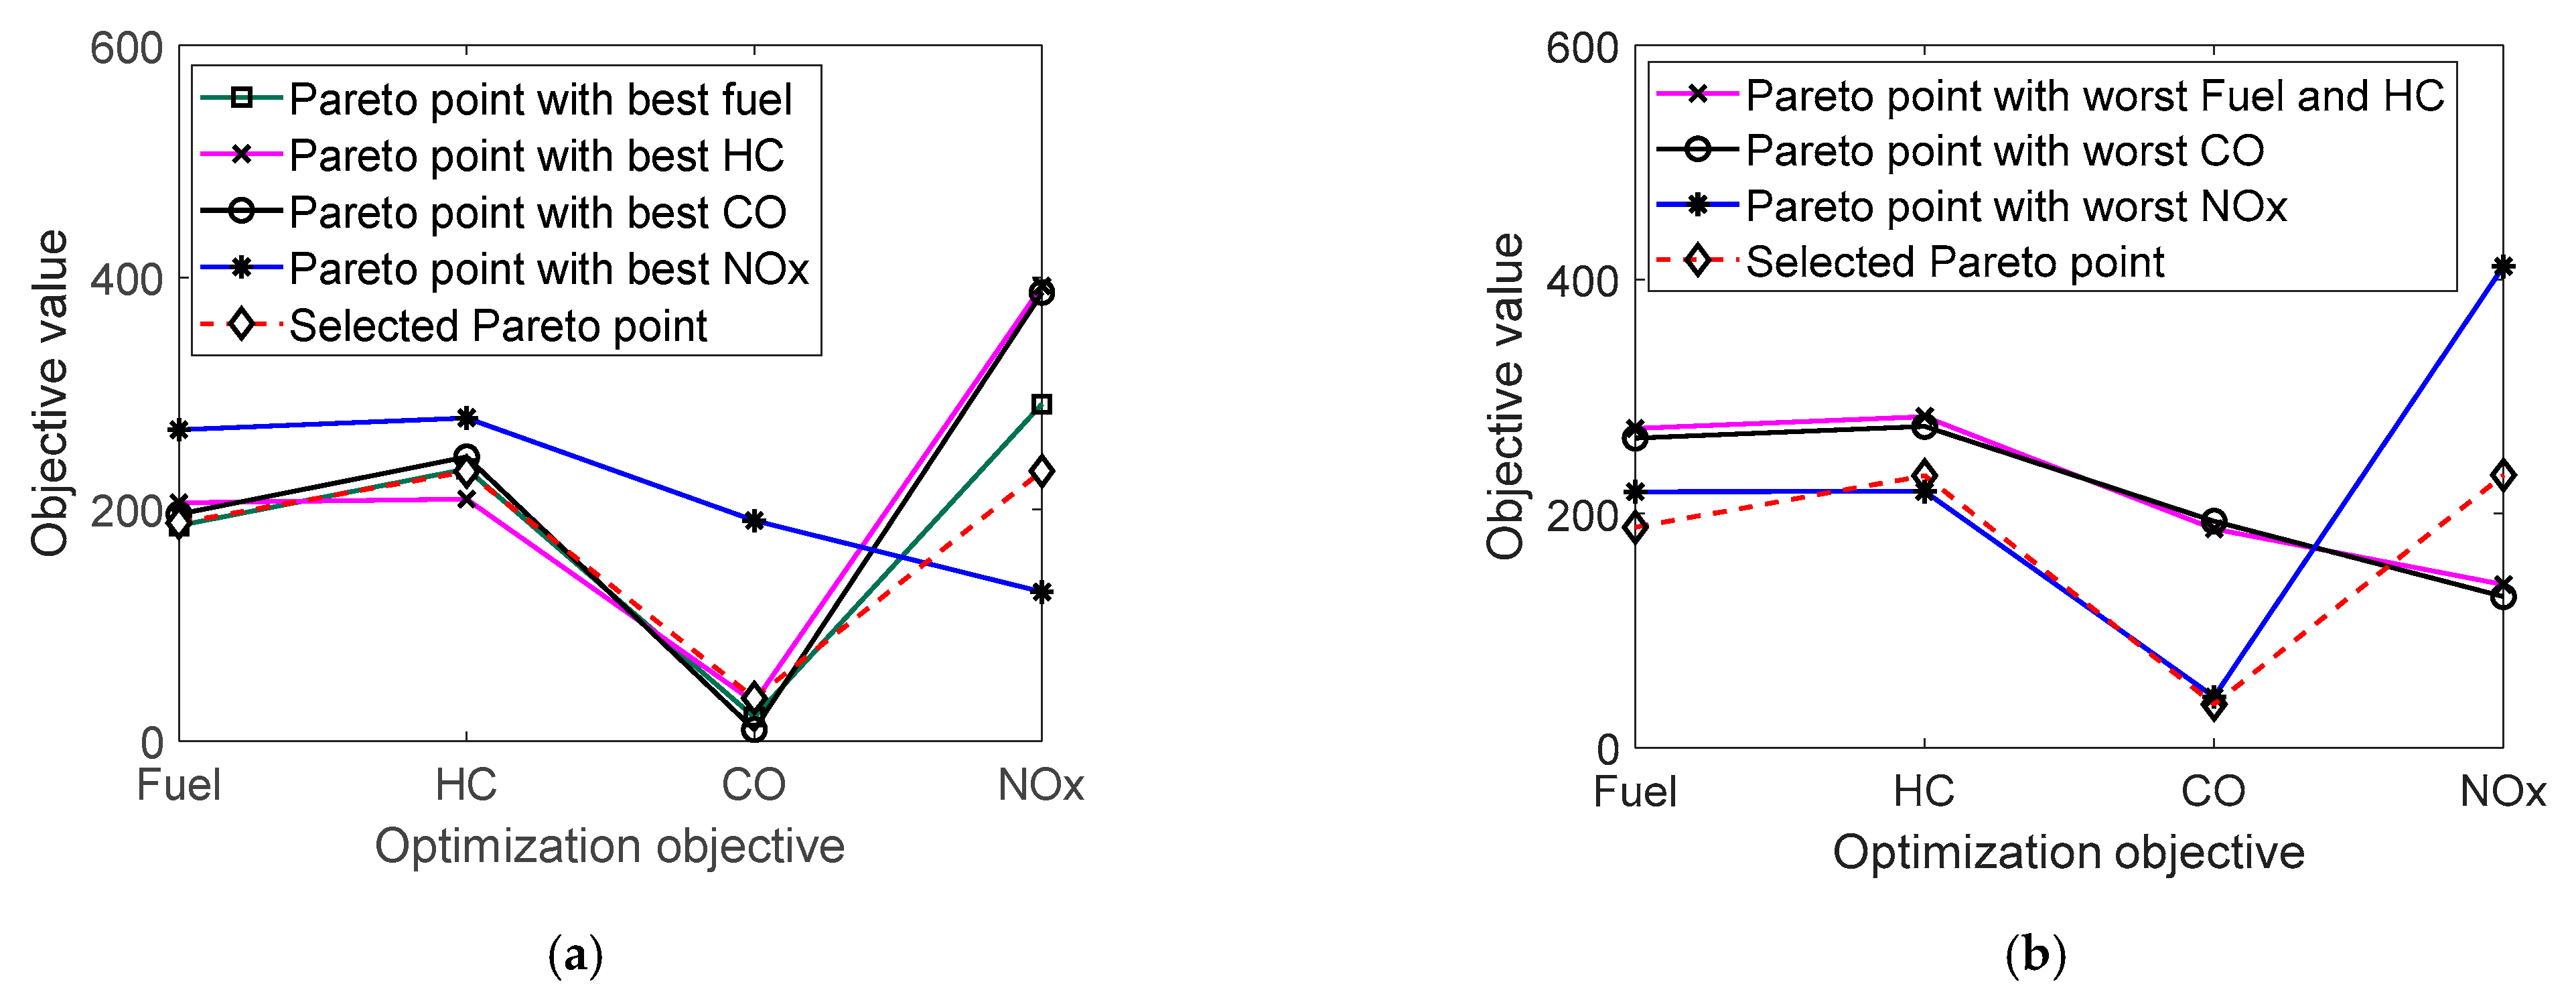
  • The cost function of the optimization problem considered multiple objectives: fuel consumption, emissions and gear shift strategy. Results showed that gear shift strategy and remaining objectives behaved uniquely; contradictory to fuel and emission objectives, frequency of gear shift increased with lower weighting factors and vice versa. Moreover, within the engine model used in the present study, a higher degree of conflict was observed between NOx and remaining objectives (i.e., fuel, HC and CO).
  • Three main useful strategies were extracted from DP results, i.e., full EV mode on/off threshold, gear shift and power-split strategy to develop the rule-based algorithm. The rule-based strategy-maintained fuel consumption and emissions within 10% of the DP results for WLTC and NEDC drive cycles. The proposed control strategy is computationally less demanding, easy-to-implement on a vehicle and near-optimal; thus, a viable option to control a hybrid electric three-wheeler operating in densely populated urban roads.
As future research, the proposed control strategy could be assessed on a prototype hybrid-electric three-wheeler for performance and robustness. In addition, simulation models could be validated with experimental testing and improved further to include dynamic characteristics of the vehicle. With an advance simulation model, multi-objective optimization could be extended to include vehicle dynamics and drivability characteristics.

Author Contributions

Conceptualization, W.M., M.P. and P.K.; methodology, W.M.; software, W.M.; validation, W.M.; formal analysis, W.M.; investigation, W.M.; resources, W.M. and M.P.; data curation, W.M.; writing—original draft preparation, W.M.; writing—review and editing, W.M., M.P., R.A. and P.K.; visualization, W.M.; supervision, M.P. and R.A.; funding acquisition, M.P. All authors have read and agreed to the published version of the manuscript.

Funding

This research was funded by the Bentley CAE research unit of Sri Lanka Institute of Information Technology, Sri Lanka.

Institutional Review Board Statement

Not applicable.

Informed Consent Statement

Not applicable.

Data Availability Statement

Not applicable.

Acknowledgments

The authors would like to thank Kasun Abeyasinghe (Sri Lanka Institute of Information Technology, Sri Lanka), Dilini Gunathilake (University of Wollongong, Australia) and Sampath Liyanarachchi (Memorial University of Newfoundland, Canada) for their valuable contribution to the work. Although any errors are of our own and should not tarnish the reputation of those esteemed persons.

Conflicts of Interest

The authors declare no conflict of interest.

Acronyms

BSFCBrake Specific Fuel Consumption
CNGCompressed Natural Gas
CPUCentral Processing Unit
DCDirect Current
DPDynamic Programming
EVElectric Vehicle
GPSGlobal Positioning System
ICInternal Combustion
LPGLiquefied Petroleum Gas
NEDCNew European Drive Cycle
PSRPower Split Ratio
RAMRandom Access Memory
RBRule-Based
SISpark Ignition
SoCState of Charge
UDCUrban Drive Cycle
WLTCWorldwide Harmonized Light Vehicles Test Cycle

References

  1. Ghosh, A. Possibilities and challenges for the inclusion of the electric vehicle (EV) to reduce the carbon footprint in the transport sector: A review. Energies 2020, 13, 2602. [Google Scholar] [CrossRef]
  2. Saxena, S.N. Revolution in growth of three-wheeler electric vehicles in India. J. Glob. Tour. Res. 2019, 4, 117–126. [Google Scholar] [CrossRef]
  3. Overview Information of the Bajaj RE 4s Three-Wheeler. Available online: https://www.globalbajaj.com/global/english/brands/intracity/re/re-4s/overview/ (accessed on 14 October 2020).
  4. Kokate, V.L.; Uttekar, S.S.; Karandikar, P.B.; Holmukhe, R.M. Retrofitting of Auto Rickshaw to E-Rickshaw—A Feasibility Study. In Proceedings of the First International Conference on Power, Control and Computing Technologies (ICPC2T), Raipur, India, 3–5 January 2020; pp. 229–234. [Google Scholar]
  5. Hofman, T.; van der Tas, S.G.; Ooms, W.; van Meijl, E.W.P.; Laugeman, B.M. Development of a Micro-Hybrid System for a Three-Wheeled Motor Taxi. World Electr. Veh. J. 2009, 3, 572–580. [Google Scholar] [CrossRef] [Green Version]
  6. Majumdar, D.; Jash, T. Merits and Challenges of E-Rickshaw as An Alternative form of Public Road Transport System: A Case Study in the State of West Bengal in India. Energy Procedia 2015, 79, 307–314. [Google Scholar] [CrossRef] [Green Version]
  7. Ahmadi, L.; Yip, A.; Fowler, M.; Young, S.B.; Fraser, R.A. Environmental feasibility of re-use of electric vehicle batteries. Sustain. Energy Technol. Assess. 2014, 6, 64–74. [Google Scholar] [CrossRef]
  8. Rajper, S.Z.; Albrecht, J. Prospects of Electric Vehicles in the Developing Countries: A Literature Review. Sustainability 2020, 12, 1906. [Google Scholar] [CrossRef] [Green Version]
  9. Khan, F.; Ali, Y.; Khan, A.U. Sustainable hybrid electric vehicle selection in the context of a developing country. Air Qual. Atmos. Health 2020, 13, 489–499. [Google Scholar] [CrossRef]
  10. Vezzini, A.; Sharan, H.; Umanand, L. Low-pollution three-wheeler autorickshaw with power-assist series hybrid and novel variable DC-link voltage system. J. Indian Inst. Sci. 2005, 85, 105–118. [Google Scholar]
  11. Amjad, S.; Rudramoorthy, R.; Neelakrishnan, S.; Gurusubramanian, S.; Raja, J.D.; Mathew, R.; Sundaravel, M. Plug-in hybrid conversion of three wheeler using a novel drive strategy. Int. J. Altern. Propuls. 2012, 2, 148. [Google Scholar] [CrossRef]
  12. Jijith, R.V.; Indulal, S. Hybrid Electric Three-Wheeler with ANN Controller. In Proceedings of the International Conference on Circuits and Systems in Digital Enterprise Technology (ICCSDET), Kottayam, India, 21–22 December 2018; pp. 1–5. [Google Scholar]
  13. Padmanaban, V.; Ramasubramanian, A.; Subramaniam, T. Investigation on use of plug—In hybrid electric vehicle (PHEV) technology using renewable energy for an autorickshaw. J. KONES. Powertrain Transp. 2012, 19, 383–394. [Google Scholar] [CrossRef]
  14. Maddumage, W.U.; Abeyasighe, K.Y.; Perera, M.S.M.; Attalage, R.A.; Kelly, P. Comparing Fuel Consumption and Emission Levels of Hybrid Powertrain Configurations and a Conventional Powertrain in Varied Drive Cycles and Degree of Hybridization. Sci. Technol. 2020, 19, 20–33. [Google Scholar] [CrossRef]
  15. Biasini, R.; Onori, S.; Rizzoni, G. A near-optimal rule-based energy management strategy for medium duty hybrid truck. Int. J. Powertrains 2013, 2, 232. [Google Scholar] [CrossRef]
  16. Enang, W.; Bannister, C. Modelling and control of hybrid electric vehicles (A comprehensive review). Renew. Sustain. Energy Rev. 2017, 74, 1210–1239. [Google Scholar] [CrossRef] [Green Version]
  17. Sudhakaran, S.; Indulal, S.; Lal Priya, P.S. Fuzzy Logic Controller Design for Retrofitted Three-wheeled Hybrid Electric Vehicle. In Proceedings of the 2020 First IEEE International Conference on Measurement, Instrumentation, Control and Automation (ICMICA), Kurukshetra, India, 24–26 June 2020; pp. 1–5. [Google Scholar]
  18. Lin, C.C.; Peng, H.; Grizzle, J.W.; Kang, J.M. Power management strategy for a parallel hybrid electric truck. IEEE Trans. Control Syst. Technol. 2003, 11, 839–849. [Google Scholar] [CrossRef] [Green Version]
  19. Kum, D.; Peng, H.; Bucknor, N.K. Supervisory Control of Parallel Hybrid Electric Vehicles for Fuel and Emission Reduction. J. Dyn. Syst. Meas. Control 2011, 133, 1–10. [Google Scholar] [CrossRef]
  20. Lin, C.-C.; Filipi, Z.; Wang, Y.; Louca, L.; Peng, H.; Assanis, D.N.; Stein, J. Integrated, Feed-Forward Hybrid Electric Vehicle Simulation in SIMULINK and its Use for Power Management Studies. SAE Tech. Pap. 2001, 1. [Google Scholar] [CrossRef] [Green Version]
  21. Zou, Y.; Shi-jie, H.; Dong-ge, L.; Wei, G.; Hu, X. Optimal Energy Control Strategy Design for a Hybrid Electric Vehicle. Discret. Dyn. Nat. Soc. 2013, 2013, 1–8. [Google Scholar] [CrossRef]
  22. Sundström, O.; Guzzella, L.; Soltic, P. Optimal Hybridization in Two Parallel Hybrid Electric Vehicles using Dynamic Programming. IFAC Proc. Vol. 2008, 41, 4642–4647. [Google Scholar] [CrossRef] [Green Version]
  23. Wang, R.; Lukic, S.M. Dynamic programming technique in hybrid electric vehicle optimization. In Proceedings of the IEEE International Electric Vehicle Conference, Greenville, SC, USA, 4–8 March 2012; pp. 1–8. [Google Scholar]
  24. Lin, C.-C.; Filipi, Z.; Louca, L.; Peng, H.; Assanis, D.; Stein, J. Modelling and control of a medium-duty hybrid electric truck. Int. J. Heavy Veh. Syst. 2004, 11, 349. [Google Scholar] [CrossRef] [Green Version]
  25. Asghar, M.; Bhatti, A.I.; Izhar, T. Benchmark fuel economy for a parallel hybrid electric three-wheeler vehicle (rickshaw). Adv. Mech. Eng. 2018, 10. [Google Scholar] [CrossRef]
  26. Huang, X.; Wang, Y.; Xing, Z.; Du, K. Emission factors of air pollutants from CNG-gasoline bi-fuel vehicles: Part II. CO, HC and NOx. Sci. Total Environ. 2016, 565, 698–705. [Google Scholar] [CrossRef] [PubMed]
  27. Wallington, T.J.; Sullivan, J.L.; Hurley, M.D. Emissions of CO2, CO, NOx, HC, PM, HFC-134a, N2O and CH4 from the global light duty vehicle fleet. Meteorol. Z. 2008, 17, 109–116. [Google Scholar] [CrossRef]
  28. Ram, N.S.M. Trends in Automotive Electronics in Two and Three Wheeled Vehicles. SAE Tech. Pap. 2003. [Google Scholar] [CrossRef]
  29. Huang, Y.; Wang, H.; Khajepour, A.; Li, B.; Ji, J.; Zhao, K.; Hu, C. A review of power management strategies and component sizing methods for hybrid vehicles. Renew. Sustain. Energy Rev. 2018, 96, 132–144. [Google Scholar] [CrossRef]
  30. Arsie, I.; Graziosi, M.; Pianese, C. Optimization of supervisory control strategy for parallel hybrid vehicle with provisional load estimate. In Proceedings of the 7th International Symposium on Advanced Vehicle Control (AVEC), Arnhem, The Netherlands, 23–27 August 2004; pp. 483–488. [Google Scholar]
  31. Borhan, H.; Vahidi, A.; Phillips, A.M.; Kuang, M.L.; Kolmanovsky, I.V.; Di Cairano, S. MPC-Based Energy Management of a Power-Split Hybrid Electric Vehicle. IEEE Trans. Control Syst. Technol. 2012, 20, 593–603. [Google Scholar] [CrossRef]
  32. Liu, Y.; Li, J.; Lei, Z.; Li, W.; Qin, D.; Chen, Z. An Adaptive Equivalent Consumption Minimization Strategy for Plug-In Hybrid Electric Vehicles Based on Energy Balance Principle. IEEE Access 2019, 7, 67589–67601. [Google Scholar] [CrossRef]
  33. Cheng, R.; Rodemann, T.; Fischer, M.; Olhofer, M.; Jin, Y. Evolutionary Many-Objective Optimization of Hybrid Electric Vehicle Control: From General Optimization to Preference Articulation. IEEE Trans. Emerg. Top. Comput. Intell. 2017, 1, 97–111. [Google Scholar] [CrossRef] [Green Version]
  34. Tulpule, P.; Marano, V.; Rizzoni, G. Effects of different PHEV control strategies on vehicle performance. In Proceedings of the American Control Conference, St. Louis, MO, USA, 10–12 June 2009; pp. 3950–3955. [Google Scholar]
  35. Wei, X. Modeling and Control of a Hybrid Electric Drivetrain for Optimum Fuel Economy, Performance and Driveability. Ph.D. Thesis, The Ohio State University, Columbus, OH, USA, 2004. [Google Scholar]
  36. Wang, X.; He, H.; Sun, F.; Sun, X.; Tang, H. Comparative Study on Different Energy Management Strategies for Plug-In Hybrid Electric Vehicles. Energies 2013, 6, 5656–5675. [Google Scholar] [CrossRef]
  37. He, H.; Sun, F.; Zhang, J. Application Study on the Dynamic Programming Algorithm for Energy Management of Plug-in Hybrid Electric Vehicles. Energies 2015, 8, 3225–3244. [Google Scholar] [CrossRef] [Green Version]
  38. Chen, Z.; Mi, C.C.; Xu, J.; Gong, X.; You, C. Energy Management for a Power-Split Plug-in Hybrid Electric Vehicle Based on Dynamic Programming and Neural Networks. IEEE Trans. Veh. Technol. 2014, 63, 1567–1580. [Google Scholar] [CrossRef]
  39. Markel, T.; Simpson, A. Cost-Benefit Analysis of Plug-In Hybrid Electric Vehicle Technology. World Electr. Veh. J. 2007, 1, 294–301. [Google Scholar] [CrossRef] [Green Version]
  40. Markel, T.; Smith, K.; Pesaran, A.A. Improving Petroleum Displacement Potential of PHEVs Using Enhanced Charging Scenarios. In Electric and Hybrid Vehicles; Elsevier: Amsterdam, The Netherlands, 2010; pp. 211–225. ISBN 9780444535658. [Google Scholar]
  41. Chan, C.C.; Bouscayrol, A.; Chen, K. Electric, Hybrid, and Fuel-Cell Vehicles: Architectures and Modeling. IEEE Trans. Veh. Technol. 2010, 59, 589–598. [Google Scholar] [CrossRef]
  42. Denis, N.; Dubois, M.R.; Trovao, J.P.F.; Desrochers, A. Power Split Strategy Optimization of a Plug-in Parallel Hybrid Electric Vehicle. IEEE Trans. Veh. Technol. 2018, 67, 315–326. [Google Scholar] [CrossRef]
  43. Nguyễn, B.-H.; Trovão, J.P.F.; German, R.; Bouscayrol, A. Real-Time Energy Management of Parallel Hybrid Electric Vehicles Using Linear Quadratic Regulation. Energies 2020, 13, 5538. [Google Scholar] [CrossRef]
  44. Karaoğlan, M.U.; Kuralay, N.S.; Colpan, C.O. The effect of gear ratıos on the exhaust emıssıons and fuel consumptıon of a parallel hybrid vehicle powertrain. J. Clean. Prod. 2019, 210, 1033–1041. [Google Scholar] [CrossRef]
  45. Liu, Y.; Liu, J.; Zhang, Y.; Wu, Y.; Chen, Z.; Ye, M. Rule learning based energy management strategy of fuel cell hybrid vehicles considering multi-objective optimization. Energy 2020, 207, 118212. [Google Scholar] [CrossRef]
  46. Assadian, F.; Mohan, G.; Longo, S. Comparative analysis of forward-facing models vs backward-facing models in powertrain component sizing. In Proceedings of the Hybrid and Electric Vehicles Conference (HEVC), London, UK, 6–7 November 2013; Volume 2013, pp. 1–6. [Google Scholar]
  47. Elbert, P.; Ebbesen, S.; Guzzella, L. Implementation of Dynamic Programming for n-Dimensional Optimal Control Problems with Final State Constraints. IEEE Trans. Control Syst. Technol. 2013, 21, 924–931. [Google Scholar] [CrossRef]
  48. Sundstrom, O.; Guzzella, L. A generic dynamic programming Matlab function. In Proceedings of the IEEE International Conference on Control Applications, St. Petersburg, Russia, 8–10 July 2009; pp. 1625–1630. [Google Scholar]
  49. Sundström, O.; Ambühl, D.; Guzzella, L. On Implementation of Dynamic Programming for Optimal Control Problems with Final State Constraints. Oil Gas Sci. Technol. Rev. l’IFP 2010, 65, 91–102. [Google Scholar] [CrossRef] [Green Version]
  50. Chen, X.; Du, W.; Qian, F. An Adaptive Multi-Objective Differential Evolution Algorithm for Solving Chemical Dynamic Optimization Problems. In Computer Aided Chemical Engineering; Elsevier: Amsterdam, The Netherlands, 2015; Volume 37, pp. 821–826. [Google Scholar]
  51. Marler, R.T.; Arora, J.S. Survey of multi-objective optimization methods for engineering. Struct. Multidiscip. Optim. 2004, 26, 369–395. [Google Scholar] [CrossRef]
  52. Jakob, W.; Blume, C. Pareto Optimization or Cascaded Weighted Sum: A Comparison of Concepts. Algorithms 2014, 7, 166–185. [Google Scholar] [CrossRef] [Green Version]
  53. Yang, X.-S. Multi-Objective Optimization. In Nature-Inspired Optimization Algorithms; Elsevier: Amsterdam, The Netherlands, 2014; pp. 197–211. ISBN 9780124167438. [Google Scholar]
  54. Fleming, P.J.; Purshouse, R.C.; Lygoe, R.J. Many-Objective Optimization: An Engineering Design Perspective. In Lecture Notes in Computer Science; Springer: Berlin, Heidelberg, 2005; Volume 3410, pp. 14–32. [Google Scholar]
  55. Liang, J.; Walker, P.D.; Ruan, J.; Yang, H.; Wu, J.; Zhang, N. Gearshift and brake distribution control for regenerative braking in electric vehicles with dual clutch transmission. Mech. Mach. Theory 2019, 133, 1–22. [Google Scholar] [CrossRef]
  56. Zhu, B.; Zhang, N.; Walker, P.; Zhou, X.; Zhan, W.; Wei, Y.; Ke, N. Gear shift schedule design for multi-speed pure electric vehicles. Proc. Inst. Mech. Eng. Part D J. Automob. Eng. 2015, 229, 70–82. [Google Scholar] [CrossRef]
  57. Minister of Transport, S.L. Motor Traffic (Speed Limits) Regulations, No. 1 of 2012. In Gazette Extraordinary No. 1763/26 of June 22, 2012; Department of Government Printing: Colombo, Sri Lanka, 2012; pp. 1A–2A. [Google Scholar]
  58. Specifications—Bajaj RE 4S Twin Spark 4-Stroke DTSi Three-Wheeler. Available online: https://www.globalbajaj.com/global/english/brands/intracity/re/re-4s/specifications/ (accessed on 13 October 2020).
  59. President, S.L. Vehicular exhaust emission standards for importation, manufacturing or assembling of vehicles. In Gazette Extraordinary No. 2079/42 of July 12, 2018; Department of Government Printing: Colombo, Sri Lanka, 2018; p. 3A. [Google Scholar]
Figure 1. BAJAJ RE 205 cc motorized three-wheeler [3].
Energies 14 01833 g001
Figure 2. Schematic of the pre-transmission parallel hybrid powertrain.
Energies 14 01833 g002
Figure 3. Engine fuel and emission maps: (a) Fuel efficiency map; (b) HC emission map; (c) CO emission map; (d) NOx emission map.
Energies 14 01833 g003
Figure 4. Motor efficiency map.
Energies 14 01833 g004
Figure 5. Battery model and electrical performance: (a) The equivalent battery circuit model; (b) Battery module open circuit voltage with SoC at 41 °C.
Energies 14 01833 g005
Figure 6. Schematics of Quasi-static models: (a) backward-facing model; (b) forward-facing model.
Energies 14 01833 g006
Figure 7. The results from DP with the number of grid points of the state variable.
Energies 14 01833 g007
Figure 8. DP results with the number of grid points of the control variable.
Energies 14 01833 g008
Figure 9. Gear shift trajectory: (a) Gear shift trajectory with zero-weighting factor; (b) Gear shift trajectory of the selected Pareto point.
Energies 14 01833 g009
Figure 10. Parallel coordinate plots for Pareto points with varied weighting factors for optimization objectives (for clarity only 15 Pareto points are represented).
Energies 14 01833 g010
Figure 11. Parallel coordinate plots: (a) Pareto points with the best values for the objectives; (b) Pareto points with the worst values for the objectives.
Energies 14 01833 g011
Figure 12. Operating points from DP optimization results when power demand is positive.
Energies 14 01833 g012
Figure 13. Transmission gear selection from DP algorithm when power demand is positive.
Energies 14 01833 g013
Figure 14. Engine operating points from DP results.
Energies 14 01833 g014
Figure 15. Logic of the DP based sub-optimal rule-based control algorithm.
Energies 14 01833 g015
Figure 16. Flowchart for the DP based power split ratio (PSR) mode control algorithm.
Energies 14 01833 g016
Figure 17. Speed profile of the WLTC Class 1 drive cycle.
Energies 14 01833 g017
Figure 18. SoC trajectory of rule-based (RB) and DP strategies over WLTC.
Energies 14 01833 g018
Figure 19. Speed profile of the UDC-NEDC drive cycle.
Energies 14 01833 g019
Figure 20. SoC trajectory of RB and DP strategies over UDC-NEDC.
Energies 14 01833 g020
Figure 21. Speed profile of the real-life “Malabe” cycle.
Energies 14 01833 g021
Figure 22. SoC trajectory of RB and DP strategies over “Malabe”.
Energies 14 01833 g022
Table 1. Basic vehicle parameters.
PowertrainParameterValue
EngineMaximum power (kW)6
Electric motorMaximum power (kW)3
BatteryNo. of Modules6
Capacity (Ah)6
Nominal voltage (volt/module)10.8
VehicleFrontal area (m2)1.86
Tire radius (m)0.2
Coefficient of drag0.44
Rolling resistance coefficient0.015
Glider mass–without propulsion (kg)280
Curb weight (kg)448
Table 2. Variables and grids of the dynamic programming (DP) problem.
VariablesGrid
Stage (k)Time0:1:1612
State (x)SoC
Gear number
0.4:0.0027:0.7
1, 2, 3, 4
Control (u)Torque split factor
Gear shift command
−1:0.028:1
−1, 0, 1
Table 3. Performance comparison of DP and rule-based strategies for the WLTC class 1 drive cycle.
ControllerFuel (l/100 km)HC (g/km)CO (g/km)NOx (g/km)
DP1.320.1421.0960.405
Rule Based1.380.1451.1510.408
Deviation+4.92%+2.09%+5.02%+0.68%
Table 4. Performance comparison of DP and rule-based strategies for the UDC-NEDC drive cycle.
ControllerFuel (l/100 km)HC (g/km)CO (g/km)NOx (g/km)
DP1.530.1622.2640.438
Rule-Based1.590.1572.4850.474
Deviation+4.01%−2.87%+9.76%+8.16%
Table 5. Performance comparison of DP and rule-based strategies for the “Malabe” cycle.
ControllerFuel (l/100 km)HC (g/km)CO (g/km)NOx (g/km)
DP1.150.1240.8010.309
Rule-Based1.260.1350.9890.327
Deviation+9.61%+8.59%+23.50%+5.86%
Publisher’s Note: MDPI stays neutral with regard to jurisdictional claims in published maps and institutional affiliations.

