Abstract
In this paper, a detailed three-dimensional, transient, finite element method of fuse link NH000 gG 100 A is proposed. The thermal properties during the operation of the fuses under nominal (100 A) and custom conditions (110 and 120 A) are the main focus of the analyses that were conducted. The work concerns both the outside elements of the fuse link (ceramic body) and the elements inside (current circuit). Both the distribution of the electric current and its impact on the temperature of the construction parts of the fuses during their operating mode have been described. Temperature distribution, power losses and energy dissipation were measured using a numerical model. In order to verify and validate the model, two independent teams of scientists executed experimental research, during which the temperature was measured on different parts of the device involving the rated current. Finally, the two sets of results were put together and compared with those obtained from the simulation tests. A possible significant correlation between the results of the empirical tests and the simulation work was highlighted.
1. Introduction
Currently, there are many fuse design solutions available on the market for various applications, for example, in the construction industry and other branches. Fuses are very efficient short-circuit protection devices. These are distinguished by a high short-circuit capacity (equal to 120 kA). Fuse links are often installed with circuit breakers, e.g., in series connection upstream of the circuit breaker. In this configuration, the inserted fuse significantly reduces the short-circuit current appearing on the circuit-breaker contacts and reduces the duration of a short-circuit. Fuse links are among the fastest-acting short-circuit protection means of relatively not-large dimensions. These devices are able to remove currents quickly and efficiently without risk of disturbance. Fuses are irreplaceable as a preventive measure of last resort in the event of failure or the spread of failure. Their advantages are also visible in many other applications that make replacement completely impossible in some situations. A model of a fuse link is shown in Figure 1 below.
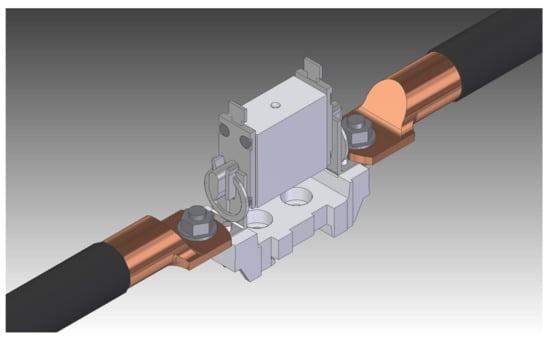
Figure 1.
Model of a fuse link mounted in a fuse base during simulation research.
Designing of NH fuse links often revolves around adaptation to comply with the guidelines contained in the standards (PN-EN 60269-1, PN-HD 60269-2) that allow to design and market a product that meets all requirements necessary and does not compromise safety protocols. NH-type fuses consist of a ceramic body to which the silver blades of the fuse are screwed on both sides. For fuse knives located inside the body, a perforated fuse is soldered, usually made of a strip of copper or its alloy. In the past, straight wire was used as flux. Currently, the shape of the topic element depends on the fuse link purpose. In order to improve cooling, thin tapes, usually copper or silver, are used to reduce the cross-section of the fuse as these metals have very good material properties and allow the dimensions of the fuses to be minimized. They are also quite resistant to the aging process.
The width of the fuse and the number of constrictions made in it depend on the rated current of the fuse and type of its characteristic. During cumulative flow overload currents, the heat generated in the central tapering of the fuse dissolves from the center on both sides to the fuse knives; in this case, a fuse burnout occurs in the middle. It is different in the case of a short-circuit current, during the flow of which all the elements of the subject are burnt at the same time.
At this point, a technique called the Metcalf effect (M-Effect) should be mentioned. It consists in creating a eutectic alloy of an element’s material with another metal (usually mounted as a solder ball on a fusible element). The temperature of the eutectic is below the temperature of the melting point of the fusible link. In the event of an overload, the fuse heats up and the solder diffuses with the fuse element. Due to this phenomenon, the fusible link exhibits greater resistance and, thus, shortens the time required to burn out the fuse in the feature around where the solder has been applied.
The main goal of this research was to construct and launch a fully operational and accurate transient thermal model of fuse link NH000 gG 100A on the basis of empirically derived results.
As indicated, thermal analysis aspects are mandatory to fully understand and improve the construction of fuses. This paper brings some novelties to the thermal analysis of fuse links by deriving a functional 3D finite element model (FEM):
- Introduction of a detailed, realistic model with exact physical properties;
- The digital model used a in transient state can also be used for analyzing a steady state;
- The studied models can be used to calculate power losses and energy dissipation during operation under various conditions;
- The model was validated by two independent sources;
- Shortening of the design and implementation time of new electrical devices by solving the validated FEM—in this case, fuses;
- Versatility of the employed model for modeling fuse links involving other current–voltage parameters in terms of other electrical apparatuses. Tests of heating with rated current are necessary for every electrical apparatus and switchgear;
- A transparent and elastic method to describe thermal physical phenomena, which result in a reduction concerning the number of prototypes, thus increasing economic efficiency and reducing the impact on the natural environment;
- The publications available so far are vital, and the authors of the manuscript have analyzed those. However, the available literature does not deal with issues related to an organized and formalized approach concerning the construction of thermal models of fuse links. The study may be used in scientific and research institutes, in the process of designing or enhancing the structure of electrical devices.
2. State of the Art
The problem of building a universal model of a fuse as a protective element of electrical devices is an important task. The importance of this research is evidenced by numerous publications. Nevertheless, many researchers choose only starting energy as a basic parameter. The publication [1] presents the calculation of the fuse melting point on the basis of the starting energy. The test layout was designed as a case study.
Fuse links are widely used to provide surge protection in many types of wiring systems and electrical equipment. In view of the short operating time of the fuse during certain disturbances under overcurrent conditions, the publication [2] presents a system for testing the low-voltage fuse operation time.
The authors of [3] treat the fuse link as one of the most important safeguards in a power system. Of course, knowing the thermal behavior of a fuse is an important aspect for an optimized design of the protection system of a particular element as part of a given power system as well as for the correct selection of a fuse rating to protect this element. The designed fuse must operate properly at rated and instantaneous overcurrent (e.g., at motor starting) and interrupt the short-circuit current. In the article, a two-dimensional thermal model was developed in order to study the temperature distribution on the fuse using the ANSYS program. This paper presents a summary of the results of this work.
First of all, we should mention a model of peripheral electrical apparatus [4]. The article presents the procedure of creating an energy-based fuse link model. A fuse model which takes into account both the pre-arc and arc characteristics of any time current characteristic curve has been developed in this paper. The fuse model developed was based on the energy from the fuses. The curve fitting technique allows to accurately determine the fuse’s melting time. A MATLAB/Simulink simulation model in which the fuse parameters can be entered from the user interface was designed and run in order to test and verify the model conception.
To build an optimal fuse model, the authors used some of the results from the publication [5]. The article describes a new model that can calculate the melting time and fuse current only on the basis of the catalogue value of the Joule’s integral given by the manufacturer. The calculated value on the fuse is compared to the catalog value, so that the circuit is open when the two values are equal. Two features allow us to easily and accurately obtain the value of the Joule’s integral in the fuse for different circuits. One of them is a method of detecting the current in the fuse at any time, so that the fuse current can be accurately calculated. Regarding the second feature, the diffusion coefficient is taken into account so that the melting time can be accurately calculated, even when the fuse current is relatively small. It is not necessary to perform many fuse blowing experiments. The fuse melting time and current can be calculated accurately and easily when the fuse is part of a large circuit of the power system [6,7].
The publications so far are vital, and the authors of this manuscript have used them. However, the available literature does not deal with issues related to an organized and formalized approach concerning the construction of fuse links thermal models.
The study may be used in scientific and research institutes in the process of designing or enhancing the structure of electrical devices. The presented results of simulation and empirical studies concern the analysis of non-linear physical phenomena. Such a model was also developed. The proposed method does not eliminate other thermal simulation models. The presented method (modeling method) may be a support for other methods. Hence, when looking at publications, the method can be based on, for example, the proposed innovative stepwise response matrix identification procedure, which is based on the combination of external non-linear least squares iteration for relocating time constants. The publication presents the structure of the algorithm, the connection of its main functions, describes those in detail and comments on the mathematical features of the proposed formulation concerning the identification problem. The model presented by the team has the possibility of cooperation among others with this method. To a great advantage, this can improve the accurate method of determining the temperature from only a partial result (approximation).
3. Theoretical Model
3.1. Fuse Link Thermal Energy
Thermal energy in a fuse link is generated by the rated current or the short-circuit current flowing through the main current circuit, being part of the fuse link structure and wires connected to the base of the fuse. The thermal energy from the current busbars is dissipated to the environment by convection, conduction and radiation [8].
The value of the electrical power generated on a given busbar length is the sequence of current and resistance, described below by means of the equation:
where P is the power dissipated per unit length (W), I is the current in the conductor (A) and R is the resistance per unit length of the conductor (Ω).
All calculations related to the current flow in the fuse links are possible using the following Maxwell equations [9]:
where ∇x is the curl operator, ∇· is the divergence operator, {H} is the magnetic field intensity vector, {J} is the total current density vector, {Js} is the applied source current density vector, {Je} is the induced eddy current density vector, {Jv} is the velocity current density vector, {D} is the electric flux density vector, t is the time, {E} is the electric field intensity vector, {B} is the magnetic flux density vector and ρ is the electric charge density.
For the calculation concerning the coupled heat transfer process between the carrier fluid (air) and the solid domains the, Navier–Stokes equation is used alongside the energy equations, described below [10].
The continuity equation is given by:
The momentum equation:
The expression of the energy equation is as follows:
where x, y and z are the Cartesian coordinates; u, v and w are the velocities in x, y and z, directions, respectively; is the velocity vector, p is the pressure, ρ is the density, μ is the dynamic viscosity, is the body force vector, T is the temperature, k is the thermal conductivity of air and τ is the viscous shear stress.
3.2. Heat Transfer during Fuse Link Operation
During heat transfer from fuse links, the following types of heat transfer to the environment can be distinguished [11]:
- Through radiation;
- By convection;
- By conduction.
All types of heat dissipation that may occur during physical phenomena must be taken into account in the fuse calculations. The heat transferred by the conductive material or the insulating material is implemented by conduction. On the other hand, in the case of a heated device in the air environment, e.g., unenclosed switchgear, heat is transferred to the environment by both radiation and convection [12]. While calculating the thermal phenomena of electrical apparatus for the rated load, the share of heat transfer by radiation and natural convection is similar (for a temperature difference of several dozen Kelvins). The conditions of heat transfer to the environment in thermal calculations are often determined using the so-called heat transfer coefficient k, which defines the total amount of heat transferred to the environment from a given surface per unit time from the cooled body to the environment [13]. The total coefficient for the fuse link placed in the air is, therefore, the sum of the coefficients of heat transfer to the environment by convection and radiation, which is shown in the following relation [14]:
where kr is a heat transfer coefficient by radiation; is a heat transfer coefficient by convection.
During the radiation of a given fuse and, therefore, of a current circuit, electromagnetic waves of different lengths are emitted. However, not all of them are capable of transferring thermal energy. Depending on the wavelength, these radiate more or less thermal energy [15]. The wavelengths that most effectively transfer heat energy to the environment are the waves in the range of 0.4–10 µm, lying in the so-called reddened area. The energy that is radiated from a given body is partially reflected, partially absorbed and passed through another body. This phenomenon is described by the following equation [16]:
where is a wave reflection coefficient; is a wave absorption coefficient and is a wave transmission coefficient.
Using the Stefan–Boltzmann law, it is possible to determine the radiation power in relation to the surface of the radiating body [17]:
where is a black radiation coefficient of the given body; is a Stefan–Boltzmann coefficient and is the radiating body temperature expressed in Kelvins.
Examples of the ε coefficient values for various materials from which fuse link current circuits can be made are presented in Table 1.

Table 1.
ε coefficient values for various materials.
In electrical apparatuses, one can also observe the phenomenon of convection, which takes place between the elements of the electric apparatus and the gas (air or SF6) or liquid (oil) in the immediate vicinity of, for example, a current circuit [18]. The convective motion of a gas or liquid largely depends on the type of motion forced, the shape and dimensions of the surface of the heated body or the physical properties of the media, which makes the convection process a complex process dependent on many factors. There are two types of convection phenomena that release heat to the environment: natural and forced [19,20].
In the case of natural convection (free movement), the movement of gas or liquid is caused by the difference in the density of the heated and cool particles, which generates the forces of lifting. The lighter heated particles are lifted upwards [21,22,23]. The process of forced convection takes place when the movement of the liquid or gas is caused by external forces generated, for example, by fans or wind. In both cases, the movement of particles around the heated solid can be of a laminar or turbulent particle flow. Laminar flow of gas or liquid particles occurs at low particle velocities, and turbulent flow follows laminar movement after exceeding the so-called critical speed. The movement of particles during the convection phenomenon has a very significant impact on the heat transfer from the cooled current circuit of the apparatus [24,25,26]. During laminar flow, the amount of heat released depends on the thermal conductivity of the gas or liquid. In the case of turbulent motion, the heat transfer process depends mainly on the thermal resistance of the boundary layers with laminar flow. The thinner the layers, the greater the conditions for heat exchange from the cooled body. Heat transfer by convection to the environment also depends on the physical properties of gases and liquids. These are mainly heat capacity, thermal conductivity, specific mass or dynamic viscosity [27,28,29,30].
4. Laboratory Setup
Nowadays, the initial prototypes of electrical devices are designed using 3D computer software and coupled programs for performing mechanical, thermal and electrodynamic analyses. At a time when such tools did not exist, designers constructed electrical devices based on mathematical calculations, experience and on the basis of available standards in force.
Currently, fuse links are also designed by manufacturers in accordance with the standard PN-EN 60269-1, PN-HD 60269-2. The scope of the standard includes standardized methods of testing fuse links, which are used in accredited laboratories to conduct type tests and tests of conformity of the manufactured devices with the given requirements of the standard. The performed tests allow to check the operation and construction of the apparatus, which was previously designed in 3D software, the simulation analysis of which could include some simplifications. Additionally, type testing is necessary to obtain a certificate for the product that the manufacturer wants to introduce to the market. In this work, a fuse link with a rated current of 100 A was subjected to tests in order to check the temperature fluctuations in the current circuit elements. A schematic of the layout used for laboratory measurements is shown in Figure 2 below.

Figure 2.
Diagram of the measuring system constructed for fuse link measurements.
Thermocouples were installed in different places of the device, as it is seen in Figure 3. This made it possible to perform the measurements in accordance with the above standard. Type K thermocouples were fixed using a special thermally conductive glue on the elements of the current circuit: upper and lower terminals (T1; T6); upper and lower electrical contacts (T2; T5—fuse link knives); on the fuse link body (T3; T4); T7 for measuring ambient temperature and T8 for measuring the power supply cable’s temperature. The places where the thermocouples were installed depended on the previously performed computational analyses for the 3D model of this fuse link type in order to compare the obtained results.
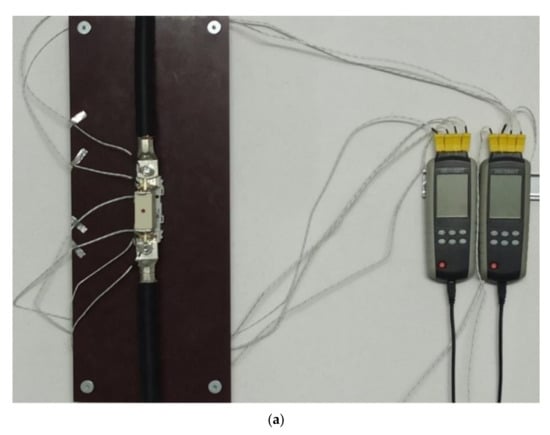
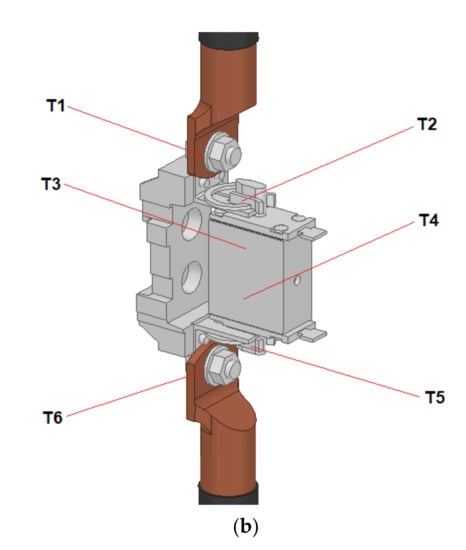
Figure 3.
Fuse link with glued thermocouples (type K): (a) photo of the laboratory stand layout; (b) placement of thermocouples on the 3D fuse link model—T1, upper terminal; T2, upper electrical contact; T3, T4, fuse link body; T5, lower electrical contact; T6, lower terminal.
After fixing the thermocouples, it was realized that their placement did not affect the operation of the device and did not cause any problems with its operation. No modifications were made to the fuse, which allowed the temperature fluctuations and rise to be measured correctly. In order to carry out the tests, it was necessary to prepare a test bench to record the temperature rise of the elements of the current circuit of the fuse link for specific currents: 100, 110 and 120 A. For this purpose, a single-phase autotransformer was used, to which a single-phase high-current transformer was connected. The autotransformer in this case was used to regulate the current at the output of the high-current transformer. In order to measure the current, a clamp meter (ammeter) was installed on the cable supplying the tested object—an overcurrent switch. In order to collect data from the installed thermocouples in the fuse link, two 4-channel temperature recorders with an accuracy of 0.1 °C were used, the sampling time of which was set to 1 s (temperature was measured on 6 thermocouples every second). Data from the recorder, via the USB communication interface, were sent online to the recorder software on a PC, where the heating charts of the tested elements were generated. That was depicted in Figure 2.
The length of the power supply cables powering the fuse link is precisely defined in the standard and those are respectively equal to 1 m from the bottom of the fuse link and 1 m from the top of the fuse link. These recommendations were followed during the tests, and the actual layout is shown in Figure 3.
The ambient temperature was measured using two other thermocouples immersed in the oil reservoir—the temperature oscillated around 22 °C.
5. Experimental Work
5.1. Assumptions
As previously indicated, empirical work was conducted by two independent teams of researchers—Team A and Team B. In order to perform the thermal analysis, two stands, described in Section 4, were constructed. The fuse link NH000 gG 100 A has been verified with a rated current equal to 100 A. It is worth noting that according to the results presented in the tables below (Table 2 and Table 3), temperature results for the thermocouples refer to the temperature fixed values. The measurements were recorded after the lab stand had been operating for two hours (7200 s). The measurements were taken each time for 10 fuse links—five fuse links per team.
Table 2.
Results obtained by Team A for fuse link type NH000 gG 100 A.
Table 3.
Results obtained by Team B for fuse link type NH000 gG 100 A.
5.2. Empirical Results
The results obtained by Team A and Team B are juxtaposed in Table 2 and Table 3 below. The results were derived from two independent laboratory stands.
The results are also depicted on the chart shown in Figure 4 below.
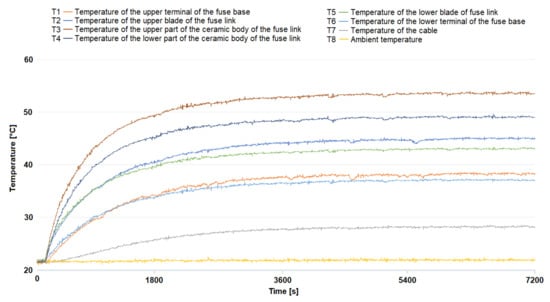
Figure 4.
Chart showing results for thermocouples T1; T2; T3; T4; T5 and T6. The results were obtained for a time of 7200 s for a type of fuse NH000 gG 100 A and for a current of 100 A.
The results obtained for a nominal current of 100 A by the two teams were consistent. Therefore, it was possible to draw the conclusion that the results of the empirical work were confirmed by the simulations and vice versa.
Additionally, in order to check different conditions, the thermal analysis was procured for currents equal to 110 and 120 A. The empirical results are presented in Figure 5 and Figure 6 below.
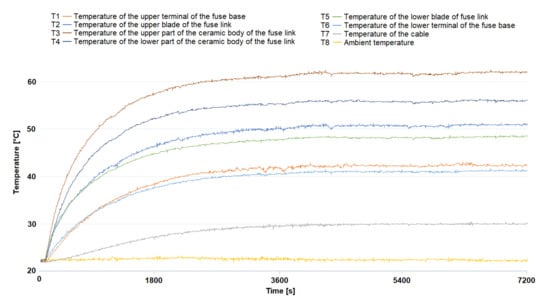
Figure 5.
Chart showing results for thermocouples T1; T2; T3; T4; T5 and T6. The results were obtained for a time of 7200 s for a type of fuse NH000 gG 100 A and for a current of 110 A.
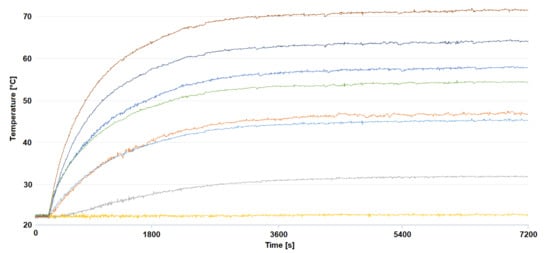
Figure 6.
Chart showing results for thermocouples T1; T2; T3; T4; T5 and T6. The results were obtained for a time of 7200 s for a type of fuse NH000 gG 100 A and for a current of 120 A.
Figure 7 below depicts the screens captured from a thermal imaging camera during the experimental work performed.
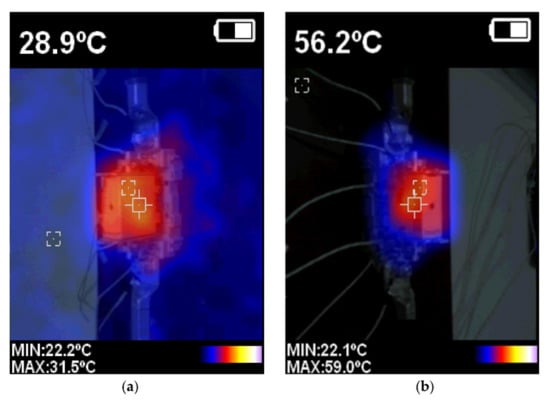
Figure 7.
Screens captured from a thermal imaging camera during analysis: (a) after 5 min; (b) after maintaining the set temperature.
6. Simulations
6.1. Fuse Link Simulations for Rated Current of 100 A
The first coupled analysis was performed with the ANSYS Workbench using the coupled Maxwell 3D and Transient Thermal environments. This analysis made it possible to obtain precise results linked to the nominal current flowing through the fuse. The highest current density and ohmic losses in the fuse link, shown in Figure 8 below, were achieved on a fusible element inside the ceramic body. The effect of the current flow through the circuit breaker circuit was the generation of power losses in the form of released heat, presented in Figure 9 below. A thermal analysis was performed after the calculations related to the current flow. Further importation of data allowed calculating the temperature distribution obtained on the fuse link circuit. The highest temperature value, equal to 63 °C, was reached on the ceramic body.
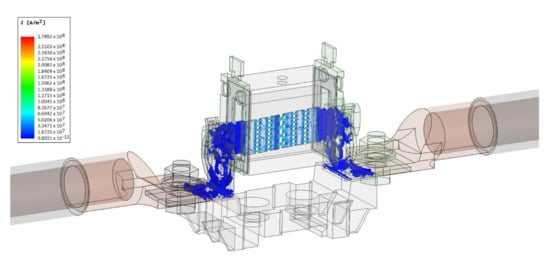
Figure 8.
Distribution of the current density on the current circuit elements of the fuse model for a rated current of 100 A.
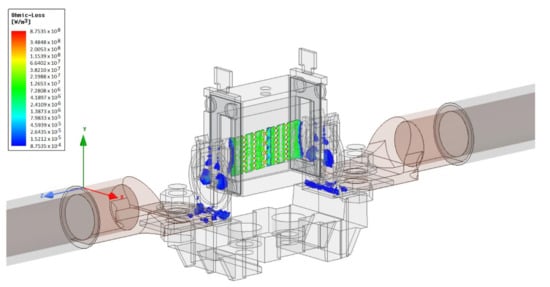
Figure 9.
Ohmic losses on the current circuit elements of the fuse model for a rated current of 100 A.
Figure 10 below shows the graphical thermal analysis results for the tested fuse link.
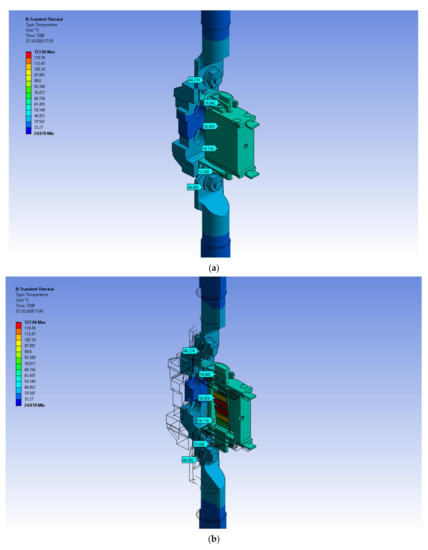
Figure 10.
Graphical results of thermal analysis of the fuse link: (a) thermal analysis of the fuse link; (b) cross-section of the fuse link showing the fusible element.
For additional tests, a longer fuse link operating time has been defined. This test should prove that the temperature stabilized for a little longer. Despite this length, the measured time is still compatible with the standard.
For the purpose of validating the simulation results obtained with experimental tests, heating time histories were generated using the “Temperature Probe” option. Obtained waveforms were consolidated into one chart using the “Chart plot” function. Temperature charts are presented in Figure 11 below.

Figure 11.
Chart showing results of ANSYS simulations for thermocouples T1; T2; T3; T4; T5 and T6. The results were obtained for a time of 7200 s for a type of fuse NH000 gG 100 A.
6.2. Fuse Link Simulations for Rated Current of 110 and 120 A
The results for simulations involving currents of 100, 110 and 120 A are juxtaposed in Table 4 below.
Table 4.
Results for amperages of 100, 110 and 120 A for fuse link type NH000 gG 100 A. Results were obtained after 7200 s.
7. Results Summary
It has been shown, thanks to a numerical analysis confirmed by empirical work executed in parallel, that it is possible to develop a fuse link model taking into account the physical phenomena of temperature. Some of the most important tests of the constructed product type are thermal tests. The importance of such tests is indicated, inter alia, by standards, scientific publications and a number of operating experiences of electrical apparatus and switchgear devices.
The presented research showed a high convergence of the results obtained through simulation and empirical research. Therefore, the presented method for modeling electrical devices having a resistive power-breaking nature has been found to be correct. It should be noted that a similar approach can be used successfully in the design of fuse links operated in high-voltage networks. Thermal phenomena, regardless of the voltage level, have the same characteristics and could be analyzed in the same way as presented in this article. Application of the presented approach may also contribute to the work on DC fuses. This type of electrical device is currently experiencing a renaissance in connection with the development of smart networks based largely on renewable energy sources. Furthermore, in this type of network, the method of studying thermal phenomena may be similar to that presented in this article.
The authors did not reduce the thermal analysis only to the presentation of the results concerning the contact (insert knives). Six places on the apparatus were chosen for thermal analysis. The results were consistent across all comparative tables. The graphs (Figure 4 and Figure 11) which show the waveforms from simulations and empirical tests indicate not only similar values of the set temperature but also the nature of the changes.
The aim of the simulation and research in the field of currents higher than the rated one was the fact that, in the case of fuse links, the current flow may be even up to several percent greater than the nominal current. Therefore, the simulation process for 110- and 120-A currents was repeated. The actual tests (Figure 5 and Figure 6) were drafted to validate the results. In this case, the authors also obtained coherent results.
Undoubtedly, the added value of the presented approach to prototyping an electrical apparatus, which is a fuse link, is the ability to observe power losses and current density distribution over time. On this basis, already at the stage of preliminary assessments, it is possible to influence the shape of the fuse link and the outline dimensions of the apparatus body. The presented approach shortens the time between the conceptual work and product implementation. This allows for a quick response to the needs of consumers. In addition, it reduces material costs and environmental burden due to the construction of numerous prototypes.
The presented modeling method may be useful not only in scientific research but also in engineering. Looking at Figure 4 and Figure 10, one can notice such a large convergence of characteristics that in the conditions of quick engineering check, a graphical method could be used. Figure 12 shows the idea of obtaining the temperature determined on the basis of only part of the test (the test shortened to the beginning of the formation of the temperature characteristics).
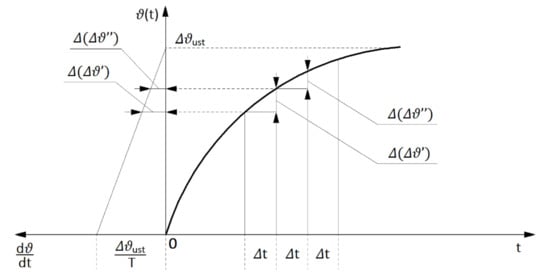
Figure 12.
Graphical method of determining the value of the set temperature rise on the basis of a partial sample.
In order to quickly and precisely determine the set temperature, it is enough to use the presented modeling method. Shorten the simulation time to the necessary minimum (so as to be able to determine the temperature from the graphical method) and effectively use the presented approach.
8. Conclusions
Fuse links thermal analysis is an important aspect for scientific and engineering purposes. In order to better understand the phenomena occurring during fuse link thermal analysis, a detailed FEM was procured. The FEM was validated by empirical results. The validation showed that the derived results are valuable in terms of enhancing the design methods. The model itself can be described as functional and accurate in terms of the transient thermal analysis of fuse links. Therefore, it can be stated that the proposed model is a valuable asset that can reduce costs and simplify and accelerate works concerning research on new types of fuse links. An important aspect was the fact that validation was obtained from two independent sources, which makes this work significant. A crucial fact is that the introduced model is transient, but it can also be used for steady-state analysis. Electrical systems exploited in the world are focusing on power loss analysis. The fuse link FEM procured by our team was also made in order to calculate power losses for different conditions. This objective was not the primary one, but still it is essential in view of reducing electrical systems’ exploitation costs.
Author Contributions
Conceptualization, M.S., S.Ł., Ł.K. (Łukasz Kolimas), Ł.K. (Łukasz Kozarek), D.D.R., A.S. and T.Ż.; data curation, M.S., S.Ł., Ł.K. (Łukasz Kolimas), Ł.K. (Łukasz Kozarek), D.D.R., A.S. and T.Ż.; formal analysis, M.S., S.Ł., Ł.K. (Łukasz Kolimas), Ł.K. (Łukasz Kozarek), D.D.R., A.S. and T.Ż.; investigation, M.S., S.Ł., Ł.K. (Łukasz Kolimas), Ł.K. (Łukasz Kozarek), D.D.R., A.S. and T.Ż.; methodology, M.S., S.Ł., Ł.K. (Łukasz Kolimas), Ł.K. (Łukasz Kozarek), D.D.R., A.S. and T.Ż.; project administration, M.S., S.Ł., Ł.K. (Łukasz Kolimas), Ł.K. (Łukasz Kozarek), D.D.R., A.S. and T.Ż.; resources, M.S., S.Ł., Ł.K. (Łukasz Kolimas), Ł.K. (Łukasz Kozarek), D.D.R., A.S. and T.Ż.; supervision, M.S., S.Ł., Ł.K. (Łukasz Kolimas), Ł.K. (Łukasz Kozarek), D.D.R., A.S. and T.Ż.; validation, M.S., S.Ł., Ł.K. (Łukasz Kolimas), Ł.K. (Łukasz Kozarek), D.D.R., A.S. and T.Ż.; visualization, M.S., S.Ł., Ł.K. (Łukasz Kolimas), Ł.K. (Łukasz Kozarek), D.D.R., A.S. and T.Ż.; writing—original draft preparation, M.S., S.Ł., Ł.K. (Łukasz Kolimas), Ł.K. (Łukasz Kozarek), D.D.R., A.S. and T.Ż.; writing—review and editing, M.S., S.Ł., Ł.K. (Łukasz Kolimas), Ł.K. (Łukasz Kozarek), D.D.R., A.S. and T.Ż. All authors have read and agreed to the published version of the manuscript.
Funding
This research received no external funding.
Institutional Review Board Statement
Not applicable.
Informed Consent Statement
Not applicable.
Data Availability Statement
Not applicable.
Conflicts of Interest
The authors declare no conflict of interest.
References
- Demir, M.; Kahramanoğlu, G.; Yıldız, A.B. Calculating of fuse melting point for power electronics circuits by inrush energy and determination of the eligibility. In Proceedings of the 2016 18th European Conference on Power Electronics and Applications (EPE’16 ECCE Europe), Karlsruhe, Germany, 5–9 September 2016; pp. 1–6. [Google Scholar] [CrossRef]
- Tong, J.; Zou, Y. Design of a fuse-time testing system on STM32. In Proceedings of the 2013 International Conference on Computer Sciences and Applications, Wuhan, China, 17–19 October 2013; pp. 406–409. [Google Scholar] [CrossRef]
- Farahani, H.F.; Asadi, M.; Kazemi, A. Analysis of thermal behavior of power system fuse using finite element method. In Proceedings of the 2010 4th International Power Engineering and Optimization Conference (PEOCO), Shah Alam, Malaysia, 23–24 June 2010; pp. 189–195. [Google Scholar] [CrossRef]
- Li, D.; Qi, L. Energy based fuse modeling and simulation. In Proceedings of the 2013 IEEE Electric Ship Technologies Symposium (ESTS), Arlington, VA, USA, 22–24 April 2013; pp. 487–492. [Google Scholar] [CrossRef]
- Tanaka, T.; Yamasaki, M. Modeling of fuses for melting time and fusing current analysis; INTELEC 2004. In Proceedings of the 26th Annual International Telecommunications Energy Conference, Chicago, IL, USA, 19–23 September 2004; pp. 671–675. [Google Scholar] [CrossRef]
- Pihler, J.; Stegne, M.; Kitak, P.; Glotic, A.; Fluher, B.; Ticar, I.; Voršic, J. Fuse application in medium voltage switchgear. In Proceedings of the 9th International Conference on Electric Fuses and their Applications (ICEFA), Maribor, Slovenia, 12–14 September 2011; pp. 110–118. [Google Scholar]
- Grass, N. Protection of power electronic multi converter systems in AC and DC applications. In Proceedings of the 10th International Conference on Electric Fuses and their Applications, Frankfurt am Main, Germany, 14–16 September 2015; Dresden University of Technology: Dresden, Germany, 2015; pp. 1–5. [Google Scholar]
- IEEE. C37.42-2009—IEEE Standard Specifications for High-Voltage (>1000 V) Expulsion-Type Distribution-Class Fuses, Fuse and Disconnecting Cutouts, Fuse Disconnecting Switches, and Fuse Links, and Accessories Used with These Devices; IEEE: New York, NY, USA, 2010. [Google Scholar] [CrossRef]
- Kolimas, Ł.; Łapczyński, S.; Szulborski, M.; Świetlik, M. Low voltage modular circuit breakers: FEM employment for modeling of arc chambers. Bull. Polish Acad. Sci. Techn. Sci. 2020, 68, 61–70. [Google Scholar]
- Gómez, J.C.; Tourn, D.H. gPV fuse: Special characteristics for photo voltaic cells protection. In Proceedings of the 9th International Conference on Electrical Fuses and their Applications (ICEFA), Maribor, Slovenia, 12–14 September 2011; pp. 1–9. [Google Scholar]
- Gomez, J.C.; Tourn, D.; Nesci, S.; Zamarillo, G.R. PV cells protection by using class PV fuses. IEEE Lat. Am. Trans. 2013, 11, 531–537. [Google Scholar] [CrossRef]
- Plesca, A.; Mihet-Popa, L. Thermal analysis of power rectifiers in steady-state conditions. Energies 2020, 13, 1942. [Google Scholar] [CrossRef]
- Zhang, Y.; Su, J.; Zheng, L.; Li, R.; Yu, B.; Shang, W. Analysis of high-voltage DC fuse’s ageing characteristics under the overload pulse current carrying mode and the caused short-circuit failure in series-resonant converter power source. Int. J. Elect. Power 2020, 117, 1–10. [Google Scholar] [CrossRef]
- Pochanke, Z.; Daszczyński, T.; Kolimas, Ł. Uncertainty of the characteristics of electrical devices based on the measurements of the time-current characteristics of MV fuses. Bull. Polish Acad. Sci. Tech. Sci. 2020, 68, 751–757. [Google Scholar]
- Gräf, T.; Kunze, A. Damage avoidance due to the use of high voltage fuses and temperature monitoring. In Proceedings of the 10th International Conference on Electric Fuses and their Applications, Frankfurt am Main, Germany, 14–16 September 2015; Dresden University of Technology: Dresden, Germany, 2015; pp. 1–7. [Google Scholar]
- Plesca, A. Numerical analysis of thermal behaviour of DC fuse. Energies 2020, 13, 3736. [Google Scholar] [CrossRef]
- Sarajlic, M.; Hribernik, M.; Kitak, P.; Pihler, J. LV melting fuse convection factor calculation using an optimization algorithm. In Proceedings of the 11th International Conference on Electric Fuses and their Applications, Egaleo, Greece, 16–19 September 2019; ICEFA: Athena, Greece, 2019; pp. 1–5. [Google Scholar]
- Wilkins, R. Robust fuse design. In Proceedings of the 9th International Conference on Electrical Fuses and their Applications (ICEFA), Maribor, Slovenia, 12–14 September 2011; pp. 46–52. [Google Scholar]
- Yang, C.P.; Ball, R.; Mcgordon, A.; Dhadyalla, G. Simulation methodologies to support novel fuse design for energy storage systems using COMSOL. In Proceedings of the IET Hybrid and Electric Vehicles Conference (HEVC 2013), London, UK, 6–7 November 2013; pp. 1–5. [Google Scholar]
- Braga, G.; Zanin, A.; Peres, A.; Ghendy, C. Curve fitting analysis of expulsion fuse links through the cross-validation technique. In Proceedings of the 2018 IEEE PES Transmission & Distribution Conference and Exhibition—Latin America (T&D-LA); IEEE, Lima, Peru, 18–21 September 2018. [Google Scholar]
- Łapczyński, S.; Szulborski, M.; Kolimas, Ł.; Kozarek, Ł.; Gołota, K. Mechanical and electrical simulations of tulip contact system. Energies 2020, 13, 5059. [Google Scholar] [CrossRef]
- Wang, J.; Zhiyuan, L. Vacuum type high voltage fuse for external protection of shunt capacitors. In Proceedings of the 8th International Conference on Electric Fuses and their Applications, Clermont-Ferrand, France, 10–12 September 2007; IEEE: New York, NY, USA, 2007; pp. 98–102. [Google Scholar]
- He, H.; Wang, J.A. High voltage vacuum type hybrid current limiting fuses for double protection of the shunt power capacitors. In Proceedings of the 8th International Conference on Electric Fuses and their Applications, Clermont-Ferrand, France, 10–12 September 2007; IEEE: New York, NY, USA, 2007; pp. 42–46. [Google Scholar]
- Sakuraba, T.; Chen, S.; Gerlaud, A.; Milliere, L. Current distribution of high speed parallel dc fuses for hvdc protection. In Proceedings of the 10th International Conference on Power Electronics ECCE ASIA, Busan, Korea, 27–30 May 2019; pp. 3303–3308. [Google Scholar]
- Szulborski, M.; Łapczyński, S.; Kolimas, Ł.; Kozarek, Ł.; Rasolomampionona, D.D. Calculations of electrodynamic forces in three-phase asymmetric busbar system with the use of FEM. Energies 2020, 13, 5477. [Google Scholar] [CrossRef]
- Kühnel, C.; Schlegel, S.; Großmann, S. Investigations on the long-term behavior and switching function of fuse-elements for NH-fuse-links (gG) at higher thermal stress. In Proceedings of the 2017 6th International Youth Conference on Energy (IYCE), Budapest, Hungary, 21–24 June 2017. [Google Scholar]
- De Tommasi, L.; Magnani, A.; De Magistris, M. Advancements in the identification of passive RC networks for compact modeling of thermal effects in electronic device s and systems. Int. J. Num. Modell. Electron. Netw. Devic. Fields 2018, 31, e2296. [Google Scholar] [CrossRef]
- Kumar, A. Electro-thermal Characterizations, Compact Modeling and TCAD based De-vice Simulations of advanced SiGe:C BiCMOS HBTs and of nanometric CMOS FET. Micro andnanotechnologies/Microelectronics. Ph.D. Thesis, Université Bordeaux 1 Sciences et Technologie, Bordeaux, France, 2012. [Google Scholar]
- Di Napoli, F.; Magnani, A.; Copola, M.; Guerriero, P.; D’Alessandro, V.; Codecasa, L.; Tricoli, P.; Daliento, S. On-line junction temperature monitoring of switching devices with dynamic compact thermal models extracted with model order reduction. Energies 2017, 10, 189. [Google Scholar] [CrossRef]
- Zhan, Y.; Kumar, S.V.; Sapatnekar, S.S. Thermal Aware Design; Foundations and TrendsR©inElectronic Design Automation: Delft, The Netherlands, 2007; Volume 2, pp. 255–370. [Google Scholar]
Publisher’s Note: MDPI stays neutral with regard to jurisdictional claims in published maps and institutional affiliations. |
© 2021 by the authors. Licensee MDPI, Basel, Switzerland. This article is an open access article distributed under the terms and conditions of the Creative Commons Attribution (CC BY) license (http://creativecommons.org/licenses/by/4.0/).