Abstract
In this study, changes in the droplet formation mechanism and the law of droplet length in a two-phase liquid–liquid system in 400 × 400 μm standard T-junction microchannels were experimentally studied using a high-speed camera. The study investigated the effects of various dispersed phase viscosities, various continuous phase viscosities, and two-phase flow parameters on droplet length. Two basic flow patterns were observed: slug flow dominated by the squeezing mechanism, and droplet flow dominated by the shear mechanism. The dispersed phase viscosity had almost no effect on droplet length. However, the droplet length decreased with increasing continuous phase viscosity, increasing volume flow rate in the continuous phase, and the continuous-phase capillary number Cac. Droplet length also increased with increasing volume flow rate in the dispersed phase and with the volume flow rate ratio. Based on the droplet formation mechanism, a scaling law governing slug and droplet length was proposed and achieved a good fit with experimental data.
1. Introduction
Since micro-electro-mechanical systems (MEMS) were proposed, natural science and engineering technology began to move towards the development of miniaturization. The field of microfluidics has become a research hotspot. In 1990, Manz et al. proposed the concept of micro total analysis systems [1]. Since then, there has been growing interest in academic research and practical application of microfluidics [2,3,4,5,6,7].
With the development of microfluidic technology, microfluidic devices have become widely used in multiphase flow processes due to their many advantages, such as miniaturization, high mass and heat transfer performance, enhanced mixing, rapid reaction, energy and raw material saving, higher stability and safety, and ease of replication. Compared with other forms of multiphase microfluidics, liquid–liquid multiphase microfluidic droplets have an additional radial inner vortex and a larger surface area to volume ratio, both of which facilitate enhanced mixing and mass transfer [8,9]. Therefore, liquid–liquid multiphase transport in microchannels has become an important topic in many fields, such as microchemical reactions [10,11,12,13], extraction [14,15,16], oil recovery [17,18], fuel cells [19], microchannel heat transfer [20,21,22,23], carbon capture [24,25], drug transport [26,27], lab on a chip [28,29,30,31], and others.
The key points of liquid–liquid processing in microfluidic devices are flow pattern control and droplet transportation. For immiscible liquids, slug flow is preferred because of the larger surface area to volume ratio, shorter transmission path, and stronger recirculation. Therefore, an in-depth understanding of flow patterns and slug hydrodynamic characteristics is crucial to the design and optimization of ideal devices. In liquid–liquid flows, one liquid phase is usually called the dispersed phase and the other the continuous phase. The latter continuously flows through the main microchannel and is in contact with the channel wall. With reference to [32,33], several common liquid–liquid flow patterns were observed in microchannels, such as annular flow, parallel flow, deformed interface flow, slug flow, and droplet flow. The formation and stability of flow patterns are influenced by several parameters, including microchannel inlet junctions [34,35,36], microchannel shape and size [37,38,39,40,41], physical properties of both phases [42,43,44], and wettability of microchannel walls [45].
As mentioned above, flow patterns are determined by several factors. The principle behind these factors is the force that dominates the flow pattern. In general, the interfacial tension force, inertial force, and shear force (viscous force) lead to flow pattern transitions. The capillary number () reflects the influence of surface tension on liquid flow, and is proportional to the ratio of viscous force to surface tension. Weber number () represents the ratio of inertial force and surface tension effect. Therefore, dimensionless analysis is an effective method for depicting flow patterns. Zhao et al. [32] studied the kerosene-water flow in a rectangular polymethyl methacrylate (PMMA) microchannel and proposed that interfacial tension force and inertial force were the main forces determining the flow pattern. The Weber number (We) is used to describe the flow pattern. When the viscous force is the main force balancing the interfacial tension in more viscous systems, capillary number (Ca) and Reynolds number (Re) are often used at each stage due to their different roles in flow pattern transformation [42,46,47,48]. Dessimoz et al. [49] proposed that the formation of slug flow and parallel flow is controlled by the competition between viscous force and interfacial tension force. A model based on capillary number and Reynolds number was established to predict the dependence of flow patterns on fluid properties. Further dimensionless analysis was performed by Yagodnitsyna et al. [50]. A combined dimensionless number, the Weber number × the Ohm number (We × Oh), has been proposed in the literature to predict flow patterns. According to Cao et al. [43], two sets of scaling laws on slug hydrodynamics involving Re and We were proposed by multiple regression for slug-to-annular flow transition and slug-to-droplet flow transition, respectively. In addition to force, Fu et al. also considered the aspect ratio and roughness of the microchannels [38]. Considering liquid properties, channel size, and aspect ratio, the flow pattern transitions were successfully predicted by multiple regression. However, these conclusions have not been further validated in the published literature. These comments indicate that substantial efforts remain to be made in this field.
Up to now, most studies of liquid–liquid two-phase flow in microchannels have been based on different inlet junctions (T-junction [12,30,51], cross-junction [52,53], and Y-junction [54,55]). These are used to analyze the droplet formation/breakup process, droplet length, velocity, two-phase flow pattern, and other aspects of the system formed by two-phase fluids (Newtonian and non-Newtonian [38]) with different physical properties. T-junction microchannels are widely used in droplet generation devices due to their simple structure. According to the included angle between the dispersed and continuous phases at the microchannel inlet, they can be divided into two types: convective T-type (included angle 180°) and standard T-type (included angle 90°). Garstecki et al. [28], Guo and Chen [56], and De Menech et al. [57] analyzed the droplet formation process in a standard T-junction microchannel by numerical simulation and pointed out two main droplet formation mechanisms: squeezing and shear. The experimental results of Yao et al. [51] showed that for a convective T-junction microchannel, when the continuous phase could not properly wet the channel wall, the critical capillary number for the transformation from squeezing to shear mechanism in the droplet formation process decreased. Droplet length is directly related to the heat and mass transfer characteristics of the micro-droplets, as reported by Wu et al. [52]. Xu et al. [48], Yao et al. [51], Christopher [58], Garstecki et al. [28], and Wei et al. [59] analyzed the variation laws of droplet length in microchannels and used the continuous phase capillary number and the volume flow ratio (the ratio of dispersed phase velocity to continuous phase velocity) to fit the droplet length scaling law.
As stated above, although there are studies on two-phase flow pattern conversion and microchannel inlet junctions in the existing literature, most of the works focused on the gas-liquid two-phase flow under the standard T-type microchannel. Therefore, the liquid–liquid two-phase flow in the convective T-type microchannel still needs to be studied in depth. Moreover, most studies have involved only low-viscosity fluids as the dispersed and continuous phases. The effects of the dispersed phase with high viscosity on the flow patterns and characteristics of liquid–liquid two phases flows in microchannels have not been fully studied. Based on these facts, this study aimed to analyze the droplet formation laws in the convective T-junction microchannel with two kinds of high-viscosity silicone oil as the dispersed phase and 0.5 wt % sodium dodecyl sulfate (SDS) as the continuous phase. Another experiment involved silicone oil with a viscosity of 20 cs as the dispersed phase and a glycerol aqueous solution of 20% and 40%, respectively, with 0.5 wt % SDS as the continuous phase. As a result, scaling laws for slug and droplet length in a convective T-junction have been proposed.
2. Experimental Method
2.1. Experimental Setup
Figure 1 shows a schematic diagram of the experimental setup and the geometric details of the tested microchannel. A convective T-junction microchannel (w × h = 400 × 400 μm) fabricated on a PMMA plate by micromachining technology was used as the reactor and was sealed by another PMMA cover plate. To form a closed microchannel section for fluid passage, screw fittings were used to perforate the edges of both plates. The dispersed phase (silicone oil) and continuous phase (distilled water with SDS) were delivered by two high-precision syringe pumps (LSP01-1A, LongerPump, Baoding, China) to the convective T-junction microchannel. A collector was also set up to collect the waste liquid. A high-speed camera (Photron Nova S6, Tokyo, Japan) connected to a computer was placed directly above the microchannel to record the flow pattern of the immiscible liquids (silicone oil and water). A 150 W light source was used to provide the illumination intensity needed for clear image recording.
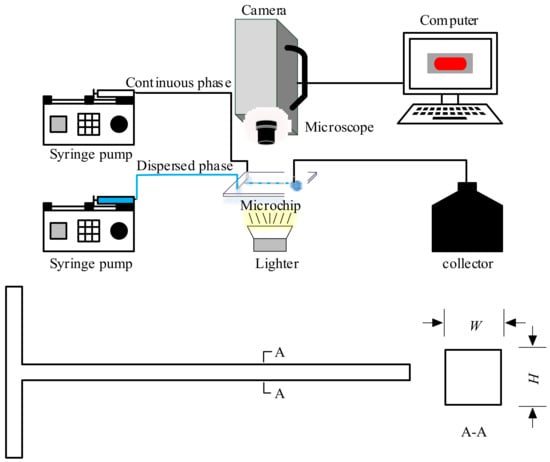
Figure 1.
Schematic diagram of the experimental setup and geometry of the tested microchannel.
2.2. Materials
In the present study, two sets of experiments were performed. To investigate the influence of dispersed phase viscosity on droplet formation, two pairs of immiscible liquid–liquid systems were tested. Water was used as the continuous phase, and silicon oils with different viscosities were used as the dispersed phase. To explore the influence of continuous phase viscosity on droplet formation, two groups of experiments were set up. A glycerol aqueous solution with different mass fractions of 0.5% SDS was used as the continuous phase, and silicone oil with a viscosity of 20 cs was used as the dispersed phase. Table 1 gives the physical properties of the fluids (dynamic viscosity μ, density ρ and surface tension σ). The liquid phase viscosity was measured by a viscometer (LVDV-II, Brookfield, USA) at room temperature. The interfacial tension of the dispersed phase (silicon oil) in the continuous phase (water) was measured by an interfacial tensiometer (DCAT11EC, Dataphysics, Germany) with the Du Nouy ring method.

Table 1.
Liquid properties.
2.3. Experimental Procedure
To prevent the silicone oil from accumulating in the corner of the microchannel, the microchannel needed to be initially saturated by water before the experiments began. The continuous phase (water) must fill the channel before the dispersed phase (silicon oil) is injected. The volumetric flow rate of the dispersed phase should be kept constant while increasing the volumetric flow rate of the continuous phase. During the experiment, the volumetric flow rate ranges of the dispersed and continuous phases were qd = 1–10 mL/h, qc = 5–200 mL/h, and the main flow patterns observed were slug flow, droplet flow, and jet flow. A high-speed camera was located 60 mm downstream of the inlet, and snapshots of flow patterns were captured once the flow pattern was stable. In this study, the Canny edge detection algorithm in MATLAB was used to process the image, obtain the flow pattern contour lines, and determine the droplet length L according to the corresponding pixel values and the actual size, as shown in Figure 2. The lengths were extracted and averaged from 50 snapshots. After the experiment, the microchannels must be thoroughly cleaned to remove residual chemicals and then dried when replacing the silicone oil with one of a different viscosity. According to the experimental results of three pairs of liquid–liquid systems, a proportional law governing the slug flow and droplet flow lengths was proposed and was further validated by existing literature data.
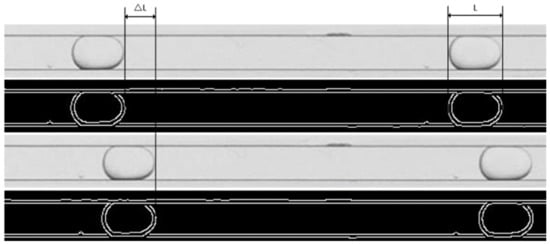
Figure 2.
Experimental image processing.
3. Results and Discussion
To observe a stable flow pattern, the camera was located 60 mm downstream from the inlet, where the flow was fully developed. The immiscible liquid–liquid flow patterns in the microchannel generally included annular flow, slug flow, and droplet flow. For example, the flow pattern observed in the silicone oil-water system is shown in Figure 3. It was assumed that a more complete flow pattern could be detected if the volumetric flow rate of one fluid in the two phases was continuously increased over a large range. Due to camera performance limitations, increasing the flow rate caused the view to become blurry, and the captured snapshots could not be processed accurately. Therefore, experimental data on jet flow were limited. This work focuses on slug flow and droplet flow.
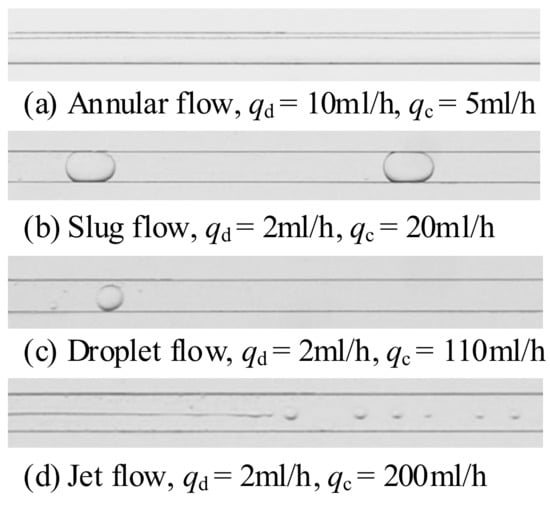
Figure 3.
Flow patterns of silicone oil-water system.
Annular flow (Figure 3a) was observed when the flow ratio was large (the ratio of dispersed phase flow rate to continuous phase flow rate). In this regime, the inertial force of the dispersed phase cannot be ignored and plays a leading role in the liquid–liquid system, so that the dispersed phase can maintain continuous flow in the microchannel without being cut off by the continuous phase (water). The dispersed phase flowed continuously in the core of the microchannel, and the continuous phase flowed around the discrete phase near the wall of the microchannel. In some cases, slight waviness could be observed at the interface, which was also reported in [47]. This waviness was caused by Kelvin–Helmholtz instability due to the flow rate difference across the interface between the two fluids.
As the flow ratio continued to decrease due to the gradual increase in amplitude, the dispersed phase was finally cut off by the continuous phase, and slug flow formed (Figure 3b). Slug flow was observed over a wide range of flow rates, and the flow rates of the two fluids were comparable. In this regime, the interfacial tension force was the dominant force that determined the formation of flow patterns. The dispersed phase broke up into a slug flow at the microchannel junction or after flowing over a certain distance, depending on the condition of the liquid–liquid system. The continuous phase fluid still flowed around the slug flow and formed a film between the interface and the microchannel wall surface. Normally, it has been generally believed that the length of the slug flow should be greater than the hydraulic diameter of the microchannel, and that otherwise it could be considered as droplet flow.
When the flow ratio was small enough with a high flow rate of the continuous phase, the shear force dominated the formation of flow patterns. Under the violent impact of two fluids, the dispersed phase was easily broken into droplets by the action of shear force. Because the break time was very short and the dispersed phase did not have enough time to fill the junction of the microchannel, the droplets were often much smaller than the slugs (Figure 3c). Normally, the length of the droplet flow is less than the hydraulic diameter.
After the droplet flow has formed, jet flow will be formed as the flow rate of the continuous phase continues to increase (Figure 3d). Due to the high momentum of the continuous phase, the shear and drag forces of the continuous phase will jointly dominate the formation of flow patterns. The drag forces caused the dispersed phase fluid to be drawn thin and long and to flow away from the wall in the core of the microchannel, after which the shear forces rapidly cut up the elongated dispersed phase. This produced jets that were much smaller than droplets.
3.1. Flow Pattern Maps
In the present work, water (0.5 wt % SDS) was used as the continuous phase, and silicone oil was used as the dispersed phase. Figure 4 shows a flow pattern map of the 60 cs silicone oil-water system in a 400 × 400 μm convection T-junction microchannel. qd and qc are the volume flow rate of the dispersed and continuous phase, respectively. During the experiment, the two-phase volume flow rate range was qd = 1–10 mL/h, qc = 5–200 mL /h.
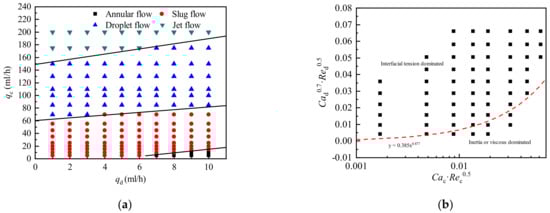
Figure 4.
Flow pattern map of the 60 cs silicone oil-water system in a convection T-junction microchannel. (a) Flow pattern with two-phase flow as the coordinate; (b) Flow pattern with composite dimensionless numbers as coordinates.
Figure 4a shows that as qd increases, the flow pattern transition lines all move upwards, and as qc increases, the flow pattern transitions from annular flow to slug flow, droplet flow, and jet flow in sequence. An increase in the flow rate of the dispersed phase will delay the droplets from entering the next flow pattern, whereas an increase in the flow rate of the continuous phase will promote the flow pattern transition. Therefore, the flow pattern transition is mainly affected by the two-phase flow rate. Zhang et al. [12] concluded that the flow pattern is coupled by various parameters, such as fluid viscosity, interfacial tension, and microchannel size. Therefore, it is not universally applicable to divide flow patterns solely by independent dimensionless numbers such as Ca or Re. Due to the fixed microchannel structure and size, the formation of droplets is mainly controlled by the two-phase physical parameters and the two-phase interaction force. A composite dimensionless number was constructed in the form of Ca·Re to describe the flow pattern transition of liquid–liquid two-phase flow in the convective T-shaped microchannel. Zhang et al. [12] proposed an expression for the conversion boundary:. As shown in Figure 4b, the expression also has a good prediction in the present experiments. The area above the dividing line is the slug flow dominated by surface tension. As the velocity of the dispersed phase increases, the flow pattern will change to the annular flow dominated by the inertial force of the dispersed phase.
To further study the influence of the dispersed phase viscosity on the flow pattern transition, two silicone oils of different viscosities (20 and 60 cs) were used as the dispersed phase for the experiment. Figure 5 shows the flow pattern transition lines of three viscosity systems under the flow pattern of the 60 cs silicone oil-water system. As the viscosity of the dispersed phase increases, the annular flow area increases slightly in the flow pattern map shown in Figure 5. The viscosity of the dispersed phase has no effect on the process of transforming the droplet flow into the jet flow. At this time, the dominant force of flow is the shear force of the continuous phase, and the viscosity change of the dispersed phase has little effect on the flow pattern transition. However, the pattern transition lines are close to each other and are independent of the dispersed phase viscosities.
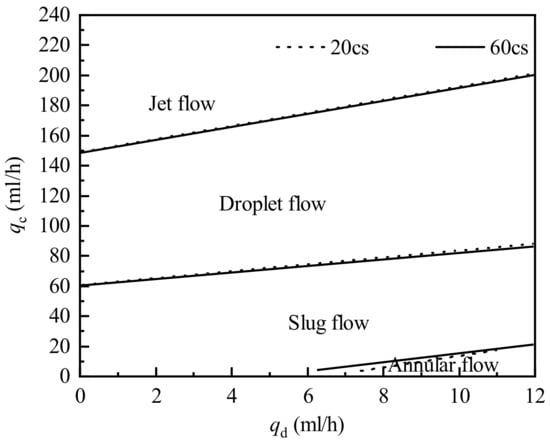
Figure 5.
Flow pattern transition lines of three viscosity systems.
3.2. Basic Flow Pattern Formation Processes
In this study, the formation processes of slug flow, droplet flow, and jet flow were observed and analyzed. Figure 6 shows the formation processes of three flow patterns in a water-silicone oil system as obtained by a high-speed camera.
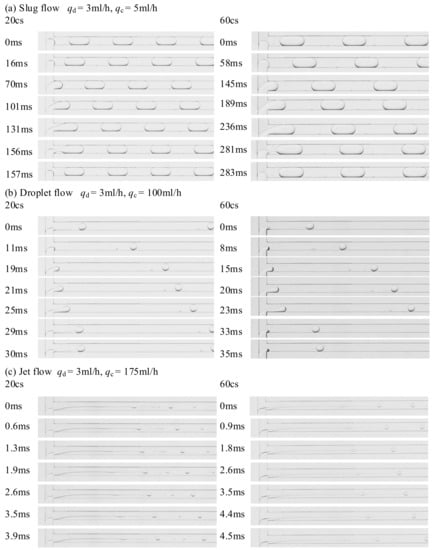
Figure 6.
Flow pattern formation processes using two dispersed phases with different viscosities.
Figure 6a shows that slug flow occurs when the two-phase flow rate ratio q (the ratio between the volume flow rate of the dispersed phase and the continuous phase, namely q = qd/qc) is higher, and the flow rate of the continuous phase is lower. It can be seen from the Figure 6 that as the viscosity of the dispersed phase increases, the droplet generation time increases slightly. However, the droplet formation processes under different dispersed phase viscosities are nearly identical. The formation process can be divided into three stages: expansion, squeezing, and break. During the expansion stage, the dispersed phase gradually fills the inlet of the convective T-junction microchannel (0 ms). Then it continues to expand at the microchannel inlet until it blocks the main channel (16 ms). After this, the dispersed phase continues to grow downstream under the balance of the two-phase force (16–101 ms). At 101 ms, the phase interface of the dispersed phase neck is elongated until it almost breaks. This process is part of the squeezing stage. When the neck of the dispersed phase collapses and breaks at a nearly constant frequency (101–156 ms), the formation process moves into the break stage. Under the action of interfacial tension, the broken slug droplet gradually shrinks back to form a spherical shape and tends to become stable. The dispersed phase gradually retracts to the inlet, accumulates energy, and expands again (156–157 ms).
As it can be seen from Figure 6b,c, droplet flow and jet flow mainly occur in the case of low two-phase flow rate ratio, and the continuous phase flow rate required for the formation of jet droplets is higher than that for droplets. The complete formation process can also be divided into three stages. Unlike the slug flow formation process, the dispersed phase does not block the main channel during formation of droplets and jet flows. The continuous phase shears the dispersed phase mainly depending on the shear force between the two-phase interfaces, but not depending on the pressure difference formed between upstream and downstream due to channel blockage.
Looking at Figure 6a–c, the formation positions and formation times of the three flow patterns are clearly different. Slug flow is generally formed at the main channel inlet, droplet flow is formed on the main channel wall that is close to the dispersed phase, and jet flow is formed in the center of the main channel, farther from the main channel inlet. Slug flow has the longest formation time. When the dispersed phase flow rate qd = 3 mL/h and the continuous phase flow rate qc = 5 mL/h, the formation time is 157 ms. The formation times of droplet flow and jet flow are 30 ms (qc = 100 mL/h) and 3.9 ms (qc = 175 mL/h), respectively.
3.3. Analysis of Influencing Factors on Slug and Droplet Length
As mentioned above, flow patterns are affected by two-phase flow parameters, two-phase physical properties, and inertial force, viscous force, interfacial tension, and other forces. The study of two-phase flow rate, flow rate ratio, and continuous phase capillary number is likely to yield the scaling laws of slug and droplet length. Formation of slug flow was observed in the experiment when Cac < 0.01 and the length Ld was mostly greater than 0.48 mm, namely when Ld/W > 1.2. Droplet flow formation mainly occurred at Cac > 0.015 when the droplet length Ld was generally less than 0.4 mm, namely when Ld/W < 1. When Cac was between 0.01 and 0.015, a slug-to-droplet transition flow resulted.
In current research, few people have paid attention to the effect of dispersed phase viscosity on droplet length. In this study, the effect of dispersed phase viscosity on droplet length in the silicone oil-water system was studied by changing the viscosity of the dispersed phase. Figure 7 shows the scaling laws of droplet length in the silicone oil-water system with different viscosities.
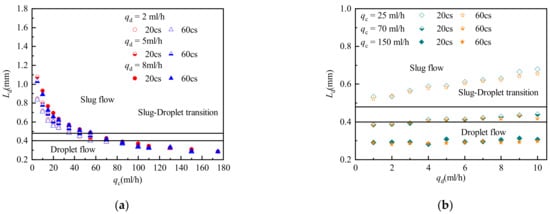
Figure 7.
Droplet length in a silicone oil-water system with different viscosities. (a) Influence of qc on droplet length under different viscosity of silicone oil; (b) Influence of qd on droplet length under different viscosity of silicone oil.
Figure 7 shows that silicone oil viscosity has little effect on droplet length. Only in the slug flow region does the droplet length decrease slightly with increasing silicone oil viscosity, when the continuous phase flow rate is low and the dispersed phase flow rate is high. As the silicone oil viscosity increases, the interfacial tension decreases. The droplet formation time decreases with decrease of the interfacial tension, resulting in shorter droplets for cases with lower interfacial tension. This reduces the droplet length of a slug flow dominated by interfacial tension. However, it has almost no effect on the droplet length of a droplet flow dominated by shear forces. On the other hand, the increased viscosity of the dispersed phase will make itself more difficult to be sheared. The contradiction between these two effects results in no significant change in the droplet length.
In this study, two groups of experiments were conducted, in which two different mass fraction glycerol aqueous solutions with 0.5% SDS were used as the continuous phase and silicone oil with a viscosity of 20 cs was used as the dispersed phase. Figure 8a,b respectively shows the droplet length versus continuous phase capillary number Cac and droplet length versus continuous phase viscosity. Figure 8a shows the effect of continuous phase viscosity on droplet length. Droplet length was found to decrease with increasing continuous phase viscosity. Figure 8b shows that the droplet lengths decreased exponentially with increasing Cac. The droplet length decreased with increasing viscosity, and the area occupied by slug flow decreased accordingly. As stated above, droplet length is significantly affected by continuous phase viscosity because an increase in continuous phase capillary number leads to an increase in the shearing effect of the continuous phase on the dispersed phase, making the droplet easier to break.
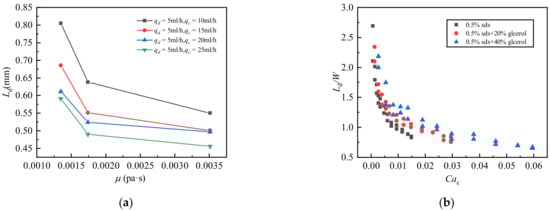
Figure 8.
Droplet length of the silicone oil-glycerol aqueous solution system with different viscosities. (a) Influence of the viscosity of different mass fractions of glycerol on the droplet length; (b) Influence of continuous phase capillary number on droplet length under different mass fractions of glycerol.
Figure 9 shows the influence of two-phase flow rate on droplet length. The droplet length Ld decreases with increasing continuous phase flow rate and increases with increasing dispersed phase flow rate. When the continuous phase flow rate qc > 70 mL/h, the influence of the change of dispersed phase and continuous phase flow rates on droplet length gradually decreases, and the change in droplet length gradually becomes insignificant.
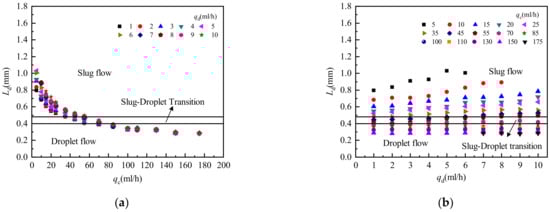
Figure 9.
Influence of two-phase flow rate on droplet length. (a) Influence of continuous phase flow rate on droplet length; (b) The influence of dispersed phase flow rate on droplet length.
Droplet length change is inseparable from the interaction force between the two phases. The flow rate ratio q is used to represent the inertial force between the two phases, and the continuous phase capillary number Cac is used to represent the shear force and the interfacial tension of the two phases. The expressions for q and Cac are:
Figure 10 shows the influence of two-phase flow rate ratio and continuous phase capillary number on droplet length. Figure 10a shows that the dimensionless droplet length Ld/ W increases with an increase in the two-phase flow rate ratio q. When q is small, the droplets form a droplet flow with a shorter dimensionless droplet length, and the rate of increase in the growth of q becomes larger. With increasing q, the droplet length increases gradually, and the flow pattern changes from droplet flow to transition flow and then to slug flow. In the slug flow region, the dimensionless droplet length increases slowly with increasing q, but the influence of q on slug flow is less than that on droplet flow. Figure 10b shows that the dimensionless droplet length Ld/ W decreases with an increase in the continuous phase capillary number Cac. When Cac is small, the flow pattern is slug flow, and Ld/ W decreases faster with increasing Cac, indicating that Cac has a greater influence on the length of slug flow. It is also apparent that Cac has little influence on droplet flow.
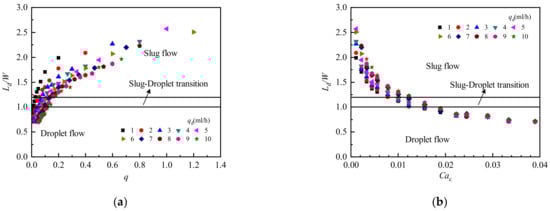
Figure 10.
Influence of two-phase flow rate ratio and continuous phase capillary number on droplet length. (a) Influence of two-phase flow rate ratio on droplet length; (b) Influence of continuous phase capillary number on droplet length.
3.4. Scaling Law on Slug and Droplet Length
Slug flow and droplet flow are subject to different dominant forces, and therefore the droplet length scaling laws of the two flow patterns should be predicted separately to ensure their accuracy. As previously analyzed, the dimensionless droplet length Ld/W is positively correlated with q and negatively correlated with Cac. Therefore, the dimensionless droplet length can be written as a function of q and Cac where only the coefficients change. The predicted scaling laws for slug flow and droplet flow lengths are shown in Equations (3) and (4), respectively:
Combining the two equations reveals that the coefficient of the two-phase flow ratio q in the predicted scaling law for slug flow length is larger than the coefficient of the predicted scaling law for droplet flow length. This means that two-phase flow rate ratio is the main factor controlling droplet length in slug flow. In droplet flow, the coefficient of the two-phase flow ratio q is far less than the coefficient of the continuous phase capillary number Cac. This indicates that shear forces and interfacial tension are the main factors controlling droplet length in droplet flow.
Figure 10 and Figure 11 show a comparison between experimental and predicted droplet lengths in slug flow and droplet flow.
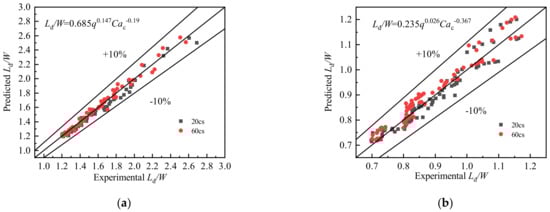
Figure 11.
Comparison between experimental and predicted (a) slug and (b) droplet flow lengths.
Figure 11 shows that the proposed scaling laws for predicting slug and droplet lengths can predict the experimental results well. The slug length and droplet length prediction errors are within ±10%.
To further ensure predictive performance, the mean absolute deviation (MAD) and the mean relative deviation (MRD) were used to describe the fitting effect of the proposed scaling laws. Formulas for MAD and MRD are shown in Equations (5) and (6):
According to the calculated results, the MAD and MRD of the predictive correlation for slug length were 3.4% and −2.2%, respectively, while the MAD and MRD of the predictive correlation for droplet length were 2.8% and 0.8%, respectively. Clearly, the prediction performance of both is excellent.
The experimental data in this paper were then compared with scaling laws mentioned in the literature [46,48,51,59,60,61]. Comparative results for the slug length and droplet length scaling laws are shown in Figure 12. The predicted values using Equations (3) and (4) were also included in this figure to show a clear comparison of these correlations.
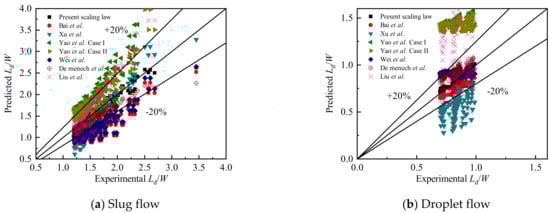
Figure 12.
Comparison between the experimental (a) slug and (b) droplet lengths and predicted values using correlations from other literature and the present work.
Due to the different factors such as the entrance structure of the channel, the cross-sectional structure of the main channel (size, aspect ratio) and the physical properties of the two-phase fluid (viscosity, interfacial tension), the correlation formulas proposed in the previous literatures are different in the prediction of the experimental data. As shown in Table 2, the experimental research of Bai et al. [46] involved high-viscosity fluids, using standard T-junction microchannels with a width and depth of 500 μm. Two-phase viscosity not very different from other literature, did not involve high viscosity fluids. Xu et al. [48] conducted experimental research using a standard T-junction microchannel with a 200 μm (depth) × 150 μm (width) at a two-phase flow rate range of 0.001~0.1m/s. Yao et al. [51] focused on the leakage flow of droplets under a crossing T-junction microchannel with a cross-section of 600 μm (width) × 600 μm (depth). Wei et al. [59] correlated and predicted the droplet size under T-junction microchannels with different aspect ratios. De Menech et al. [60] studied the flow of droplets in a square-section T-junction microchannel. Liu et al. [61] used the capillary number Ca and the two-phase flow ratio q to correlate and predict the droplet generation size in the microchannel with different inlet methods.
Table 2.
Comparison of experimental conditions in the literature.
Table 3 shows the comparison of the prediction correlations of the length of the slug and the droplet. Obviously, for the predicted slug length results, the scaling law by De Menech et al. [60] matches well with the experimental data in this paper, but after calculation, the MAD is still higher than the predicted results proposed in this study. For the predicted droplet length results, the best performing model is the one proposed by Bai et al. [46] However, the MAD is greater than 10%, which is obviously not as good as the prediction performance of the scaling law proposed in this study. In summary, the model proposed in this study can predict slug and droplet length effectively in convection T-junction microchannels.
Table 3.
Comparison of correlation formulas for predicting slug length.
4. Conclusions
In this article, the flow patterns of liquid–liquid two-phase flow and the scaling laws of droplet length in a convection T-junction microchannel were studied. Silicone oil was used as the dispersed phase and water as the continuous phase, and the effects of various factors on liquid–liquid two-phase system flow characteristics were studied. In more detail, the following conclusions were reached:
- By combining the flow pattern formation process and force analysis, the formation mechanisms of various flow patterns (annular flow, slug flow, droplet flow, and jet flow) were studied in this experiment. According to the mechanism forming the flow pattern, the pattern was divided into four categories. Annular flow is dominated by inertial force, slug flow is dominated by interfacial tension, droplet flow is dominated by shear force, and jet flow is controlled by shear force and drag force.
- The effects of various factors on flow pattern transition and droplet length were analyzed by changing the viscosity of the silicone oil and the two-phase flow parameters. The results show that changing the dispersed phase viscosity affects the flow pattern transition processes of annular flow to slug flow and slug flow to droplet flow, but has little effect on slug properties and droplet length. The length is mainly controlled by the flow rate ratio of the two phases and the continuous phase capillary number. The increase in the viscosity of the dispersed phase will increase the droplet generation time slightly. However, the droplet formation processes under different dispersed phase viscosities in the present work are nearly identical.
- Using dimensionless analysis, the droplet fluid dynamics were studied, and different prediction scaling laws were proposed for the slug and droplet lengths formed by different flow patterns. The prediction scaling laws were compared with other literature data to further verify their accuracy. The performance was excellent for the prediction results.
Author Contributions
Conceptualization, L.L. and J.Z.; data curation, L.L., Y.Z., W.C. and H.L.; funding acquisition, J.Z.; methodology, W.C.; project administration, L.L. and J.Z.; software, W.C. and X.W.; supervision, L.L. and X.W.; visualization, Y.Z. and H.L.; writing—original draft, L.L. and Y.Z.; writing—review and editing, Y.Z., H.L. and X.W. All authors have read and agreed to the published version of the manuscript.
Funding
This research was funded by Guangdong Basic and Applied Basic Research Foundation, grant number 2019A1515111116, Key R&D Program of Shandong Province grant number (2019GSF109051, 2019GGX101030), Shandong Provincial Postdoctoral Innovation Project grant number 201902002, and Foundation of Shandong University for Young Scholar’s Future Plans.
Conflicts of Interest
The authors declare no conflict of interest.
Nomenclature
| A | Area, m2 |
| a | Height of the gas phase in the front view, m |
| b | Width of the gas phase in the bottom view, m |
| C0 | Distribution parameter |
| D | Inner diameter, m |
| Ld | Length of the flow domain, mm |
| LO* | Non-dimensional Laplace constant |
| Probability density function | |
| q | Volume flow rate, m3/s |
| S | Slip ratio |
| U | Superficial velocity, m/s |
| V | Volume, m3 |
| x | Gas mass fraction |
| Greek letters | |
| α | Void fraction |
| β | Volumetric gas flow ratio |
| μ | Dynamic viscosity, Pa·s |
| ρ | Density, kg/m3 |
| σ | Surface tension, N/m |
| τ | Time, s |
| Subscripts | |
| cs | Cross-sectional |
| vol | Volumetric |
| g | Gas phase |
| l | Liquid phase |
| m | Mixture of gas and liquid two phases |
| p | Pipe |
| d | Droplet |
References
- Manz, A.; Graber, N.; Widmer, H. Miniaturized total chemical analysis systems: A novel concept for chemical sensing. Sens. Actuators B Chem. 1990, 1, 244–248. [Google Scholar] [CrossRef]
- Bardiya, N.; Choi, J.-W.; Chang, S.-I. Analysis of single nucleotide polymorphism in human angiogenin using droplet-based microfluidics. BioChip J. 2014, 8, 15–21. [Google Scholar] [CrossRef]
- Dittrich, P.S.; Manz, A. Lab-on-a-chip: Microfluidics in drug discovery. Nat. Rev. Drug Discov. 2006, 5, 210–218. [Google Scholar] [CrossRef]
- Du, G.-S.; Pan, J.-Z.; Zhao, S.-P.; Zhu, Y.; Toonder, J.M.D.; Fang, Q. Cell-Based Drug Combination Screening with a Microfluidic Droplet Array System. Anal. Chem. 2013, 85, 6740–6747. [Google Scholar] [CrossRef] [PubMed]
- Günther, A.; Jensen, K.F. Multiphase microfluidics: From flow characteristics to chemical and materials synthesis. Lab Chip 2006, 6, 1487–1503. [Google Scholar] [CrossRef] [PubMed]
- Jensen, K.F. Microreaction engineering—Is small better? Chem. Eng. Sci. 2001, 56, 293–303. [Google Scholar] [CrossRef]
- Zhao, C.-X. Multiphase flow microfluidics for the production of single or multiple emulsions for drug delivery. Adv. Drug Deliv. Rev. 2013, 65, 1420–1446. [Google Scholar] [CrossRef]
- Kinoshita, H.; Kaneda, S.; Fujii, T.; Oshima, M. Three-dimensional measurement and visualization of internal flow of a moving droplet using confocal micro-PIV. Lab Chip 2007, 7, 338–346. [Google Scholar] [CrossRef] [PubMed]
- Song, H.; Bringer, M.R.; Tice, J.D.; Gerdts, C.J.; Ismagilov, R.F. Experimental test of scaling of mixing by chaotic advection in droplets moving through microfluidic channels. Appl. Phys. Lett. 2003, 83, 4664–4666. [Google Scholar] [CrossRef]
- Adamo, A.; Beingessner, R.L.; Behnam, M.; Chen, J.; Jamison, T.F.; Jensen, K.F.; Monbaliu, J.-C.M.; Myerson, A.S.; Revalor, E.M.; Snead, D.R.; et al. On-demand continuous-flow production of pharmaceuticals in a compact, reconfigurable system. Science 2016, 352, 61–67. [Google Scholar] [CrossRef] [PubMed]
- Yao, C.; Zhao, Y.; Chen, G. Multiphase processes with ionic liquids in microreactors: Hydrodynamics, mass transfer and applications. Chem. Eng. Sci. 2018, 189, 340–359. [Google Scholar] [CrossRef]
- Zhang, Q.; Liu, H.; Zhao, S.; Yao, C.; Chen, G. Hydrodynamics and mass transfer characteristics of liquid–liquid slug flow in microchannels: The effects of temperature, fluid properties and channel size. Chem. Eng. J. 2019, 358, 794–805. [Google Scholar] [CrossRef]
- Zhou, F.; Zhang, B.; Yao, C.; Zhu, K.; Yang, M.; Chen, G. Cyclization of Pseudoionone Catalyzed by Sulfuric Acid in a Microreactor. Chem. Eng. Technol. 2016, 39, 849–856. [Google Scholar] [CrossRef]
- Winkelman, J.G.; Schuur, B.; Heeres, H.J.; Yue, J. Lactic Acid Extraction and Mass Transfer Characteristics in Slug Flow Capillary Microreactors. Ind. Eng. Chem. Res. 2016, 55, 4691–4702. [Google Scholar]
- Yang, L.; Zhao, Y.; Su, Y.; Chen, G. An Experimental Study of Copper Extraction Characteristics in a T-Junction Microchannel. Chem. Eng. Technol. 2013, 36, 985–992. [Google Scholar] [CrossRef]
- Zhao, Z.; Zhao, K.; Jia, D.; Jiang, P.; Shen, R. Numerical Investigation on the Flow and Heat Transfer Characteristics of Supercritical Liquefied Natural Gas in an Airfoil Fin Printed Circuit Heat Exchanger. Energies 2017, 10, 1828. [Google Scholar] [CrossRef]
- Foroughi, H.; Abbasi, A.; Das, K.S.; Kawaji, M. Immiscible displacement of oil by water in a microchannel: Asymmetric flow behavior and nonlinear stability analysis of core-annular flow. Phys. Rev. E 2012, 85. [Google Scholar] [CrossRef]
- Ling, B.; Khan, H.J.; Druhan, J.L.; Battiato, I. Multi-Scale Microfluidics for Transport in Shale Fabric. Energies 2020, 14, 21. [Google Scholar] [CrossRef]
- Litster, S.; Sinton, D.; Djilali, N. Ex situ visualization of liquid water transport in PEM fuel cell gas diffusion layers. J. Power Sources 2006, 154, 95–105. [Google Scholar] [CrossRef]
- Zhang, J.; Li, W. Investigation of hydrodynamic and heat transfer characteristics of gas–liquid Taylor flow in vertical capillaries. Int. Commun. Heat Mass Transf. 2016, 74, 1–10. [Google Scholar] [CrossRef]
- Zhang, J.; Li, W. Thermal and Flow Characteristics of Water–Nitrogen Taylor Flow inside Vertical Circular Tubes. J. Heat Transf. 2018, 140, 082004. [Google Scholar] [CrossRef]
- Zunlong, J.; Shuiyun, L.; Mingshan, L. Numerical simulation of gas-liquid two-phase flow in a convection T-junction microchannels. Cryo. Supercond. 2013, 41, 42–46, 51. [Google Scholar]
- Markovic, T.; Ocket, I.; Baric, A.; Nauwelaers, B. Design and Comparison of Resonant and Non-Resonant Single-Layer Microwave Heaters for Continuous Flow Microfluidics in Silicon-Glass Technology. Energies 2020, 13, 2635. [Google Scholar] [CrossRef]
- Cai, W.; Zhang, J.; Zhang, X.; Wang, Y.; Qi, X. Enhancement of CO2 Absorption under Taylor Flow in the Presence of Fine Particles. Chin. J. Chem. Eng. 2013, 21, 135–143. [Google Scholar] [CrossRef]
- Jiang, S.; Zhu, C.; Zhang, F.; Ma, Y. Mass transfer performance of CO2/N2 mixture absorption into monoethanolamine aqueous solution in microchannel. CIESC J. 2017, 68, 643–652. [Google Scholar]
- Damiati, S.; Kompella, U.B.; Damiati, S.A.; Kodzius, R. Microfluidic Devices for Drug Delivery Systems and Drug Screening. Genes 2018, 9, 103. [Google Scholar] [CrossRef]
- Zhao, S.; Wang, W.; Shao, T.; Zhang, M.; Jin, Y.; Cheng, Y. Mixing performance and drug nano-particle preparation inside slugs in a gas–liquid microchannel reactor. Chem. Eng. Sci. 2013, 100, 456–463. [Google Scholar] [CrossRef]
- Garstecki, P.; Fuerstman, M.J.; Stone, H.A.; Whitesides, G.M. Formation of droplets and bubbles in a microfluidic T-junction—scaling and mechanism of break-up. Lab Chip 2006, 6, 437–446. [Google Scholar] [CrossRef]
- Lefortier, S.G.R.; Hamersma, P.J.; Bardow, A.; Kreutzer, M.T. Rapid microfluidic screening of CO2 solubility and diffusion in pure and mixed solvents. Lab Chip 2012, 12, 3387–3391. [Google Scholar] [CrossRef] [PubMed]
- Van Steijn, V.; Kleijn, C.R.; Kreutzer, M.T. Predictive model for the size of bubbles and droplets created in microfluidic T-junctions. Lab Chip 2010, 10, 2513–2518. [Google Scholar] [CrossRef]
- Zhou, C.; Zhu, P.; Tian, Y.; Tang, X.; Shi, R.; Wang, L. Microfluidic generation of aqueous two-phase-system (ATPS) droplets by oil-droplet choppers. Lab Chip 2017, 17, 3310–3317. [Google Scholar] [CrossRef]
- Zhao, Y.; Chen, G.; Yuan, Q. Liquid-liquid two-phase flow patterns in a rectangular microchannel. AIChE J. 2006, 52, 4052–4060. [Google Scholar] [CrossRef]
- Salim, A.; Fourar, M.; Pironon, J.; Sausse, J. Oil-water two-phase flow in microchannels: Flow patterns and pressure drop measurements. Can. J. Chem. Eng. 2008, 86, 978–988. [Google Scholar] [CrossRef]
- Kashid, M.; Kiwi-Minsker, L. Quantitative prediction of flow patterns in liquid–liquid flow in micro-capillaries. Chem. Eng. Process. Process. Intensif. 2011, 50, 972–978. [Google Scholar] [CrossRef]
- Li, Y.K.; Liu, G.T.; Xu, J.H.; Wang, K.; Luo, G.S. A microdevice for producing monodispersed droplets under a jetting flow. RSC Adv. 2015, 5, 27356–27364. [Google Scholar] [CrossRef]
- Tsaoulidis, D.; Dore, V.; Angeli, P.; Plechkova, N.V.; Seddon, K.R. Flow patterns and pressure drop of ionic liquid–water two-phase flows in microchannels. Int. J. Multiph. Flow 2013, 54, 1–10. [Google Scholar] [CrossRef]
- Cherlo, S.K.R.; Kariveti, S.; Pushpavanam, S. Experimental and Numerical Investigations of Two-Phase (Liquid–Liquid) Flow Behavior in Rectangular Microchannels. Ind. Eng. Chem. Res. 2010, 49, 893–899. [Google Scholar] [CrossRef]
- Fu, T.; Wei, L.; Zhu, C.; Ma, Y. Flow patterns of liquid–liquid two-phase flow in non-Newtonian fluids in rectangular microchannels. Chem. Eng. Process. Process. Intensif. 2015, 91, 114–120. [Google Scholar] [CrossRef]
- Kashid, M.N.; Agar, D.W. Hydrodynamics of liquid–liquid slug flow capillary microreactor: Flow regimes, slug size and pressure drop. Chem. Eng. J. 2007, 131, 1–13. [Google Scholar] [CrossRef]
- Kashid, M.N.; Renken, A.; Kiwi-Minsker, L. Influence of Flow Regime on Mass Transfer in Different Types of Microchannels. Ind. Eng. Chem. Res. 2011, 50, 6906–6914. [Google Scholar] [CrossRef]
- Wu, Z.; Cao, Z.; Sundén, B. Liquid-liquid flow patterns and slug hydrodynamics in square microchannels of cross-shaped junctions. Chem. Eng. Sci. 2017, 174, 56–66. [Google Scholar] [CrossRef]
- Cubaud, T.; Mason, T.G. Capillary threads and viscous droplets in square microchannels. Phys. Fluids 2008, 20, 053302. [Google Scholar] [CrossRef]
- Cao, Z.; Wu, Z.; Sundén, B. Dimensionless analysis on liquid-liquid flow patterns and scaling law on slug hydrodynamics in cross-junction microchannels. Chem. Eng. J. 2018, 344, 604–615. [Google Scholar] [CrossRef]
- Bai, L.; Zhao, S.; Fu, Y.; Cheng, Y. Experimental study of mass transfer in water/ionic liquid microdroplet systems using micro-LIF technique. Chem. Eng. J. 2016, 298, 281–290. [Google Scholar] [CrossRef]
- Jose, B.M.; Cubaud, T. Formation and dynamics of partially wetting droplets in square microchannels. RSC Adv. 2014, 4, 14962–14970. [Google Scholar] [CrossRef]
- Bai, L.; Fu, Y.; Zhao, S.; Cheng, Y. Droplet formation in a microfluidic T-junction involving highly viscous fluid systems. Chem. Eng. Sci. 2016, 145, 141–148. [Google Scholar] [CrossRef]
- Foroughi, H.; Kawaji, M. Viscous oil–water flows in a microchannel initially saturated with oil: Flow patterns and pressure drop characteristics. Int. J. Multiph. Flow 2011, 37, 1147–1155. [Google Scholar] [CrossRef]
- Xu, J.H.; Li, S.W.; Tan, J.; Luo, G.S. Correlations of droplet formation in T-junction microfluidic devices: From squeezing to dripping. Microfluid. Nanofluidics 2008, 5, 711–717. [Google Scholar] [CrossRef]
- Dessimoz, A.-L.; Cavin, L.; Renken, A.; Kiwi-Minsker, L. Liquid–liquid two-phase flow patterns and mass transfer characteristics in rectangular glass microreactors. Chem. Eng. Sci. 2008, 63, 4035–4044. [Google Scholar] [CrossRef]
- Yagodnitsyna, A.A.; Kovalev, A.V.; Bilsky, A.V. Flow patterns of immiscible liquid-liquid flow in a rectangular microchannel with T-junction. Chem. Eng. J. 2016, 303, 547–554. [Google Scholar] [CrossRef]
- Yao, C.; Liu, Y.; Xu, C.; Zhao, S.; Chen, G. Formation of liquid-liquid slug flow in a microfluidic T-junction: Effects of fluid properties and leakage flow. AIChE J. 2017, 64, 346–357. [Google Scholar] [CrossRef]
- Wu, Z.; Cao, Z.; Sunden, B. Flow patterns and slug scaling of liquid-liquid flow in square microchannels. Int. J. Multiph. Flow 2019, 112, 27–39. [Google Scholar] [CrossRef]
- Zhang, Q.; Fu, T.; Zhu, C.; Ma, Y. Formation and size prediction of slug droplet in viscoelastic fluid in flow-focusing microchannel. CIESC J. 2016, 67, 504–511. [Google Scholar]
- Dang, M.; Ren, M.; Chen, G. Effect of microchannel inlet configuration on Taylor bubble formation in microreactors. CIESC J. 2014, 65, 805–812. [Google Scholar]
- Yao, C.; Zhao, Y.; Ye, C.; Dang, M.; Dong, Z.; Chen, G. Characteristics of slug flow with inertial effects in a rectangular microchannel. Chem. Eng. Sci. 2013, 95, 246–256. [Google Scholar]
- Guo, F.; Chen, B. Numerical Study on Taylor Bubble Formation in a Micro-channel T-Junction Using VOF Method. Microgravity Sci. Technol. 2009, 21, 51–58. [Google Scholar] [CrossRef]
- De Menech, M.; Garstecki, P.; Jousse, F.; Stone, H.A. Transition from squeezing to dripping in a microfluidic T-shaped junction. J. Fluid Mech. 2008, 595, 141–161. [Google Scholar] [CrossRef]
- Christopher, G.F.; Noharuddin, N.N.; Taylor, J.A.; Anna, S.L. Experimental observations of the squeezing-to-dripping transition in T-shaped microfluidic junctions. Phys. Rev. E 2008, 78, 036317. [Google Scholar] [CrossRef]
- Wei, L.; Zhu, C.; Fu, T.; Ma, Y. Experimental measurement and correlation of droplet size in T-junction microchannels. CIESC J. 2013, 64, 517–523. [Google Scholar]
- De Menech, M. Modeling of droplet breakup in a microfluidic T-shaped junction with a phase-field model. Phys. Rev. E 2016, 73, 031505. [Google Scholar] [CrossRef]
- Liu, W. Study on Two-Phase Flow Patterns and Droplet Formation in Microchannels. Master’s Thesis, Tianjin University, Tianjin, China, 2010. [Google Scholar]
Publisher’s Note: MDPI stays neutral with regard to jurisdictional claims in published maps and institutional affiliations. |
© 2021 by the authors. Licensee MDPI, Basel, Switzerland. This article is an open access article distributed under the terms and conditions of the Creative Commons Attribution (CC BY) license (http://creativecommons.org/licenses/by/4.0/).