Article

A Numerical Study on the Combustion Process and Emission Characteristics of a Natural Gas-Diesel Dual-Fuel Marine Engine at Full Load

1
Graduate School of Korea Maritime and Ocean University, 727, Taejong-ro, Yeongdo-gu, Busan 49112, Korea
2
Division of Marine Systems Engineering, Korea Maritime and Ocean University, 727, Taejong-ro, Yeongdo-gu, Busan 49112, Korea
3
Korea Institute of Maritime and Fisheries Technology, 367, Haeyang-ro, Yeongdo-gu, Busan 49111, Korea
4
Machinery Service Department, Hyundai Global Service, 79, Centum Jungang-ro, Haeundae-gu, Busan 48058, Korea
5
Division of Marine IT, Korea Maritime and Ocean University, 727, Taejong-ro, Yeongdo-gu, Busan 49112, Korea
6
Maritime Academy, Ho Chi Minh City University of Transport, No.2, Vo Oanh Str., Binh Thanh Dist., Ho Chi Minh 717400, Vietnam
7
Division of Marine Engineering, Korea Maritime and Ocean University, 727, Taejong-ro, Yeongdo-gu, Busan 49112, Korea
8
Interdisciplinary Major of Maritime AI Convergence, Korea Maritime and Ocean University, 727, Taejong-ro, Yeongdo-gu, Busan 49112, Korea
*
Author to whom correspondence should be addressed.
Energies 2021, 14(5), 1342; https://doi.org/10.3390/en14051342
Submission received: 15 January 2021 / Revised: 10 February 2021 / Accepted: 13 February 2021 / Published: 1 March 2021

Abstract

:
This paper presents research on the combustion and emission characteristics of a four-stroke Natural gas–Diesel dual-fuel marine engine at full load. The AVL FIRE R2018a (AVL List GmbH, Graz, Austria) simulation software was used to conduct three-dimensional simulations of the combustion process and emission formations inside the engine cylinder in both diesel and dual-fuel mode to analyze the in-cylinder pressure, temperature, and emission characteristics. The simulation results were then compared and showed a good agreement with the measured values reported in the engine’s shop test technical data. The simulation results showed reductions in the in-cylinder pressure and temperature peaks by 1.7% and 6.75%, while NO, soot, CO, and CO2 emissions were reduced up to 96%, 96%, 86%, and 15.9%, respectively, in the dual-fuel mode in comparison with the diesel mode. The results also show better and more uniform combustion at the late stage of the combustions inside the cylinder when operating the engine in the dual-fuel mode. Analyzing the emission characteristics and the engine performance when the injection timing varies shows that, operating the engine in the dual-fuel mode with an injection timing of 12 crank angle degrees before the top dead center is the best solution to reduce emissions while keeping the optimal engine power.

1. Introduction

Due to the increasing environmental hazards of marine engine exhaust emissions, as well as the International Maritime Organization (IMO) emission regulations are increasingly strict, the global demand for clean fuels has become more prominent for the shipping industry. Natural gas (NG) which contained mainly methane (CH4) is one of the clean energy sources to reduce the marine engine exhaust emissions in order to meet the IMO’s emission regulations which are increasingly strict [1]. Methane is known as the simplest and cleanest hydrocarbon fuel, so it produces less carbon-based emissions such as CO, CO2, and soot than diesel oil when burning. Besides, NG has a lower calorific value higher than that of diesel, therefore in order to remain a certain engine output, the fuel amount needed to be used will be reduced if using NG instead of diesel. These will result in a significant decrease in the amount of exhaust emissions generated inside the engine cylinder when using NG as an alternative fuel for diesel oil [2]. However, because NG has a high ignition temperature (low cetane numbers), so it is very difficult to ignite it by compression directly. This means that an external energy source such as a spark plug or pilot diesel oil is required to ignite NG [3].
Diesel compression-ignition (CI) engines require a highly reactive fuel that will auto-ignite at high pressures and temperatures. This limits the fuels that can be used on CI engines. Dual-fuel engines provide a way to use low reactive fuels since they can use a pilot high reactive fuel to produce ignition. In addition, dual-fuel concepts have also been investigated as a way to reduce engine emissions. Conventional diesel combustion is diffusion-controlled and is typically accompanied by high nitrogen oxide (NOx) and particulate matter (PM) emissions [4]. NOx emissions result from high in-cylinder temperature conditions which promote the combination of nitrogen (carried in with the fresh air) with excess oxygen [5]. Meanwhile, PM or soot is produced in fuel-rich regions when hydrocarbon species agglomerate [5,6]. As such, high local equivalence ratios can lead to soot formation and high local temperatures can lead to NOx formation. In order to avoid these problematic regions, many dual-fuel engines attempt to operate in conditions that promote the premixing of the fuel and air and/or achieve in-cylinder stratification in order to reach high efficiencies and low emissions. By enabling more premixed combustion, rich regions where PM would be produced can be nearly eliminated and shorter combustion durations are achieved which reduces local temperatures and thereby, NOx emissions [7,8,9,10,11,12,13]. By using diesel oil as pilot fuel, a dual-fuel engine enables to use of NG as primary fuel instead of diesel oil as in conventional diesel CI engines. This type of engine is called NG-Diesel dual-fuel engine. Using NG-Diesel dual-fuel engines is one of the effective solutions for reducing marine emissions at the source to meet IMO’s emission standards without any NOx after-treatment devices [2].
This study focuses on the combustion process and emission characteristics inside the engine cylinder of a four-stroke NG port injection and diesel pilot direct injection dual-fuel engine that uses NG as primary fuel and diesel oil as pilot fuel.
The commercial simulation software AVL FIRE with its state-of-the-art models has been proven to be suitable for simulating combustion and emission formation inside gasoline, diesel, and dual-fuel engines with high accuracy [14], therefore, in this study, the AVL FIRE R2018a simulation software was used to perform a 3D simulation calculating the combustion process and emission formation inside the engine cylinder. There are two operating modes of the engine that have been simulated, including the diesel mode (running the engine with only diesel oil) and the dual-fuel mode (the engine uses NG as primary fuel and diesel oil as pilot fuel), in order to analyze the in-cylinder pressure, temperature, and emission characteristics. The simulation results were then validated by comparing them with the engine’s shop test data provided by the engine manufacturer.

2. Simulated Engine and CFD Models

In this section, the specifications of the simulated engine and CFD models that have been used in this study will be present in detail.

2.1. Simulated Engine Specifications

The research object of this study is a four-stroke NG-Diesel dual-fuel marine engine. The combustion process of the engine is studied and simulated to analyze the effect of using methane as primary fuels on the engine’s in-cylinder pressure, temperature, and emission characteristics compared to those when using diesel oil only. The principle schematic of a simulated engine is shown in Figure 1. One can operate the engine in two operating modes: diesel mode and dual-fuel mode. In diesel mode, the engine uses only diesel as in conventional compression ignition (CI) diesel engines. Meanwhile, in the dual-fuel mode, the engine uses NG as the primary fuel and diesel as the pilot fuel. When the engine is operated in dual-fuel mode, NG will be injected into the intake port through the gas supplying valve to mix with the intake air forming a pre-mixed mixture prior to being supplied into the engine cylinder, while diesel pilot fuel will be injected directly into the engine cylinder by a pilot fuel nozzle mounted in the center of the engine cylinder cover.
The quarter-cut 3D models of the piston and the pilot fuel nozzle are shown in Figure 2. The piston surface is an ω-type shape. The pilot fuel nozzle has 12 identical holes with an injection angle of 155 degrees. Specifications of the simulated engine are shown in Table 1. The engine has six cylinders with two intake valves and two exhaust valves per cylinder. The cylinder diameters and piston stroke of the engine are 350 and 400 mm, respectively.

2.2. Three-Dimensional CFD Simulation Models

The commercial simulation software AVL FIRE with its state-of-the-art models has been proven to be suitable for simulating combustion and emission formation inside gasoline, diesel, and dual-fuel engines with high accuracy [14]. There are some modeling platforms provided by AVL FIRE. Among these, the AVL FIRE ESE Engine platform allows modeling the full cycle of internal combustion engines. However, in this study, in order to simplify the simulation problem and reduce the calculation time, we used the AVL FIRE ESE Diesel platform, which only models the working process of the engine from the intake valve closing to the exhaust valve opening. By using the ESE Diesel platform provided by AVL FIRE R2018a simulation software, step by step, we built the computational fluid domain, generated the three-dimensional (3D) movable computational mesh of the engine combustion chamber and the pilot diesel nozzle, calculated the combustion process of the engine for analyzing the in-cylinder pressure, temperature fields and emissions emitted inside the engine cylinder due to fuel combustions, finally, analyzed the calculated results by post-processing analysis.
Methane accounts for about 96% by volume of NG [15,16] and has been used by many researchers to represent NG in many studies [17,18,19,20,21,22]. These studies have shown that the calculated results are sufficiently accurate when using CH4 to represent NG, therefore, CH4 is also used to represent NG in this study. In the dual-fuel mode, the primary gaseous fuel (CH4) will be injected into the intake port to mix with charge air generating a homogeneous premixed mixture prior to being supplied to the cylinder, while diesel fuel (pilot fuel) will be directly injected into the cylinder by an injector mounted at the center of the cylinder head as usually in order to ignite the gaseous mixture fuel at the end of the compression process.
The turbulence model selected in the simulation is a k-zeta-f model. This model was developed from the k-ε two-equations model and became the four-equations model [23]. Therefore, it has higher precision and better stability than the k-ε two-equations turbulent model. To simulate the combustion process that occurs inside the combustion chamber of the engine, the Species Transport model (Appendix A) which model the mixing and transport of chemical species by solving conservation equations describing convection, diffusion, and reaction sources for each component species, in conjunction with the Extended Coherent Flame Model (ECFM) (Appendix B, [24]) have been used. AVL Fire offers several combustion models to model the combustion of an internal combustion engine, including the Turbulence Controlled Combustion Model, Turbulent Flame Speed Closure Combustion Model, Coherent Flame Model, Probability Density Function (PDF) Model, and Characteristic Timescale Model. However, among these combustion models, the Extended Coherent Flame Model (ECFM) containing all the features and improvements of the Coherent Flame Model has been proven to be suitable for simulating combustion and emission formation inside gasoline, diesel, and dual-fuel engines with high accuracy, as well as had been successfully used in many previous studies [18,19,20,22]. Therefore, it was chosen to simulate the combustion of the engine in this study. The Diesel Nozzle Flow sub-model [25,26] was used to simulate the pilot fuel injection. This model offers a simple way to correct the injection velocities and initial droplet diameters due to cavitation. In order to simulate the breaking up and evaporation phenomenon of fuel droplets, the WAVE [25,26], which has been developed into Kelvin-Helmholtz (KH) instability [27], and the Multi-component sub-model [25,26] have been used, respectively. The Diesel Ignited Gas Engine model [25] has been used for simulating the self-ignition phenomenon that occurs in a diesel-ignited dual-fuel engine.
The Extended Zeldovich model (Appendix C) was used to simulation the NO formation characteristic [25,28,29]. This chemical reaction mechanism consists of seven species and three reactions and is able to predict NO formation with high accuracy over a wide range of equivalence ratios. The Kinetic Soot mechanism (Appendix D, [25,28]) was used to simulate the soot formation due to the combustion process. To simulate the interactions between fuel droplets and walls the Walljet1 sub-model [25,26], which is based on the spray/wall impingement model of Naber and Reitz [30] has been used. The species transport model, ECFM, extended Zeldovich model and kinetic soot model are presented in detail in Appendix A, Appendix B, Appendix C and Appendix D, respectively. Other CFD models can be seen in references [25,26,28]. Table 2 shows a summary of the numerical models used in this study.

2.3. Computational Domain and Initial Conditions

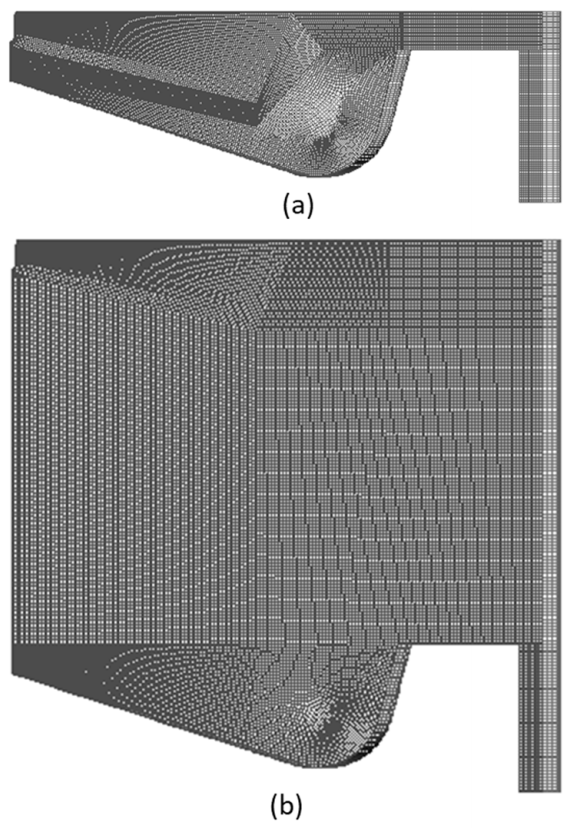
The combustion chamber geometry and computational mesh were created by the AVL FIRE ESE-Diesel platform. Due to the axial symmetry of the engine combustion chamber, the fuel nozzle of the engine has 12 identical holes, and for the purpose of reducing calculation time, only one-twelfth of the entire 3D computational mesh of the combustion chamber was generated. The calculation was performed in series using an eight-core processor and took approximately 36 h of CPU time. Figure 3 shows half of the symmetry combustion chamber geometry and Figure 4 shows one-twelfth of the entire 3D computational mesh of the combustion chamber at the TDC (a) and 60 crank angle degree (CAD) after the top dead center (ATDC) (b).
The boundary conditions (BCs) at the cylinder head, piston surface and cylinder liner were defined as impermeable wall BCs. The cylinder geometry was symmetric around the cylinder axis, so the cyclic BCs were assigned to the cutting surfaces of the computational domain. The simulation was started from the Intake Valve Closing (IVC) of 35 CAD after the bottom dead center (ABDC) (IVC = 35 CAD ABDC) to the Exhaust Valve Opening (EVO) of 62 CAD before the bottom dead center (BBDC) (EVO = 62 CAD BBDC). The port fuel injected NG was considered to be homogeneously mixed with fresh air at IVC. The starting of injection (S.O.I) of the diesel pilot fuel will be taken at 12 CAD BTDC. The pilot injection duration in the dual-fuel mode is 3.47 millisecond. It means that the pilot fuel injection will take place in 15 CAD, from 12 CAD BTDC to 3 CAD ATDC. In the diesel mode, the S.O.I of the diesel fuel will be also taken at 12 CAD BTDC, but the injection duration will be 7.5 milliseconds. It means that the pilot fuel injection will take place in 32 CAD, from 12 CAD BTDC to 20 CAD ATDC.
The boundary conditions and initial conditions were chosen from the technical report of the actual engine provided by the engine manufacturer. Table 3 shows the BCs and initial conditions for the numerical simulation cases.

2.4. Simulation Conditions

In this study, the combustion processes of the engine running in two operating modes on full load have been simulated, including the combustion process of the engine when operating with only diesel oil in the diesel mode and operating with CH4 in the dual-fuel mode. In the diesel mode, the engine uses diesel oil only. In the dual-fuel mode, the engine uses CH4 as the primary fuel and diesel oil as the pilot fuel. All of the other simulation conditions were kept unchanged.
To keep the engine power unchanged, we changed the amount of fuel injected into the engine cylinder due to the difference in the lower calorific value of diesel and CH4. In the diesel mode, the injected diesel fuel mass was 0.0020667 kg/cycle, while in the dual-fuel mode, the injected pilot diesel fuel mass was 0.0001 kg/cycle, and the CH4 mass injected into the intake port to supply to the engine cylinder was 0.001682 kg/cycle. Therefore, the total fuel mass used in the dual-fuel mode was 0.001782 kg/cycle. The total fuel mass used in the dual-fuel mode is less than that in the diesel mode due to the higher lower calorific value of CH4 in comparison to that of diesel oil. The air excess ratio values ( λ ) were 1.52 for the diesel mode and 1.56 for the dual-fuel mode. The basic properties of the fuels [25,31,32] are shown in Table 4.
The energy share of diesel pilot in the total fuel dose supplied to the engine in the dual-fuel mode is:
E f d i e s e l = m D i e s e l   × L C V   o f   D i e s e l m D i e s e l   × L C V   o f   D i e s e l + m C H 4   × L C V   o f   C H 4 = 0.0001 × 42343 0.0001 × 42343 + 0.001682 × 50000 = 0.04793 = 4.793 %
where, E f d i e s e l is the energy fraction of diesel, m D i e s e l , m C H 4 are the mass of diesel and CH4 used for one cycle, respectively. L C V   o f   D i e s e l , and L C V   o f   C H 4 are the lower calorific values (LCV) of diesel and CH4, respectively.
After validating the CFD simulation models and conducting simulations to obtain simulation results, the comparisons of simulation results between two simulation cases were performed to analyze the effects of CH4 on the in-cylinder temperature, pressure as well as on the emission characteristics of the engine. The results are presented in detail in Section 3 below.

2.5. Mesh Independence Analysis

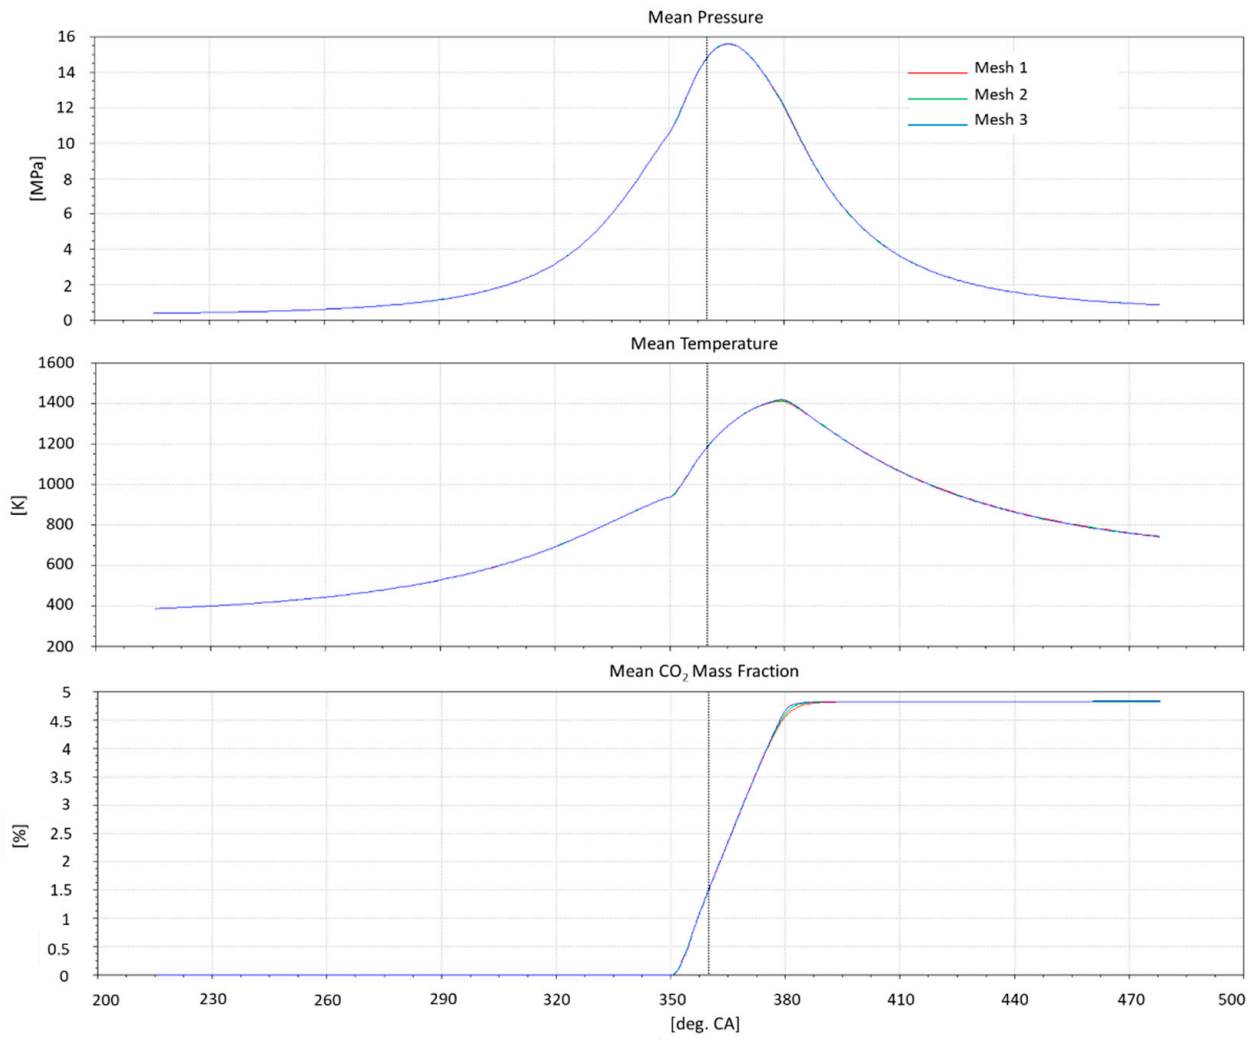
The mesh resolution plays a pivotal role in the final CFD results. In order to ensure the accuracy of the final CFD results, we performed an analysis of the mesh independence by conducting the simulations with three resolutions of mesh, including a coarse, medium, and fine mesh. The mesh resolution not only affects the accuracy of the final CFD results but also affects the calculation time. In most simulation cases, finer meshes result in a higher accuracy of CFD results, but extender the calculation time. Mesh independence analysis helps us to choose the appropriate mesh resolution so that we still get accurate CFD results but in a shorter calculation time.
Figure 5a–c show a haft of the 2D mesh of the engine combustion chamber at the TDC of the coarse, medium and fine mesh resolutions, respectively. The properties of meshes and the calculation time are shown in Table 5.
The final CFD results of simulations using the three mesh resolutions are shown in Figure 6, as we can see the final CFD results are independent of these three mesh resolutions, so we decided to choose mesh 2 for simulations in this study because it took a reasonable time for the calculation process, give mesh-independent calculation results and has an appropriate density for good contour analysis in the next steps.

2.6. CFD Simulation Model Validations

The simulation results were validated against the engine’s shop test data provided by the engine manufacturer. The simulation results show a good agreement with the measured results written in the engine’s shop test technical reports. The measured and simulated values used for validation are the in-cylinder peak pressure, NO and CO2 emissions of the engine running at the full load with a speed of 720 rpm. The comparisons between simulation results and the shop test data are shown in Figure 7. From Figure 7, it is obvious that the simulation results and the shop test data have a good agreement. The deviation between simulated and measured peak pressure is only 2.6%, while the deviations between simulated and measured NO, CO2 emissions are 7.7% and 2.7%, respectively. After validating the CFD simulation models, the validated models were applied to simulate the combustion and emission formations inside the engine cylinder.

3. Simulation Results

To clearly illustrate the effects of NG on the combustion and emission formations inside the engine cylinder, all of the boundary conditions and working conditions of the engine were kept unchanged, excepting the difference in the fuels to be used, that is only diesel in the diesel mode and NG-diesel in the dual-fuel mode. In addition, in order to additionally investigate the effects of the start of injection (S.O.I) timings on the combustion and emission formations of the engine, some simulations of the combustion when changing the S.O.I timing were conducted. In this section, the in-cylinder pressure, temperature and emissions in all cases of simulation will be also presented and analyzed.

3.1. In-Cylinder Fluid Flow Turbulence

In order to compare the turbulence intensity of the fluid flow in the engine cylinder in both operating modes, the mean turbulence kinetic energy (TKE) diagrams are used. In fluid dynamics, TKE is the mean kinetic energy per unit mass associated with eddies in a turbulent flow. Physically, the TKE is characterized by measured root-mean-square (RMS) velocity fluctuations. In Reynolds-averaged Navier–Stokes equations, the TKE can be calculated based on the closure method, i.e., a turbulence model. Generally, the TKE is defined to be half the sum of the variances (square of standard deviations) of the velocity components as Equation (2) [33]:
k = 1 2 u 2 ¯ + v 2 ¯ + ω 2 ¯
In Equation (2), k , u , v and ω represent the TKE, turbulent part of horizontal (x- and y-axis) and vertical (z-axis) velocities of the turbulence. We can see that the TKE is proportional to the square of the turbulence velocity components. Meaning that the TKE intensity indicates the intensity of the turbulence of the fluid flow in the engine cylinder. The higher the TKE, the higher the turbulence of the fluid flow.
The mean TKEs of the fluid flow in the whole engine cylinder in both operating modes are shown in Figure 8. As we can see in Figure 8, the maximum value of the mean TKE, as well as the mean TKE during the combustion and expansion processes in the diesel mode, are larger than those in the dual-fuel mode. These indicate that the turbulence velocity of the fluid flow in the engine cylinder in the diesel mode is larger than that in the dual-fuel mode. This may be because of the differences in the rate and duration of the heat release in the engine cylinder. As we can see in Figure 9, the heat release rate in the diesel mode was kept at a high value in a shorter heat release duration compared to the dual-fuel mode. Due to almost all of the heat released in a shorter period, the turbulence velocity of the fluid flow in the engine cylinder, and thus, the TKE in the diesel mode was higher compared to those in the dual-fuel mode.

3.2. In-Cylinder Pressure

The simulated in-cylinder pressure diagrams in both combustion cases inside the engine cylinder are shown in Figure 10. The simulation results show that the in-cylinder pressure peak in the diesel mode is higher than that compared with the dual-fuel mode (Figure 10a). The maximum in-cylinder pressure in the dual-fuel mode is 1.7% lower than that compared to the diesel mode (Figure 10b).
The lower in-cylinder pressure peak in the dual-fuel mode is because of the very lean premixed combustion characteristics and slower burning rate of dual-fuel combustion. The normal combustion process in an NG-diesel dual-fuel engine takes place in three stages. The first stage starts when the diesel pilot fuel is directly injected into the engine cylinder where already contained a premixed mixture of NG and air. Due to the diesel droplets need time to receive heat for heating up and vaporization, so the diesel will not ignite immediately, but after a few moments, namely ignition delay time. During the ignition delay time, injected diesel droplets will mix with air in the cylinder forming a pre-mixed mixture—diesel-air mixture. Therefore, this stage of combustion includes the premixed combustion of the diesel pilot fuel and a small portion of port injection NG fuel. However, because NG has higher activation energy resulting in a higher auto-ignition temperature, the combustion of premixed diesel is the main contributor in this stage. During this stage, rapid pressure and temperature rise occur resulting from the initiation of diesel combustion. In the dual-fuel mode, due to the diesel fuel injected is many times less than that in the diesel mode, the pressure rise rate in the case of dual-fuel combustion is lower than that compare with the diesel mode as we can see in Figure 10a. The second stage starts after the initial combustion of diesel to provide an ignition source, in this stage, the continuing injected diesel fuel will immediately ignite when being injected into the cylinder, therefore this stage involves diffusion combustion of the diesel pilot fuel along with the initiation and flame propagation of NG combustion due to the presence of the ignition source. During this stage, the combustion of diesel pilot fuel is mixing-controlled and the premixed NG flame propagates from the ignition kernels. The spatial visualization of the combustion inside the engine cylinder in this combustion stage at some crank angle positions is presented in detail in Section 3.6. The third stage involves diffusion combustion of the residual diesel pilot fuel and late combustion phase of natural gas and most of the fuel will be burned in this stage [34,35,36,37]. In the first combustion stage of the dual-fuel mode, due to there is only a small amount of the diesel pilot fuel was injected into the combustion chamber, so the heat release rate (HRR), as well as the heat accumulated in the combustion chamber, is lower than that in the case of diesel mode. As soon as the diesel pilot fuel self-ignited to generate ignition sources, the NG-air premixed mixture immediately burns without any ignition delay of premixed gaseous fuel.
The diesel fuel combustion durations in both operating modes are shown in Figure 11. Figure 11 shows that, in the dual-fuel mode, due to there is only a small amount of diesel pilot fuel was injected so most of the diesel fully burnt in the first stage of the combustion. Meanwhile, in diesel mode, due to the amount of injected diesel fuel was larger, it took a long time for the diesel fuel to burn completely. As can be seen in Figure 9 above, the HRRs in both cases are almost the same in the first stage of combustions due to premixed diesel combustion in both combustion cases dominant in this stage, but in the late stages of combustions the HHR in the dual-fuel mode is lower than that compare with diesel mode, but the heat release duration is longer, this means that the heat released in stage 3, late combustion, in the dual-fuel mode is longer. All the stated things result in the in-cylinder pressure peak in the dual-fuel mode is lower than that in the diesel mode which running with diesel fuel only, as shown in Figure 10. Additionally, an in-cylinder temperature peak reduction because of the lean-burn combustion characteristics of dual-fuel combustions is also shown in Figure 12.

3.3. In-Cylinder Temperature and NO Emission

The in-cylinder temperature diagrams in both cases of combustions are shown in Figure 12, while Figure 13 shows the NO emissions generated in both cases of combustions. Figure 13a shows the mean NO mass fraction in the engine cylinder according to the engine crank angle degrees, while Figure 13b shows the NO emission in terms of grams per kilowatt per hour and percentages. The results show that the NO emission generated in the dual-fuel mode is significantly reduced compared to the diesel mode. The NO emissions generated in the diesel mode and dual-fuel mode are 7.63 g/kWh and 0.254 g/kWh, respectively. This means that NO emission is reduced by up to more than 96%, as shown in Figure 13b.
It is universally known that NO is the main component and usually accounts for more than 90% of NOx emissions inside the engine cylinder. There are two typical chemical mechanisms for NO formation, including the thermal mechanism (Zeldovich mechanism) and prompt mechanism (Fenimore mechanism) [37]. Since the dual-fuel combustion is lean-burn combustion so the excess air ratio in the NG-diesel dual-fuel engine is larger than unity. Therefore, only the NO thermal mechanism needs to be considered for this issue. That is why the extended Zelodovich NO emission model was used to simulate the NO formation in this study. According to the thermal mechanism, the NO formation is greatly influenced by the in-cylinder temperature peak and oxygen concentration within the engine cylinder. NO formation occurs in regions in the cylinder where the local temperature is above 1800 K and the formation rate increase significantly with the increase of the local in-cylinder temperature [4,37,38]. In order to visualize the in-cylinder local temperature, the temperature contours at the crank angle positions covering the combustion duration, from 11 CAD BTDC (1 CAD after S.O.I) to 50 CAD ATDC, which have the highest in-cylinder temperature were shown in Section 3.6. The temperature contours presented in Section 3.6 indicated that, at most of the crank angle positions, the local temperature inside the engine cylinder in the dual-fuel mode is lower than that in comparison to diesel mode, resulting in a significant reduction in NO formation. Additionally, in the dual-fuel mode, the specific heat capacity of NG is significantly higher than that of fresh air, so the addition of NG in charge air increases the overall heat capacity of the premixed mixture in the engine cylinder. This results in a reduction in the mean in-cylinder temperature at the end of the compression process and during the overall combustion phase when running the engine in dual-fuel mode compared with diesel mode as we can see in Figure 12. The simulation results show a reduction of 6.75% in the in-cylinder temperature peak in the dual-fuel mode compared to the diesel mode. Besides, in the dual-fuel mode, the gaseous fuel (NG) was injected into the intake port to mix with fresh air generating a homogeneous premixed mixture prior to supply to the cylinder resulting in a reduction in local oxygen concentration within the engine cylinder. This contributes to lowering the NO emission when burning dual-fuel compared with burning diesel only.
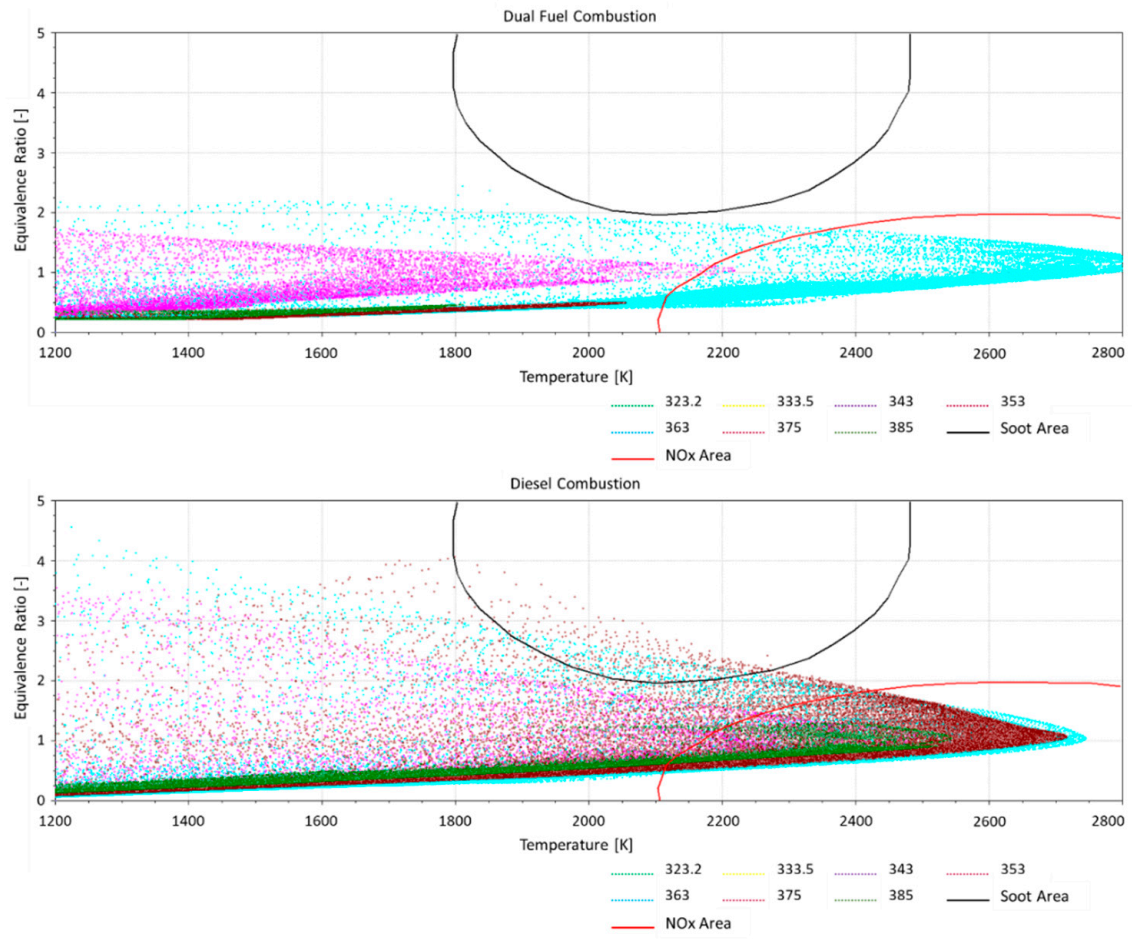
Additionally, by analyzing the equivalence ratio-temperature diagram (ϕ-T diagram) we can qualitatively evaluate the thermal NO emission as well as soot formations in internal combustion engines [25]. Figure 14 shows the NOx-Soot area according to the equivalence ratio-temperature diagrams. In this figure, the region bounded by the black-colored curve represents a region where having the possibility to generate soot, while the region bounded by the red-colored curve represents a region where having the possibility to generate NO emission. As we can see in Figure 14, NO will be formed at regions having very high temperatures but low equivalence ratios, while soot will be formed at regions having high equivalence ratios and relatively high temperatures. The colored dots in the figure represent the crank angles that occur soot or/and NOx formations. For instance, the turquoise, brown, green colors represent the crank angles of 363, 375, and 385 degrees, respectively, while the violet represents the CA of 343 degrees, etc. Figure 14 shows that, in the diesel mode, NO formation occurs most at the crank angles of 363, 375 and 385 degrees where the in-cylinder temperatures are highest due to the combustion of fuel. Meanwhile, NO formation occurs at almost only 363 CAD were having the highest in-cylinder temperature in the dual-fuel mode. The figure also shows a lower intensity of NO formation in the case of running the engine in the dual-fuel mode.

3.4. Soot Formation

Soot is the main component of particulate matter (PM) emission [39,40,41,42]. Under high temperature and fuel-rich conditions, as typically found in diesel combustion, hydrocarbon fuels exhibit a strong tendency to form carbonaceous particles—soot. Usually, under engine running conditions, most of the soot formed in the early stages of the combustion process is depleted due to oxidation. This takes place in oxygen-rich areas of the combustion chamber later in the engine cycle. In diesel engines, it is the amount and completeness of the soot oxidation process that actually determines the engine particle emission characteristics [28]. The most important parameters during the soot formation are the local air/fuel ratio (C/H-ratio and C/O-ratio), temperature, pressure, and residence time [28]. Soot particles are formed very early in the diffusion combustion process because of the dissociation of fuels under high temperature and high equivalence ratio conditions.
Under ideal conditions, the combustion of hydrocarbon fuels forms CO2 and H2O. The necessary amount of oxygen is the stoichiometric oxygen requirement O 2 ,   s t o i c h i o m e t r i c calculated from the following equation [28]:
C n H m O k + n + m 4 k 2 O 2 n C O 2 + m 2 H 2 O
In the above formula n, m and k represent the number of carbon, hydrogen and oxygen atoms of the considered fuel.
The real amount of oxygen, available for the combustion, is expressed by the air access ratio λ = O 2 / O 2 ,   s t o i c h i o m e t r i c or by the equivalence ratio ϕ :
ϕ = 1 λ = O 2 ,   s t o i c h i o m e t r i c O 2
Figure 15a shows the mean soot mass fraction in the engine cylinder according to the engine crank angle degrees, while Figure 15b shows the soot emission in terms of grams per kilowatt in an hour and percentages. The simulation results show that the amount of soot generated is significantly reduced when operating the engine in the dual-fuel mode with NG as the primary fuel. The soot emission generated in the diesel mode and dual-fuel mode is 0.0086 g/kWh and 0.000283 g/kWh, respectively. Meaning that soot emission is reduced up to more than 96%, as shown in Figure 15b.
In the dual-fuel combustion, NG has been injected into the intake port, so there is more time for the mixing process in order to generate a homogeneous pre-mixed mixture with fresh air for good combustion in the cylinder. A good mixing process results in a great reduction in the local equivalence ratio within the combustion chamber. Even though there is a diesel diffusion combustion period that will promote soot formations when diesel pilot fuel is directly injected into the engine cylinder in the dual-fuel mode, but the injected diesel mass is very small so the diffusion combustion period is very short. Additionally, NG which contains mainly CH4 has fewer C atoms than diesel oil, so dual-fuel combustion generates less soot than diesel combustion.
As mentioned above, by using the NOx-Soot areas according to the equivalence ratio-temperature diagram shown in Figure 14, we can observe which engine’s crank angles that the high local equivalence ratios occurred accompany with high temperature resulting in high soot formation. The figure shows that, in the case of running the engine in the diesel mode, soot mainly formed at 363 and 375 CAD, where having a local high equivalence ratio (more than an equivalence ratio of 2) due to the diesel pilot fuel has been injecting directly into a high-temperature environment. Meanwhile, in the case of dual-fuel mode, the local equivalence ratio within the engine cylinder is remarkably reduced (less than an equivalence ratio of 2) due to there is only a small amount of diesel pilot fuel has been injected directly into the engine cylinder. There are virtually no high equivalence ratios in the soot area, meaning that soot formation will be significantly reduced.
Additionally, due to NG does not contain a C-C bond and is free of aromatics and sulfur, NG has a minimal tendency to generate soot. Besides, the soot formed from the diffusion combustion of the diesel pilot fuel then consumed by the combustion of a homogeneous NG air premixed mixture. Due to these two reasons, soot emission was reduced [35].

3.5. Carbon Monoxide (CO) and Carbon Dioxide (CO2) Emissions

The amount of the CO emission is shown in Figure 16, while Figure 17 shows the CO2 emission amount generated inside the engine cylinder. The simulation results point that the CO and CO2 formation in the case of dual-fuel combustion is lower than that of diesel combustion case. The CO emission amount in the case of diesel and dual-fuel mode are 1.21274 g/kWh and 0.153643 g/kWh, respectively. Meaning that the CO emission in the dual-fuel mode is reduced up to more than 87.33%. Regarding CO2 emission, the CO2 emission amount in the case of diesel and dual-fuel mode are 597.182 g/kWh and 463.189 g/kWh, respectively. Meaning that the CO2 emission in the dual-fuel mode is reduced by 22.44% compared to that in the diesel mode.
Regarding the reasons for reductions in CO and CO2 emissions, as we knew, CO and CO2 are carbon-based emissions, so their formations depend directly on the number of Carbon (C) atoms contained in the fuel, and also, depending on the quality of the combustion. Carbon dioxide is a product of the complete combustion of hydrocarbon fuels. Firstly, hydrocarbon fuels will be oxidized to CO during the combustion process, and then it is oxidized to form CO2 sequentially if the in-cylinder temperature is high enough and there is still enough O2 in the cylinder. Therefore, the CO2 formation strongly depends on the in-cylinder temperature and the concentration of oxygen in the engine cylinder. That is why CO emissions have a reduction tendency at the end of the combustion processes while CO2 emissions increase during combustions and keep constant values at the end of combustions, as can be observed in Figure 16 and Figure 17.
As mentioned above, the main component of NG is CH4, the simplest hydrocarbon fuel with the lowest C contents among hydrocarbon fuels, additionally, in the case of dual-fuel mode, NG has been injected into the intake port in the intake stroke, so having enough time to generate a good-quality homogeneous premixed mixture for good combustion in the cylinder, these thus result in its combustion will produce less CO and CO2 than diesel combustion. Besides, as we can see in Figure 12, even though the maximum in-cylinder temperature in the case of dual-fuel mode is lower than that in the case of diesel mode, but the in-cylinder temperature during expansion stroke is higher because most of NG is burned in the late combustion phase of the dual-fuel combustion process, as mentioned in the Section 3.2. Additionally, the dual-fuel mode is a leaner burn combustion mode that having more oxygen inside the engine cylinder. Therefore, these two factors promote the oxidation of CO to form CO2, resulting in a significant reduction in CO emission. Regarding the CO2 emission, although the conditions inside the engine cylinder in the dual-fuel combustion mode are more favorable for the formation of CO2 from CO, however as stated above, due to NG contains many times fewer C atom than diesel fuel, so the absolute CO and CO2 emissions generated in the dual-fuel mode which uses NG as primary fuel are lower in comparison with diesel mode. The results show that the CO and CO2 emissions in the case of the dual-fuel mode were reduced up to 87.33% and 22.44% compared to that in the case of the diesel mode, respectively.

3.6. In-Cylinder Temperature Contours

For spatial visualization of the combustion inside the engine cylinder, some of the temperature contours on a central plane of the engine cylinder at some crank angle positions are shown in Figure 18. Due to the symmetrical characteristics of the engine combustion chamber as well as the pilot nozzle has 12 identical holes and is installed at the center of the engine cylinder head, one-twelfth-portion of the contours on the central plane is enough to analyze the in-cylinder temperature fields inside the engine cylinder. Looking at Figure 18 we can see that, at the early stage of the combustion, diesel oil in the case of diesel mode (left) ignited more easily and faster burnt than the case of dual-fuel mode (right). This is because, in the dual-fuel mode, the specific heat capacity of NG is significantly higher than that of fresh air, so the addition of NG in charge air increases the overall heat capacity of the premixed mixture in the engine cylinder at the start of the compression process. This results in a reduction in the mean in-cylinder temperature at the end of the compression process, as we can see in Figure 12. It is more difficult for diesel oil to self-ignite in a lower temperature and not pure fresh air environment compared with when it is injected into an environment of pure fresh air having higher temperature as in the case of diesel mode. As the ignition delay time is the interval time from the time of S.O.I to the time of the start of combustion (S.O.C), so looking at Figure 18 we also see that the ignition delay time of the fuel in the diesel and dual-fuel modes are 3 CAD (from 348 CAD BTDC to 351 CAD BTDC) and 4 CAD (from 348 CAD BTDC to 352 CAD BTDC), respectively.
In the case of diesel mode, due to the faster burning of diesel oil in the early stage of combustion, the in-cylinder pressure, as well as the in-cylinder temperature, increased faster (as can be seen in Figure 10 and Figure 12). In the next stages of the combustion, the combustion inside the cylinder in the case of dual-fuel was better and more uniform, indicated by the temperature contours in Figure 18. This is because, as mentioned above, the late combustion stage of the dual-fuel combustion is mainly related to the late combustion phase of NG which was well homogeneously mixed with fresh air before, so the combustion inside the engine cylinder will be better and more uniform. As we can see in Figure 18, at the late phase of combustions, for instance, at 378, 386 and 410 CAD, the temperature fields inside the engine cylinder in the dual-fuel mode (right) are more uniform than those in the diesel mode (left), meaning that the combustion in the late combustion phase in the dual-fuel mode is more uniform than the diesel mode.

3.7. Effects of the Injection Timing on Combustion and Emission Formations

In order to additionally analyze the effect of injection timing on the combustion and emission formation inside the engine cylinder, some additional simulations were conducted. In the case of diesel mode, the diesel fuel is injected into the cylinder in 4 different S.O.I angles, 345 CAD (15 CAD BTDC), 348 CAD (12 CAD BTDC), 351 CAD (9 CAD BTDC) and 354 CAD (6 CAD BTDC). In the case of dual-fuel mode, the diesel pilot fuel is also injected into the cylinder in 4 different S.O.I angle, 345 CAD, 348 CAD, 351 CAD and 354 CAD, while the gaseous fuel is still kept injecting during the intake stroke. The simulation results are shown in this sub-section as follows.

3.7.1. In-Cylinder Pressure and Temperature

The mean in-cylinder pressure diagrams according to the change of the S.O.I angle in the diesel mode and dual-fuel mode are shown in Figure 19 and Figure 20, respectively. The results show reduction tendencies in pressure peaks as the advanced injection angles increase in both cases of the combustion. This is because the ignition delay times of diesel oil become longer when we increase the S.O.I angle, as we well knew. During ignition delay times the fuel was continuously injected into the cylinder resulting in an increase in fuel mass before combustions start, causing an increase in the in-cylinder peak when the combustions occur.
Figure 21 and Figure 22 show the mean in-cylinder temperature diagrams according to the change of the S.O.I angle in the diesel mode and dual-fuel mode, respectively. The results also show reduction tendencies in temperature peaks as the advance injection angles in-crease in both cases of the combustion due to the longer ignition time of the diesel oil when we increase the S.O.I angle.

3.7.2. NO Emission

The mean NO emission mass fraction diagrams according to the change of S.O.I angle in the diesel mode and dual-fuel mode are shown in Figure 23 and Figure 24, respectively. In the diesel mode, due to the reduction in the maximum in-cylinder temperature peaks, the NO emissions were reduced by 13%, 29% and 43% when we retarded the S.O.I angle to 348, 351 and 354 CAD, respectively, compared to the S.O.I angle of 345 CAD. In the dual-fuel mode, when we retarded the S.O.I angle to 351 and 354 CAD, the NO emissions were reduced by 9.7% and 10.7%, respectively, compared to the S.O.I angle of 348 CAD, as the same trend as diesel mode, however, there is a small difference when retarding the S.O.I angle from 345 CAD to 348 CAD, the NO emission was increased by 6.4% as shown in Figure 24b.
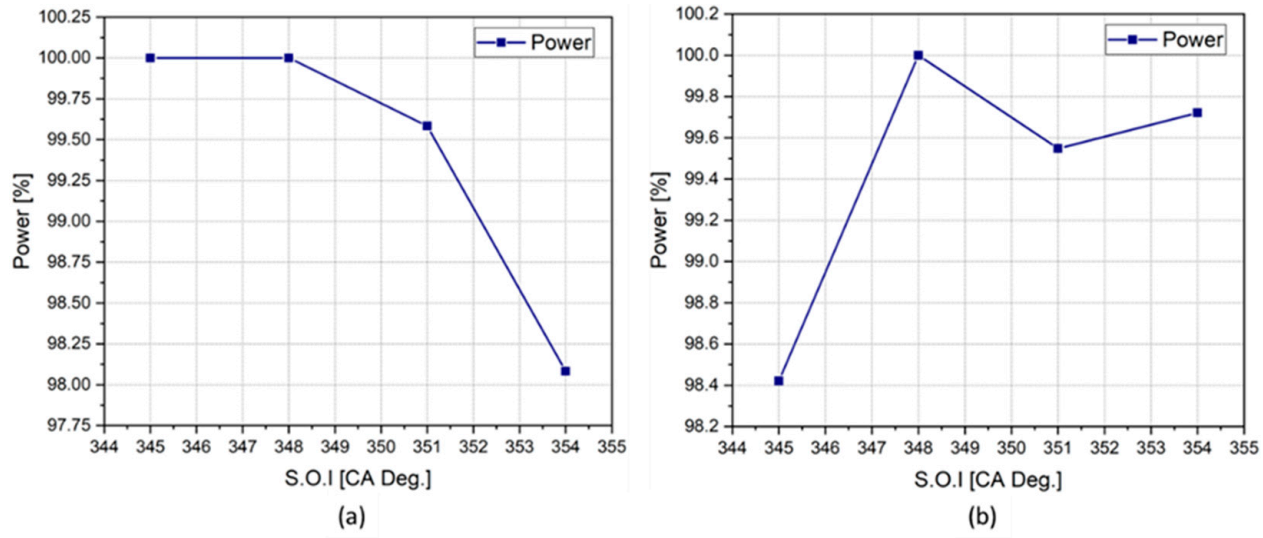
This reduction tendency gives us a remarkable solution to further reduce NO emissions by retarding the S.O.I angle, however, considering the engine power, we find that the engine powers were changed as the S.O.I angle changed, however, the engine reached the optimal power at the S.O.I angle of 348 CAD, the designed S.O.I angle of this simulated engine. Therefore, operating the engine with the S.O.I angle of 348 CAD in the dual-fuel mode is the best solution to reduce NO emissions while keeping the engine power at the optimum level. The engine powers in the case of diesel mode and dual-fuel mode according to the change of S.O.I angle are shown in Figure 25.

3.7.3. CO Emission

The mean CO mass fraction diagrams according to the change of S.O.I angle in the diesel mode and dual-fuel mode are shown in Figure 26 and Figure 27. The results show that, in the diesel mode, when we retarded the S.O.I angle from 345 CAD to 348 CAD, the CO emission decreased by 10%. However, when retarding the S.O.I angle from 348 CAD to 351 and 354 CAD, the CO emission increased by 1% and 10%, respectively. In the case of dual-fuel mode, there is an increasing tendency in CO emission when retarding the S.O.I angle from 345 CAD to 348, 351 and 354 CAD by 9.7%, 13% and 21%, respectively. Therefore, operating the engine with the designed S.O.I angle of 348 CAD is also a good solution to reduce the CO emission.

4. Conclusions

This paper numerically investigated the combustion process and emission formations inside the cylinder at a full load of a four-stroke NG-Diesel dual-fuel marine engine using NG as primary fuel and diesel oil as pilot fuel. The simulation results were then compared and showed a good agreement with the measured results written in the engine’s shop test technical reports provided by the engine manufacturer. The deviation between simulated and measured pressure peak is only 2.6%, while the deviations between simulated and measured NO, CO2 emissions are 7.7% and 2.7%, respectively. After validating the CFD simulation model, the validated model is applied to simulate the combustion and emission formations inside the engine cylinder.
The simulation results show that:
  • The maximum mean TKE, as well as the mean TKE at the end of the combustion processes in the diesel mode, are larger than those in the dual-fuel mode, indicating larger turbulence velocities of the fluid flow in the engine cylinder when running the engine in the diesel mode.
  • The maximum in-cylinder pressure in the dual-fuel mode is 1.7% lower than that in comparison to the diesel mode.
  • The in-cylinder temperature peak in the dual-fuel mode was reduced by 6.75% compared to that in the diesel mode.
  • The NO emission generated in the case of dual-fuel combustion is significantly reduced compared to that in the diesel combustion. The NO emission generated in the diesel mode and dual-fuel mode is 7.63 g/kWh and 0.254 g/kWh, respectively. Meaning that NO emission is reduced up to more than 96% in the dual-fuel mode.
  • The amount of soot generated is significantly reduced when operating the engine in the dual-fuel mode. The soot emission generated in the diesel mode and dual-fuel mode is 0.0086 g/kWh and 0.000283 g/kWh, respectively. Meaning that soot emission is reduced up to more than 96% in the dual-fuel mode.
  • The CO emission amount in the case of diesel and dual-fuel mode are 1.21274 g/kWh and 0.153643 g/kWh, respectively. Meaning that the CO emission in the dual-fuel mode is reduced up to more than 87.33%.
  • The CO2 emission amount in the case of diesel and dual-fuel mode are 597.182 g/kWh and 463.189 g/kWh, respectively. Meaning that the CO2 emission in the dual-fuel mode is reduced by 22.44% compared to that in the diesel mode.
  • The results also show better and more uniform combustion at the late stage of the combustion inside the engine cylinder when operating in the dual-fuel mode.
  • The in-cylinder pressure and temperature peaks are reduced when we reduce the S.O.I angle in both cases of combustions, resulting in reductions in NO emission, however, there also are reductions in the engine power. In another aspect, the simulation results point that the engine reaches the optimal power at the designed S.O.I angle of 348 CAD in both cases of combustions. CO emissions are increased when we reduce the S.O.I angle less than 12 CAD BTDC (348 CAD) in both cases of combustions. Therefore, operating the engine in the dual-fuel mode with the S.O.I angle of 12 CAD BTDC is the best solution to reduce emissions while keeping the optimal engine power.
This work proved the advantages of using NG as an alternative fuel in dual-fuel engines in the marine engine sector to meet the IMO’s emission regulations without using any emission after-treatment devices. In addition, this study would be a prerequisite for further research on other state-of-the-art dual fuels, the methane-hydrogen mixture as the primary fuel for example.

Author Contributions

Conceptualization, V.C.P. and W.-J.L.; methodology, V.C.P. and J.-H.C.; software, V.C.P. and B.-S.R.; validation, K.P. and W.-J.L.; formal analysis, J.-S.K.; data curation, S.-K.P. and V.V.L.; writing—original draft preparation, V.C.P.; writing—review and editing, V.C.P. and J.-H.C.; project administration, W.-J.L.; funding acquisition, W.-J.L. All authors have read and agreed to the published version of the manuscript.

Funding

This research was supported by the Ministry of Education of Republic of Korea and the National Research Foundation of Korea (NRF-2019R1G1A1005342) and by the Ministry of Science and ICT of Republic of Korea and National IT Industry Promotion Agency (S1226-21-1001).

Institutional Review Board Statement

Not applicable.

Informed Consent Statement

Not applicable.

Conflicts of Interest

The authors declare no conflict of interest.

Appendix A

  • The Standard Species Transport Model Variables and Equations [25]
In order to reduce the number of equations to be solved, dimensionless quantities are introduced to express the reactive system (simple chemical reacting system (SCRS) Spalding), namely the fuel mass fraction. The fuel mass fraction is defined as the fraction of the unburned fuel mass m f u , u and the total mixture mass m m i x , as the following equation:
y f u = m f u , u m m i x
The mixture fraction is defined as the sum of the unburned fuel mass m f u , u and the mass of fuel in the burnt phase m f u , b , divided by the total mixture mass m m i x , as the following equation:
f = m f u , u + m f u , b m m i x
In order to account for the presence of fully reacted residual gases, combustible mixture dilution is simulated, introducing the quantity residual gas mass fraction, given by the fraction of the residual gas mass m r g and the oxidizer mass m o x i d :
g = m r g m o x i d
The quantity “residual gas” (rg or erg—exhaust gas recirculation) changes the fluid from originally pure air to a mixture of air and residual gas. This new fluid will further be named “oxidizer”.
The oxidizer mass is:
m o x i d = m a i r + m r g
The egr is therefore no mass fraction related to the total mass in the system, but it denotes the amount of residual gas within this oxidizer.
The solution of transport equations for the density weighted mean quantities y f u , f , and g :
t ρ y f u   +   x i ρ U i y f u   =   x i Γ f u y f u x i   +   S f u
with S f u = ρ · r ˙ f u , is the mean reaction rate:
t ρ f   +   x i ρ U i f   =   x i Γ f f x i
t ρ g   +   x i ρ U i g   =   x i Γ f g x i
Together with the following algebraic expressions determine the chemically reacting system. This system consists of fuel C n H m O k , O 2 , C O 2 , H 2 O and N 2 (the overbar has been omitted for simplicity).
y O 2 = a 1 1 f S f y f u
y N 2 = a 2 1 f
y P r = 1 y f u y O 2 y N 2
y C O 2 = a 3 y P r
y H 2 O = a 4 y P r
In the equations above, y i ( i   =   O 2 , N 2 , P r , C O 2 , H 2 O ) are mass fractions in terms of the total mixture mass. The parameters a i are defined as follows:
a 1 —Mass fraction of oxygen in oxidizer (air + egr):
a 1 = 1 g · f O 2 + g · f O 2 , g
a 2 —Mass fraction of nitrogen in oxidizer (air + egr):
a 2 = 1 g · f N 2 + g · f N 2 , g
with f O 2 and f N 2 as the mass fractions of oxygen and nitrogen in air:
f O 2 = 0.23 ,   f N 2 = 0.76
a 3 —Mass fraction of C O 2 in products:
a 3 = n M C O 2 n M C O 2 + m 2 M H 2 O
a 4 —Mass fraction of H 2 O in products:
a 4 = m 2 M H 2 O n M C O 2 + m 2 M H 2 O
S —Stoichiometric air/fuel ratio:
S = n + m 4 k 2 M O 2 a 1 · M f u
with n , m and k denoting the number of carbon, hydrogen and oxygen atoms in the fuel molecule. The molar masses of the individual chemical species are expressed by M f u , M O 2 , M C O 2 , and M H 2 O .
The initial fuel mass fraction can be calculated from a given equivalence ratio ϕ with the following relation:
f = 1 1 + S ϕ

Appendix B

  • The Extended Coherent Flame Model (ECFM) Chemical Kinetic Reactions
For turbulent combustion phenomena, the ECFM model leads to the calculation of the mean fuel reaction rate. Hence, this model uses a 2-step chemistry mechanism for the fuel conversion like [25]:
C n H m O k + n + m 4 k 2 O 2 n C O 2 + m 2 H 2 O
C n H m O k + n 2 k 2 O 2 n C O + m 2 H 2
In order to consider CO and H2 formation in near stoichiometric and fuel-rich conditions, while for fuel-lean conditions their formation is neglected. In the above formula n , m and k represent the number of carbon, hydrogen and oxygen atoms of the considered fuel.
The reaction rate for reaction (A19) is calculated by:
ω f u , 1 = ω L γ
with γ as a function depending on the equivalence ratio ϕ , number of carbon and hydrogen atoms, respectively, and for the second fuel consumption reaction (A20):
ω f u , 2 = ω L 1 γ
with ω L as the mean laminar fuel consumption rate. The individual reaction rates of each species i participating in the 2-step reaction mechanism can be expressed by:
ω i = r = 1 2 υ i , r ω f u , r
with υ i , r as the stoichiometric coefficients of species i in the reaction r, while for the reactants these coefficients are negative and for the products positive, respectively.

Appendix C

  • The NO Formation Mechanism
For the ECFM it is supposed that no fuel exists in the burnt gas phase, but a chemical reaction may occur. The reactions in the burnt gas are assumed to be bulk reactions, which means that no local reaction zone is taken into account. These reactions are computed using the properties of the burnt gas phase, since only reactions in high-temperature region are effectively computed. In unburned regions, the reaction rates are assumed to be negligible.
The chemical reaction mechanism calculates the NO formation using the classical Extended Zeldovich scheme as follows [28]:
N 2 + O   k 1 f k 1 b   N O + N
N + O 2   k 2 f k 2 b   N O + O
N + O H   k 3 f k 3 b   N O + H
with the reaction rates ω N O , for each reaction r considering both formation and destruction of NO, respectively.
The reaction rate ω i of each participating species i in the reaction r using the stoichiometric coefficients υ i , r can be written as:
ω i = r = 1 3 υ i , r ω N O
  • The Thermal NO Reaction Rate
The rate constants for these reactions have been measured in numerous experimental studies [43,44,45], and the data obtained from these studies have been critically evaluated by Baulch et al. [46] and Hanson and Salimian [47]. The expressions for the rate coefficients for Equations (A25)–(A27) used in the NOx model are given below. These were selected based on the evaluation of Hanson and Salimian [47].
k 1 f = 1.8 × 10 8 e 38370 / T
k 1 b = 3.8 × 10 7 e 425 / T
k 2 f = 1.8 × 10 4 T e 4680 / T
k 2 b = 3.81 × 10 3 T e 20820 / T
k 3 f = 7.1 × 10 7 e 450 / T
k 3 b = 1.7 × 10 8 e 24560 / T
In the above expressions, k 1 f , k 2 f , and k 3 f are the rate constants for the forward Equations (A25)–(A27), respectively, and k 1 b , k 2 b , and k 3 b are the corresponding reverse rates. All of these rates have units of m 3 / g m o l · s .
The net rate of formation of NO via Equations (A25)–(A27) is given by:
d N O d t = k 1 f O N 2 + k 2 f N O + k 3 f N O H k 1 b N O N k 2 b N O O k 3 b N O H
where all concentrations have units of gmol / m 3 .

Appendix D

  • The Kinetic Soot Model
The basis of this model is a detailed chemical reaction scheme for the calculation of soot formation and oxidation. It combines the mechanisms of formation of polyaromatic hydrocarbons, polyynes, two mechanisms of soot precursor formation due to condensation of polyaromatic and polyyne molecules, soot particle growth by the reactions of HACA mechanism and polyyne molecule addition, the mechanism of acetylene pyrolysis and pure carbon cluster formation, as well as the reactions of hydrocarbon (n-heptane) oxidation [28].
The reduced reaction mechanism which is applied in the model is shown below:
C n H m + n 2 O 2 n C O + m 2 H 2
H 2 + H 2 + O 2 H 2 O + H 2 O
C O + C O + O 2 C O 2 + C O 2
C O + H 2 O C O 2 + H 2
C n H m + C n H m 2 n C + m H 2
C + C + O 2 C O + C O
C + H 2 O C O + H 2
The reaction parameters for the main soot formation reaction are changing due to the local equivalence ratio. The soot is oxidized due to the presence of oxygen and also due to water.

References

  1. Thomson, H.; Corbett, J.J.; Winebrake, J.J. Natural gas as a marine fuel. Energy Policy 2015, 87, 153–167. [Google Scholar] [CrossRef] [Green Version]
  2. Maurya, R.K.; Mishra, P. Parametric investigation on combustion and emissions characteristics of a dual fuel (natural gas port injection and diesel pilot injection) engine using 0-D SRM and 3D CFD approach. Fuel 2017, 210, 900–913. [Google Scholar] [CrossRef]
  3. Xiang, L.; Song, E.; Ding, Y. A Two-Zone Combustion Model for Knocking Prediction of Marine Natural Gas SI Engines. Energies 2018, 11, 561. [Google Scholar] [CrossRef] [Green Version]
  4. Heywood, J.B. Internal Combustion Engine Fundamentals; McGraw-Hill Education: New York, NY, USA, 1998. [Google Scholar]
  5. Turns, S.R. An Introduction to Combustion: Concepts and Applications; McGraw-Hill Education: New York, NY, USA, 2013. [Google Scholar]
  6. Mansurov, Z.A. Soot Formation in Combustion Processes (Review). Combust. Explos. Shock. Waves 2005, 41, 727–744. [Google Scholar] [CrossRef]
  7. Akihama, K.; Takatori, Y.; Inagaki, K.; Sasaki, S.; Dean, A.M. Mechanism of the Smokeless Rich Diesel Combustion by Reducing Temperature. SAE Tech. Pap. Ser. 2001, 110, 648–662. [Google Scholar] [CrossRef]
  8. Neely, G.D.; Sasaki, S.; Huang, Y.; Leet, J.A.; Stewart, D.W. New Diesel Emission Control Strategy to Meet US Tier 2 Emissions Regulations. SAE Tech. Pap. Ser. 2005, 114, 512–524. [Google Scholar] [CrossRef]
  9. Caton, J.A. The thermodynamic characteristics of high efficiency, internal-combustion engines. Energy Convers. Manag. 2012, 58, 84–93. [Google Scholar] [CrossRef]
  10. Ma, J.; Lü, X.; Ji, L.; Huang, Z. An experimental study of HCCI-DI combustion and emissions in a diesel engine with dual fuel. Int. J. Therm. Sci. 2008, 47, 1235–1242. [Google Scholar] [CrossRef]
  11. Leermakers, C.; Luijten, C.; Somers, L.; Kalghatgi, G.; Albrecht, B. Experimental Study of Fuel Composition Impact on PCCI Combustion in a Heavy-Duty Diesel Engine. SAE Tech. Pap. Ser. 2011, 1, 1351. [Google Scholar] [CrossRef] [Green Version]
  12. Kokjohn, S.L.; Hanson, R.M.; A Splitter, D.; Reitz, R.D. Fuel reactivity controlled compression ignition (RCCI): A pathway to controlled high-efficiency clean combustion. Int. J. Engine Res. 2011, 12, 209–226. [Google Scholar] [CrossRef]
  13. Splitter, D.; Wissink, M.; Delvescovo, D.; Reitz, R.D. RCCI Engine Operation Towards 60% Thermal Efficiency. SAE Tech. Pap. Ser. 2013, 1, 0279. [Google Scholar] [CrossRef]
  14. Eder, L.; Ban, M.; Pirker, G.; Vujanovic, M.; Priesching, P.; Wimmer, A. Development and Validation of 3D-CFD Injection and Combustion Models for Dual Fuel Combustion in Diesel Ignited Large Gas Engines. Energies 2018, 11, 643. [Google Scholar] [CrossRef] [Green Version]
  15. Faramawy, S.; Zaki, T.; Sakr, A.-E. Natural gas origin, composition, and processing: A review. J. Nat. Gas Sci. Eng. 2016, 34, 34–54. [Google Scholar] [CrossRef]
  16. Yang, B.; Wei, X.; Xi, C.; Liu, Y.; Zeng, K.; Lai, M.-C. Experimental study of the effects of natural gas injection timing on the combustion performance and emissions of a turbocharged common rail dual-fuel engine. Energy Convers. Manag. 2014, 87, 297–304. [Google Scholar] [CrossRef]
  17. Yousefi, A.; Birouk, M.; Guo, H. An experimental and numerical study of the effect of diesel ignition timing on natural gas/diesel dual-fuel combustion at low load. Fuel 2017, 203, 642–657. [Google Scholar] [CrossRef]
  18. Yousefi, A.; Guo, H.; Birouk, M. An experimental and numerical study on diesel ignition split of a natural gas/diesel dual-fuel engine at a low engine load. Fuel 2018, 212, 332–346. [Google Scholar] [CrossRef]
  19. Shu, J.; Fu, J.; Liu, J.; Zhang, L.; Zhao, Z. Experimental and computational study on the effects of injection timing on thermodynamics, combustion and emission characteristics of a natural gas (NG)-diesel dual fuel engine at low speed and low load. Energy Convers. Manag. 2018, 160, 426–438. [Google Scholar] [CrossRef]
  20. Shu, J.; Fu, J.; Liu, J.; Ma, Y.; Wang, S.; Deng, B.; Zeng, D. Effects of injector spray angle on combustion and emissions characteristics of a natural gas (NG)-diesel dual fuel engine based on CFD coupled with reduced chemical kinetic model. Appl. Energy 2019, 182–195. [Google Scholar] [CrossRef]
  21. Ghomashi, H.; Olley, P.; Mason, B.A.; Ebrahimi, M. Simulating the influence of injection timing, premixed ratio, and inlet temperature on natural gas/diesel dual-fuel HCCI combustion in a diesel engine. Int. J. Powertrains 2015, 4, 36. [Google Scholar] [CrossRef] [Green Version]
  22. Ding, C.; Liu, W. Numerical Simulation of Emission Characteristics for Single-Cylinder Diesel Engine. Energy Power Eng. 2016, 8, 92–98. [Google Scholar] [CrossRef] [Green Version]
  23. Durbin, P.A. Near-wall turbulence closure modeling without “damping functions”. Theor. Comput. Fluid Dyn. 1991, 3, 1–13. [Google Scholar]
  24. Candel, S.; Veynante, D.; Lacas, F.; Maistret, E.; Darabiha, N.; Poinsot, T. Coherent flamelet model: Applications and current extensions. Recent Adv. Combust. Model. 1990, 19–64. [Google Scholar] [CrossRef]
  25. AVL FIRE® R2018a. Combustion Module User Manual; AVL List GmbH: Graz, Austria, 2018. [Google Scholar]
  26. AVL FIRE® R2018a. Spray Module User Manual; AVL List GmbH: Graz, Austria, 2018. [Google Scholar]
  27. Beale, J.C.; Reitz, R.D. Modeling spray atomization with the kelvin-helmotz/Rayleigh-taylor hybrid model. At. Sprays. 1999, 9, 623–650. [Google Scholar] [CrossRef]
  28. AVL FIRE® R2018a. Emission Module User Manual; AVL List GmbH: Graz, Austria, 2018. [Google Scholar]
  29. Raine, R.; Stone, C.; Gould, J. Modeling of nitric oxide formation in spark ignition engines with a multizone burned gas. Combust. Flame 1995, 102, 241–255. [Google Scholar] [CrossRef]
  30. Naber, J.; Reitz, R.D. Modeling Engine Spray/Wall Impingement. SAE Tech. Pap. Ser. 1988, 97, 118–140. [Google Scholar] [CrossRef]
  31. National Center for Biotechnology Information. PubChem Compound Summary for CID 8900, Heptane. Available online: https://pubchem.ncbi.nlm.nih.gov/compound/Heptane (accessed on 7 September 2020).
  32. Friend, D.G.; Ely, J.F.; Ingham, H. Thermophysical Properties of Methane. J. Phys. Chem. Ref. Data 1989, 18, 583–638. [Google Scholar] [CrossRef]
  33. Savli, M. Turbulence Kinetic Energy–TKE; Faculty of Mathematics and Physics, University of Ljubljana: Ljubljana, Slovenia, 2012; Volume 9. [Google Scholar]
  34. Polk, A.C.; Carpenter, C.D.; Srinivasan, K.K.; Krishnan, S.R. An investigation of diesel–ignited propane dual fuel combustion in a heavy-duty diesel engine. Fuel 2014, 132, 135–148. [Google Scholar] [CrossRef]
  35. Zhang, Q.; Li, M.; Shao, S. Combustion process and emissions of a heavy-duty engine fueled with directly injected natural gas and pilot diesel. Appl. Energy 2015, 157, 217–228. [Google Scholar] [CrossRef]
  36. Sahoo, B.; Sahoo, N.; Saha, U. Effect of engine parameters and type of gaseous fuel on the performance of dual-fuel gas diesel engines—A critical review. Renew. Sustain. Energy Rev. 2009, 13, 1151–1184. [Google Scholar] [CrossRef]
  37. Wei, L.; Geng, P. A review on natural gas/diesel dual fuel combustion, emissions and performance. Fuel Process. Technol. 2016, 142, 264–278. [Google Scholar] [CrossRef]
  38. Kuo, K.K. Principles of Combustion, 2nd ed.; John Wiley and Sons: New York, NY, USA, 2005. [Google Scholar]
  39. Maricq, M.M.; Chase, R.E.; Xu, N.; Laing, P.M. The effects of the catalytic converter and fuel sulfur level on motor vehicle particulate matter emissions: Light duty diesel vehicles. Environ. Sci. Technol. 2002, 36, 283–289. [Google Scholar] [CrossRef]
  40. Burnett, R.T.; Cakmak, S.; Brook, J.R.; Krewski, D. The role of particulate size and chemistry in the association between summertime ambient air pollution and hospitalization for cardiorespiratory diseases. Environ. Health Perspect. 1997, 105, 614–620. [Google Scholar] [CrossRef] [PubMed]
  41. Kittelson, D.; Watts, W.; Johnson, J. On-road and laboratory evaluation of combustion aerosols—Part1: Summary of diesel engine results. J. Aerosol Sci. 2006, 37, 913–930. [Google Scholar] [CrossRef]
  42. Rounce, P.; Tsolakis, A.; York, A.P.E. Speciation of particulate matter and hydrocarbon emissions from biodiesel combustion and its reduction by after-treatment. Fuel 2012, 96, 90–99. [Google Scholar] [CrossRef]
  43. Blauvens, J.; Smets, B.; Peters, J. In Proceedings of the 16th Symposium (International) on Combustion; The Combustion Institute: New York, NY, USA, 1977. [Google Scholar]
  44. Flower, W.L.; Hanson, R.K.; Kruger, C.H. In Proceedings of the 15th Symposium (International) on Combustion; The Combustion Institute: New York, NY, USA, 1975; p. 823. [Google Scholar]
  45. Monat, J.P.; Hanson, R.K.; Kruger, C.H. In Proceedings of the 17th Symposium (International) on Combustion; The Combustion Institute: New York, NY, USA, 1979; p. 543. [Google Scholar]
  46. Baulch, D.L.; Drysdall, D.D.; Horne, D.G.; Lloyd, A.C. Evaluated Kinetic Data for High Temperature Reactions. Vol. 2: Homogeneous Gas Phase Reactions of the H2—N2—O2 System. Berichte der Bunsengesellschaft für Physikalische Chemie 1974, 78, 212–213. [Google Scholar]
  47. Hanson, R.K.; Salimian, S. Survey of Rate Constants in the N/H/O System. Combust. Chem. 1984, 361–421. [Google Scholar] [CrossRef]
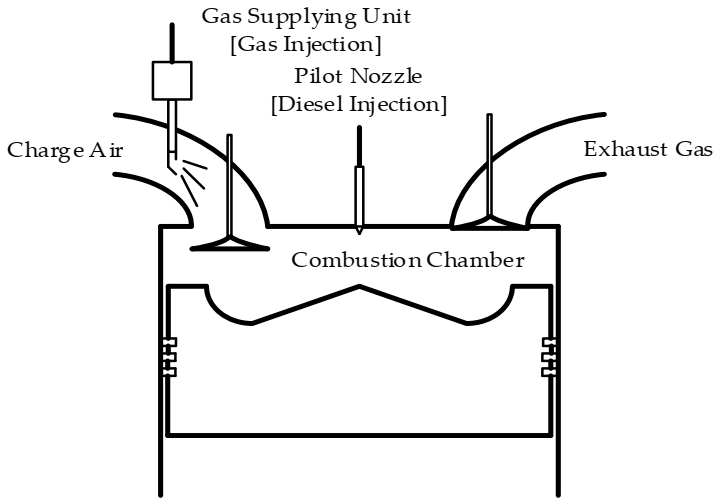
Figure 1. The principle schematic of the simulated engine.
Energies 14 01342 g001
Figure 2. The quarter-cut 3D geometries of the piston and the pilot fuel nozzle.
Energies 14 01342 g002
Figure 3. Half of the symmetry combustion chamber geometry.
Energies 14 01342 g003
Figure 4. One-twelfth of the entire 3D computational mesh of the combustion chamber at the TDC (a) and 60 CAD ATDC (b).
Energies 14 01342 g004
Figure 5. The computational coarse (a), medium (b), and fine (c) mesh resolutions at the TDC.
Energies 14 01342 g005
Figure 6. The CFD results of the simulations using the three different mesh resolutions.
Energies 14 01342 g006
Figure 7. Comparisons of simulation results and shop test data.
Energies 14 01342 g007
Figure 8. The mean TKE of the fluid flow in the engine cylinder in both operating modes.
Energies 14 01342 g008
Figure 9. The rate of heat release diagrams.
Energies 14 01342 g009
Figure 10. The mean in-cylinder pressure diagrams (a) and maximum in-cylinder pressure (b) in the two operating modes.
Energies 14 01342 g010
Figure 11. The liquid diesel mass remaining in the engine cylinder.
Energies 14 01342 g011
Figure 12. The mean in-cylinder temperature (a) and maximum in-cylinder temperature (b).
Energies 14 01342 g012
Figure 13. The mean NO mass fractions (a) and NO emission masses (b) in both combustion cases.
Energies 14 01342 g013
Figure 14. The NOx-Soot area according to the equivalence ratio—temperature diagrams.
Energies 14 01342 g014
Figure 15. The mean soot mass fractions (a) and soot emission masses (b) in both combustion cases.
Energies 14 01342 g015
Figure 16. The mean CO mass fractions (a) and CO emission masses (b) in both combustion cases.
Energies 14 01342 g016
Figure 17. The mean CO2 mass fractions (a) and CO2 emission masses (b) in both combustion cases.
Energies 14 01342 g017
Figure 18. The spatial in-cylinder temperature contours at some crank angle degrees.
Energies 14 01342 g018
Figure 19. In-cylinder pressure diagrams (a) and maximum pressure (b) according to the change of the S.O.I angle in the diesel mode.
Energies 14 01342 g019
Figure 20. In-cylinder pressure diagrams (a) and maximum pressure (b) according to the change of the pilot S.O.I angle in the dual-fuel mode.
Energies 14 01342 g020
Figure 21. In-cylinder temperature diagrams (a) and maximum temperature (b) according to the change of the S.O.I angle in the diesel.
Energies 14 01342 g021
Figure 22. In-cylinder temperature diagrams (a) and maximum temperature (b) according to the change of the pilot S.O.I angle in the dual-fuel mode.
Energies 14 01342 g022
Figure 23. Mean NO mass fraction diagrams (a) and NO emission masses (b) according to the change of S.O.I angle in the diesel mode.
Energies 14 01342 g023
Figure 24. Mean NO mass fraction diagrams (a) and NO emission masses (b) according to the change of the pilot S.O.I angle in the dual-fuel mode.
Energies 14 01342 g024
Figure 25. The engine powers according to the change of the pilot S.O.I angle in the diesel mode (a) and dual-fuel mode (b).
Energies 14 01342 g025
Figure 26. Mean CO mass fraction diagrams (a) and the average CO mass fraction (b) according to the change of S.O.I angle in the diesel mode.
Energies 14 01342 g026
Figure 27. Mean CO mass fraction diagrams (a) and the average CO mass fraction (b) according to the change of the pilot S.O.I angle in the dual-fuel mode.
Energies 14 01342 g027
Table 1. The specifications of the simulated engine.
ParameterValueUnit
Type of Engine4-Stroke Dual-Fuel Engine
Name of Engine6H35DF
Fuel Gas SupplyingGas Fuel Port Injection
No. of Cylinder6
Cylinder Bore350mm
Stroke400mm
Compression Ratio13.5:1
Connecting Rod Length870mm
Engine Speed720rpm
Power2880 @ 720 rpmkW
Indicated Mean Effective Pressure (IMEP)20bar
No. of Pilot Injector1
Injector Spray Angle155deg.
Gas FuelNG
Lower Calorific Value (LCV) of Natural Gas (NG)50000 *kJ/kg
Pilot FuelDiesel
Lower Calorific Value (LCV) of Diesel42343 *kJ/kg
* provided by AVL FIRE database.
Table 2. The summary of the numerical models.
Model Description
CombustionStandard Species Transport Model (Appendix A)
Extended Coherent Flame Model—ECFM (Appendix B)
EmissionNOExtended Zeldovich (Appendix C)
SootKinetic Soot formation (Appendix D)
IgnitionAuto-Ignition Model (Diesel Mode)
Diesel Ignition Gas Engine (Dual-Fuel Mode)
SprayEvaporationDukowicz Model (Diesel Mode)
Multi-component (Dual-Fuel Mode)
BreakupWAVE
Wall interaction Walljet1
Turbulence k-zeta-f
Table 3. Boundary conditions and initial conditions for the numerical simulation cases.
Boundary ConditionsBoundary Type/Specific Condition
Cylinder headWall/Temp./570.15 K
PistonMesh movement/Temp./570.15 K
LinerWall/Temp./470.15 K
Segment cutPeriodic/Inlet/Outlet
Initial conditionsValue
Pressure at IVC3.5 bar
Temperature at IVC320.5 K
IVC35 CAD ABDC
EVO62 CAD BBDC
S.O.I12 CAD BTDC
Diesel injection duration15 CAD in the dual-fuel mode
32 CAD in the diesel mode
Table 4. The basic properties of the fuels [25,31,32].
FuelDieselNGUnit
Density6800.657kg/m3 @ 25 °C, 1 at
Chemical name/formulan-Heptane/C7H16Methane/CH4
Lower calorific value42,34350,000kJ/kg
Molecular weight100.20516.043g/mol
Boiling point98.38−162°C
Auto-Ignition temperature223537°C
Specific heat capacity (Cp)224.6435.69J/mol·K @ 25 °C
Stoichiometric air-fuel ratio15.217.19kg/kg
Table 5. The properties of meshes and the calculation time.
Mesh ResolutionsMesh 1—CoarseMesh 2—MediumMesh 3—Fine
Number of faces on haft of 2D mesh at the TDC12,949 faces17,715 faces39,307 faces
Total number of cells of entire 3D mesh586,796 cells882,620 cells1,593,732 cells
Calculation time24 h36 h92 h
Publisher’s Note: MDPI stays neutral with regard to jurisdictional claims in published maps and institutional affiliations.