Abstract
The design of every power supply system must guarantee the safety for human life even in the event of a fault. Due to the system change in the electrical power supply, the fault current contains more and more unknown shares of current harmonics. Especially in medium voltage grids, which are operated with resonant grounding, these are determining for the level of the single-pole ground fault current for determination of permissible touch voltages and compliance with the normative requirements of the European standard EN 50522 must therefore be re-evaluated. In its first part, this concept paper presents the frequency dependent principles of earth loops formed by the grounding system. The focus here is on cabled grids and the influence of connected structures of the low voltage grid. The second part deals with the superposition of these loop currents and the resulting earth currents in case of a line to ground fault. The authors address explicitly the frequency dependence of the current distribution and describe the expected behaviour for current harmonics. The proposed approaches result from processing the state of knowledge, research work and the evaluation of several measurements. The aim is to develop an understanding of the influence of the components connected to a grounding system and to derive generally applicable principles. Therefore, the authors present the results of recent measurements in the last part of the handed paper and point out the possibilities and limits of modeling. It is shown that a dedicated treatment of harmonic currents in the case of a single-pole fault is possible with the methods described. This allows these to be neglected in the estimation of touch voltages under specified circumstances, saving costs for the assessment of grounding systems.
1. Introduction
The design and evaluation of electrical grounding systems is one of the important tasks that any grid operator has to deal with. The grounding must fulfill the requirements of safety of living beings, lightning protection, electromagnetic interference and operational tasks. For medium voltage grids, the handling of single-pole ground faults and the occurrence of permissible touch voltages has become the focus of recent discussions [1,2,3,4,5,6]. In Europe, the normative specifications regarding personal protection are defined by the standard EN 50522 [7]. It sets out the requirements for grounding electrical installations with a rated voltage exceeding and defines a maximum permissible touch voltage of .
In order to limit the single-pole fault current, resonant neutral star point grounding is used in power supply systems with nominal voltage up to . The resonant grounded neutral point treatment defined the design of the ground impedances so that the normative requirements were fulfilled [4,5]. In case of a single-phase ground fault the capacitive ground-fault current at the fault location is compensated by the inductive current . In case of ideal networks, complete tuning the remaining fault current contains the residual active current with a frequency .
The transformation of the classic power grid is currently taking place, in which decentralized power generation and electronic components play an increasingly important role. This leads to an increase in harmonics in the grid, which are reflected in the residual ground-fault current [8,9,10,11]. Therefore, the residual ground-fault current in networks with resonant grounded neutral point treatment was dominated by current shares with frequencies above the fundamental frequency [8,9,10]. This makes it imperative to reassess existing grounding systems with regard to the stress from these currents. In recent research, approaches for actively compensation of harmonics in the residual current are already discussed [11,12]. This is mostly done due to aspects of electromagnetic interference or fault arc extinction. With regards to personal protection, the costs for such devices can be spared if there is more precise knowledge about the ground potential raising effect of harmonics in the single-pole fault current.
It is generally known that not the entire fault current flows into the earth. The standard EN 50522 [7] already defines a reduction factor for power cables with screens grounded on both ends and transmission lines with shielding wires. The reduction factor describes the ratio between the current to earth and ground-fault current respectively (). (The indices used here to refer to the nomenclature of the standard and may differ from those defined in this paper.) For cables in particular, this is a quantity that is strongly dependent on the frequency [13]. However, this circumstance is not covered by the standard and also barely addressed in the literature. Furthermore, the influence of other connected infrastructures has not yet been fully explained. These two issues are currently the subject of research and are examined in more detail in this concept paper. This is limited to cabled grids and the consideration of single-pole ground faults, as these account for more than 80% of all faults [14].
A detailed examination of the grounding system reveals that it forms a multitude of loops with earth return. If the fault current flows parallel to potential return conductors in close proximity, as it is the case with phase conductors and the cable screens or other conductors with a screening effect, inductively excited currents are driven in these loops. Occurring ground currents are therefore the result of the superposition of these circulating currents. The classical way of thinking of splitting the current at the fault location is therefore not exact, hence, in the following it is always referred to as a current distribution in the whole grounding system.
Accordingly, this paper provides the basis for the mathematical description of these overlayed currents. This results in the introduction of a model approach for the frequency-dependent current distribution in the grounding system, which is finally enhanced with measurement data and calculations. A dedicated treatment of harmonic currents in the case of a single-pole fault is presented. An indication is given these may be neglected in the estimation of touch voltages in certain grid structures. These considerations can contribute to saving costs for the assessment of grounding systems.
2. Theoretical Aspects
2.1. Inductively Coupled Loops
Two electrical circuits in close proximity to each other are are inductively coupled by their mutual inductance in case of current flow. The voltage induced in the loop j, which is caused by the stationary current of another loop i, is calculated:
The considered loop j is spanned by a metallic conductor and its return path. This return path may be another metallic conductor or the physical earth (further simply `earth’), if the conductor is grounded on both ends. Due to the induced voltage a current is driven through the closed loop, as shown in Figure 1. Assuming that the loop j is free of other electrical sources and only excited by the current , the Equation (2) is given for the mesh and the indicated voltage and current directions in Figure 1. Equation (3) is derived from this to calculate the current .

Figure 1.
Inductively excited loop.
The impedance is the self-impedance of the loop j. Its resistive part consists of the conductor’s resistance and the resistance of the return path. In case this return path is the earth, it includes the resistance of the grounding electrodes and the influence of the earth as a non-ideal electrical conductor. The loop-inductance results from the internal inductance of the conductive paths and the self-inductance of the loop, defined by its geometry.
If the current is defined as the reference value on the real axis (), the induced voltage has the phase angle . According to Equation (3), the phase angle of the current is , for the loop-impedance is resistive-inductive. Due to the frequency dependency of the impedance , its reactive part gets dominant with increasing frequency, which causes the currents and to have a phase shift of almost .
2.2. Earth Return Conductor
The earth itself is a non-ideal electrical conductor with a finite conductivity . It is coupled to the metallic conductors of the electrical power system by the electromagnetic field. Therefore, the conductive earth is not only affecting the self-impedance of the earth return loop but has also an inductive backlash to the power system due to occurring eddy currents.
There are different approaches to consider the effect of lossy earth. Simplified models calculate the inductive coupling of loops with earth return by placing a fictional return conductor at the depth of , which is the finite earth current depth. It describes the penetration depth of the electric field of an infinitely extended conductor into the earth. The earth current depth depends on the frequency f of the current and the earth conductivity , according to Equation (5). Figure 2 exemplary shows an extended conductor A and two coupled conductors a and b, all with connections to the earth on both ends. It is indicated that the depth of the earth current decreases with increasing frequency and the loops spanned by the fictional earth conductor and the others thus become smaller.
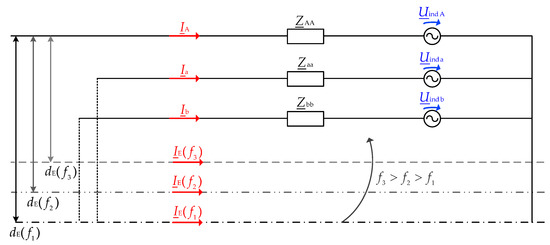
Figure 2.
Inductively coupled loops with fictive earth return.
Due to the distortion of the field, the finite earth current depth has to be corrected for short conductors with the use of formula (6) established by Meyer [15]. In this equation is Euler’s constant with the value of about .
The conductive earth can also be modeled as half-cylindric conductor with the radius and then be calculated and reduced with the partial conductor method [16]. The procedure is explained in detail in Appendix A. In any case, the earth current depth decreases with the frequency increasing and the current tends to flow back closer to the conductor.
Any kind of soil is a frequency-dependent medium. CIGRE technical brochure 781 [17] recommends taking its frequency dependency into account, if the specific resistivity exceeds . For this effect is usually only noticeable for current frequencies above 10 kHz, it is unnecessary to consider it for normal system operation and ground faults.
2.3. Inductive Coupling of Cable Screens
Because of the cable geometry, the screens of power cables are always strongly inductively coupled to their phase conductors, for they run in parallel with a short distance to each other. Considering the earth as an electrical conductor, the current distribution in a cable system can be described with the relation (7).
with the impedances defined as:
The capital letters ‘A’, ‘B’, ‘C’ in the index symbolize the inner conductors of the inducing system. The lowercase letters ‘a’, ‘b’, ‘c’ characterize the screening wires or the conductors of the influenced system. The system of equations can be extended by multiple systems. This increases the rank of the coefficient matrix and the voltage and current column vectors. The index ‘E’ specifies the conductive earth.
The full system of equations according to (7) can be described in a simplified way with sub-matrices:
The partitioning of the equation system (10) leads to the reduced system (11). The index ‘C’ describes the sub-matrix of all metallic conductors. The impedance matrix is symmetrical, therefore can be written .
There are different approaches to calculate the impedances of a cable system. The analytic results shown in this paper were calculated with the partial conductor method described by Schmidt et al. [16,18], which is including the earth conductor, and the use Biot Savart’s law as described in Wießner et al. [19]. The Appendix A explains the calculation process in more detail. The matrix can be reduced under the assumption that the earth conductor has reference potential :
After some rearrangement of the equation system (12), the relation (13) can be written for the voltage column vector of the system and screen conductors.
If the cable screens are connected to the grounding system on both ends, they form earth loops as well as loops among each other. The coupling between the phase conductors and the screens is strongly frequency-dependent. For a single earth loop, as shown in Figure 1, the induced screen current can be calculated using formula (3). In accordance with the frequency-dependent impedances given in Figure 3, the ratio between the impedances becomes for increasing frequencies, as well as the influence of the almost constant earth return impedance decreases.
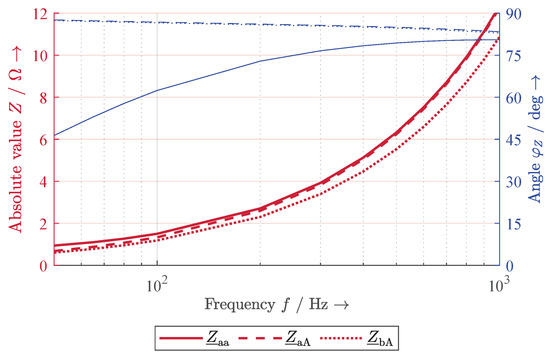
Figure 3.
Calculated impedances of cable screens. (NA2XS2Y 1×150/25 12/20 kV, , triangular laying).
Therefore, the ratio between the screen current and the exciting current will approach the value of . This effect is due to cable’s geometry, where the geometric mean distance of the screen to itself (circle of itself) is almost equal to the geometric mean distance between the phase conductor and its screen (area enclosed by a circle). Details about the geometric mean distance are given in Appendix B.
Considering that there is a ground connection at every electrical substation, the cable screens can been seen as chain conductors, as represented in Figure 4. A similar model approach has already been presented in Fickert et al. [13]. The local grounding current at each substation is the result of the superposition of all currents and flowing in the loops spanned by the screens and the earth. This effect is explained further in Section 3.
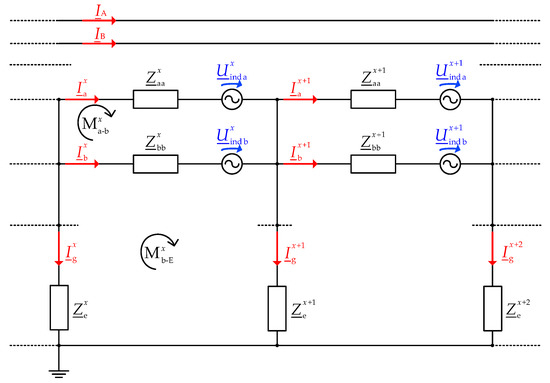
Figure 4.
Chain conductor formed by the cable screens, shown for one stationary frequency.
2.4. Grounding of the Low Voltage Grid
The grounding of the low voltage grid may also influence the local grounding situation at the substation. If it is realized by connecting a PE- (protective earth) or a PEN-conductor (protective earth neutral) to the grounding system of the substation, it forms additional loops.
A separation can be made:
Some of the low voltage cables run in parallel with the feeding medium voltage cable, for instance, if the substations are also connected on the low voltage level or if simply the same cable trench is used for practical reasons. In this case, the low voltage conductors for grounding purposes are inductively coupled to the medium voltage system. They behave as reduction conductors and may be treated like additional screens in the mathematical approach.
If the low voltage cable spread out from the substation in any direction and their inductive coupling is neglectable, they simply work as far grounding electrodes in addition to the local grounding system. Their impedance , which defines the transition to earth, can be estimated from the quadripole theory with the parameters of the chain conductor illustrated in Figure 5.
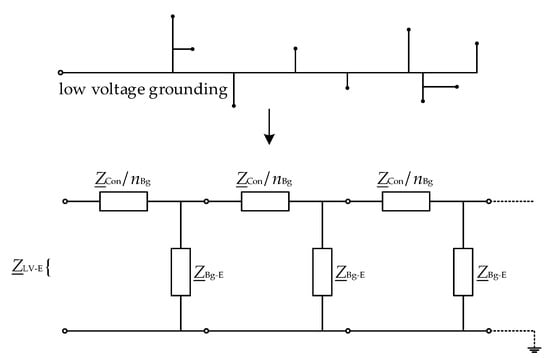
Figure 5.
Mathematical simplification of the low voltage grounding.
The matrix form can be written to:
with the chain matrix defined as:
The series connection of the quadripoles can be combined to the chain matrix in (16):
The values in the Equations (14) and (15) represent quadripole parameters of the chain form and assume the earth connections to be equally distributed along the network, as shown in Figure 5. Here, is the thought impedance of the conductor, expanded over the length ℓ of the outgoing feeder. describes the adopted grounding impedance for one building, while is the number of buildings, which are supplied by the same low voltage feeder. With , the input impedance for a single low voltage line is calculated with:
Depending on the number of connected buildings, can be either dominated by and therefore almost frequency independent, or tending to become more inductive with increasing frequency, for the conductor’s impedance is given by . In rural areas is assumed to be almost resistive, for it is mainly defined by the earth transition of the connected buildings. The resulting impedance to earth , effective between the substation and the earth, is calculated with Equation (18), which is used to derive the simplified chain ladder model shown in Figure 4.
is the impedance of the substations’s local grounding electrodes, defines the earth transition of other connected infrastructure, while defines the number of connected low voltage lines.
Grounded structures of the low voltage grid near the substation form an effective grounding system with it. In Mallits et al. [20] the influence of a high current fault at a medium voltage substation on and the potential rise of the surrounding low voltage grid is presented. This illustrates the difficulty in defining the boundary of the substation’s local grounding system. Various studies [21,22,23,24] have investigated the mutual grounding effect of distributed electrodes by measuring their voltage distribution. In any case, these additional ground connections have a reducing effect on the complex impedance to earth .
3. Current Distribution in Grounding System under Fault Condition
3.1. Superposition of Loop Currents
If there is a single-pole ground fault occurring at a substation, there will be a superposition of currents at the fault node (index ), as shown in Figure 6. This conclusion is also drawn in Fickert et al. [13].
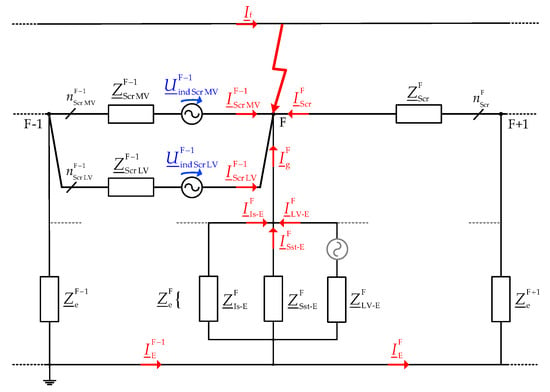
Figure 6.
Current superposition at the fault node, shown for one stationary frequency.
In the example shown in this subsection, the fault is fed only by one side of the line. The load currents of the phase conductors are assumed to be symmetrical and are therefore ignored. The local grounding current of every substation is distributed along several paths. At the fault node these are represented by the impedances to earth of the supplied low voltage grid , the substations’s grounding electrodes and surrounding infrastructure .
This complex model in presented to give an understanding of all die current loops existing in the grounding system. For practical purposes, it may be simplified by summarising the impedances to earth to one impedance with Equation (18), which leads to the model shown in Figure 4. Direct measurement of all illustrated currents is often not possible, because there is no defined point of entry to the grounding system. In this case, the grounding current at the substation can be calculated with Equation (19), which results from the sum of current at this node.
The screen currents on the feeding side are primarily driven by the voltage induced into the screen-earth loop. Due to its inductive origin described by Equation (3), the summarised screen current has a phase angle close to relative to that of the fault current . This leads to a neutralization at the fault node and thus to a lower grounding current . The current can be determined and measured as a difference of the fault current and the screen currents and . It should be noted that the screen current might not only contain the current share of the medium voltage screens (index MV), but also the current flowing through other conductors (index LV) running in parallel, as indicated in Figure 6 and given in Equation (20).
According to Equation (19), the grounding current is an artificial quantity containing different shares. These are the current flowing through the grounding system of the substation (Sst), the connected low voltage lines (LV) and other infrastructure (Is). Some current shares are expected to flow back to the neutral point through metallic conductors (as marked with the grey lines in Figure 6). Therefore, they never enter the physical earth and have no potential raising effect. For that reason, the calculated current is not mandatory equal to the current that actually flows through the earth. The grounding systems of adjacent substations may not be independent of each other, especially not in urban regions. For the analytical review, it is practical to define impedances to earth and neglect the connections to other substations in order to achieve simplification and solvability of the model.
There may also be loops with earth return formed by the grounding system of the substation and connected conductors. If these loops are excited by inductive coupling (as implied grey in Figure 6), rather by the fault current or by other influences, a current flows inside of the loop and overlays with the grounding current driven through the substation’s grounding system. Because of this superposition, it is even possible that the current becomes bigger than the grounding current .
According to this effect and the mutual effect of distributed grounding electrodes, already mentioned in Section 2.4, it is difficult to say, which of the current shares are caused by the fault current and are part of the local earth current. It is also difficult to measure all these small current shares separately. Therefore, it is more practical to consider the summarised grounding current for the comparison of measured data and calculations. This also results in a more practical simplification of the chain conductor model as illustrated in Figure 4; but it also makes it impossible to differentiate between the influences of the various grid structures in a dedicated way as outlined in the following paragraphs.
The grounding current may also flow through the local impedances to earth of adjacent substations. If they are placed on the feeding side of the line, the local grounding current results from the superposition of the loop currents and flowing through the left- and right-side mesh touching . The global grounding current can not be measured, for it flows through grounding electrodes distributed in the whole electrical grid. From a mathematical point of view, the reduction factor generally describes the ratio between the grounding current and the fault current :
The factor characterizes the effect of all distributed grounding electrodes. For the evaluation of the local electricity distribution, it seems to be practical to define local reduction factors. The screen reduction factor is based on the grounding current at the substation and describes the reducing effect of the connected screen conductors:
If all the screens are inductively coupled to the fault current, the local reduction factor is analogue to shielding factor known from the signal theory. The substation reduction factor only considers the current through the local grounding electrodes of the substation:
It additionally assumes these electrodes to form a voltage gradient, which is not influenced by other structures connected to the substation’s potential equalization bar. Both factors, and , are therefore theoretical quantities. In most constellations, it is difficult to separate the individual influencing factors.
There are already numerous publications addressing current reduction factors of cable systems, such as Fickert et al. [13], Acevski et al. [25], Medic et al. [26], Popović [27,28,29], Sarajcev et al. [30], Collela et al. [31] and many more. All of them provide methods for calculating the overall reduction effect. A separation which explicitly shows the influence of the individual current paths is not made. Furthermore, the frequency dependency of the reduction factor is not discussed.
3.2. Frequency Dependent Current Distribution
For the inductive coupling impedances and the self impedances of the return conductors are strongly frequency-dependent, the distribution of the fault current in the grounding system will be different for harmonics in the current than for the component of the fundamental frequency. Thus, the reduction factors, named in Section 3.1, are functions of the frequency .
The share of the screening currents excited by the fault current , can be calculated for one stationary frequency with Equation (24), which results from the sum of voltages in the mesh. Here the impedances define the effective grounding impedances of the left- and right-side chain conductors included in the mesh x. To get the total screening current , the coupling to the others screens has to be taken into account, according to Equation (25).
The loop impedance is strongly affected by the resistances and of each screen and the grounding, the screens may carry a similar current share of the fundamental frequency. As allready implied in Section 2.3 and Figure 3, the self impedance and the coupling impedance of the screen of the cable, carrying the fault current , become almost equal for higher frequency. As the influence of the earth return becomes less, the induced screen current becomes almost equal to the fault current , but with the inverse phase angle. This leads to an almost complete elimination of harmonics of higher order in the current at the fault node and thus to a low share of them in the grounding current . Due to this, all the reduction factors become smaller for currents of higher frequency.
Due to the equally growing self impedance of the more distant screens but a lower coupling, the related currents in these conductors become smaller with increasing frequency. The remaining currents are mainly circular currents between the screens, which are driven by the different induced voltages in the loops. They are increasingly dominant in the higher frequency band, for the couple impedances between the screens and the faulty conductor begin to differ from each other, as illustrated in Figure 3. This effect can also be extracted from the different phase angles of the screen currents, as shown further below in Section 4.2.
The remaining grounding current splits up between the grounding system of the substation and all the other conductors connected to the local equipotential bonding. The ratio is depending on the number of connections and the terminating impedances . If the resistance of these additional conductive paths is low, their impedance is dominated by their reactance for higher frequencies. As the impedance can be assumed as an almost constant resistance, harmonic shares in the grounding current tend to flow through the substations grounding electrodes.
Big and meshed low voltage grids have an impedance to earth much lower than the earth transition impedance of the substation. Therefore, they usually carry almost the whole grounding current . Due to the reduction effect of the screens, the grounding current is dominated by lower frequencies. Thus the low voltage connections, as well as other infrastructure, have a huge reducing effect on the local earth current with the fundamental frequency.
4. Measurement and Calculation
4.1. Measurement Setup and Findings
Measurements have been performed in the 20-kV grid of a German DSO to investigate the distribution of currents in the grounding system. The measurement setup is given in Figure 7.
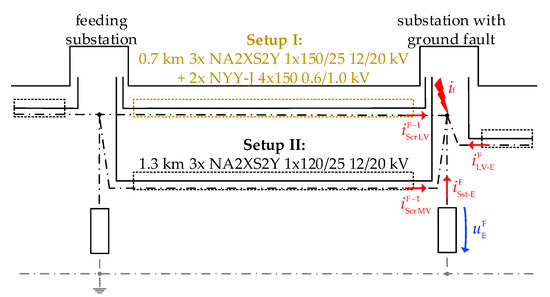
Figure 7.
Measurement setups.
At two different transformer substations, a single-pole ground fault was inserted between phase A and the local grounding system. The transformer is supplied by only one medium voltage cable system. In setup I there is an additional connection to the low voltage side of the feeding transformer substation, realized by two low cables buried in parallel to the medium voltage feed-in. Both substations with the fault inserted are placed in a rural region and with the connected low voltage grid forming a galvanic island. The feeding substation is assumed to be connected to a global grounding system, as defined by the DSO.
For this 20-kV grid is compensated by resonant grounding, it was possible to permit a stationary ground fault current. During the fault the fault current , the screening currents and and the grounding current , flowing into the low voltage connections, have been measured at the fault node in the time domain. From the wave shapes the complex currents of the harmonic shares have been extracted with a FFT. The currents and have been calculated out of the sum of current at the fault node, according to Equation (19). The local reduction factors and have been determined with the Equations (22) and (23).
The results are summarised in Figure 8 and given more detailed in Appendix A. It can be seen, that the screens of the medium voltage cables carry the highest current share, which is increasing with higher frequency. The screen of the cable carrying the fault current is dominant for the reducing effect at the fault node , as already explained in Section 3.1. The parallel PEN-conductors in measurement I also have a not neglectable reducing effect on the grounding current , because of their inductive coupling.
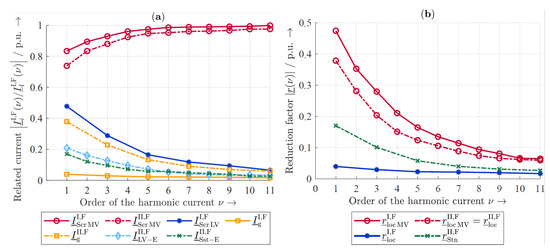
Figure 8.
Results of the measurements: (a) related current shares, (b) reduction factors.
As to be seen in Figure 8, this effect decreases with the frequency increasing, due to the screening effect of the faulty cable. For higher frequencies, these connections behave like distributed grounding electrodes. The current split between the grounding electrodes of the substation and the low voltages connections in measurement II is almost constant, implying that their impedance is almost resistive.
The current distribution reflects in the reductions factors. In Figure 8 the screen reduction factor is split into the effect of the medium voltage cable screens and the overall screening effect . The comparison of the graphs indicates, that the reducing effect of currents with high frequency is primarily caused by the screening of the medium voltage cables. In measurement I, the current through the stations grounding electrodes was too small to determine it. Therefore, only the grounding current is taken into account and the substation reduction factor () is not given. During both faults no critical earth potential rise has been measured (maximum 10.3 V), for the current share flowing through earth was quite low.
So the following conclusions can be drawn:
- High-frequency shares in the fault current have an almost neglectable effect on the local earth current and thus on the earth potential rise, if the fault occurs at substations fed by cables, which screens are grounded on both ends.
- If this substation has additional feed-ins or other reduction conductors buried in parallel with the feeding cable, the local grounding current is almost completely reduced on all frequency bands. Therefore, the fault current raises no significant potential differentials. So even if the substation forms a galvanic island branching off a meshed grid, it might be assumed as a part of the global grounding system (considering the resonant grounding).
Since the global grounding system is not defined by quantitative parameters, but only as an area that appears to be an equipotential plane, grid operators have to set their own guidelines. Published methods to identify these have been compared in Colella et al. [32]. In Fickert et al. [6] the aspect of global grounding systems is addressed with special respect to grids with resonant neutral star point grounding. The majority of these methods imply similar tendencies as in the example shown here: A strong electromagnetic coupling of the faulty phase to reduction conductors and the distribution of the grounding current through peripheral grid structures.
4.2. Calculation and Comparison
To proof the theoretical aspects given in the sections above, the measurement setup has been recreated analytically. The chosen setup is a very simplified one, as given in Figure 7, for it is hard to consider all connections within the grounding system. Therefore, the complex model in Figure 6 is reduced to the examination of the fault node. For setup I the low voltage connections and the grounding electrodes of the substation have been considered as one combined impedance , as illustrated in Figure 4. Its value is estimated by the number of low voltage connections and the maximum grounding resistances accepted by the grid provider with . The inductive part has been neglected. The impedances estimated for setup II result from measured values and are determined with and . The earth transition impedance of the prior substations and the feeding station have been assumed quite low (<), for they belong to a global grounding system. All the cables have been modeled with coupled parameters according to their geometry.
A comparison of some of the calculation results and the measured values is exemplary given for the 50-Hz- and the 250-Hz frequency component of the currents in Figure 9 (for detailed values see Appendix C). The given phase angles are related to the fault current with all current meter arrows pointing to the fault node, as indicated in Figure 7. As shown, the characteristic distribution of current can be recreated quite well. The Error is bigger for the lower frequency, for the calculation is more sensible to the input of the geometry and the resistance of the conductors, which are both always represented with a certain vagueness. The 50-Hz frequency component is overlayed with the influence of the asymmetrical load current, which is not considered in the model. The calculations fit the measurement better in setup II, for the grounding grid is not that complex and therefore easier to represent.
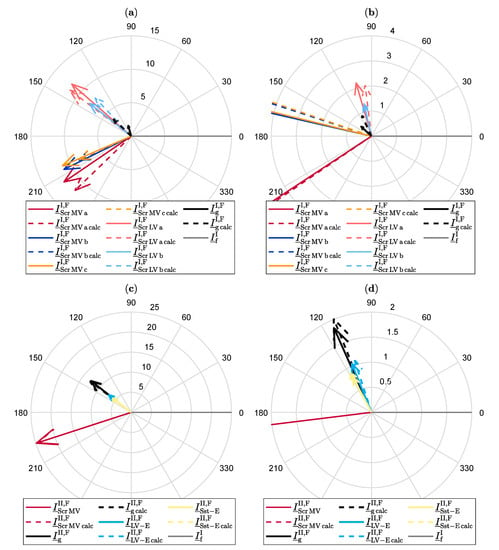
Figure 9.
Comparison of the measured and calculated current shares (values in A): (a) Setup I, 50-Hz component, (b) Setup I, 250-Hz component, zoomed, (c) Setup II, 50-Hz component, (d) Setup II, 250-Hz component, zoomed.
The superposition of loop currents can be derivated from the vector plot in Figure 9. At a frequency of the screen current shows the most significant real component in the order of magnitude. This indicates the main `return path’ of the fault current, even though the origin of the screen current is mostly inductive. The complex currents of the more distant PEN-conductors are mainly defined by their imaginary component, which indicates the loop currents flowing in the meshes spanned by the screening conductors.
There is a noticeable difference between the calculated and the measured grounding currents at the substation (values given in Appendix C). This might be explained by the overlay with other loop currents, which are not caused by the fault or represented by the calculation model as a simple impedance and therefore not taken into account. For the model only indicates the influence of the fault current, the calculated grounding current might differ to the measured one, if their values are quite small. Still, the calculated earth potential rise only reaches a summarised value of less than 1 V for setup I with the possibly reducing effect of the connected low voltage grid not even taken into account.
The deviations in the calculation have the following causes:
The model calculations cannot take into account all the boundary conditions of the complex grounding network. The conductors are represented as straight lines and irregularities in the geometry are not taken into account. Exact values for many elements of the grounding system are estimated. Not all effective reducing conductors can be considered. The calculated current is very sensitive to the the phase angles of the overlayed currents. If the reduction factors are low and thus the orders of the grounding currents very small, the relative error caused by small deviations becomes larger.
This indicates well the limits of the model. While the complete equivalent circuit according to Figure 6 represents all current paths and a mathematical description is possible, it is almost impossible to represent all the impedances correctly due to too many real-world uncertainties. The finding of this is, that the real circumstances will never be exactly reproduced in any model, for there are always influences with unknown quantities. This makes it imperative to develop further approaches to reduce complex grid structures, so that they are represented in the calculation with a calculated uncertainty.
Nevertheless, by using simplified model approaches, the characteristic current distribution can already yet be reproduced and the quantitative order estimated, to point out critical fault nodes in the grid. It also points out, that single-pole ground faults in such constellations drive such a small earth current, which cannot be clearly differed from other currents flowing in the local grounding system. This also demonstrates that the characteristic distribution of harmonics currents in the grounding system can be predicted by the presented methods. This makes it possible to estimate the risk arising from these in addition to the normative approach. In this way, unnecessary investment in the refurbishment of local grounding arrangements may be avoided.
5. Discussion
The considerations of the presented paper reveal a strong frequency dependency of the impedances effective in the grounding system. In the constellations considered here, only very minor parts of the higher-frequency shares (harmonics) of the fault current flow into the earth.
Consequently, they do not cause a significant rise in the local earth potential. This frequency dependency is not yet covered by the standard procedures for the determination of expected touch voltages, so that these are often overestimated. The model calculations and the measurements show that it may be possible to neglect harmonic components in the fault current in the context of personal protection.
The paper at hand summarises the main aspects for the description of the frequency-dependent distribution of current in the grounding system, with the main focus on cabled medium voltage grids with resonant grounding and the treatment of single-pole ground faults. However, these electrophysical principles can also be applied to other grid constellations.
The application of the presented calculation methods has shown that it is possible to evaluate grounding systems under given boundary conditions with sufficient accuracy. Such calculations can replace time-consuming and extensive measurements. The considerations go further than the normative approaches and point out additional possibilities for the quantitative evaluation.
So in future, research will increasingly focus on the influence of frequency-dependent system impedances and the resulting current and potential distribution. Special attention will be paid to the influence of different grid structures and the way in which these can be summarised and abstracted into generally valid approaches.
Author Contributions
B.K. evaluated the existing data, performed the analyses listed in this paper and summarised them in a scientific context. U.S. contributed the initial ideas and is responsible for the overall coordination of the conducted research as a scientific expert. U.S. and B.K. summarised the relevant aspects about the frequency-dependent current distribution in grounding systems with regard to standardization. J.H. was responsible for planning the measurement campaign and coordinated its execution on the site. All authors participated in the recording of the measurement data and contributed their expertise to this paper. All authors have read and agreed to the published version of the manuscript.
Funding
This research was funded by the European Social Fund (ESF) and the Free State of Saxony (https://www.strukturfonds.sachsen.de, accessed: 18th February 2021). Benjamin Küchler and Jonathan Hänsch are members of the junior research group SaxoGRID (accessed on 18 February 2021), which has the project number 100339502, and are financed by these fund.

The publication costs of this article were funded by the University of Applied Sciences Zittau/Görlitz.
Data Availability Statement
The data presented in this study are available on request from the corresponding author. The data are not publicly available due to the confidentiality of the measurement obtained from the grid of the involved DSO (stays anonymous). Relevant data is given in Appendix C.
Conflicts of Interest
The authors declare no conflict of interest. The founding sponsors had no role in the design of the study; in the collection, analysis, or interpretation of data; in the writing of the manuscript, and in the decision to publish the results.
Abbreviations
The following abbreviations are used in this manuscript:
| DSO | Distribution System Operator |
| FFT | Fast Fourier Transformation |
| LV | Low Voltage |
| MV | Medium Voltage |
| PE | Protective Earth |
| PEN | Protective Earth Neutral |
Nomenclature
Variables and Constants
| A | Area |
| Chain matrix of the LV grounding | |
| a | Edge length |
| f | Frequency |
| Finite earth current depth (infinitely extended conductor) | |
| Euler’s number | |
| I | Current, RMS value |
| Capacitive ground fault current | |
| Current to earth, earth current | |
| Fault current (EN 50522) | |
| Fault current | |
| Grounding current | |
| Inductive current | |
| Residual current | |
| Residual active current | |
| Screen current, Screening current | |
| Current through x to earth | |
| Zero sequence current | |
| Complex number | |
| L | Inductance |
| Internal inductance | |
| ℓ | Length |
| Conductor length | |
| Mesh | |
| M | Mutual inductance |
| N | Number of conductors |
| n | Quantity |
| p | Number of partial conductors |
| R | Resistance |
| r | Reduction factor, radius |
| Reduction factor (EN 50522) | |
| Screen reduction factor | |
| Substation reduction factor | |
| Shielding factor | |
| s | Mean geometrical distance |
| Transformation matrix | |
| Coordinates of the point u | |
| U | Voltage, RMS value |
| Earth potential rise | |
| Nominal voltage | |
| Induced voltage | |
| Source voltage | |
| Permissible touch voltage | |
| Voltage over x referred to earth | |
| X | Reactance |
| x | Distance |
| Coordinates of the point v | |
| Matrix of admittances | |
| Admittance to earth | |
| Z | Impedance |
| Matrix of impedances | |
| Conductor impedance | |
| Impedance to earth |
| Effective grounding impedance | |
| Finite earth current depth (conductor of definied length) | |
| Euler’s constant | |
| Specific conductivity | |
| Vacuum permeability | |
| Order of a harmonic | |
| Pi | |
| Specific resistivity | |
| Phase angle of a complex current | |
| Phase angle of a complex voltage | |
| Angular frequency () |
Indices and Notations
| Conductors in system 1 | |
| Conductors in system 2 | |
| Coordinates of the area 1 | |
| Coordinates of the area 2 | |
| Building | |
| Metallic conductor | |
| Earth | |
| Number of the fault node | |
| ground, grounding | |
| Infrastructure | |
| i | Counting variable |
| Input value | |
| j | Counting variable |
| Conductor | |
| Low voltage | |
| Medium voltage | |
| m | Counting variable |
| n | Counting variable |
| Output value | |
| Inner conductor, cable | |
| Reduced | |
| Cable screen | |
| Screen, Screening | |
| Substation | |
| x | Counting variable |
| Setups | |
| Mathematical function of x | |
| K | Frequency domain |
| k | Time domain |
| K | Complex number |
| Imaginary part of K | |
| Real part of K | |
| Coefficient matrix | |
| Complex coefficient matrix | |
| Column vector | |
| Derivation of K with respect to x | |
| Integral of K with respect to x | |
| Sum of the elements from to |
Appendix A. Calculation of the Self- and Coupling Impedances
The calculation of the coupling matrix of a connecting line between two stations is performed with the use of the partial conductor method as described in Schmidt [16,18]. The phase conductors, screens, reduction conductors and the earth are separated into individual partial conductors as exemplarily shown for a three-phase cable system in Figure A1.
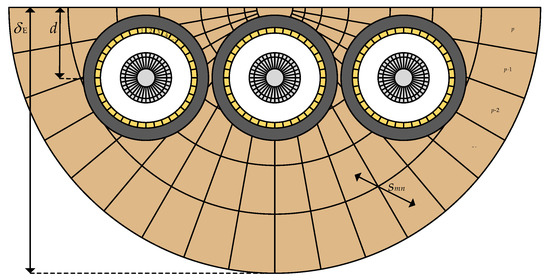
Figure A1.
Segmentation of conductors and earth using the partial conductor method.
The radius of the half-cylindrical earth conductor is a frequency-dependent value and equals the finite earth current depth , which is calculated with the Equations (5) and (6). The segmentation of the metallic conductors and the earth is also frequency-dependent considering the skin effect, but this is rather insignificant for the frequency domain of the harmonics in the ground fault current. The self and coupling impedances of the individual partial conductors are calculated with:
In these equations is the resistance of the partial conductor m, defined by its area , its length and the specific resistance of its material. The internal inductance is neglected for one partial conductor m. It can later be calculated based on the geometric shape of the combined conductor and considered in its self-impedance.
The self- and mutual-inductances and are calculated with the approach presented in Wießner et al. [19], which is based on Biot Savart’s law. For two conductors in parallel it is determined by their distance s and their coordinates and , which describe the length extension. Here, the distance s is the geometrical mean distance (see Appendix B) of the partial conductors to each other () or to themselves (). Since Biot Savart’s law derives from magnetostatics, it only provides valid results up to a certain frequency range. For the frequencies of relevant harmonics, the application has still proven to be practicable. The consideration of the neglected effect of eddy currents in the earth is later achieved by the reduction of the impedance matrix.
The coupling between all the partial conductors p is described by the following equation system:
The partial conductor impedance matrix can be reduced by knowing the number of partial conductors of a conductor and assuming that the voltage of all partial conductors is equal ():
Here, N is the number of conductors including the earth return conductor. With consideration of the internal inductances , the impedance matrix is equivalent to the one given in Equation (7).
Appendix B. Geometric Mean Distances
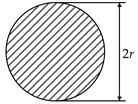
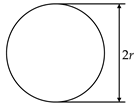
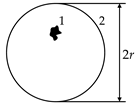
The concept of the geometric mean distance of two areas and was originally introduced by Maxwell [33]. It is calculated with:
In this equation a and b are the coordinates of the first area, and those of the second and x is the distance between two points. In Table A1 the geometric mean distances of some specific arrangements are given.

Table A1.
Geometric mean distances [34].
Table A1.
Geometric mean distances [34].
| Arrangement | Geometric Mean Distance | Equation |
|---|---|---|
 | Circular area of itself | |
 | Circle of itself | |
 | Any area 1 against enclosing circular line 2 | |
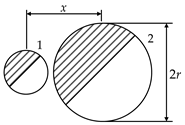 | Single point, circular area or circle 1 against circular area or circle 2 | |
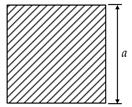 | Square area of itself | |
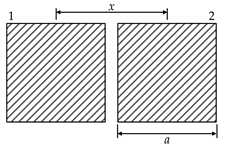 | Square area 1 against square area 2 |
x: Centre-of-mass distance.
Appendix C. Comparison of Measurement and Calculation
In the following, the measured and calculated values of the first three harmonics for setups I and II are given. The location superscripts are omitted here for better readability.

Table A2.
Setup I.
Table A2.
Setup I.
| M | C | E | M | C | E | M | C | E | |||||
|---|---|---|---|---|---|---|---|---|---|---|---|---|---|
| (A) | 41.32 | - | 11.38 | - | 25.07 | - | |||||||
| (deg) | 0 | - | 0 | - | 0 | - | |||||||
| (A) | 34.45 | 28.43 | −21.2% | 10.69 | 10.76 | 0.7% | 24.71 | 24.74 | 0.1% | ||||
| (deg) | −152 | −147 | −166 | −165 | -171 | -170 | |||||||
| (A) | 12.17 | 11.69 | −4.1% | 4.67 | 5.34 | 12.5% | 12.70 | 14.67 | 15.5% | ||||
| (deg) | −146 | −136 | −146 | −143 | −147 | −146 | |||||||
| (A) | 11.22 | 8.62 | −23.2% | 3.42 | 3.08 | −10.0% | 7.52 | 6.52 | −15.3% | ||||
| (deg) | −154 | −155 | −180 | 177 | 167 | 162 | |||||||
| (A) | 11.18 | 8.52 | −31.2% | 3.09 | 3.03 | −2.0% | 6.69 | 6.39 | −4.7% | ||||
| (deg) | −157 | −156 | 179 | 177 | 166 | 161 | |||||||
| (A) | 19.73 | 19.30 | −2.2% | 2.84 | 2.50 | −13.6% | 3.46 | 3.38 | −2.4% | ||||
| (deg) | 140 | 139 | 117 | 108 | 105 | 99 | |||||||
| (A) | 11.81 | 11.47 | −3.0% | 1.89 | 1.53 | −23.5% | 2.21 | 2.04 | −8.3% | ||||
| (deg) | 139 | 143 | 117 | 108 | 106 | 97 | |||||||
| (A) | 7.92 | 7.89 | −0.4% | 0.95 | 0.97 | 2.1% | 1.26 | 1.34 | 6.3% | ||||
| (deg) | 142 | 133 | 118 | 109 | 103 | 103 | |||||||
| (A) | 1.62 | 3.71 | 129% | 0.29 | 0.59 | 103% | 0.56 | 0.90 | 161% | ||||
| (deg) | 107 | 136 | −176 | 122 | 137 | 115 | |||||||
| (V) | 0.56 | 0.07 | 0.24 | ||||||||||
| (deg) | 118 | −121 | 114 | ||||||||||
| Measured in total: | |||||||||||||
M: Measured, C: Calculated, E: Error. Calculated with , with .

Table A3.
Setup II.
Table A3.
Setup II.
| M | C | E | M | C | E | M | C | E | |||||
|---|---|---|---|---|---|---|---|---|---|---|---|---|---|
| (A) | 33.67 | - | 11.36 | - | 15.10 | - | |||||||
| (deg) | 0 | - | 0 | - | 0 | - | |||||||
| (A) | 24.86 | 24.55 | −1.3% | 10.40 | 10.42 | 0.2% | 14.42 | 14.45 | 0.2% | ||||
| (deg) | −162 | −162 | −170 | −169 | −173 | −173 | |||||||
| (A) | 12.73 | 12.87 | 1.1% | 2.08 | 2.27 | 9.1% | 1.84 | 2.01 | 9.2% | ||||
| (deg) | 142 | 143 | 122 | 119 | 114 | 112 | |||||||
| (A) | 7.02 | 7.07 | 0.7% | 1.19 | 1.25 | 5.0% | 1.05 | 1.10 | 4.8% | ||||
| (deg) | 142 | 143 | 121 | 117 | 112 | 108 | |||||||
| (A) | 5.72 | 5.80 | 1.4% | 0.90 | 1.03 | 14.4% | 0.80 | 0.92 | 15.0% | ||||
| (deg) | 142 | 145 | 124 | 123 | 118 | 118 | |||||||
| (V) | 9.90 | 10.09 | 1.9% | 1.71 | 79 | 4.7% | 1.61 | 1.60 | −0.6% | ||||
| (deg) | 143 | 145 | 129 | 123 | 122 | 118 | |||||||
| Measured in total: | |||||||||||||
M: Measured, C: Calculated, E: Error. Assumed impedances: , .
References
- Schmidt, U.; Schegner, P.; Fickert, L.; Druml, G. Bedeutung der Löschgrenze für die Resonanz-Sternpunkterdung. In Proceedings of the VDE: 3. ETG Fachtagung, Sternpunktbehandlung in Netzen bis 110 kV; German VDE: Nürnberg, Germany, 2014. [Google Scholar]
- Schmidt, U. Aktuelle Erkenntnisse und Entwicklungen zur Resonanz-Sternpunkterdung in Verteilnetzen. In Proceedings of the IEEH-Kolloquium TU Dresden; TU Dresden: Dresden, Germany, 2016. [Google Scholar]
- Favre-Perrod, P. Auswirkung der Sternpunktebehandlung auf das Erdfehlergeschehen. In Proceedings of the FKH Fachtagung Erdungen 2019; FKH (CH): Olten, Switzerland, 2019. [Google Scholar]
- Mitolo, M.; Tartaglie, M.; Zizzo, G. Electrical Safety of Resonant Grounding. In Proceedings of the IEEE/IAS 55th Industrial and Commercial Power Systems Technical Conference (I&CPS), Calgary, AB, Canada; 2019; pp. 1–5. [Google Scholar] [CrossRef]
- Mitolo, M.; Musca, R.; Tartaglie, M.; Zizzo, G. Electrical Safety Analysis in the Presence of Resonant Grounding Neutral. IEEE Trans. Ind. Appl. 2019, 55, 4483–4489. [Google Scholar] [CrossRef]
- Fickert, L.; Mallits, T.; Schmautzer, E. High current faults in resonant grounded networks under aspects of a global earthing system. In Proceedings of the CIRED: 23rd International Conference on Electricity Distribution, Lyon, France, 15–18 June 2015. [Google Scholar]
- DKE Deutsche Kommission Elektrotechnik Elektronik Informationstechnik im DIN und VDE. CENELEC, Earthing of Power Installations Exceeding 1 kV a.c.; German Version EN 50522:2010; English Translation of DIN EN 50522 (VDE 0101-2):2011-11; VDE-Verlag: Berlin, Germany, 2011; DIN EN 50522 (VDE 0101-2). [Google Scholar]
- Frowein, K.; Schmidt, U.; Druml, G.; Schegner, P. Model for the calculation of harmonics in the residual earth fault current of medium voltage systems. In Proceedings of the CIRED: IET 24th International Conference & Exhibition on Electricity Distribution, Glasgow, UK, 12–15 June 2017; pp. 775–779. [Google Scholar] [CrossRef][Green Version]
- Schmidt, U.; Frowein, K.; Druml, G.; Schegner, P. New method for calculation of the harmonics in the residual earth fault current in isolated and compensated networks. In Proceedings of the Electric Power Quality and Supply Reliability (PQ), Tallinn, Estonia, 29–31 August 2016; pp. 309–313. [Google Scholar] [CrossRef]
- Schmidt, U.; Druml, G.; Wei, Y.; Schegner, P. Comparison between Simulations and Measurements of Harmonics in Residual Earth-Fault Currents of a 20 kV-Network. In Proceedings of the CIRED: 23rd International Conference on Electricity Distribution, Lyon, France, 15–18 June 2015. [Google Scholar]
- Steglich, M.; Löwe, C.; Bauernschmitt, B.; Rehtanz, C.; Böhm, R.; Franke, J. A novel method to reduce the harmonic currents in the residual earth fault current during a single phase to ground fault in compensated grids. In Proceedings of the IEEE PES Innovative Smart Grid Technologies Europe (ISGT-Europe), Bucharest, Romania, 29 September–2 October 2019; pp. 1–5. [Google Scholar] [CrossRef]
- Yu, K.; Liu, Z.; Zeng, X.; Li, J.; Yang, L. A novel full compensation method for the ground fault current of resonant grounded systems. In Electrical Engineering (2021); Springer: Berlin/Heidelberg, Germany, 2021. [Google Scholar] [CrossRef]
- Fickert, L.; Mallits, T.; Resch, M. Earth Fault Current Distribution and Proof Method of Global Earthing System. In Proceedings of the 19th International Scientific Conference on Electric Power Engineering (EPE), Brno, Czech Republic, 16–18 May 2018; pp. 1–4. [Google Scholar] [CrossRef]
- Heuck, K.; Dettmann, K.-D.; Schulz, D. Elektrische Energieversorgung: Erzeugung, Übertragung und Verteilung Elektrischer Energie für Studium und Praxis, 9th ed.; Vieweg+Teubner Verlag: Wiesbaden, Germany, 2013. [Google Scholar]
- Meyer, E.-P. Stromrückleitung über das Erdreich: Impedanzen und induktive Beeinflussung bei Leitern endlicher Länge. Ph.D. Thesis, TU Darmstadt, Darmstadt, Germany, 1982. [Google Scholar]
- Schmidt, U.; Shirvani, A.; Probst, R. An improved algorithm for determination of cable parameters based on frequency-dependent conductor segmentation. In Proceedings of the IEEE PES Transmission and Distribution Conference, Orlando, FL, USA, 7–10 May 2012; pp. 241–246. [Google Scholar] [CrossRef]
- WG C4.33. Impact of Soil-Parameter Frequency Dependence on the Response of Grounding Electrodes and on the Lightning Performance of Electrical Systems; CIGRE TB 781; CIGRE: Paris, France, 2019. [Google Scholar]
- Schmidt, U. Frequenzabhängige Parameter von Kabeln zur Berechnung von Ausgleichsvorgängen im Zeitbereich. Ph.D. Thesis, TU Chemnitz, Chemnitz, Germany, 2013. [Google Scholar]
- Wießner, F.; Derbel, F.; Rückerl, C. Anpassung der Teilleitermethode auf 3-D-Freileitungsmodelle zur Berechnung der induktiven Beeinflussung. In Proceedings of the emv: Internationale Fachmesse und Kongress für Elektromagnetische Verträglichkeit, Düsseldorf, Germany, 20–22 February 2018; pp. 71–78. [Google Scholar]
- Mallits, T.; Schmautzer, E.; Fickert, L.; Höhn, T.; Hufnagl, E. The role of global earthing systems to ensure the reliability of electrical networks. In Proceedings of the 51st International Universities Power Engineering Conference (UPEC), Coimbra, Portugal, 6–9 September 2016; pp. 1–5. [Google Scholar] [CrossRef]
- Lindinger, M.J. Nachweis globaler Erdungssysteme durch Messung und Berechnung von Verteilten Erdungsanlagen. Ph.D. Thesis, TU Graz, Graz, Austria, 2012. [Google Scholar]
- Toman, P.; Topolánek, D.; Orságová, J.; Dvořák, J. Experimental Measuring of the Touch Voltages in Large Compensated Networks. In Proceedings of the Electric Power Quality and Supply Reliability Conference (PQ), Tartu, Estonia, 11–13 June 2012. [Google Scholar] [CrossRef]
- Valjus, J.; Särmäntö, R. Practical Earthing Measuements of Large Rural and Urban Substations. In Proceedings of the International Conference on Large High Voltage Electric Systems, Paris, France, 29 August–6 September 1984. [Google Scholar]
- Parise, G.; Parise, L.; Martirano, L. Identification of Global Grounding Systems: The Global Zone of Influence. IEEE Trans. Ind. Appl. 2015, 51, 5044–5049. [Google Scholar] [CrossRef]
- Acevski, N.; Micevska, A.; Manivilovska, A. Influence of Reduction Factors on High Voltage Cables on the Transfer of Potentials in the Network. In Proceedings of the 55th International Scientific Conference on Information, Communication and Energy Systems and Technologies (ICEST), Niš, Serbia, 10–12 September 2020; pp. 119–122. [Google Scholar]
- Medic, I.; Majstrovic, M.; Sarajcev, I. Calculation Of Earthing And Screening Effects Of Compensation Conductor Laid Alongside Underground Multi-cable Power Lines. In Electrical Engineering and Electromagnetics; Wessex Institute of Technology: Southampton, UK, 2003; Volume VI, pp. 205–214. [Google Scholar]
- Popović, L.M. Ground Fault Current Distribution When a Ground Fault Occurs in HV Substations Located in an Urban Area. In Progress In Electromagnetic Research B; The Electromagnetics Academy: Cambridge, MA, USA, 2014; Volume 27, pp. 167–179. [Google Scholar]
- Popović, L.M. Determination of Actual Reduction Factor of HV and MV Cable Lines Passing Through Urban and Suburban Areas. In Facta Universitatis—Series: Electronics and Energetics; University of Niš: Niš, Serbia, 2014; Volume 59, pp. 25–39. [Google Scholar]
- Popović, L.M. Reduction of the fault current passing through the grounding system of an HV substation supplied by cable line. Int. J. Electr. Power Energy Syst. 2018, 99, 493–499. [Google Scholar] [CrossRef]
- Sarajcev, I.; Majstrovic, M.; Medic, I. Current reduction factor of compensation conductors laid alongside three single-core cables in flat formation. In Proceedings of the IEEE International Symposium on Electromagnetic Compatibility (EMC ’03), Istanbul, Turkey, 11–16 May 2003; Volume 2, pp. 1020–1023. [Google Scholar] [CrossRef]
- Colella, P.; Pons, E.; Tommasini, R. MV ground fault current distribution: An analytical formulation of the reduction factor. In Proceedings of the 17th IEEE International Conference on Environment and Electrical Engineering, Milano, Italy, 6–9 June 2017. [Google Scholar] [CrossRef]
- Colella, P.; Pons, E.; Tommasini, R. The Identification of Global Earthing Systems: A Review and Comparison of Methodologies. In Proceedings of the IEEE 16th International Conference on Environment and Electrical Engineering (EEEIC), Florence, Italy, 7–10 June 2016; pp. 1–6. [Google Scholar] [CrossRef]
- Maxwell, J.C. On the Geometrical Mean Distance of Two Figures in a Plane. Trans. R. Soc. Edinb. 1872, XXVI, 729–733. [Google Scholar] [CrossRef]
- Oeding, D.; Oswald, B.R. Elektrische Kraftwerke und Netze, 8th ed.; Springer Vieweg: Berlin, Germany, 2016. [Google Scholar]
Publisher’s Note: MDPI stays neutral with regard to jurisdictional claims in published maps and institutional affiliations. |
© 2021 by the authors. Licensee MDPI, Basel, Switzerland. This article is an open access article distributed under the terms and conditions of the Creative Commons Attribution (CC BY) license (http://creativecommons.org/licenses/by/4.0/).