Article

Numerical Analysis of Liquid–Liquid Heat Pipe Heat Exchanger Based on a Novel Model

1
School of Energy Science and Engineering, Nanjing Tech University, Nanjing 210000, China
2
School of Mechanical and Power Engineering, Nanjing Tech University, Nanjing 210000, China
*
Author to whom correspondence should be addressed.
Energies 2021, 14(3), 589; https://doi.org/10.3390/en14030589
Submission received: 17 November 2020 / Revised: 13 January 2021 / Accepted: 21 January 2021 / Published: 24 January 2021
(This article belongs to the Special Issue Heat Exchangers: Cooling and Heating Systems)

Abstract

:
Heat pipe heat exchangers (HPHEXs) are widely used in various industries. In this paper, a novel model of a liquid–liquid heat pipe heat exchanger in a countercurrent manner is established by considering the evaporation and condensation thermal resistances inside the heat pipes (HPs). The discrete method is added to the HPHEX model to determine the thermal resistances of the HPs and the temperature change trend of the heat transfer fluid in the HPHEX. The established model is verified by the HPHEX structure and experimental data in the existing literature and demonstrates numerical results that agree with the experimental data to within a 5% error. With the current model, the investigation compares the effectiveness and minimum vapor temperature of the HPHEX with three types of HP diameters, different mass flow rates, and different H * values. For HPs with a diameter of 36 mm, the effectiveness of each is improved by about 0.018 to 0.029 compared to HPs with a diameter of 28 mm. The results show that the current model can predict the temperature change trend of the HPHEX well; in addition, the effects of different structures on the effectiveness and minimum vapor temperature are obtained, which improve the performance of the HPHEX.

1. Introduction

As the world’s energy forms become increasingly tense, green energy and low carbon emissions have become the mainstream. Heat pipe heat exchangers (HPHEXs) are increasingly being applied in all walks of life [1]. A heat pipe (HP) is a highly efficient heat transfer device mainly made of a hermetically sealed evacuated tube containing a small amount of working medium. The phase change process of the medium is used in the HP to transfer a large amount of heat; a large amount of heat can be transferred with a small temperature difference [2] and is called a thermal superconductor or thermal “short-circuits” [3].
A heat exchanger is a device that transfers part of the heat of the hot fluid to the cold fluid. The heat pipe heat exchanger (HPHEX) is composed of HPs, which are inserted into two pipelines to transfer heat from the hot fluid to the cold fluid. Compared with traditional heat exchangers, HPHEXs have the advantages of simple structure, excellent heat transfer performance, low cost, easy processing, etc. [4]. HPHEXs are applied in various industries, such as waste heat recovery [5,6], nuclear power plants [7,8], HVAC (heating, ventilation and air conditioning systems) [9], solar energy systems [10,11], the automobile industry [12], CPU cooling [13], data center cooling [14], and many more.
Experimental and theoretical studies on HPHEXs were conducted by many scholars [5,15,16]. For the experimental study of HPHEXs, Ma et al. [5] investigated a HPHEX used for recovering the waste heat in a slag cooling process in the steel industry, and the influence of the change of waste water mass flow rate on the performance of HPHEX was also studied. For the theoretical calculation of HPHEXs, the mathematical model in the moderate-temperature HPHEX system was established by Han et al. [15] to study the temperature distribution inside and outside each HP. There were also scholars who combined experiments and theories to analyze HPHEXs. Noie [16] studied the effects of fluid velocity and heat transfer rate on the outlet temperature and the effectiveness of an air-to-air thermosyphon heat exchanger with the ε - N T U method and experiments were used to verify the model. It is found that neglecting the thermal resistances in the HPs will lead to overestimation of the effectiveness of the HPHEX and underestimation of the outlet temperature of the fluid. In this paper, the phase change heat transfer resistances are considered to improve the accuracy of the current model.
As we all know, the heat transfer process in HPs is involved in the complex phase changes of condensation and evaporation, including pool boiling, nucleate film boiling, and film condensation. Scholars and engineers carried out various types of HPs experiments, and many empirical correlations for the heat transfer of phase changes in evaporators and condensers were put forward [3,17,18,19,20,21,22]. The empirical correlation of Imura et al. [19] was summarized for pool boiling in a thermosyphon, and Shiraishi et al. [20] improved the correlation of Imura et al. [19] by changing the exponent of the pressure from 0.3 to 0.23. An empirical correlation on the basis of Nusselt’s theory [21] of predicting film condensation heat transfer of a thermosyphon at low heat fluxes is presented by Jouhara et al. [3]. The well-known correlation by Chun et al. [22] was developed to determine the falling film nucleate boiling heat transfer coefficient. In addition, the structural parameters of the HP, the types of working mediums in the pipe, and the filling rate have an impact on heat transfer analysis in the HP. For instance, an experimental investigation of the performance of thermosyphons charged with water and the dielectric heat transfer liquids FC-84, FC-77, and FC-3283 was carried out by Jouhara et al. [3], and the condensation heat transfer coefficient was corrected under the condition of a small pipe diameter. The mathematical thermal and hydrodynamic model of an axial swallow-tailed micro-grooved HP was designed by Zhang [23], and the experimental results were used to verify the correctness of the model. At the same time, the multiphase flow heat transfer model of CFD (Computational Fluid Dynamics) software is increasingly being used to simulate the heat transfer of the two-phase changes [24] in HPs. The two-phase changes and the simultaneous evaporation and condensation phenomena in a thermosyphon were modeled by Alizadehdakhel et al. [24], and the simulation in a thermosyphon was carried out at different operating conditions. However, in some models, the saturated vapor temperature in the HP was arbitrarily set, which would reduce the calculation accuracy. In this respect, some work needs to be done to fill this gap. In this paper, the saturated vapor temperature inside the HP is obtained by comparing the predicted saturated temperature with the simulated saturated temperature to improve the accuracy of the simulation.
In this paper, a novel mathematical model, including the thermal resistances of evaporation and condensation inside HP, is to be proposed for predicting the heat transfer performance of liquid–liquid HPHEX, and the numerical solution results are to be presented. In order to verify the current model, the existing experimental model is to be computed with the mathematical model, and the predicted heat transfer performance is to be compared with the experimental data. With the current model, the temperature profiles of hot side and cold side of HPHEX and the trend of temperature variation of the working fluid inside HPs are to be predicted. The prediction of the outlet temperature of the hot side and cold side and the temperature of the vapor inside HPs can avoid the failure of the HPs and optimize the heat transfer performance of the HPHEX. In addition, heat transfer enhancement is carried out by changing the diameters, the mass flow rates, and the H * of the HPs, and the effect on the thermal performance is obtained. Because of the coupling relationship between vapor temperature and the working pressure of HPs, which is of great significance to the optimization of the design, it is necessary to systematically study the shape and temperature variation law of HPs.

2. Mathematical model of HPHEX

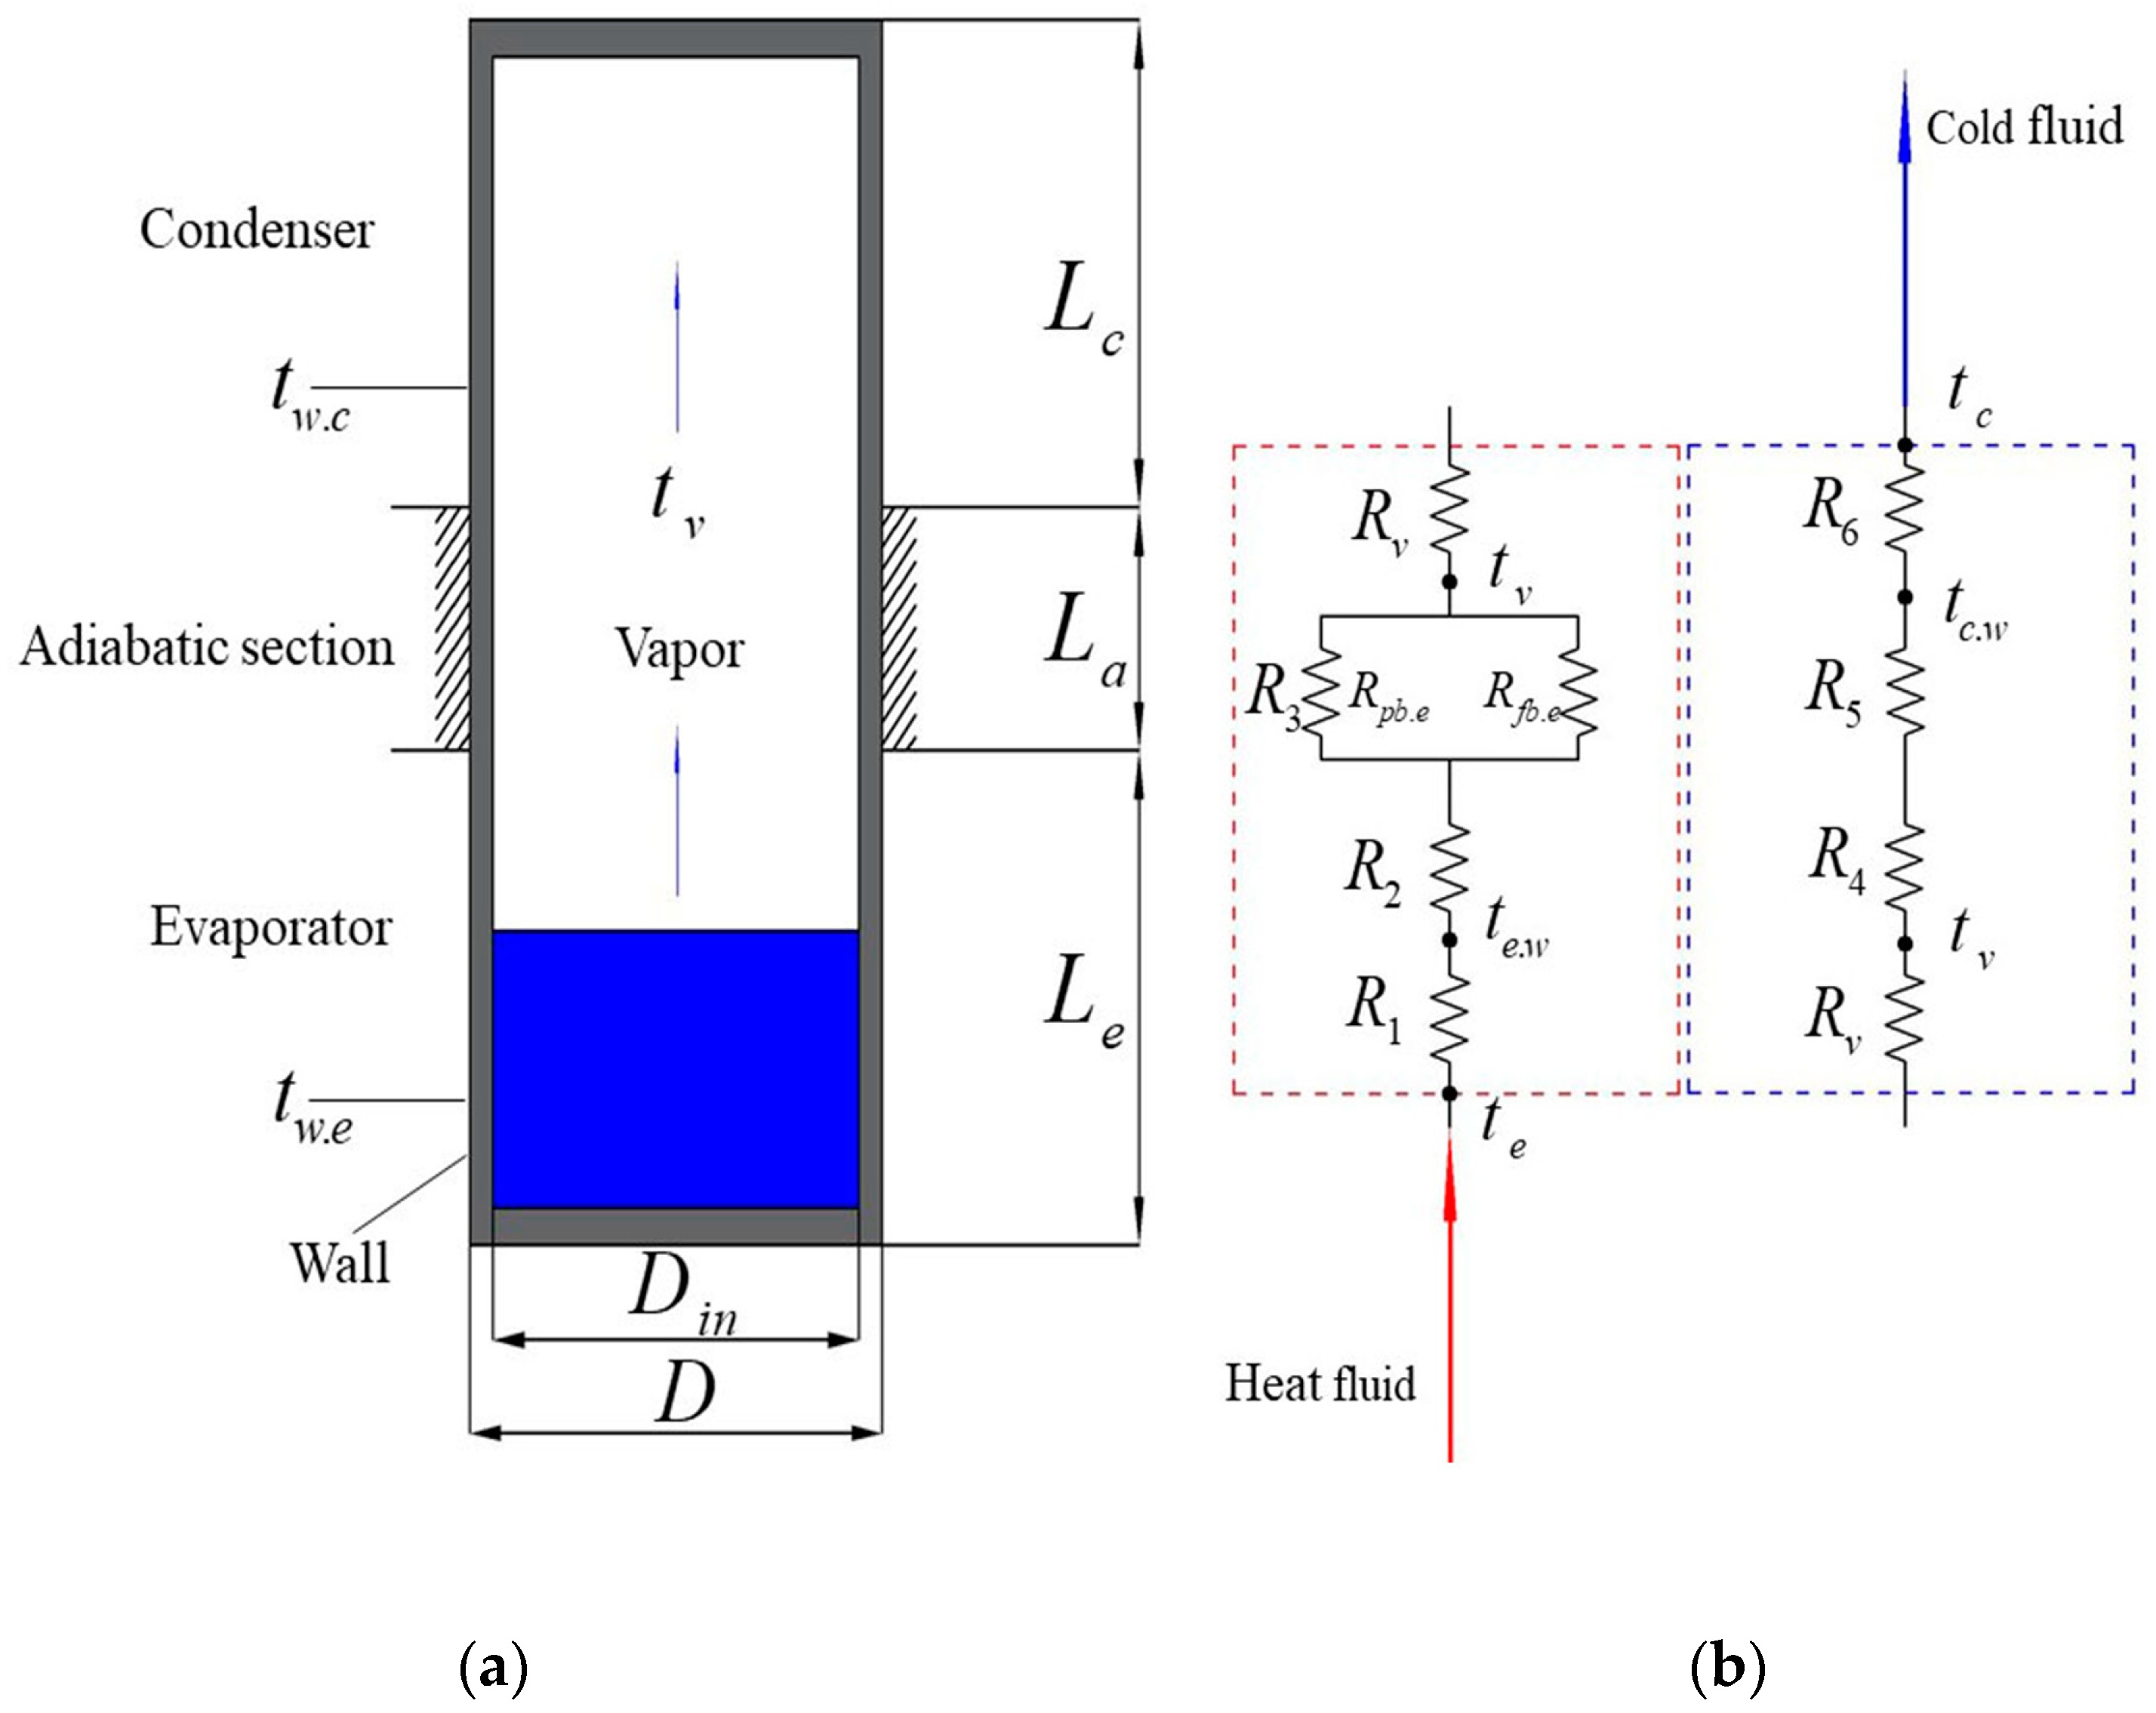
As briefly introduced, the HPs mainly transfer large amounts of heat through the two-phase circulation of the working medium; the specific working principle of the HP can be seen from Figure 1a. The working medium absorbs heat to evaporate and rises into the condenser, releases heat in the condenser, and condenses down. The mathematical model of HPHEX is mainly formed by coupling the mathematical model of the HPHEX and the mathematical model of the HP. The first model is the evaporation/condensation thermal resistances inside the HP, which is mainly described by the thermal resistance network method. The thermal resistance network can be seen in Figure 1b. The second model is the convective heat transfer process of the hot/cold fluid outside the HPs flowing through the HPHEX. 
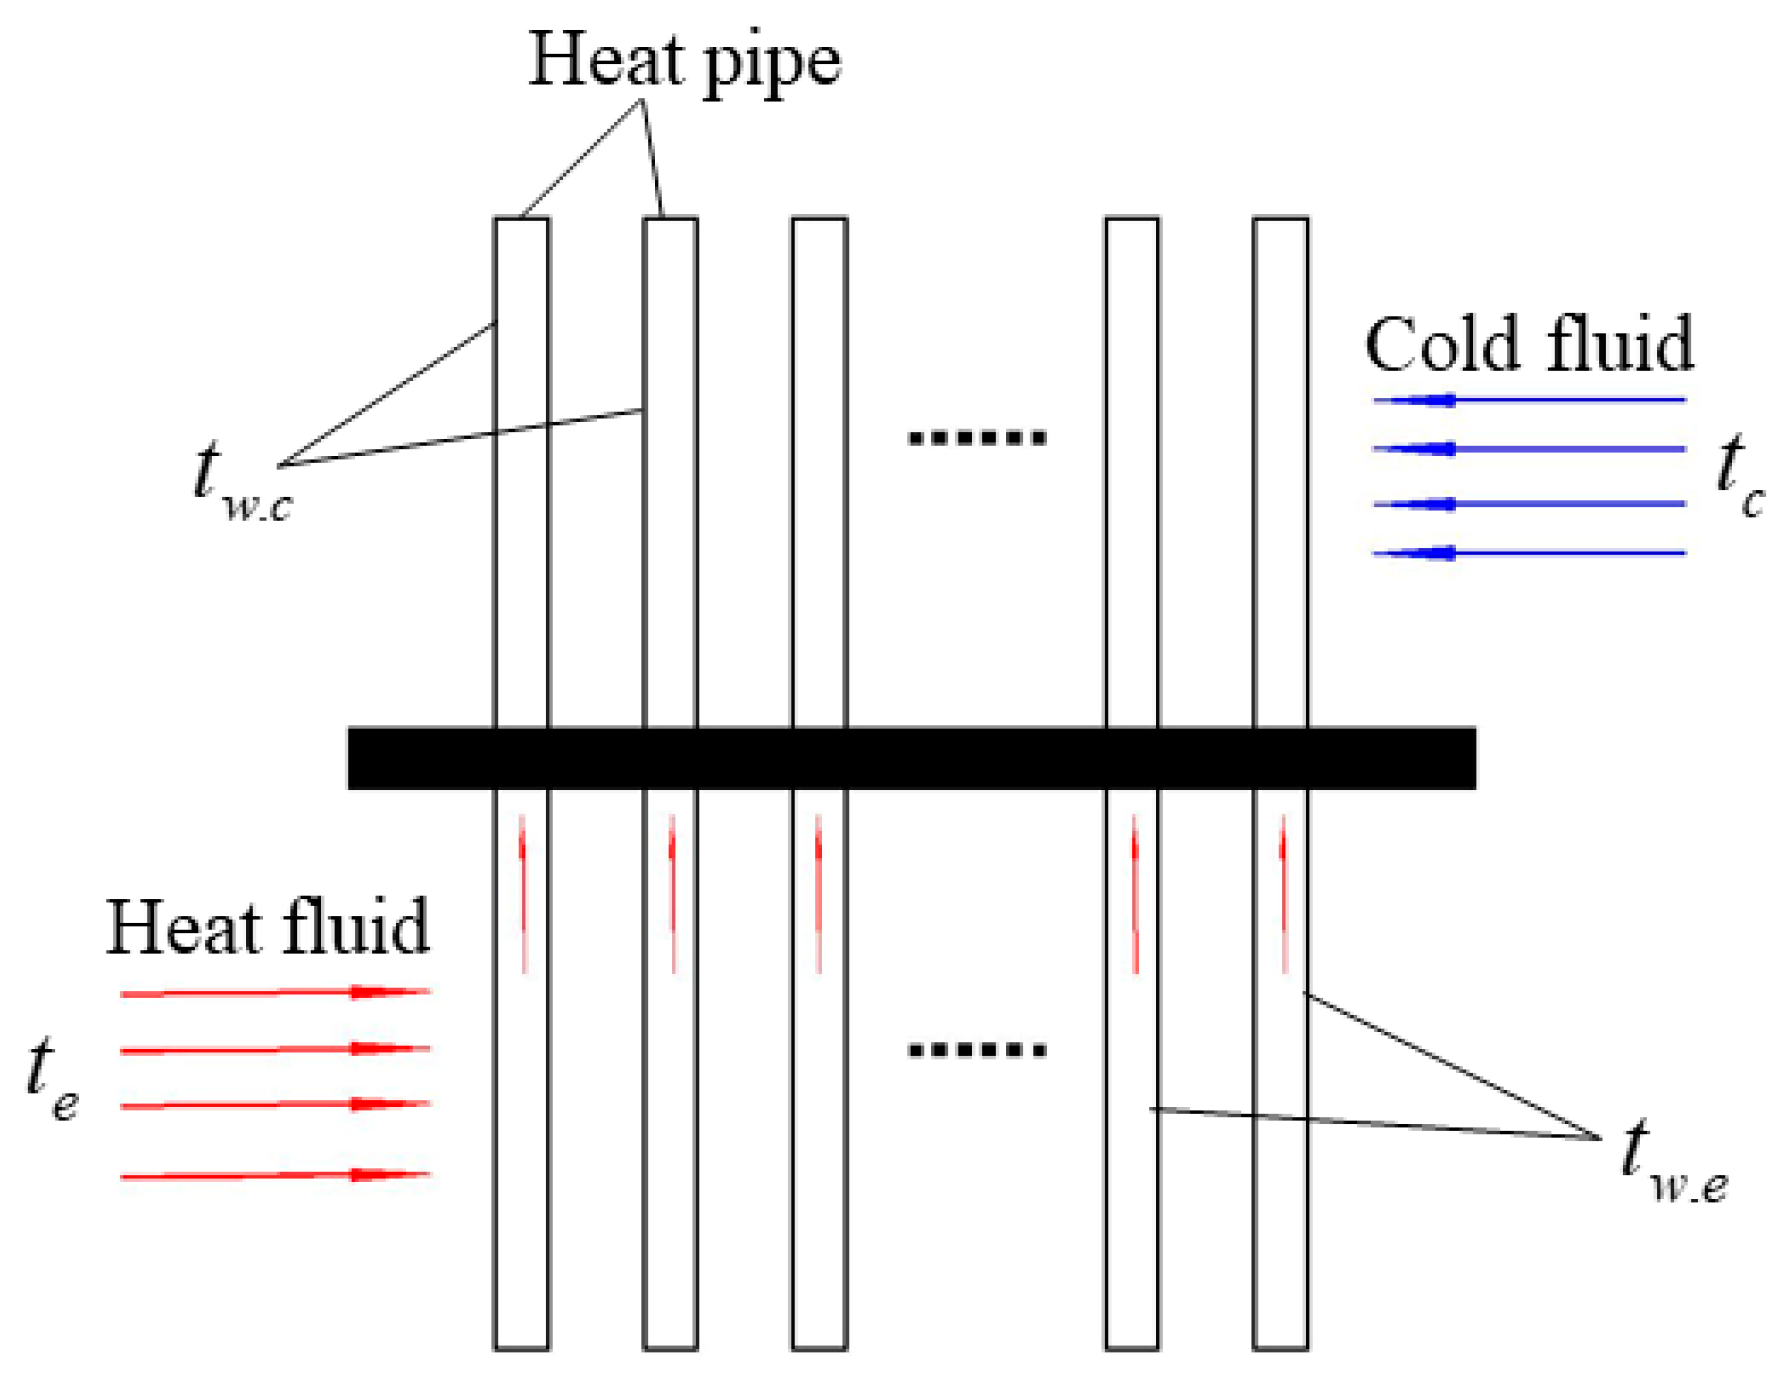
Figure 2 shows the working analysis diagram of HPHEX. The HPHEX is divided into the hot side and cold side; the hot side is arranged with hot fluid and the cold side is filled with cold fluid. The cold and hot fluid transfer heat through the thermal coupling of the HPs, and the heat transfer process is completed.
The thermal resistances from hot fluids to cold fluids consist of 7 parts, which can be clearly seen from Figure 1b. In addition, the total resistance of each HP can be calculated as follows.
R h p = R 1 + R 2 + R 3 + R v + R 4 + R 5 + R 6
where R 1 and R 6 are the evaporator and condenser convection thermal resistances, R 2 and R 5 are the thermal conductivity resistances of evaporator and condenser walls, R 3 and R 4 are evaporation/condensation thermal resistances in the HP, and R v is the thermal resistance of vapor pressure drop in HP.

2.1. Thermal Resistance Outside HP

Convection mainly occurs between the evaporator/condenser of the HP and the hot side/cold side external fluids. Convection thermal resistance R 1 and R 6 can be calculated as follows [25].
R 1 = 1 h e . o u t A e . o u t
R 6 = 1 h c . o u t A c . o u t
where h e . o u t and h c . o u t are the average convection heat transfer coefficients. There is a widely applied empirical correlation to calculate the heat transfer coefficient of a fluid flowing around bundle, which was summarized by Zukauskas [25]. A c . o u t and A e . o u t are the external heat transfer area of the evaporator and the condenser.
Conduction thermal resistances can be calculated as follows.
R 2 = l n ( D / D i n ) 2 π L e k w
R 5 = l n ( D / D i n ) 2 π L c k w
where D is outer diameter of HPs and D i n is inner diameter of the heat pipe. L e and L e are the length of evaporator and condenser, respectively. k w is thermal conductivity of the HP wall material.

2.2. Thermal Resistance Inside HP

Numerical analysis in the HP is based on the internal two-phase heat transfer mechanism. The latent heat of vaporization of the working fluid is used to transfer the heat between the hot and cold fluids. The wall temperature of the evaporator and condenser is considered to be at a uniform temperature. Since the vapor pressure drop along the HP is very small, the vapor temperature in the HP can be considered constant.
Boiling thermal resistance includes pool boiling thermal resistance and falling film thermal resistance; to obtain the boiling resistance, a boiling coefficient must be estimated.
R 3 = 1 h p b . e A p b . e + h f b . e A f b . e
where h p b . e and h f b . e are the pool boiling heat transfer coefficient and the film boiling heat transfer coefficient, respectively. A p b . e stands for the total superficial area of the pool boiling, A p b . e = π D i n L e F R 4 . A f b . e stands for the total superficial area of the film boiling, and A f b . e = π D i n L e ( 1 F R ) 4 . F R is the filling rate of the HP.
The most well-known correlation for calculating the pool boiling thermal resistance of the HP comes from Shiraish et al. [20] and can be calculated as follows.
h p b . e = 0.32 ( ρ l 0.65 k / 0.3 C p l 0.7 g 0.2 ρ v 0.25 h f g 0.4 μ l 0.1 ) ( P v P a t m ) 0.23 q e 0.4
where ρ l and ρ v are liquid and vapor densities, C p l is the specific heat of the liquid, k l is liquid thermal conductivity, μ l is the dynamic viscosity of the liquid, h f g is the latent heat of the vaporization, g is gravitational acceleration, P v is vapor pressure, P a t m is atmospheric pressure, and q e is heat flux to the evaporator.
Film boiling is another important heat transfer method of boiling heat transfer. The film boiling heat transfer is complicated and can be expressed by various correlations [26]. h f b . e can be calculated as follows [26].
h f b . e = h * k l ( μ l 2 ρ l g ) 1 3
where is a dimensionless heat transfer coefficient and h * = 0.606 ( R e f 4 ) 1 3 ; R e f is the falling film boiling Reynolds number and R e f = h N u s s e l t ( 4 ( t e . w t v ) L e μ l h f g ) ; t v is vapor temperature; t e . w is the evaporator wall temperature.
The working medium evaporates from the liquid to the vapor, then rises along the pressure gradient, and its internal pressure will decrease. The thermal resistance due to the decrease in vapor pressure can be calculated as follows.
R v = 8 R g μ v t v 2 π h f g 2 P v ρ v [ ( L e + L c ) / 2 + L a ( D i n / 2 ) 4 ]
where R g is the specific gas constant, L a is the length of the adiabatic section, and μ v is the dynamic viscosity of the vapor.
When the vapor in the HP comes in contact with the wall surface of the HP where the temperature is lower than the saturation temperature of the vapor, condensation occurs. Condensation thermal resistance can be calculated as follows.
R 4 = 1 h c . i n A c . i n
where h c . i n is the heat transfer coefficient associated with conduction through the liquid film in the condenser, and A c . i n is the internal surface area of the liquid film in the condenser that is equivalent to the internal surface area of the condenser.
The Nusselt analysis for condensation on a vertical flat is frequently used to calculate h c . i n [21], and the Nusselt average heat transfer coefficient can be calculated as follows.
h N u s s e l t = 0.943 { ρ l ( ρ l ρ v ) h f g g k l 3 μ l L c ( t v t c . w ) } 1 4
where t v is the saturated vapor temperature, t c . w is the wall temperature of the condenser, and L c is the length of the condenser.
However, the above correlation cannot calculate the condensation heat transfer coefficient well under many conditions. The reason may be that under different heat flow conditions, liquid droplets adhere to the tube wall of the condensing section when the vapor rises. In experimental research under different conditions, many scholars proposed that the correlations can be simply modified to better match the condensation heat transfer coefficient obtained from the experiment, of which the one proposed by Jouhara et al. [3] is consistent with the requirements of this paper, depicted as follows.
h c . i n = 0.85 R e f 0.1 e x p ( 6.7 × 10 5 ρ l ρ v 0.6 ) h N u s s e l t
where R e f means the R e number of condensed film and R e f = 4 Q c π D i n h f g μ l , Q c is the heat transfer rate to the condenser.

2.3. Thermodynamic Calculation of HPHEX

The heat transfer rate in the condenser and evaporator could be calculated as follows.
Q c = t v t c . a v e r a g e R c
Q e = t v t e . a v e r a g e R e
where Q c and Q e are the heat transfer rates of the evaporator and condenser. R c and R e are the thermal resistances of the evaporator and condenser. t c . a v e r a g e and t e . a v e r a g e are the average temperatures of the condenser and the evaporator.
Under steady-state flow conditions on the cold side and hot side, the assumption of heat leakage can be ignored. The heat transfer rate of the evaporator of the heat exchanger is equal to that of the evaporator.
Q c = Q e
When the fluid flows through the evaporator and condenser, the hot fluid releases heat and causes the temperature to decrease, and the cold fluid absorbs the heat and causes the temperature to rise. The temperature difference between the hot and cold fluid can be calculated by the vapor temperature; the vapor temperature of the HP is an important factor that determines the thermal resistance in the HP. The physical parameters of the vapor in the tube are all determined by t v , and t v can be obtained by solving the above three correlations.
t c = Q c m c ρ c C p . c
t e = Q e m e ρ e C p . e
where t c is the temperature difference between the inlet and outlet of the condenser; t e is the temperature difference between the inlet and outlet of the evaporator. m c and m e are the mass flow of the condenser and evaporator. ρ c and ρ e are the densities of the condenser fluid and evaporator fluid. C p . c and C p . e are the heat capacities of the condenser fluid and evaporator fluid.

2.4. Thermodynamic Analysis

Analyzing the performance of the HPHEX can be expressed by its effectiveness. Effectiveness can be defined as the ratio of the actual heat transfer rate of the HPHEX to its maximum possible heat transfer rate [26], depicted as follows.
ε = Q a c t u a l Q max
where Q a c t u a l is the actual heat transfer rate of the HPHEX; Q max is the maximum possible heat transfer rate of the HPHEX.
Ignoring the external loss of the HPHEX, the actual heat transfer rate for HPHE ( Q a x t u a l ) can be calculated as follows.
Q a x t u a l = m e C p . e ( t e . i n l e t t e . o u t l e t )
where t e . i n l e t is the inlet temperature of the evaporator; t e . o u t l e t is the outlet temperature of the evaporator.
According to the first law of thermodynamics, the actual heat transfer rate for HPHE ( Q a x t u a l ) can be also calculated as follows.
Q a x t u a l = m c C p . c ( T c . o u t l e t T c . i n l e t )
where t c . o u t l e t is the outlet temperature of the condenser; t c . i n l e t is the inlet temperature of the condenser.
In the heat exchange process of the HPHEX, there is the maximum possible heat transfer rate ( Q m a x ), which can be calculated as follows.
Q m a x = C m i n ( t e . i n l e t t c . i n l e t )
where C m i n is the smaller one of the specific evaporator ( C e ) and condenser ( C c ) heat capacities. C e = m e C p . e and C c = m c C p . c .

3. Numerical Calculation and Verification

In the design process of the HPHEX model, the thermal resistance inside and outside the HP are two important aspects, which are accurately calculated to improve the HPHEX model to generate predictions with higher accuracy. The thermal resistance outside the HP is dependent on the convection heat transfer coefficient, which is determined by the qualitative temperature and Reynolds number at the cold side and hot side. The qualitative temperature means the average temperature of the fluid at the inlet and outlet section, which is used to determine the physical parameters of the fluid. The thermal resistance inside the HP is based on evaporation and condensation heat transfer coefficients, which are determined by the temperature difference between the vapor and the outside fluid. The HPHEX model is computed iteratively on the basis of the vapor temperature and the qualitative temperature of the outside fluid.

3.1. Numerical Calculation

The liquid–liquid HPHEX model is a countercurrent heat exchanger; fluids of different temperatures are arranged on the hot side and cold side. Each row of HPs is used as an independent heat exchange unit in the HPHEX model. The structural parameters (geometric model) of the entire model and the inlet temperature of the hot side and cold side are determined.
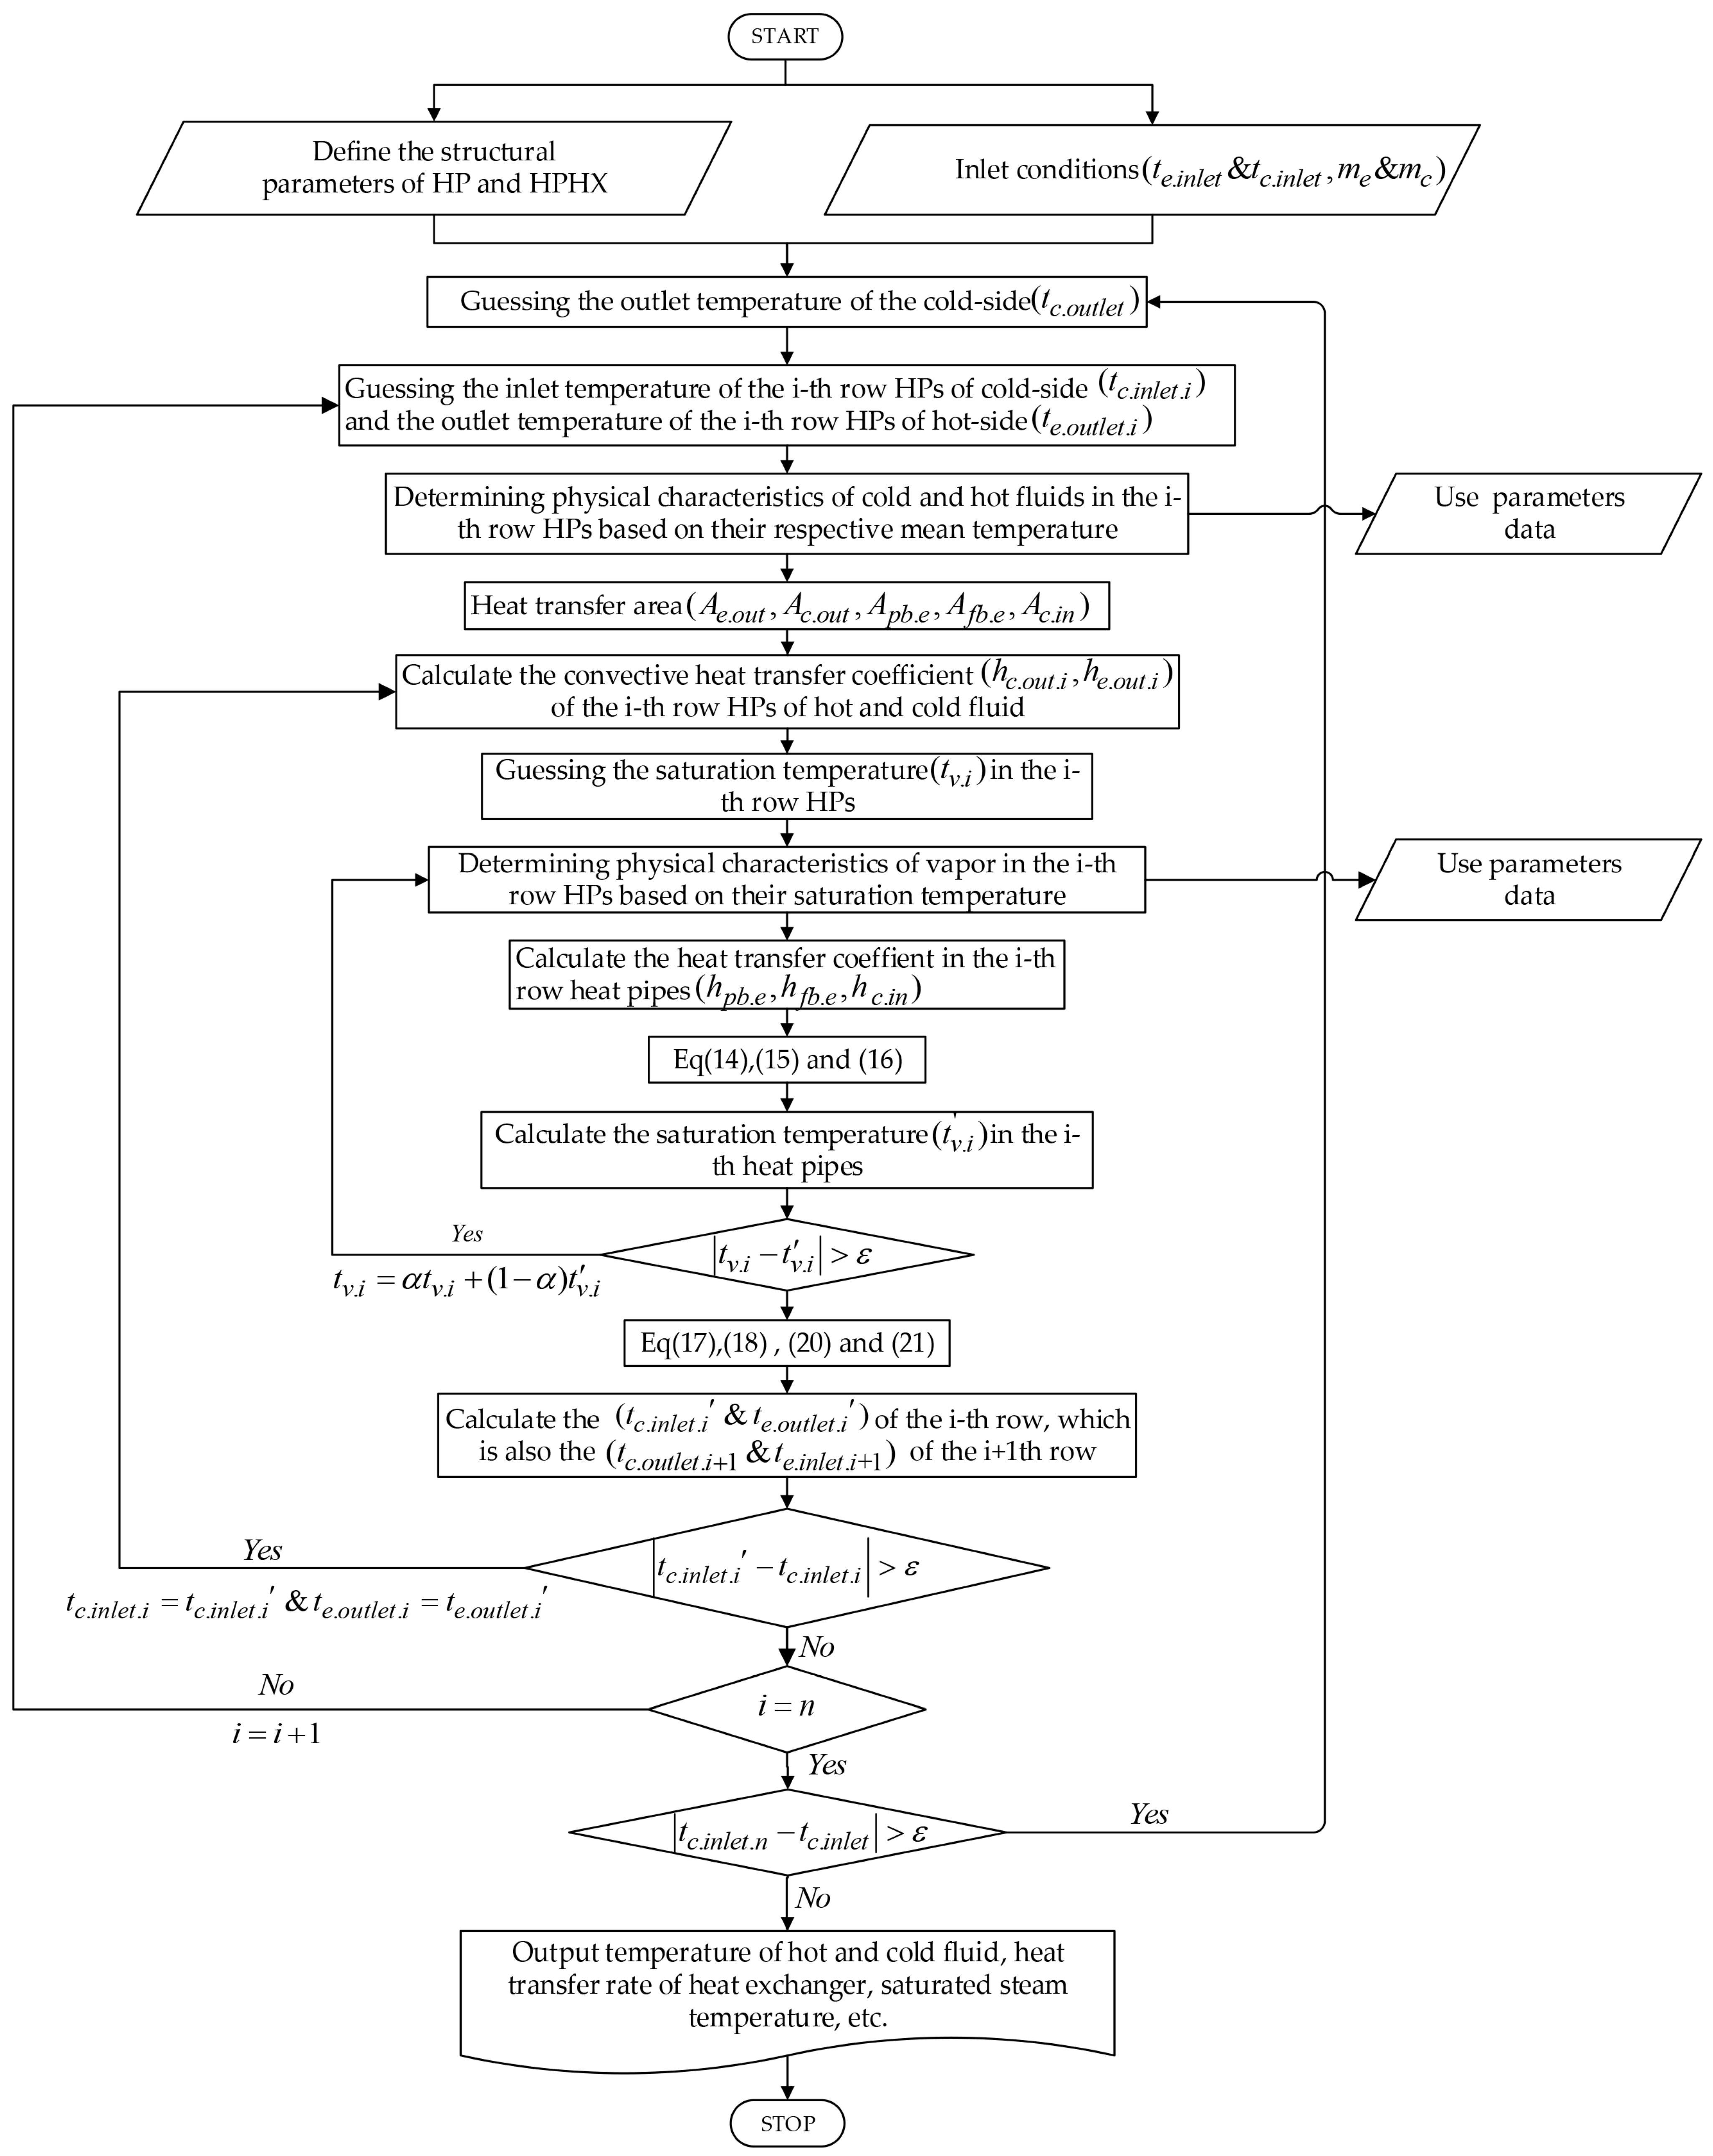
In the countercurrent HPHEX model, the outlet temperature at the cold side and hot side is unknown. The inlet temperature at the cold side can be calculated by assuming the outlet temperature at the cold side for comparison with the determined inlet temperature at the cold side, and the numerical calculation iterative process of the HPHEX is accomplished. The specific flow chart applied to the calculation is shown in Figure 3. Then, the temperature change trend of the HPHEX is accurately obtained by assuming the saturated vapor temperature, the outlet temperature at the hot side of the first row, and the inlet temperature at the cold side of the first row. When the HP is working, the working medium vapor and the working fluid in the HP are saturated, and the saturated vapor temperature is the same as the saturated liquid temperature. The results of the comparison calculation and the assumed value are consistent with the predefined difference value, and the first row of HP iteration ends. If not, we re-estimate the vapor saturation temperature, outlet temperature at the hot side, and inlet temperature at the cold side of the first row, and then restart the iterative calculation to obtain a new calculation result. The iterative calculation model of the first row HPs is completed, and the heat transfer calculation model of the second row HPs starts. The outlet temperature of the first row HPs at the hot side is taken as the inlet temperature of the second row HPs at the hot side, and the inlet temperature of the first row HPs at the cold side is taken as the outlet temperature of the second row of HPs at the cold side. After the iterative calculation of the n-th row HPs, the inlet temperature of the n-th row at the cold side is obtained and compared with the determined inlet temperature at the cold side of the HPHEX model. If they are consistent with the predefined difference, the calculation process ends; otherwise, the cold side outlet temperature of the HPs is re-estimated.
The specific flow chart mainly includes 4 loop iterations: the vapor saturation temperature cycle, the temperature distribution cycle at the cold side and hot side, the number of HPs in the HPHEX cycle and the cold side inlet temperature cycle.
t e . o u t l e t . i is the outlet temperature of the i-th row HPs of the evaporator and t c . i n l e t . i is the inlet temperature of the i-th row HPs of the condenser. h c . o u t . i is the average convection heat transfer coefficient of the i-th row HPs of the condenser and h e . o u t . i is the average convection heat transfer coefficient of the i-th row HPs of the evaporator. t v . i is the saturated vapor temperature of the i-th row HPs and t v . i is the calculated saturated vapor temperature of the i-th row HPs. α is the relaxation factor. t c . i n l e t . i is the calculated inlet temperature of the i-th row HPs of the condenser and t e . o u t l e t . i is the calculated outlet temperature of the i-th row HPs of the evaporator. t c . o u t l e t . i + 1 is the outlet temperature of the i + 1-th row HPs of the condenser and t e . i n l e t . i + 1 is the inlet temperature of the i + 1-th row HPs of the evaporator. n is the number of rows of HPs and t c . i n l e t . n is the inlet temperature of the n-th row HPs of the condenser.

3.2. Model Verification

In order to verify the current model, the liquid–liquid HPHEX established by Ma et al. [
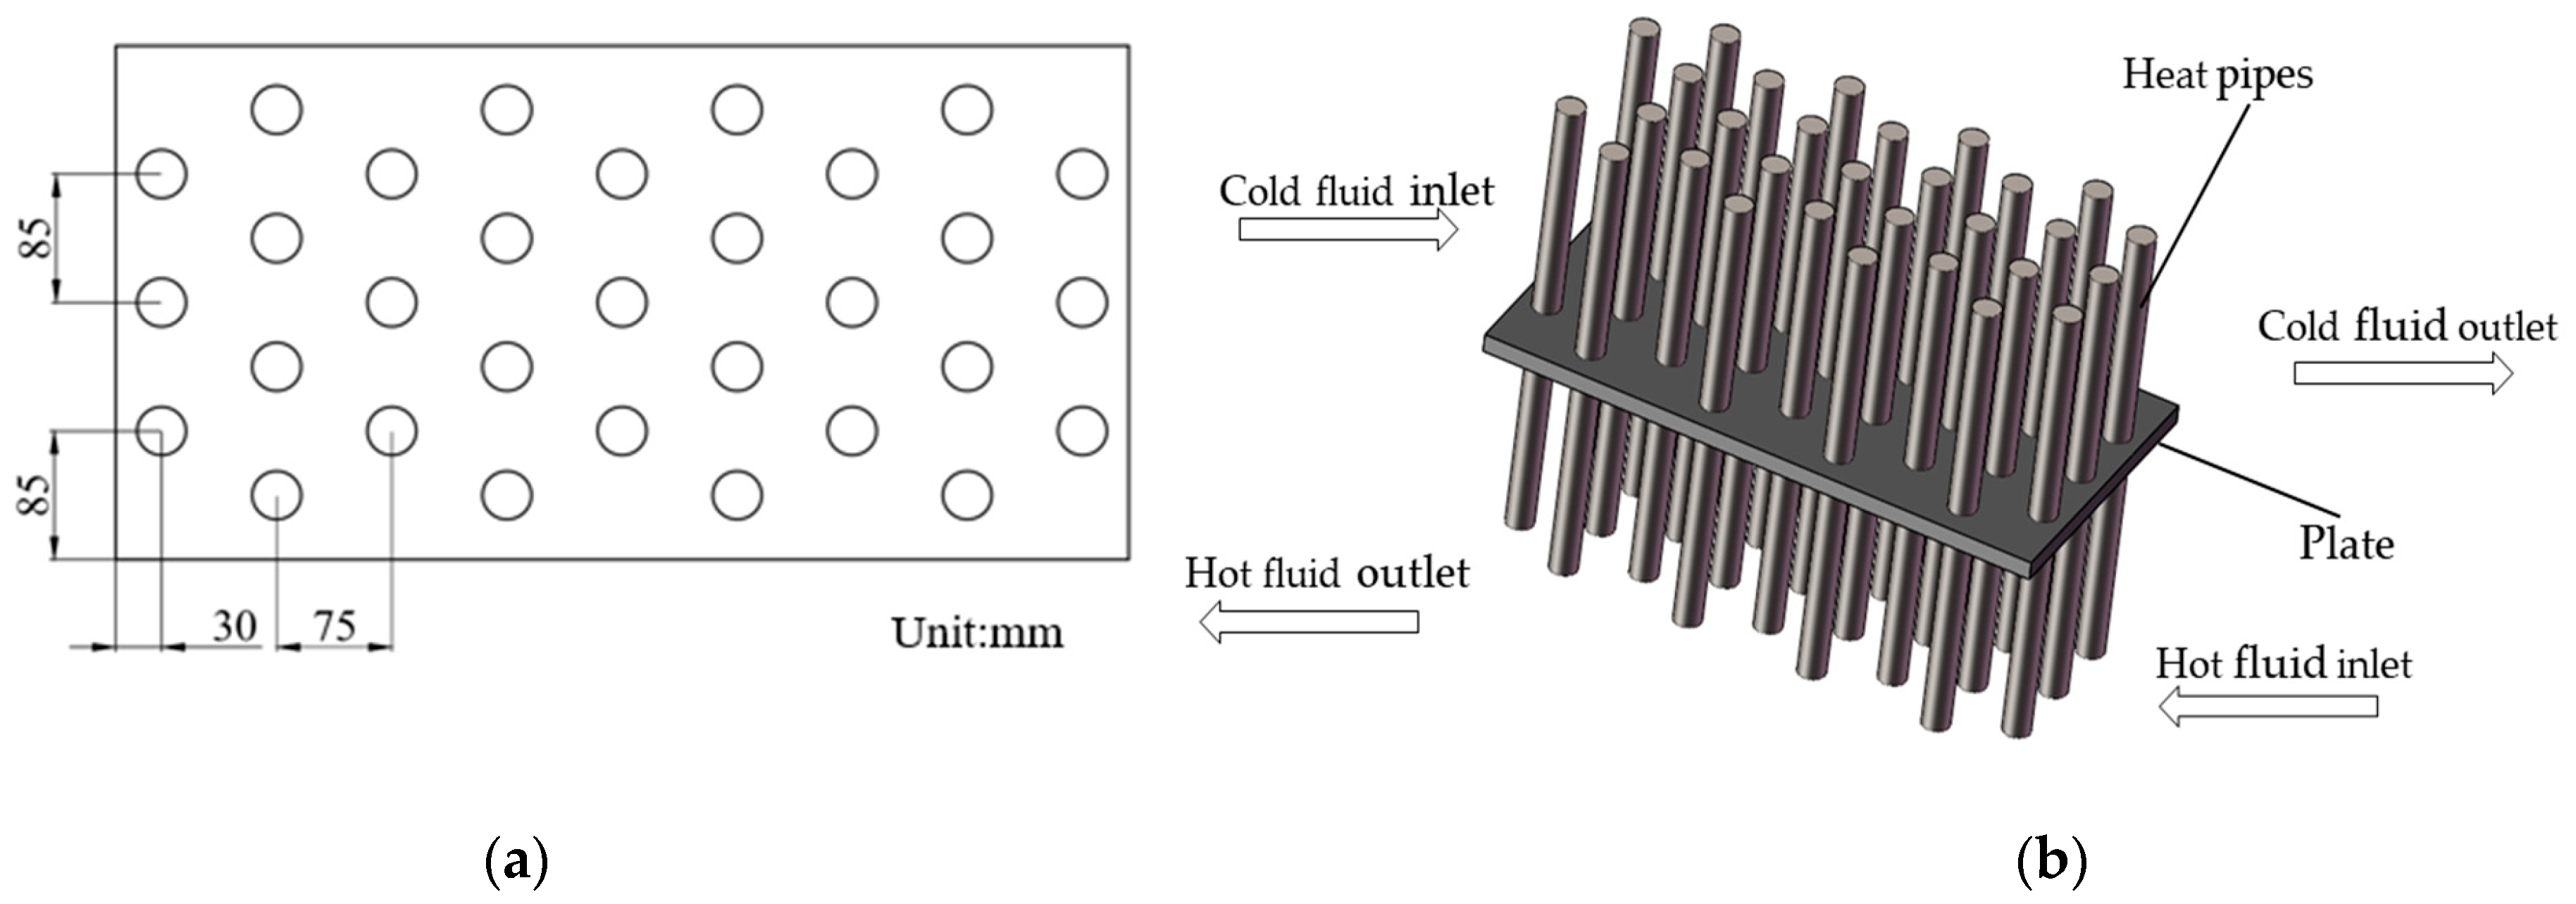
5] is used to validate the current model. Selected experimental data and numerical results are compared to verify the correctness of the model. As shown in Figure 4a,b, the HPHEX mainly includes 31 HPs with a length of 1 m; the specific structural parameters are shown in Table 1. The same structure as the experimental model is selected to verify the numerical model, such as the wall thickness and diameter of the HPs, so as to improve the accuracy of the numerical model. Figure 5a,b summarize the comparison between the heat transfer rate predicted by the current model and the selected experimental data in Ref. [5] at the cold side inlet mass flow as 2.6 and 2.9 m3/h, respectively. Whereas the inlet mass flow of the hot side varies from 0.83 to 1.87 m3/h in the experiment, the inlet mass flow of the hot side varies from 0.83 to 1.9 m3/h in the simulation. It can be clearly seen from Figure 5a,b that the results of the current model simulation and the experimental results have a high degree of fit. The maximum deviations are equal to 0.32 and 0.34 kW for the cases with cold fluid inlet mass flow of 2.6 and 2.9 m3/h, respectively, and the error is within 5%.
In summary, the HPHEX model for iterative calculation of the thermal resistance in the HP has high accuracy, which is consistent with the experimental data. Under the condition of lower mass flow rate at the hot side, the error between the simulation results and the experimental results is large because part of the heat is transferred by radial conduction during the start-up stage of the HPs. However, when the mass flow rate at the hot side increases, the start-up time of the HPs is shortened, the heat transfer in the radial guide decreases, and the error between the simulation results and the experimental results decreases. The accuracy of the HPHEX model is higher under the condition of higher hot side mass flow rate. The novel model can reasonably predict the working performance of the heat exchanger and can be used in the following research.

4. Results and Discussion

4.1. Temperature Profiles of Vapor, Hot Side, and Cold Side

The HPHEX in Ref. [5] is applied to recover waste heat of waste water for the heating of cold water. The current liquid–liquid HPHEX model is computed under the condition of countercurrent arrangement in Figure 4. The inlet temperatures and mass flow rates of the hot side and cold side are 80 °C (353.15 K) and 40 °C (317.15 K), and 1.3 m3/h and 2.9 m3/h, respectively.
Figure 6 summarizes the temperature profiles for the 1st to 9th rows of the hot side and cold side, together with that of the vapor inside the HPs. These change trends are consistent with the traditional countercurrent HPHEXs. From the temperature change trend of the hot side and cold side in Figure 6, one could see that the temperature profiles of the cold and hot sides in the countercurrent manners have similar variation trends. Since the HPHEX model is running in countercurrent manner, the temperature of the hot fluid gradually decreases from left to right in Figure 6, and the temperature of the cold fluid gradually rises from right to left in Figure 6. The change in the heat transfer process is uniform in the countercurrent HPHEX model.
The medium in the HPs absorb the heat of the fluid on the hot side and release the heat to heat the fluid on the cold side. The vapor saturation temperature is affected by the temperature of the fluids on the hot side and cold side, and has the same temperature change trend as the hot side and cold side. The vapor saturation temperature decreases from left to right.

4.2. Effect of Mass Flow

The comparison of the minimum vapor temperature in the HPHEX is shown in Figure 7 for different mass flow rates. As can be seen, the minimum vapor temperature is almost positively correlated with mass flow rates. The mass flow rate on the hot side increases from 0.9 to 1.9 m3/h. For the cold side mass flow rate of 2.3 m3/h, the minimum vapor temperature rises from 329.4 to 332.5 K. When the mass flow rate on the cold side is 2.6 m3/h, the minimum vapor temperature rises from 329.1 to 332.1 K; for the cold side mass flow rate of 2.9 m3/h, the minimum vapor temperature rises from 328.8 to 331.8 K. The vapor temperature depends not only on the temperature of the fluid at the hot side and cold side, but also on the thermal resistances of the evaporator and condenser. Judging from the simulation results and Equations (13) and (14), when the evaporator thermal resistance decreases, the vapor temperature approaches the hot side temperature; when the condenser thermal resistance decreases, the vapor temperature approaches the cold side temperature. With a fixed mass flow rate of the cold side, the mass flow rate of the hot side increases, the convective heat transfer coefficient increases, the thermal resistance decreases, and the minimum vapor temperature approaches the fluid temperature of the hot side. With a fixed mass flow rate of the hot side, the mass flow rate of the cold side increases, the convective heat transfer coefficient increases, the thermal resistance decreases, and the minimum vapor temperature is close to the temperature of the cold side fluid.
Effectiveness is an important criterion for measuring the performance of HPHEXs. As shown in Figure 8, higher mass flow rate of the cold side leads to higher effectiveness with a fixed mass flow rate of the hot side, while the mass flow rate of the cold side remains unchanged, and the effectiveness of the HPHEX decreases with the increase in the mass flow rate of the hot side. When the hot side mass flow rate increases from 0.9 to 1.9 m3/h and the mass flow rate on the cold side is 2.3 m3/h, the effectiveness decreases from 0.1631 to 0.0949. When the mass flow rate on the cold side changes to 2.6 m3/h, the effectiveness decreases from 0.1657 to 0.0968. Furthermore, the cold side mass flow rate becomes 2.9 m3/h, and the effectiveness decreases from 0.1681 to 0.0984. With the fixed mass flow rate of the cold side, the outlet temperature increased with increasing hot side mass flow rates. Then, according to Equations (18) and (21), due to the decrease in temperature difference and since C e is smaller than C c , the effectiveness declines. Furthermore, it can be seen from Figure 8 that the effectiveness increases with the increasing mass flow rate of the cold side. The mass flow rate on the hot side is fixed for all cases, and an increase in mass flow rate at the cold side produced an increase in temperature difference at the hot side, which in turn increases the effectiveness.
The condensation heat transfer coefficient is calculated by the Nusselt average heat transfer coefficient, so only the influence of different parameters on the condensation heat transfer coefficient is discussed. As can be seen from Figure 9, the maximum condensation heat transfer coefficient is positively correlated with the hot side mass flow rate and is negatively related to the cold side mass flow rate. The hot side mass flow rate increases from 0.9 to 1.9 m3/h. The cold side mass flow rate is 2.3 m3/h, the maximum condensation heat transfer coefficient increases from 6.90 × 10³ to 7.40 × 10³ W/(m2·K). When the cold side mass flow rate changes to 2.6 m3/h, the maximum condensation heat transfer coefficient increases from 6.76 × 10³ to 7.24 × 10³ W/(m2·K). Furthermore, the cold side mass flow rate becomes 2.9 m3/h, and the maximum condensation heat transfer coefficient increases from 6.62 × 10³ to 7.13 × 10³ W/(m2·K). According to Equations (11) and (12), the condensation heat transfer coefficient is calculated by the physical parameters of saturated vapor and saturated liquid at saturation temperature, so it is similar to the change trend of the minimum saturated vapor temperature. When the hot side mass flow rate is constant, the minimum saturated vapor temperature decreases with the increase in the cold side mass flow rate, so the condensation heat transfer coefficient decreases with the decrease in the minimum saturated vapor temperature.

4.3. Effect of HP Diameter

Figure 10 shows the minimum vapor temperature as a function of hot side mass flow for various values of HP diameter (D = 28, 32, and 36 mm). An increase in HP diameter is accompanied by a decrease in the minimum vapor temperature in the HP. The HPs with a diameter of 28 mm have the highest minimum vapor temperature with the same mass flow rate of the cold side and hot side. When the mass flow rate at the hot side increases from 0.9 to 1.9 m3/h, the minimum vapor temperature rises from 328.5 to 331.6 K for the HPs with a diameter of 36 mm, and the minimum vapor temperature rises from 328.8 to 331.8 K for the HPs with a diameter of 32 mm. In contrast, for the HPs with a diameter of 36 mm, the minimum vapor temperature rises from 329.1 to 332.0 K. As can be seen, the minimum vapor temperature is negatively correlated with HP diameter. As the HP diameter increases, the thermal resistance of the cold side is further reduced, and the minimum vapor temperature is closer to the temperature of the cold side. In the simulation range, the differences of the minimum vapor temperature between various diameters decrease with the increase in mass flow rate of the hot side, and the temperature differences are balanced.
As shown in Figure 11, different HP diameters (D = 28, 32, and 36 mm) will cause different effectiveness. As the HP diameter increases, the effectiveness of the HPHEX increases. For the HPs with a diameter of 36 mm and hot side mass flow rate of 0.9 m3/h, the effectiveness of the HPHEX is 0.182. When the HP diameter becomes 32 mm, its effectiveness becomes 0.1681. In addition, the HP diameter is 28 mm, and the effectiveness is 0.153. The mass flow rates on the hot side and cold side are fixed for all cases, as the increase in HP diameter leads to the increase in heat exchange area and turbulence degree, which, in turn, increases the effectiveness.
The variation trend of the maximum condensation heat transfer coefficient with hot side mass flow rate at different HP diameters is shown in Figure 12. When the hot side mass flow rate is constant, the maximum condensation heat transfer coefficient decreases with the increase in HP diameter. The maximum condensation heat transfer coefficient is 6.28 × 10³ W/(m2·K) when the hot side mass flow rate and HP diameter are 0.9 m3/h and 36 mm, respectively. When the HP diameter changes to 32 mm, the maximum condensation heat transfer coefficient is 6.63 × 10³ W/(m2·K); for the HPs with a diameter of 28 mm, the maximum condensation heat transfer coefficient is 6.88 × 10³ W/(m2·K). With the increase in HP diameter, the minimum saturated vapor temperature decreases. The maximum condensation heat transfer coefficient is affected by the saturated vapor temperature in HPs; therefore, the maximum condensation heat transfer coefficient has the same trend as the minimum saturated vapor temperature.

4.4. Effect of H *

Figure 13 shows the minimum vapor temperature trend as a function of hot side mass flow for various values of H * . The mass flow rate at the hot side varies from 0.9 to 1.9 m3/h. The H * is determined as follows.
H * = L e / L h p
The minimum vapor temperature increases as H * increases. For H * = 0.4, the maximum and minimum values of the minimum vapor temperature are, respectively, 329.4 and 326.7 K, whereas they are 331.8 and 328.8 K for H * = 0.48. Furthermore, when H * is changed to 0.56, the maximum and minimum values of the minimum vapor temperature are determined to be 334.4 and 321.1 K, respectively. From Figure 13, it is clearly seen that the minimum vapor temperature rises with the increase in H * value, while the decrease in H * could result in the decrement of the minimum vapor temperature. This is due to the correlation of H * : when the value of H * increases, the heat exchange area of the evaporator increases, and the heat exchange area of the condenser decreases. At the same time, the evaporation heat transfer coefficient in HP increases, and the condensation heat transfer coefficient decreases. Accordingly, the reason why the minimum vapor temperature approaches the hot side temperature is that the thermal resistance of the evaporator decreases and the thermal resistance of the condenser increases. Accordingly, the reason why the minimum vapor temperature approaches the hot side temperature is that the thermal resistance of evaporator decreases, and the thermal resistance of the condenser increases.
It can be seen from Figure 14 that the effect of the H * value on effectiveness is not great. For H * = 0.4 and mc = 0.9 m3/h, the effectiveness of the HPHEX is 0.1662. When H * becomes 0.48, the effectiveness becomes 0.1681. In addition, when H * is 0.56, the effectiveness is 0.1638. The effectiveness of the HPHEX is mainly affected by the vapor temperature, hot side mass flow rate, and the physical parameters of the hot side fluid. With the increase in H * value, the vapor temperature rises and the physical parameters of the hot side fluid change in a parabolic trend. The effectiveness is mainly affected by the vapor temperature and the higher the vapor temperature is, the lower the effectiveness is. Therefore, the effectiveness is lowest when H * = 0.56. When mc = 0.9 m3/h, the physical parameters of the hot side fluid play a major role in the heat transfer process. For H * = 0.48, due to the high viscosity, P r , high density, and high specific volume at constant pressure, under the same flow conditions, the boundary layer formed by the fluid flowing through the tube wall is thicker than other H * ; therefore, the effectiveness is higher than H * = 0.4. With the increase in mass flow rate, the influence of the physical parameters of the hot side fluid gradually decreases, and the influence of the vapor temperature increases gradually. When mc = 1.5 m3/h, the effectiveness of H * = 0.4 is equal to that of H * = 0.48, and with the increase in mass flow rate at the hot side, the effectiveness of H * = 0.4 is gradually higher than that of H * = 0.48.
The maximum condensation heat transfer coefficient increases with the increase in H * . For H * = 0.4, the maximum and minimum values of the maximum condensation heat transfer are, respectively, 6.37 × 10³ and 5.92 × 10³ W/(m2·K), whereas they are 7.13 × 10³ and 6.63 × 10³ W/(m2·K) for H * = 0.48. Furthermore, when H * is changed to 0.56, the maximum and minimum values of the maximum condensation heat transfer coefficient are determined to be 7.95 × 10³ and 7.44 × 10³ W/(m2·K), respectively. It can be seen from Figure 13 and Figure 15 that the maximum condensation heat transfer coefficient has the same change trend under the influence of saturated vapor temperature.

5. Conclusions

In this paper, numerical analysis on a liquid–liquid HPHEX with phase change thermal resistance is proposed. The thermal resistances of evaporation and condensation inside the HP are comprehensively considered, and the HPHEX is analyzed more accurately. The experimental data in Ref. [5] are used to verify the numerical results. Based on the HPHEX model, the effects of three factors on heat transfer performance and minimum vapor temperature inside the HP are discussed in-depth. The three factors are (1) mass flow rates, (2) HP diameters, and (3) H * . In addition, some meaningful conclusions have been obtained.
  • The current model can fit the experimental data better and more accurately. The maximum deviations are equal to 0.32 and 0.34 kW for the cases with cold fluid inlet mass flow of 2.6 and 2.9 m3/h. The maximum error is less than 5% and can be considered reliable.
  • Using the current model, the mass flow rates at the hot side and cold side are 1.3 and 2.9 m3/h to predict the temperature change of the entire HPHEX. The hot side fluid, cold side fluid, and vapor in the HP have the same temperature change trend under the countercurrent manner. For the HPHEX with the countercurrent manner, the heat transfer rate is larger and the heat transfer is more uniform.
  • Within the scope of numerical analysis, the improvement in heat transfer rate by rising mass flow rate at the cold side could effectively increase effectiveness. Since C e is smaller than C c , the enhancement of mass flow rate at the hot side could decrease effectiveness. Meanwhile, the enhancement of the cold side mass flow rate outside the condenser facilitates a lower minimum vapor temperature. The enhancement of the hot side mass flow rate outside the condenser facilitates a higher minimum vapor temperature.
  • Within the scope of numerical analysis, an increase in HP diameter improves the effectiveness of the HPHEX and decreases the minimum vapor temperature. Thus, in the design of the HPHEX, a suitable HP diameter should be selected to enhance the effectiveness and avoid the failure of the HP.
  • Increasing H * can effectively increase the minimum vapor temperature, but has little effect on the effectiveness of the HPHEX. By changing the H * value, the vapor temperature can be changed effectively, thus avoiding the failure of the HPs.
  • The condensation heat transfer coefficient is affected by the saturated vapor temperature, and the variation trend is similar to the minimum saturated vapor temperature.

Author Contributions

Conceptualization, Q.C.; validation, Q.C., Y.S. and Z.Z.; data analysis, Q.C., Y.S. and Z.Z.; writing—original draft preparation, Q.C.; writing—review and editing, Q.C., L.W., C.X. and J.Z. All authors have read and agreed to the published version of the manuscript.

Funding

This research received no external funding.

Informed Consent Statement

Not applicable

Data Availability Statement

Data is contained within the article. The data presented in this study are available in article here.

Conflicts of Interest

The authors declare no conflict of interest.

Nomenclature

A area, m2
C p specific heat capacity of fluid, J/(kg·K)
D outer diameter of heat pipe, mm
D i n inner diameter of heat pipe, mm
g gravitational acceleration, m/s2
H * the ratio of the length of the evaporator to the length of the heat pipe
h heat transfer coefficient, W/(m2·K)
h f g latent heat of vaporization, j/kg
k w wall thermal conductivity, W/(m·K)
L length, m
m mass flow rate, m3/h
P pressure, Pa
P a t m atmospheric pressure, Pa
Q heat transfer rate, W
q heat flux, W/m2
R thermal resistance, K/W
R e Reynolds number
R g specific gas constant, J/(kg·K)
t temperature, °C(K)
Δ t temperature difference, °C(K)
Greek
α relaxation factor
ε effectiveness
μ dynamic viscosity, Pa·s
ρ density, kg/m3
Subscripts
a adiabatic
a c t u a l actual
c condenser
e evaporator
f b film boiling
h p heat pipe
i n inner
i n l e t inlet
l liquid
m a x maximum
m i n minimum
o u t outer
o u t l e t outlet
p b pool boiling
v vapor
w wall

References

  1. Shabgard, H.; Allen, M.J.; Sharifi, N.; Benn, S.P.; Faghri, A.; Bergman, T.L. Heat pipe heat exchangers and heat sinks: Opportunities, challenges, applications, analysis, and state of the art. Int. J. Heat Mass Transf. 2015, 89, 138–158. [Google Scholar] [CrossRef]
  2. Guichet, V.; Jouhara, H. Condensation, evaporation and boiling of falling films in wickless heat pipes (two-phase closed thermosyphons): A critical review of correlations. Int. J. Thermofluids 2020, 100001. [Google Scholar] [CrossRef]
  3. Jouhara, H.; Robinson, A.J. Experimental investigation of small diameter two-phase closed thermosyphons charged with water, FC-84, FC-77 and FC-3283. Appl. Therm. Eng. 2010, 30, 201–211. [Google Scholar] [CrossRef] [Green Version]
  4. Mroue, H.; Ramos, J.; Wrobel, L.; Jouhara, H. Experimental and numerical investigation of an air-to-water heat pipe-based heat exchanger. Appl. Therm. Eng. 2015, 78, 339–350. [Google Scholar] [CrossRef] [Green Version]
  5. Ma, H.; Yin, L.; Shen, X.; Lu, W.; Sun, Y.; Zhang, Y.; Deng, N. Experimental study on heat pipe assisted heat exchanger used for industrial waste heat recovery. Appl. Energy 2016, 169, 177–186. [Google Scholar] [CrossRef]
  6. Su, H.; Qi, H.; Liu, P.; Li, J. Experimental investigation on heat extraction using a two-phase closed thermosyphon for thermoelectric power generation. Energy Sources Part A Recover. Util. Environ. Eff. 2018, 40, 1485–1490. [Google Scholar] [CrossRef]
  7. Xie, C.-Y.; Tao, H.-Z.; Li, W.; Cheng, J.-J. Numerical simulation and experimental investigation of heat pipe heat exchanger applied in residual heat removal system. Ann. Nucl. Energy 2019, 133, 568–579. [Google Scholar] [CrossRef]
  8. Mochizuki, M.; Singh, R.; Nguyen, T.; Nguyen, T. Heat pipe based passive emergency core cooling system for safe shutdown of nuclear power reactor. Appl. Ther. Eng. 2014, 73, 699–706. [Google Scholar] [CrossRef]
  9. Hughes, B.R.; Chaudhry, H.N.; Calautit, J. Passive energy recovery from natural ventilation air streams. Appl. Energy 2014, 113, 127–140. [Google Scholar] [CrossRef]
  10. Mathioulakis, E.; Belessiotis, V. A new heat-pipe type solar domestic hot water system. Sol. Energy 2002, 72, 13–20. [Google Scholar] [CrossRef]
  11. Zhang, D.; Tao, H.; Wang, M.; Sun, Z.; Jiang, C. Numerical simulation investigation on thermal performance of heat pipe flat-plate solar collector. Appl. Therm. Eng. 2017, 118, 113–126. [Google Scholar] [CrossRef]
  12. Chi, R.-G.; Rhi, S.-H. Oscillating Heat Pipe Cooling System of Electric Vehicle’s Li-Ion Batteries with Direct Contact Bottom Cooling Mode. Energies 2019, 12, 1698. [Google Scholar] [CrossRef] [Green Version]
  13. Siricharoenpanich, A.; Wiriyasart, S.; Srichat, A.; Naphon, P. Thermal management system of CPU cooling with a novel short heat pipe cooling system. Case Stud. Therm. Eng. 2019, 15, 100545. [Google Scholar] [CrossRef]
  14. Ding, T.; He, Z.G.; Hao, T.; Li, Z. Application of separated heat pipe system in data center cooling. Appl. Therm. Eng. 2016, 109, 207–216. [Google Scholar] [CrossRef]
  15. Han, C.; Zou, L. Study on the heat transfer characteristics of a moderate-temperature heat pipe heat exchanger. Int. J. Heat Mass Transf. 2015, 91, 302–310. [Google Scholar] [CrossRef]
  16. Noie, S.H. Investigation of thermal performance of an air-to-air thermosyphon heat exchanger using ε-NTU method. Appl. Therm. Eng. 2006, 26, 559–567. [Google Scholar] [CrossRef]
  17. Andrzejczyk, R. Experimental Investigation of the Thermal Performance of a Wickless Heat Pipe Operating with Different Fluids: Water, Ethanol, and SES36. Analysis of Influences of Instability Processes at Working Operation Parameters. Energies 2018, 12, 80. [Google Scholar] [CrossRef] [Green Version]
  18. Jafari, D.; di Marco, P.; Filippeschi, S.; Franco, A. An experimental investigation on the evaporation and condensation heat transfer of two-phase closed thermosyphons. Exp. Therm. Fluid Sci. 2017, 88, 111–123. [Google Scholar] [CrossRef]
  19. Imura, H.; Kusada, H.; Oyata, J.; Miyazaki, T.; Sakamoto, N. Heat transfer in two-phase closed type thermosyphons. Trans. Jpn. Soc. Mech. Eng. 1977, 22, 485–493. [Google Scholar]
  20. Shiraishi, M.; Kikuchi, K.; Yamanishi, T. Investigation of heat transfer characteristics of a two-phase closed thermosyphon. J. Heat Recover. Syst. 1981, 1, 287–297. [Google Scholar] [CrossRef]
  21. Nusselt, W. The condensation of steam on cooled surfaces. Z. Ver. Dtsch. Ing. 1916, 60, 541–546. [Google Scholar]
  22. Chun, K.R.; Seban, R.A. Heat Transfer to Evaporating Liquid Films. J. Heat Transf. 1971, 93, 391–396. [Google Scholar] [CrossRef]
  23. Zhang, R. Capillary driven thermal and hydrodynamic characteristics of axial swallow-tailed micro-grooved heat pipe. Energy Sources Part A Recover. Util. Environ. Eff. 2018, 41, 2573–2587. [Google Scholar] [CrossRef]
  24. Alizadehdakhel, A.; Rahimi, M.; Alsairafi, A.A. CFD modeling of flow and heat transfer in a thermosyphon. Int. Commun. Heat Mass Transf. 2010, 37, 312–318. [Google Scholar] [CrossRef]
  25. Žukauskas, A. Heat Transfer from Tubes in Crossflow. Heat Transf. Nucl. Reacter Saf. 1972, 8, 93–160. [Google Scholar] [CrossRef]
  26. Pulat, E.; Etemoglu, A.; Can, M. Waste-heat recovery potential in Turkish textile industry: Case study for city of Bursa. Renew. Sustain. Energy Rev. 2009, 13, 663–672. [Google Scholar] [CrossRef]
Figure 1. (a) Working principle diagram of heat pipe (HP); (b) thermal resistance model inside HP.
Energies 14 00589 g001
Figure 2. Model structure of heat pipe heat exchanger (HPHEX).
Energies 14 00589 g002
Figure 3. Flow chart of mathematical model of n-rows HPHEX.
Energies 14 00589 g003
Figure 4. (a) Schematic diagram of HPs distribution. (b) The structure diagram of the integral HPHEX and the way of inlet and outlet of hot and cold fluid.
Energies 14 00589 g004
Figure 5. (a) Comparative analysis of model structure and experimental data under cold fluid inlet mass flow rate of m c = 2.6. (b) Comparative analysis of model structure and experimental data under cold fluid inlet mass flow rate of 2.9 m3/h.
Energies 14 00589 g005
Figure 6. The temperature change trend of hot side and cold side flowing through the HPs, together with that of vapor in HPs. (The inlet mass flow rates at the hot side and cold side of the HPHEX are 1.3 and 2.9 m3/h, respectively.)
Energies 14 00589 g006
Figure 7. Comparison of minimum vapor temperature with different cold side mass flow rates.
Energies 14 00589 g007
Figure 8. Comparison of effectiveness with different cold side mass flow rates.
Energies 14 00589 g008
Figure 9. Comparison of maximum condensation heat transfer coefficient with different cold side mass flow rates.
Energies 14 00589 g009
Figure 10. Comparison of the minimum vapor temperature with different HP diameters. (The mass flow rate at cold side of the HPHEX is 2.9 m3/h.)
Energies 14 00589 g010
Figure 11. Comparison of effectiveness with different HP diameters. (The mass flow rate at cold side of the HPHEX is 2.9 m3/h.)
Energies 14 00589 g011
Figure 12. Comparison of maximum condensation heat transfer coefficient with different HP diameters. (The mass flow rate at cold side of the HPHEX is 2.9 m3/h.)
Energies 14 00589 g012
Figure 13. Comparison of minimum vapor temperature with different H * . (The mass flow rates at cold side of the HPHEX is 2.9 m3/h.)
Energies 14 00589 g013
Figure 14. Comparison of effectiveness with different H * . (The mass flow rate at cold side of the HPHEX is 2.9 m3/h.)
Energies 14 00589 g014
Figure 15. Comparison of maximum condensation heat transfer with different H * . (The mass flow rate at cold side of the HPHEX is 2.9 m3/h.)
Energies 14 00589 g015
Table 1. The main parameters of heat pipe heat exchanger.
NameValueNameValue
Diameter32 mmArrangementTriangular
Length of condenser0.48 mHeat pipes spacingRefer to Figure 4a
Length of adiabatic section0.04 mInlet temperatureCold side: 44 °C, hot side: 80 °C
Length of evaporator0.48 mNumber of HPs31
Tube wall thickness3 mmFlow typeCountercurrent
Working mediumwaterHeat exchanger fluidCold side: water, hot side: waste water (regarded as water)
Fill ratio30%--
MaterialCarbon steel--
Publisher’s Note: MDPI stays neutral with regard to jurisdictional claims in published maps and institutional affiliations.

