Article

Design and Parametric Investigation of an Efficient Heating System, an Effort to Obtain a Higher Seasonal Performance Factor

by
Trond Thorgeir Harsem
1,2,*,
Behrouz Nourozi
1,
Amirmohammad Behzadi
1 and
Sasan Sadrizadeh
1
1
Department of Civil and Architectural Engineering, KTH Royal Institute of Technology, 114 28 Stockholm, Sweden
2
Norconsult AS, 1338 Sandvika, Norway
*
Author to whom correspondence should be addressed.
Energies 2021, 14(24), 8475; https://doi.org/10.3390/en14248475
Submission received: 29 November 2021 / Revised: 9 December 2021 / Accepted: 13 December 2021 / Published: 15 December 2021
(This article belongs to the Special Issue Thermal Energy Management in Buildings)

Abstract

:
The present work introduces an innovative yet feasible heating system consisting of a ground source heat pump, borehole thermal energy storage, an auxiliary heater, radiators, and ventilation coils. The concept is developed by designing a new piping configuration monitored by a smart control system to reduce the return flow temperature and increase the temperature differential between the supply and return flows. The radiators and ventilation heating circuits are connected in series to provide the heat loads with the same demand. The investigation of the proposed model is performed through developed Python code considering a case study hospital located in Norway. The article presents, after validation of the primary heating system installed in the hospital, a parametric investigation to evaluate the effect of main operational parameters on the performance metrics of both the heat pump and the total system. According to the results, the evaporator temperature is a significant parameter that considerably impacts the system performance. The parametric study findings show that the heat pumps with a thermal capacity of 400 kW and 600 kW lead to the highest heat pump and total seasonal performance factors, respectively. It is also observed that increasing the heat pump capacity does not affect the performance indicators when the condensation temperature is 40 °C and the heat recovery is 50%. Moreover, choosing a heat pump with a smaller capacity at the heat recovery of 75% (or higher) would be an appropriate option because the seasonal performance values are not varied by changing the heat pump capacity. The results reveal that reducing return temperature under a proper parameters selection results in substantially higher seasonal performance factors of the heat pump and total system. These outcomes are in-line with the United Nations sustainable development goals including Sustainable Cities and Communities.

1. Introduction

Energy demand in all sectors is expanding dramatically worldwide, with yearly growth exceeding 2% [1]. According to the European environment agency, energy usage in the building sector, comprising residential and commercial units, will increase by 65% by 2050 compared to 2018 [2]. Rising income, urbanization, and increased population all contribute to considerably growing energy demand [3]. More than 85% of this energy comes from fossil fuels like coal, oil, and gas, releasing greenhouse gases leading to global temperature increment [4,5]. According to the world meteorological organization statistics, 2020, with a higher average temperature of 1.2 °C than 1900, was one of the three warmest years on record globally [6]. The most effective and promising strategy for attaining significant greenhouse gas emission reductions is to deploy renewable resources [7,8]. In this regard, if renewable energy had not been utilized since 2005, emissions would have been more than 10% greater than they are now. In this regard, Solarin et al. [9] demonstrated that a 1.5% lower ecological footprint is achieved by a 10% reduction of fossil fuel usage.
Among different technologies for recovering geothermal energy, a ground source heat pump (GSHP) is one of the most energy-efficient, environmentally clean, and cost-effective systems available with a long life span and high energy conversion rate into a heating and cooling system [10]. Spitler et al. [11] reported the technical benefits of ground source heat pumps and showed that it could be a promising option for improving the sustainability within the building. In another study, Maddah et al. [12] investigated and compared the performance of a ground source heat pump with the same technologies for a case study university building. They showed that the proposed system is superior from techno-economic and environmental aspects due to an annual electricity reduction of 239 MWh and carbon dioxide emission mitigation of 140 tons. Chang et al. [13] proposed a heat pump-driven building heating and cooling system in china. According to their results, the primary energy saving would be reduced by 80% compared to the conventional systems. Fadejev et al. [14] evaluated the performance metric of a building system comprising a ground source heat pump and borehole thermal energy storage (TES), considering the case of Finland. The proposed plant was found to be a viable heat source alternative to obtain a net-zero energy building. The feasibility of applying ground source heat pumps to drive a building heating system was studied by Fadejev and Kurnitski [15], showing that the proposed renewable integration results in 23% lower primary energy use. The influence of main operational parameters on the performance of a ground source heat pump interacting with a building in Turkey was examined by Hepbasli and Balta [16]. Based on their observation, the condenser and evaporator temperatures are significant parameters that highly impact the performance metrics. Lately, Massarotti et al. [17] studied a ground source heat pump to show how low-exergy input can provide the entire heating and cooling demands of historical buildings in Italy. They obtained that 53% lower CO2 is emitted into the atmosphere than the traditional system based on fossil fuels, indicating heat pumps’ significance. Villarino et al. [18] performed a comparative energy, economic, and environmental assessment of a heat pump-based system against the same technologies to provide the energy demand of an office building. Their results demonstrated that the proposed system is an excellent choice from all viewpoints due to a higher coefficient of performance (COP), lower environmental pollution, and reduced energy costs. Blázquez et al. [19] evaluated and compared the most significant factors, including initial investment, environmental impact, and availability, of widely used systems for heating and cooling purposes in building applications. They reported that a ground source heat pump is the best alternative to the traditional systems based on biogas and natural gas.
In addition to increasing the usage of renewable energy, different performance improvement approaches and strategies can help achieve efficient, sustainable, cost-effective, and environmentally friendly heat pumps interacting with the building system. Liang et al. [20] designed smart controllers to enhance the performance of a ground source heat pump. They managed to improve the heat pump’s effectiveness yet maintain thermal comfort by smartly controlling the building’s energy demand and nominal electricity usage. Farzanehkhameneh et al. [21] applied an innovative model to find the most appropriate parameters for enhancing the performance and overcoming the high installation cost of a ground source heat pump integrated with borehole TES. They obtained that the proposed model reduces the payback period while improving the COP considerably. In another work, Sun et al. [22] proposed a new scheme to improve a heat pump-driven system’s performance and economic benefits interacting with a centralized absorption chiller and district heating network. Their scheme resulted in higher exergy efficiency and lower levelized energy costs. The performance indicators of an innovative configuration of a dual-source heat pump equipped with phase change materials were assessed and compared with the systems by Bottarelli and Gallero [23], showing that the proposed materials result in the smaller size of geothermal equipment, which is techno-economically advantageous. It was also obtained that the studied configuration was a potent and resilient alternative for conventional air source heat pumps. Shin et al. [24] introduced a novel combined system comprising ground source heat pumps for air conditioning and hot water delivery supplied by the same water loop. They investigated the feasibility of the proposed design for a case study hotel using TRNSYS software [25]. In comparison to the traditional system consisting of separate heat pumps working individually, the suggested integrated system requires 19.1% and 9.6% lower input electricity to supply heating and cooling demands in cold and hot seasons, respectively. They also implemented outdoor reset controls to the proposed system for attaining economic benefits and resulted in 25% annual electricity saving with an acceptable cost reduction [26]. Lee et al. [27] offered an innovative variable liquid-line system to enhance the heat pump performance by adjusting the refrigerant charge under different operational conditions. According to their results, a considerable improvement in COP could be achieved by applying proper control strategies to the variable line.
The above-discussed literature is an example of various approaches and strategies applied to improve the heat pump system’s performance in building applications. Regardless of their positive outcomes, the literature still suffers from a practical solution to enhance the heat pump effectiveness. This work presents a novel hydronic heating system driven by a ground source heat pump. The proposed smart design reduces the heat pump return flow temperature, resulting in doubling the temperature difference between supply and return flows. This design may require a smaller pipes size and pumps capacity to deliver the same heating power at a higher temperature difference. The feasibility of the proposed system is assessed for a case study hospital in Norway. A parametric study is evaluated to examine the effect of main operational variables on the heat pump’s performance and the overall system. Noteworthy, in the suggested configuration, rather than the traditional parallel connection, radiators and the ventilation heating circuits are in series connection, leading to better compatibility with the case of the hospital having the same heat load on radiator and ventilation circuits.

2. Methodology

Current research studied the performance of a hydronic heating system equipped with a ground source heat pump in a hospital located in Norway. The building and the corresponding components were modeled using code developed by the authors. This section provides information regarding the building, the heating system, including the heat pump, the mathematical modeling, and the code validation.

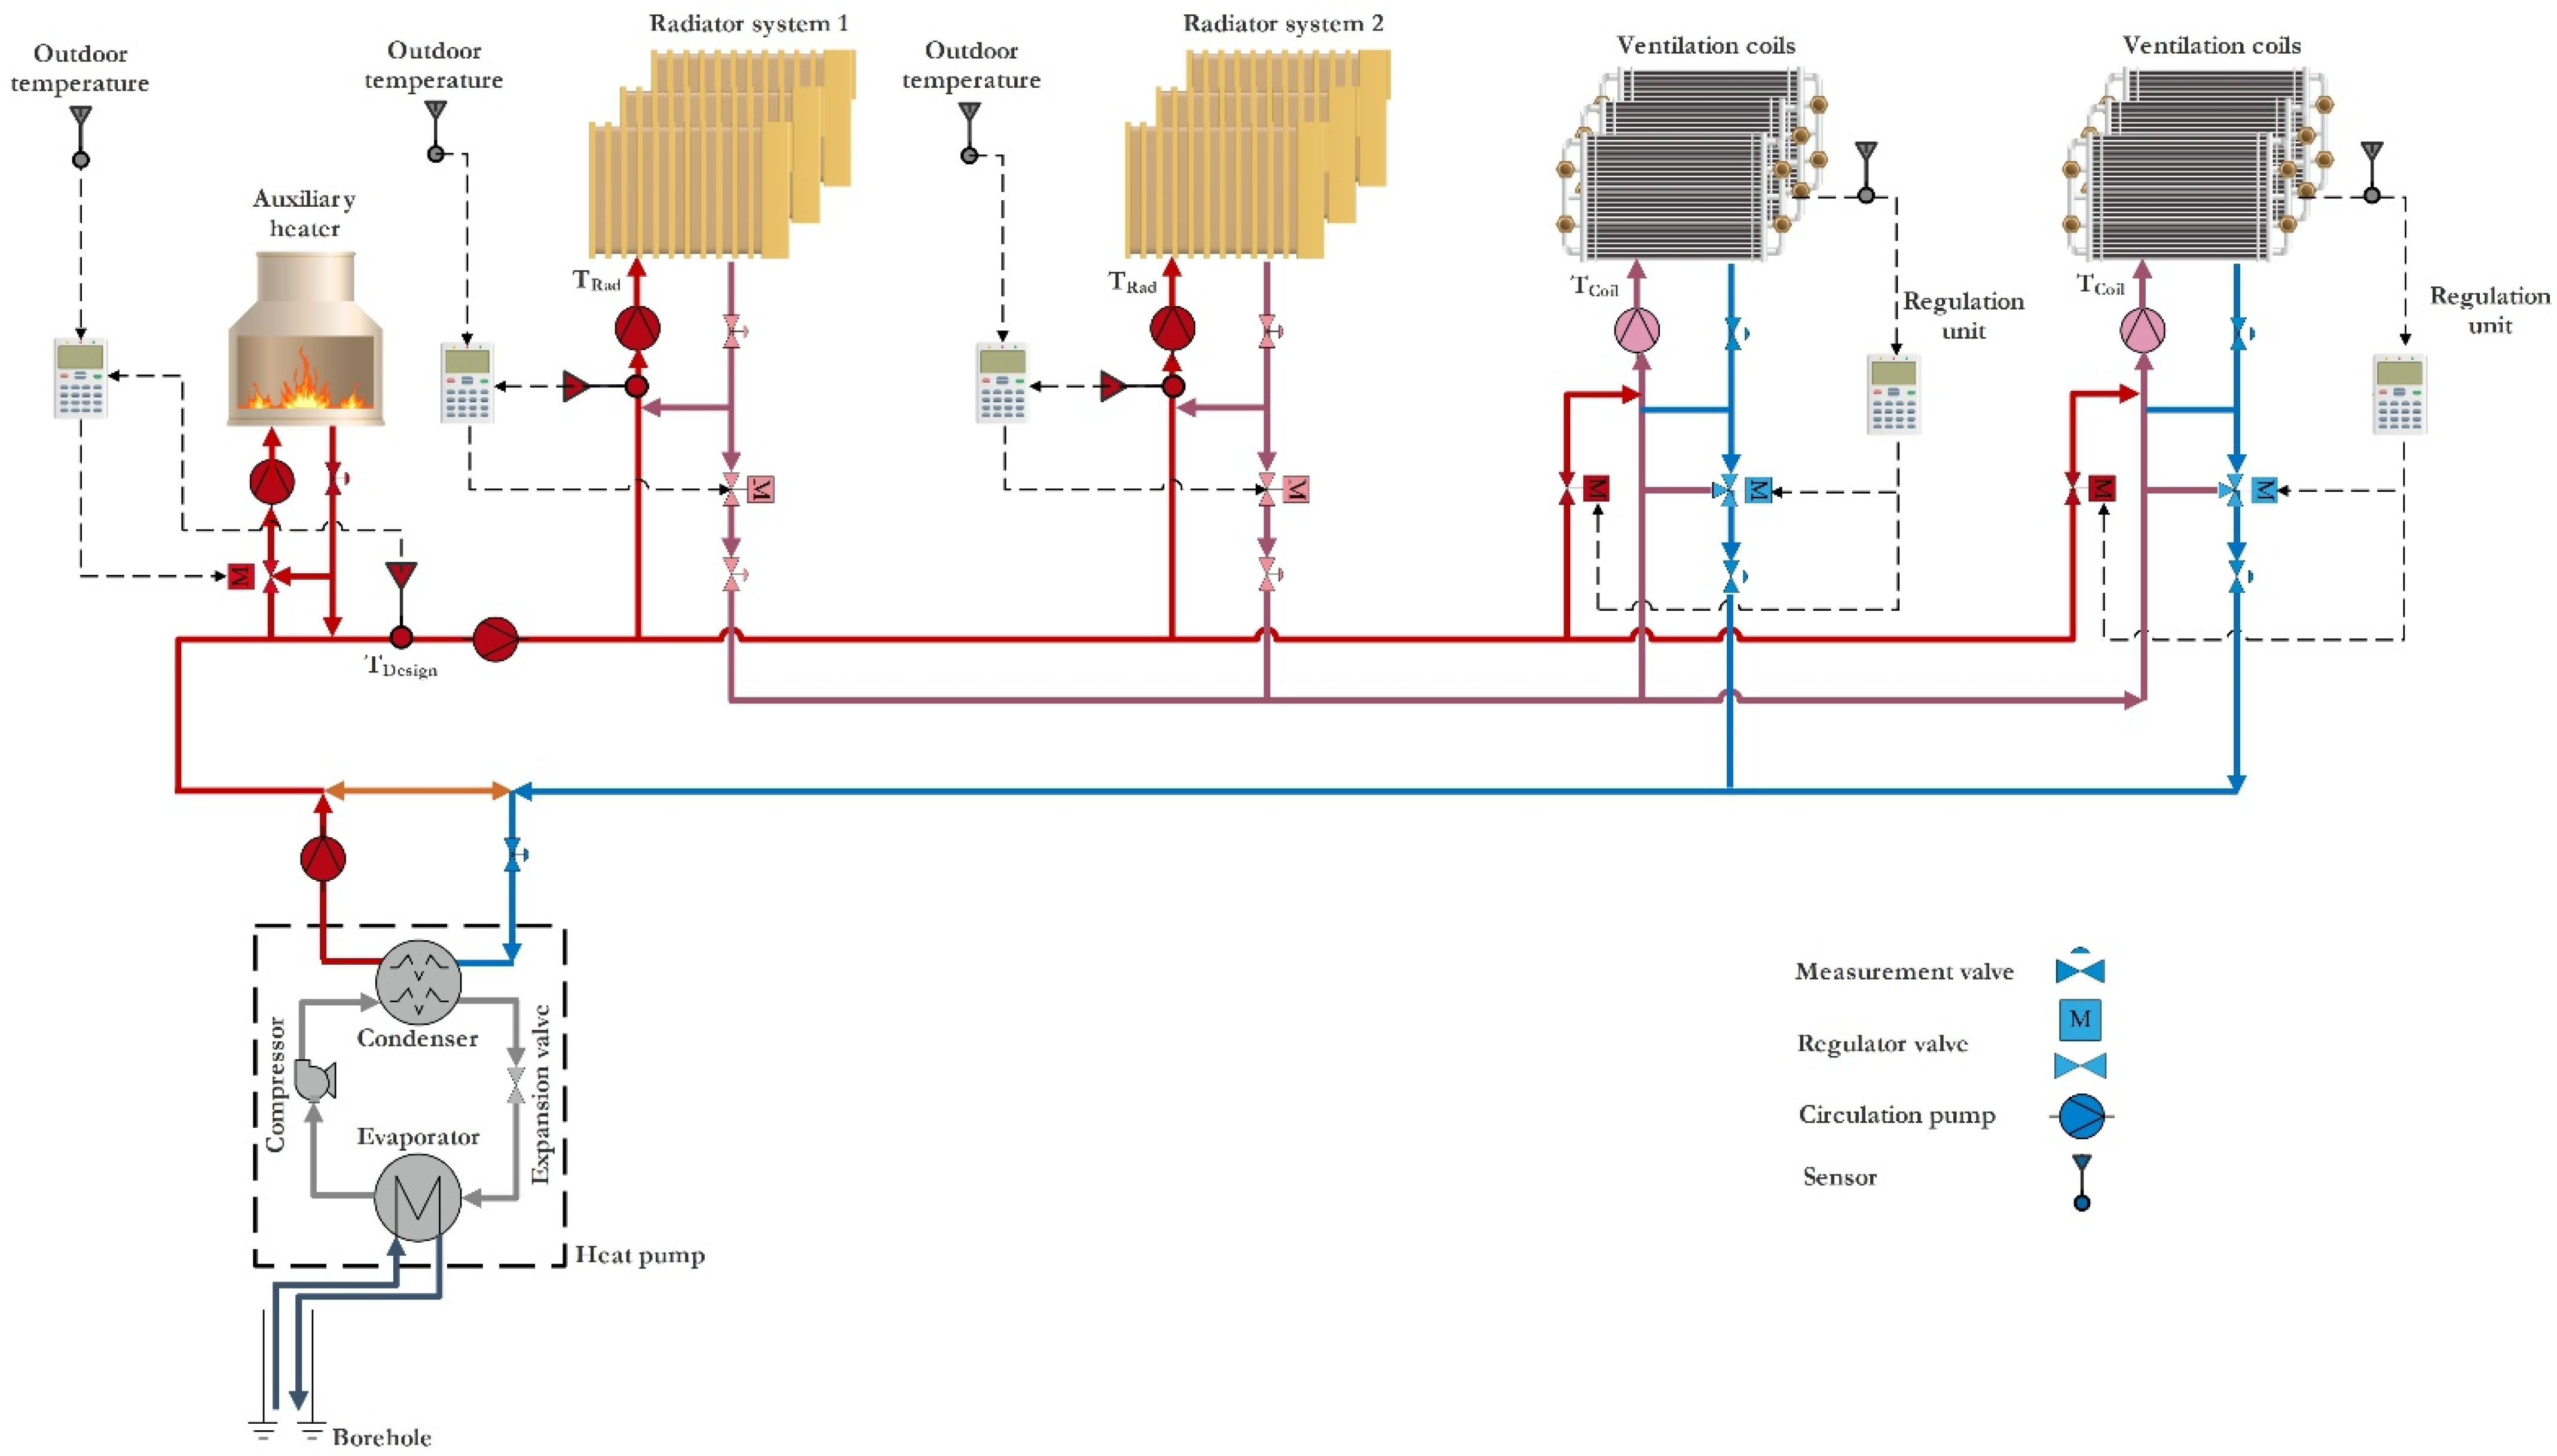
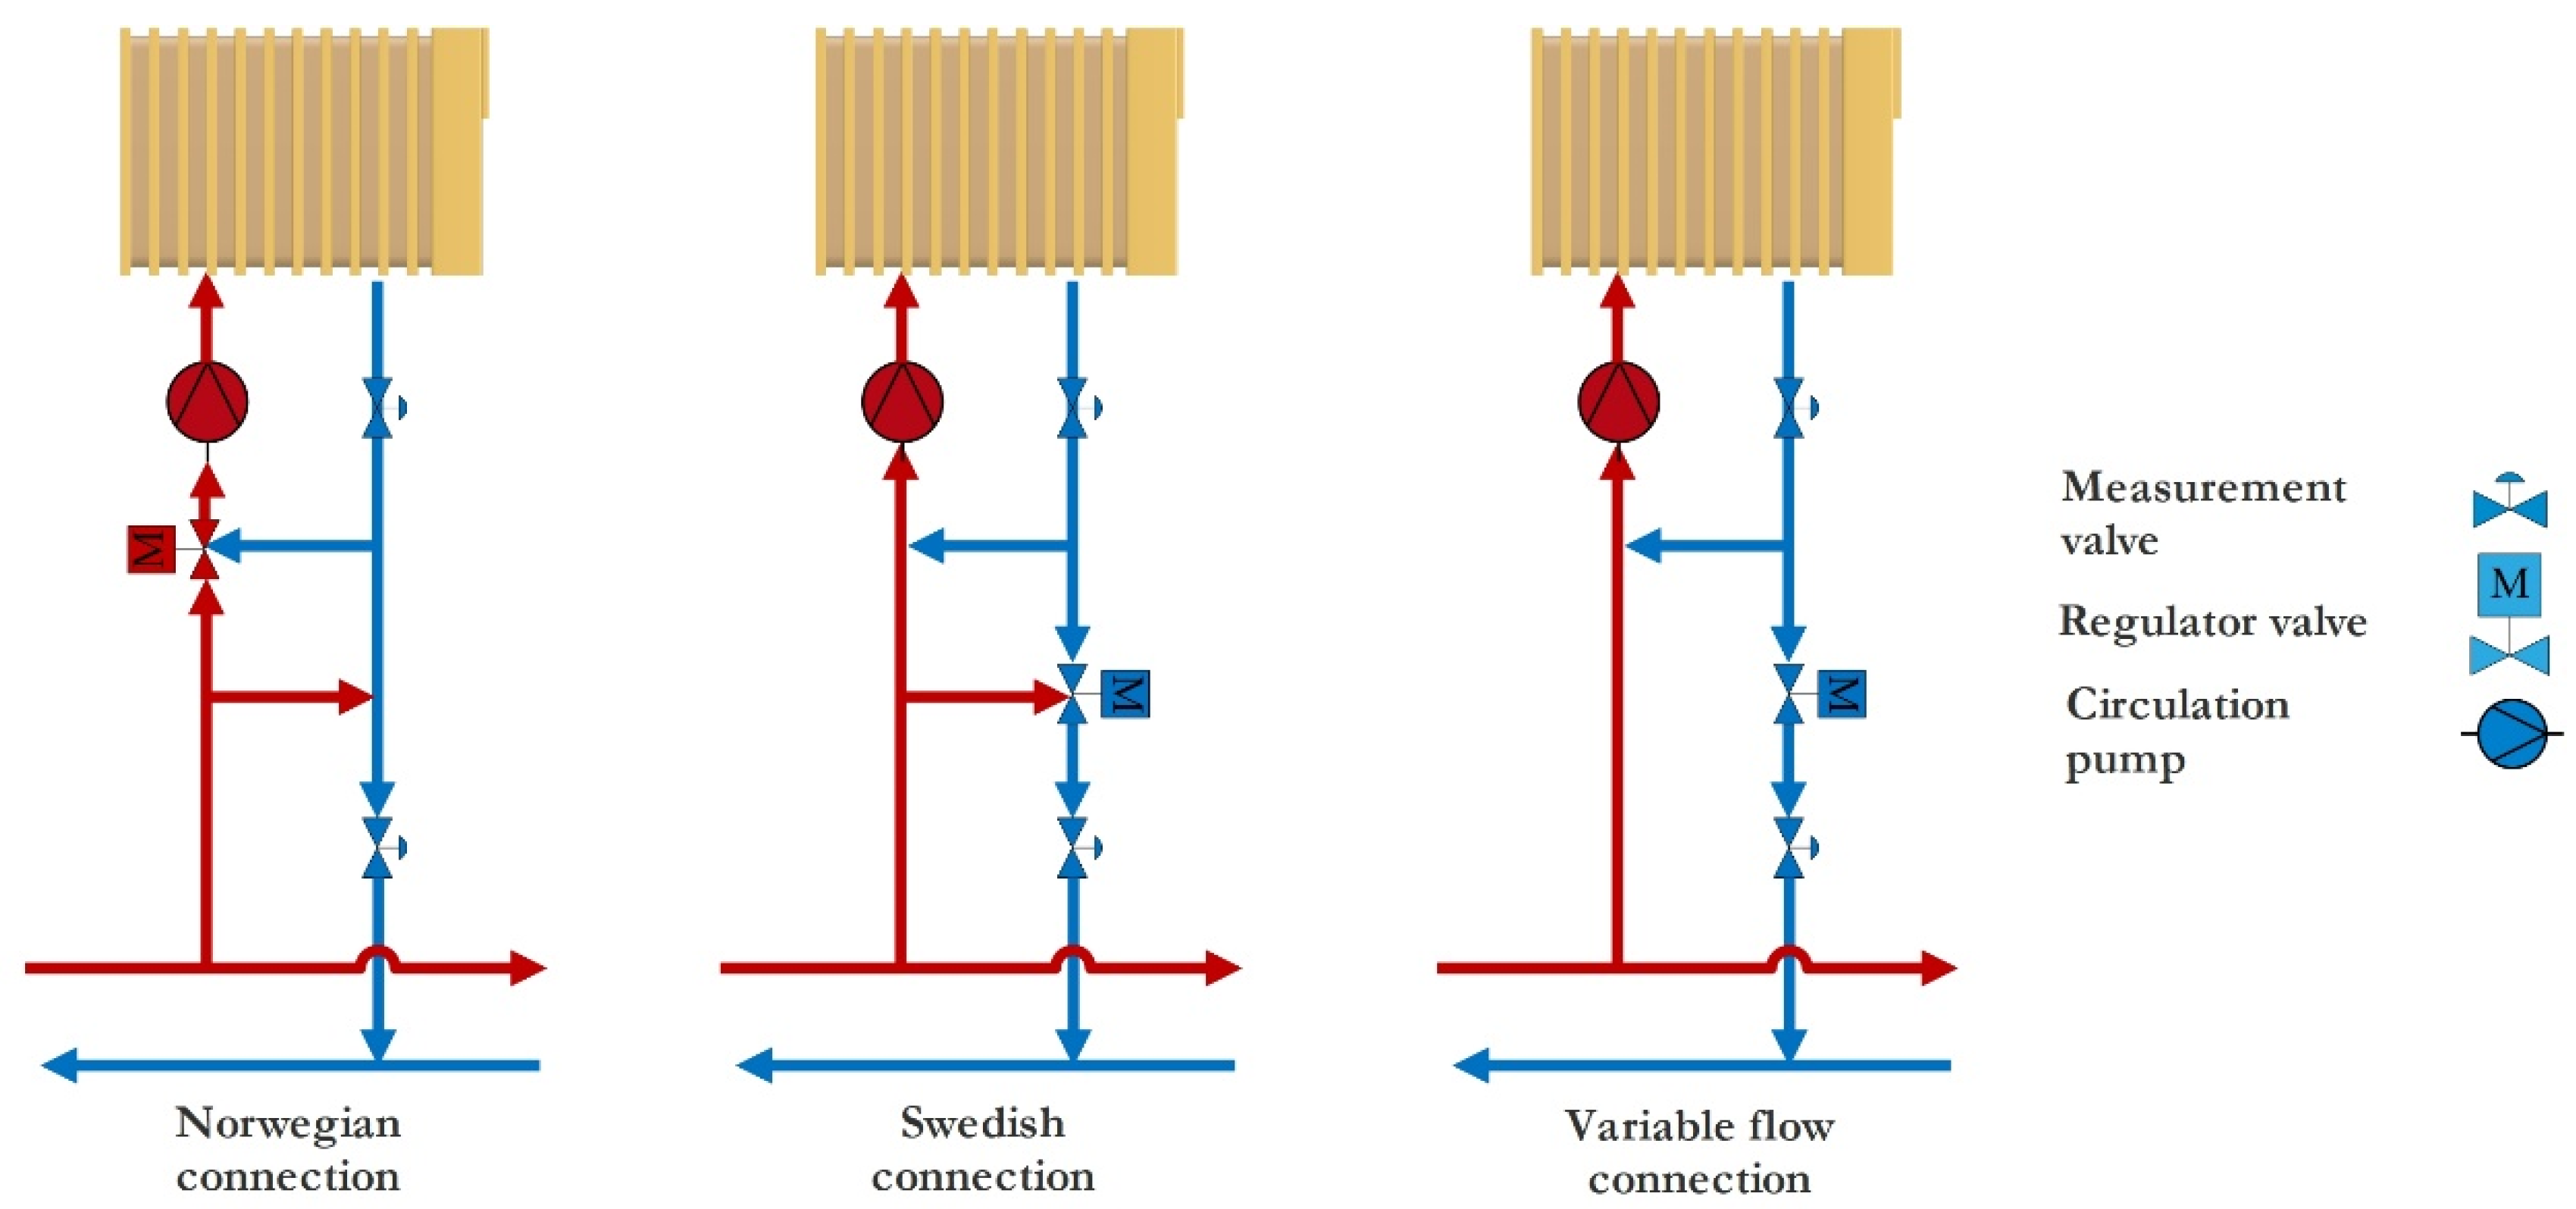
2.1. The Studied System

The investigated building was a hospital located in Oslo with a total heated area of 10,294 m2. The simulation model was based on the design parameters for a newly-built hospital in Kirkenes, north of Norway. The measurements from this case study were used in Section 2.3 to validate the simulations. The building’s heated demand was supplied by radiators and a mechanical ventilation system with heat recovery (MVHR). The heat recovery efficiency of the air handling unit (AHU) varied between 50–82%. The heating system was primarily supplied by a ground source heat pump and a gas boiler as an auxiliary heating source. Figure 1 illustrates schematics of the heating system used in the hospital. A ground source heat pump and an auxiliary gas boiler feed the hydronic system.
Generally, temperature regulation in a hydronic heating system is based on outdoor temperature-compensated supply temperature. As shown in Figure 1, regulation units receive temperature signals from the radiators, ventilation coils, outdoor air, and the main supply water (design temperature). Thereupon, the actuator valves regulate the inlet and outlet flows to the radiators and ventilation coils to achieve the desired temperature.
Radiators and the ventilation coils can be connected in different configurations using so-called Norwegian, Swedish, and variable flow connection valves [28], see Figure 2. The Norwegian and Swedish connections are designed for constant hydronic flow at the sides of three-way valves, and the variable flow connection is designed to enable variable flow at the primary side of the valve. Such different configurations allow using the thermal energy of the return water in the pipes for the ventilation coils and obtaining lower return temperature to the condenser. The effect of this design on the coefficient of performance of the heat pump will be investigated.
Hydronic heating solutions, including radiators and a ventilation system, are usually implemented in the Scandinavian countries with variable flow connections, as is shown in Figure 1. The primary configuration in this system is that all the hydronic return flow from, i.e., radiator systems, floor heating, and heating ventilation coils, are collected in one return flow pipe. The auxiliary heater used in the system is connected with a Norwegian connection. The abovementioned configurations can be changed to make series or parallel connections between the radiators and the ventilation coils. We, therefore, conducted a parametric study on the variables furnished in Table 1 to assess the impact of each parameter on the system and heat pump performance [28,29].

2.2. Mathematical Modeling

System analysis is performed by solving the mass and energy balance equations, as the following:
m ˙ i n = m ˙ o u t
Q ˙ W ˙ = m ˙ o u t h o u t m ˙ i n h i n
where m ˙   [ kg s ] is the mass flowrate to/from the system, which can be the building or any component such as a heat pump, etc. and h   [ kJ kg ] is the enthalpy.
Equation (3) describes the building energy model, incorporating internal convective heat gains, transmission heat gains through walls, heat transfer among zones, and infiltration gains [30].
m a i r C p , a i r d T z d t = Q ˙ e q u i p m e n t s + Q ˙ s u r f a c e s + Q ˙ z o n e s + Q ˙ a m b + Q ˙ s y s t e m
Equations (4)–(7) are used to integrate different terms of Equation (3) [25].
Q ˙ e q u i p m e n t s = i = 1 N e q u i p m e n t m ˙ i C p ( T e q u i p m e n t , i T z )
Q ˙ s u r f a c e s = i = 1 N s u r f a c e s h i A i ( T s u r f a c e , i T z )
Q ˙ z o n e s = i = 1 N z o n e s m ˙ i C p ( T z , i T z )  
Q ˙ a m b = m ˙ a m b C p ( T a m b T z )
where C p   [ kJ kgK ] is the specific heat, T   [ K ] is temperature, Q ˙   [ kW ] is thermal load, and A   [ m 2 ] is the heat transfer area.
The heat pump coefficient of performance (COP) is defined by the Lorenz equation as follows:
COP = η L o r e n z × COP L o r e n z
For heat production, the Lorenz equation can be written as below [31].
COP L o r e n z = T l m , H T l m , H T l m , c
where ηLorenz is the Lorenz efficiency defined as the ratio between the actual and Lorenz coefficients of performance, and Tlm is the logarithmic mean temperature evaluated by Equations (10) and (11).
T l m , C = T C , o u t T C , i n ln T C , o u t ln T C , i n
T l m , H = T H , o u t T H , i n ln T H , o u t ln T H , i n
A parametric study is conducted to assess the effect of major operational parameters on the performance of the system by analyzing their impact of Seasonal Performance Factor of the heat pump (SPFhp) and the entire system, including peak load during the year (SPFtot), as described in Equations (12) and (13). The studied operational parameters are the heat pump capacity, evaporator and condenser temperatures, ventilation coil supply/return temperatures, and the ventilation heat recovery percentage.
S P F h p = Q t h e r m a l ,   h p Q e l , h p = Q v e n t i l a t i o n + Q r a d i a t o r Q e l , h p
S P F t o t = Q v e n + Q r a d Q e l , h p + Q a u x = Q t h e r m a l ,   h p + Q a u x Q e l , h p + Q a u x

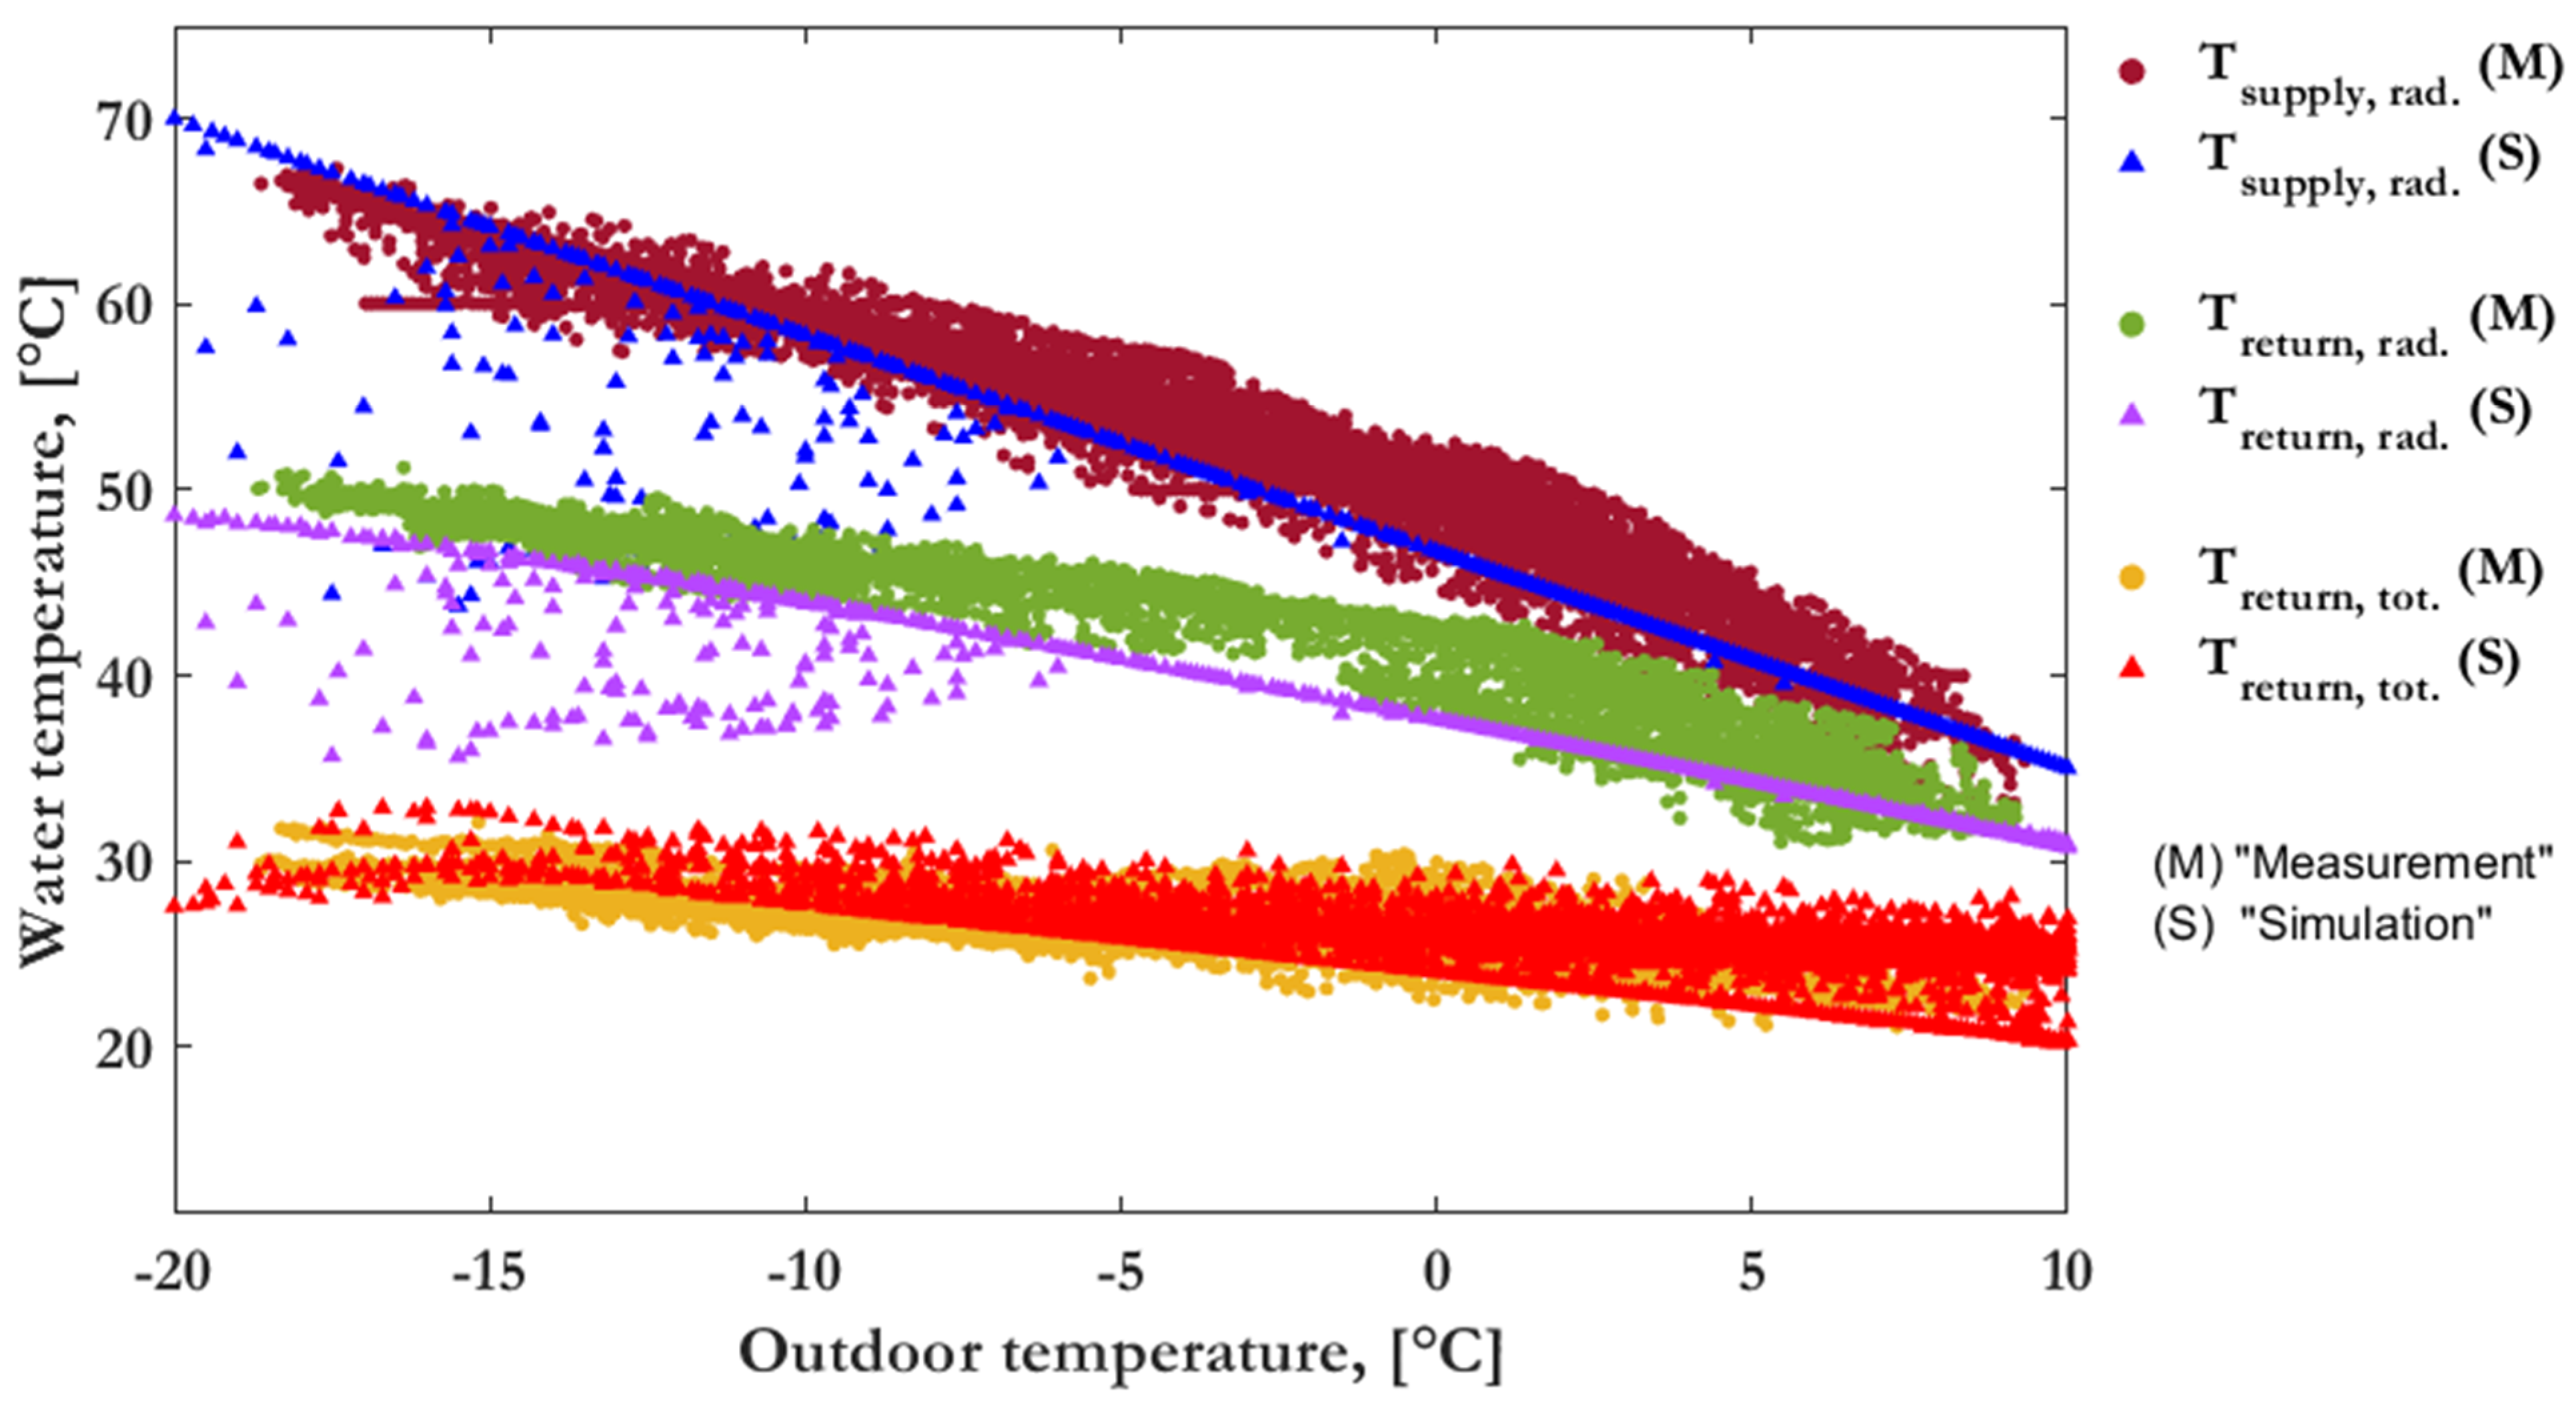
2.3. Validation of Simulation Tool

The simulation results for supply and return temperatures to radiators were compared against measurement data at a hospital in Norway. The on-site measurements were carried out in an extended period when the outdoor temperature varied between −18 °C–+10 °C, as shown in Figure 3. The total return temperature from the entire system, radiators and ventilation system is also shown against the measured values. The main supply temperature is outdoor-compensated with a 5 °C higher temperature than the supply for the radiator systems.
It is observed that there is a 20 °C difference between the supply and returns temperature of the radiators both in measurements and simulation for the setback outdoor temperature (−20 °C). Furthermore, we also see a total temperature difference of 40 °C between the supply temperature to the radiators and the return flow temperature for the entire system. Measurement and simulation results are in good agreement, and thus, we concluded that the developed code could accurately predict the physics of the system.

3. Results and Discussion

We have conducted a parametric study to assess the effect of main operational parameters on the system’s performance by analyzing their effect on the seasonal performance factor of the heat pump and the entire system. The values of input parameters are the condenser temperature of 50 °C, ventilation heat recovery of 50%, radiator, and ventilation supply/return temperature ratios of 70/50 and 50/30, respectively.
Figure 4 refers to the effect of evaporator temperature and the ventilation temperature ratio, defined as the ratio of supply and return temperatures. As depicted, the increase in evaporator temperature leads to a higher heat pump and total SPFs. It can also be concluded that compared to the overall system, the heat pump performance is more sensitive to the changes in evaporator temperature due to the considerably higher SPFhp reduction than SPFtot. The figure further shows that when the evaporator temperature increases from −10 °C up to 5 °C, the rise of SPFhp is higher than the SPFtot increment. According to Figure 4, as the ventilation ratio varies from 70/50 °C/°C to 70/30 °C/°C—that is, the reduction of return temperature—the values of SPFhp and SPFtot will increase, which are favorable.
Moreover, Figure 4a demonstrates that for the same value of return temperature (30 °C), the reduction of supply temperature from 70 °C to 60 °C leads to a higher heat pump and total SPFs. Figure 4a also indicates that the mitigation of supply temperature from 60 °C to 50 °C has a neutral effect on the system’s performance for the same return temperature of 30 °C. Figure 4a illustrates that SPFhp is independent of the ventilation temperature ratio for the heat pump capacity of 600 kW. However, the variation of ventilation ratio from 70/50 °C/°C to 70/30 °C/°C results in a higher total SPF. The comparison of Figure 4a,b vividly reveals that for the same value of evaporator temperature and ventilation temperature ratio, using a heat pump with the capacity of 400 kW leads to a higher SPFhp than 600 kW heat pump. This is because the 400 kW heat pump operates at a lower temperature level and has a longer running time with full capacity leading to more effectiveness.
The parametric study is accomplished in the following figures considering the ventilation temperature ratio of 70/30 °C/°C. As the system’s performance could be highly affected by the heat recovery process. Figure 5 presents the effect of heat recovery percentage on the heat pump and total system performance. Figure 5a shows that when the rate of heat recovery increases from 50% to 82%, the total SPF will be increased up to a maximum value (at the heat recovery of 75%) and then decreases. However, Figure 5a reveals that the heat pump unit operates with a higher SPFhp at the minimum heat recovery percentage of 50%.
According to Figure 5b, the mitigation of heat recovery from 82% to 50% enhances the total system performance from the quantity of energy conversion due to a higher SPFtot. In contrast, Figure 5b shows that the highest SPFhp alludes to the heat recovery of 82%. The comparison of obtained SPF values demonstrates that the heat recovery of 75% could be an optimal option due to the highest SPFtot for 400 kW capacity and second-highest SPFtot for the capacity of 600 kW. Moreover, the figure reveals that the heat recovery percentage of 50% is another good alternative because of the highest SPFhp and SPFtot for the capacity of 400 kW and 600 kW, respectively.
Table 2 indicates the variations of SPF values, the total delivered energy (electricity plus auxiliary heat), and building heating demand for better insight into the effect of the ventilation heat recovery percentage and heat pump capacity. For this, the radiator and the ventilation temperature ratios, and evaporator temperature are, respectively, 70/50 °C/°C, 70/30 °C/°C, and −5 °C. The table shows that for a heat pump capacity of 400 kW, the lowest SPFtot corresponds to the ventilation heat recovery of 50%. According to the table, for a 400 kW heat pump, by increasing the recovery percentage from 50% to 75%, SPFtot value increases since the mitigation of heating demand is lower than the decrement of total delivered energy. However, the increase of recovery percentage from 75% to 82% leads to a lower SPFtot because of the higher reduction of heating demand than the decrement of delivered energy. According to the table, for the heat pump capacity of 600 kW, the value of SPFtot is reduced by increasing the ventilation heat recovery percentage. This is rational because the decrease of heat demand is higher than reducing the total delivered energy. The table further presents that the increase in heat pump capacity from 400 kW to 600 kW improves SPFtot. In contrast, SPFhp alone remains relatively constant despite increasing its capacity.
In Figure 6, the variation of SPFs with the evaporator and condenser temperatures and the heat pump capacity is investigated and compared, contemplating the ventilation temperature ratio of 70/30 °C/°C and the heat recovery of 50%. According to the figure, same as the previous graphs, the increase of evaporator temperature leads to a higher SPFhp and SPFtot values. Besides, the figure depicts that while the rise in condenser temperature from 40 °C to 60 °C leads to a higher SPFtot, SPFhp reduces dramatically. The comparison of Figure 6a,b demonstrates that for condenser temperatures of 50 °C and 60 °C, the increase in heat pump capacity from 400 kW to 600 kW improves SPFtot while reducing SPFhp. According to Figure 6a,b, at the condensation temperature of 40 °C, there is no difference between 400 kW and 600 kW heat pumps because SPF values remain relatively constant.
To get a deeper insight into the correlation of heat recovery percentage and the heat pump capacity, the variation of performance indicators with the evaporator and condenser temperatures and the heat pump capacity for heat recovery of 75% is shown in Figure 7. Same as Figure 6, a higher SPFtot and lower SPFhp is attained by increasing the condenser temperature. Moreover, the figure indicates that SPF values will increase by increasing the evaporator temperature. Finally, from Figure 7, it can be observed that by choosing the heat recovery of 75% (or higher), the increase of heat pump capacity from 400 kW to 600 kW does not change the values of SPFs. Therefore, at 75% (or higher) heat recovery, a more favorable economic condition is achieved by selecting a heat pump with a lower capacity.

4. Conclusions

The present work proposes a novel and efficient geothermal-driven heating system comprising a ground source heat pump, borehole thermal energy storage, an auxiliary heater, radiators, and ventilation coils. The idea is performed by developing an innovative piping configuration equipped with controllers mitigating the return flow temperature and increasing the temperature difference between supply and return flows. The effectiveness of the suggested system is assessed for a case study hospital in Norway. Instead of the typical parallel connection, radiators and ventilation heating circuits are connected in series, offering the possibility of using the water two times and resulting in improved compatibility for the hospital having the radiator and ventilation units with the same heat load. The impact of main decision parameters containing evaporator temperature, heat pump capacity, condenser temperature, ventilation temperature ratio, and the heat recovery percentage on seasonal performance factors is examined and compared through a parametric study. The main findings can be summarized as follows:
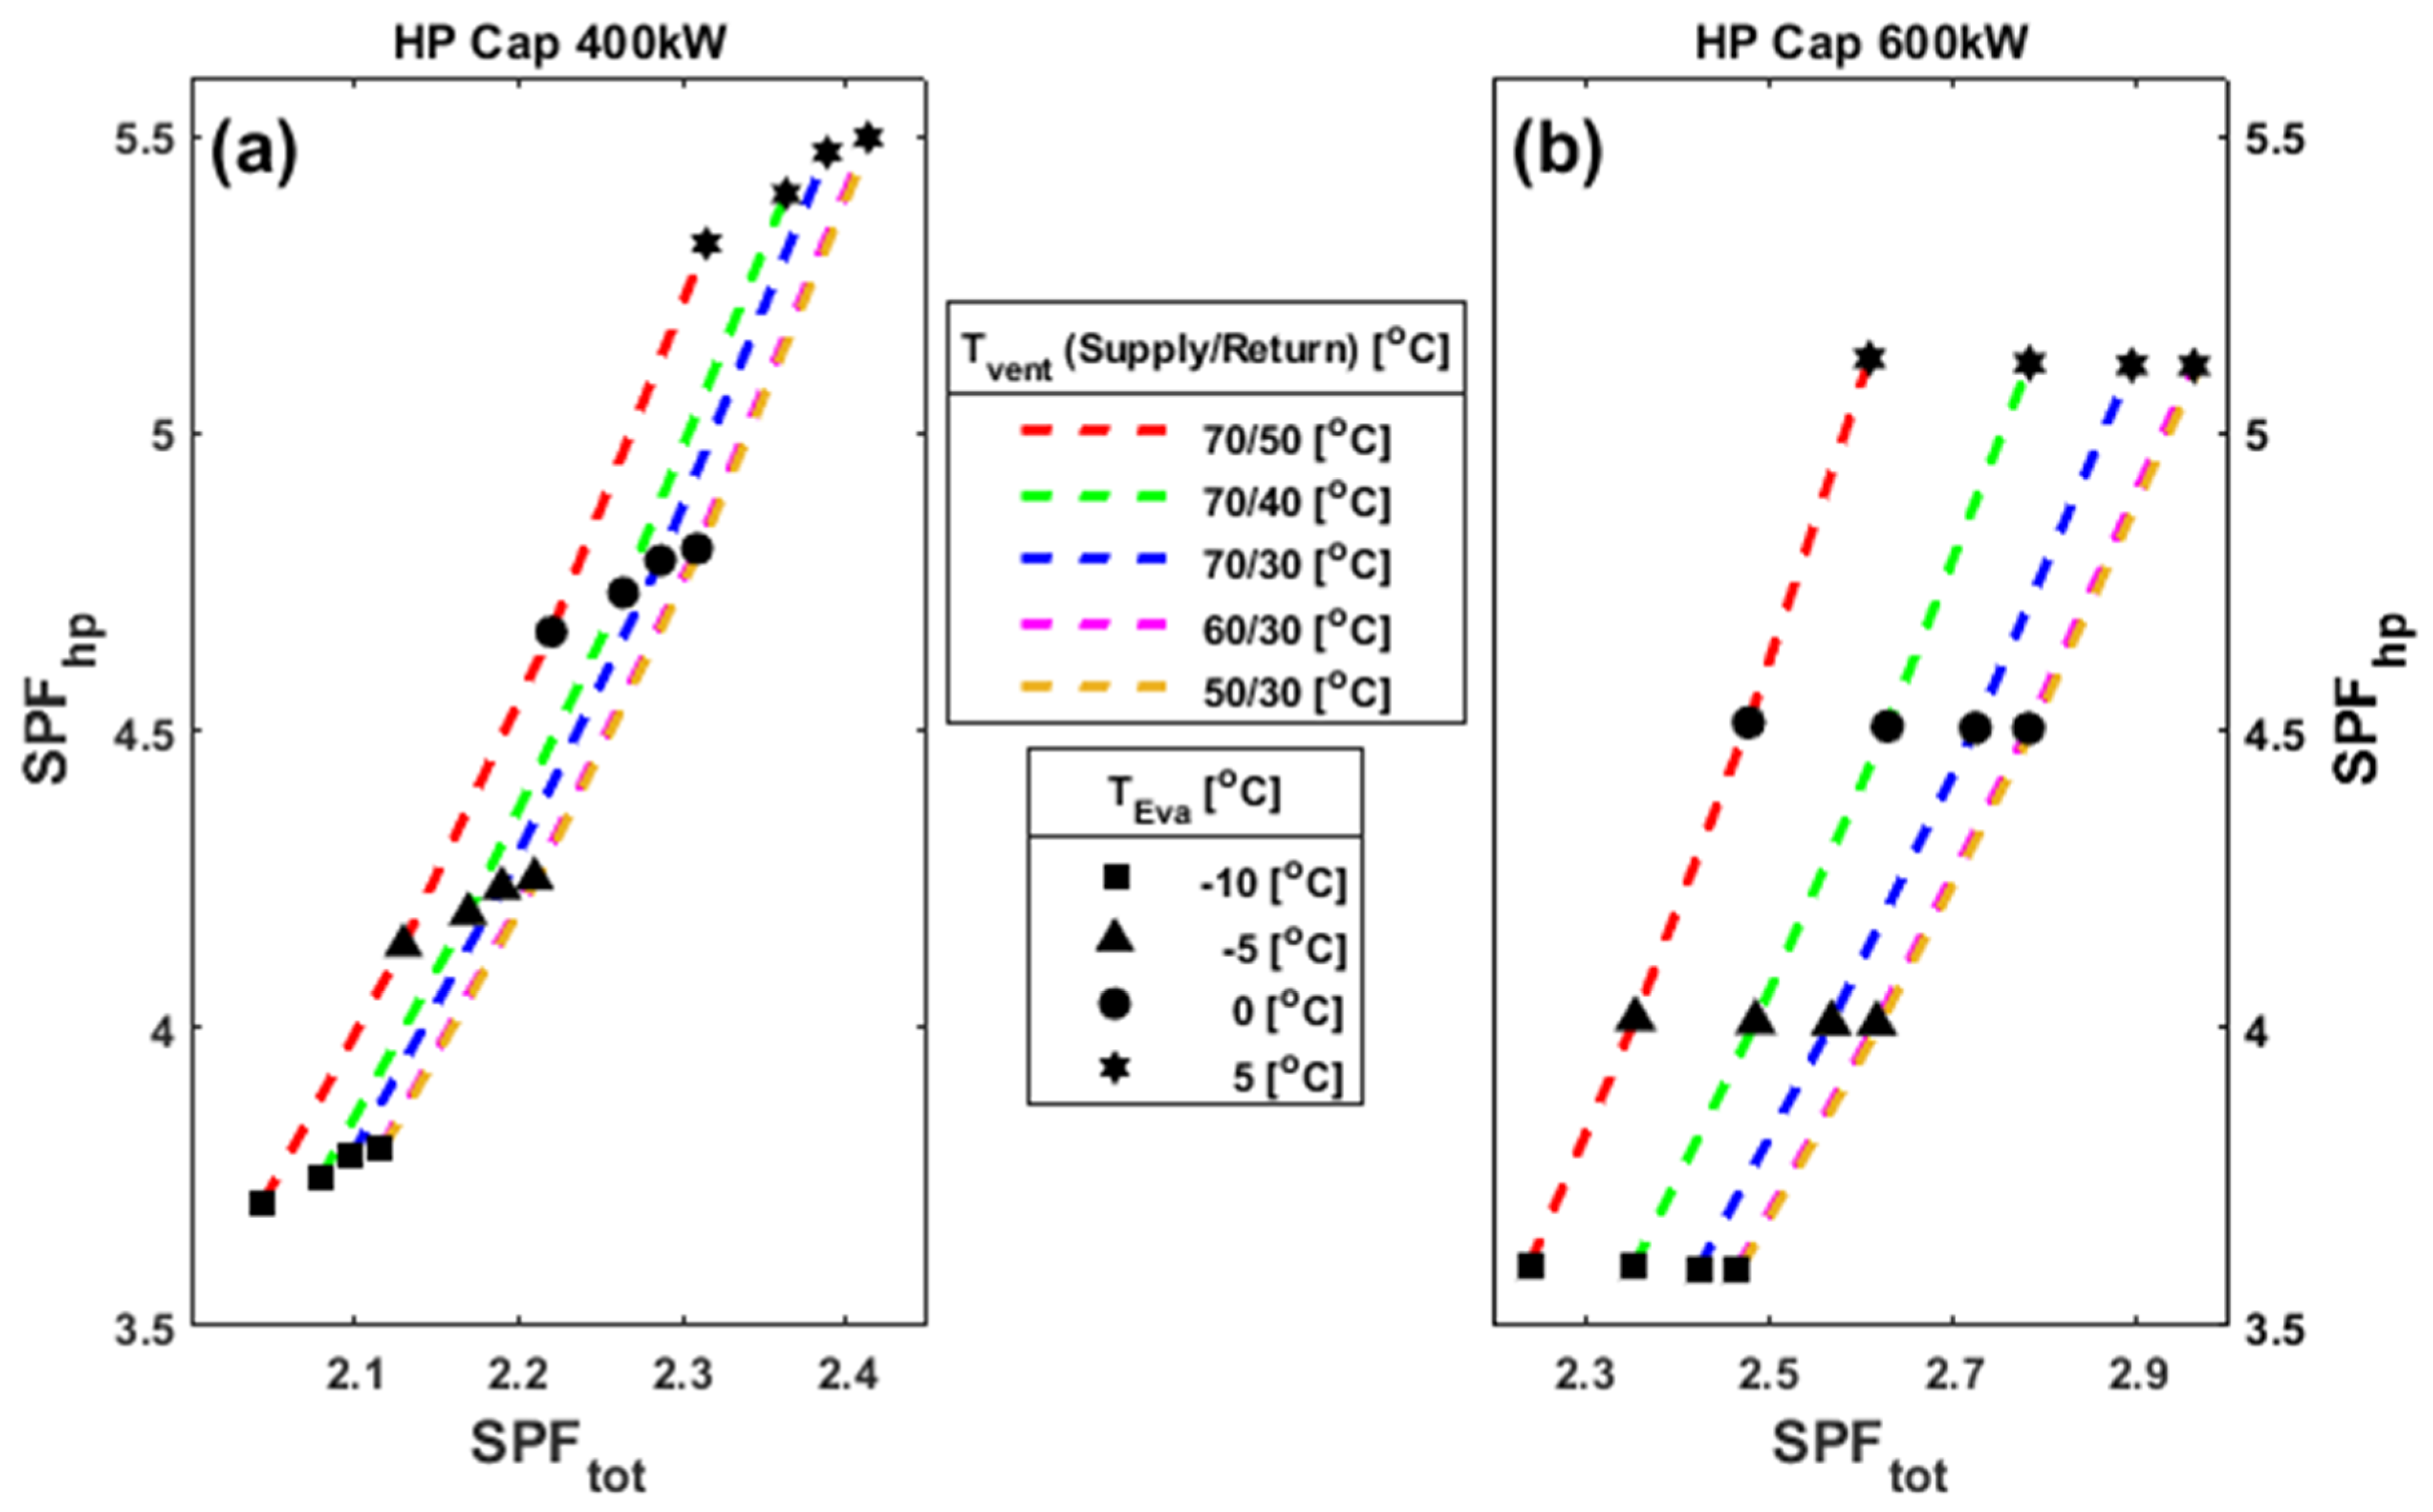
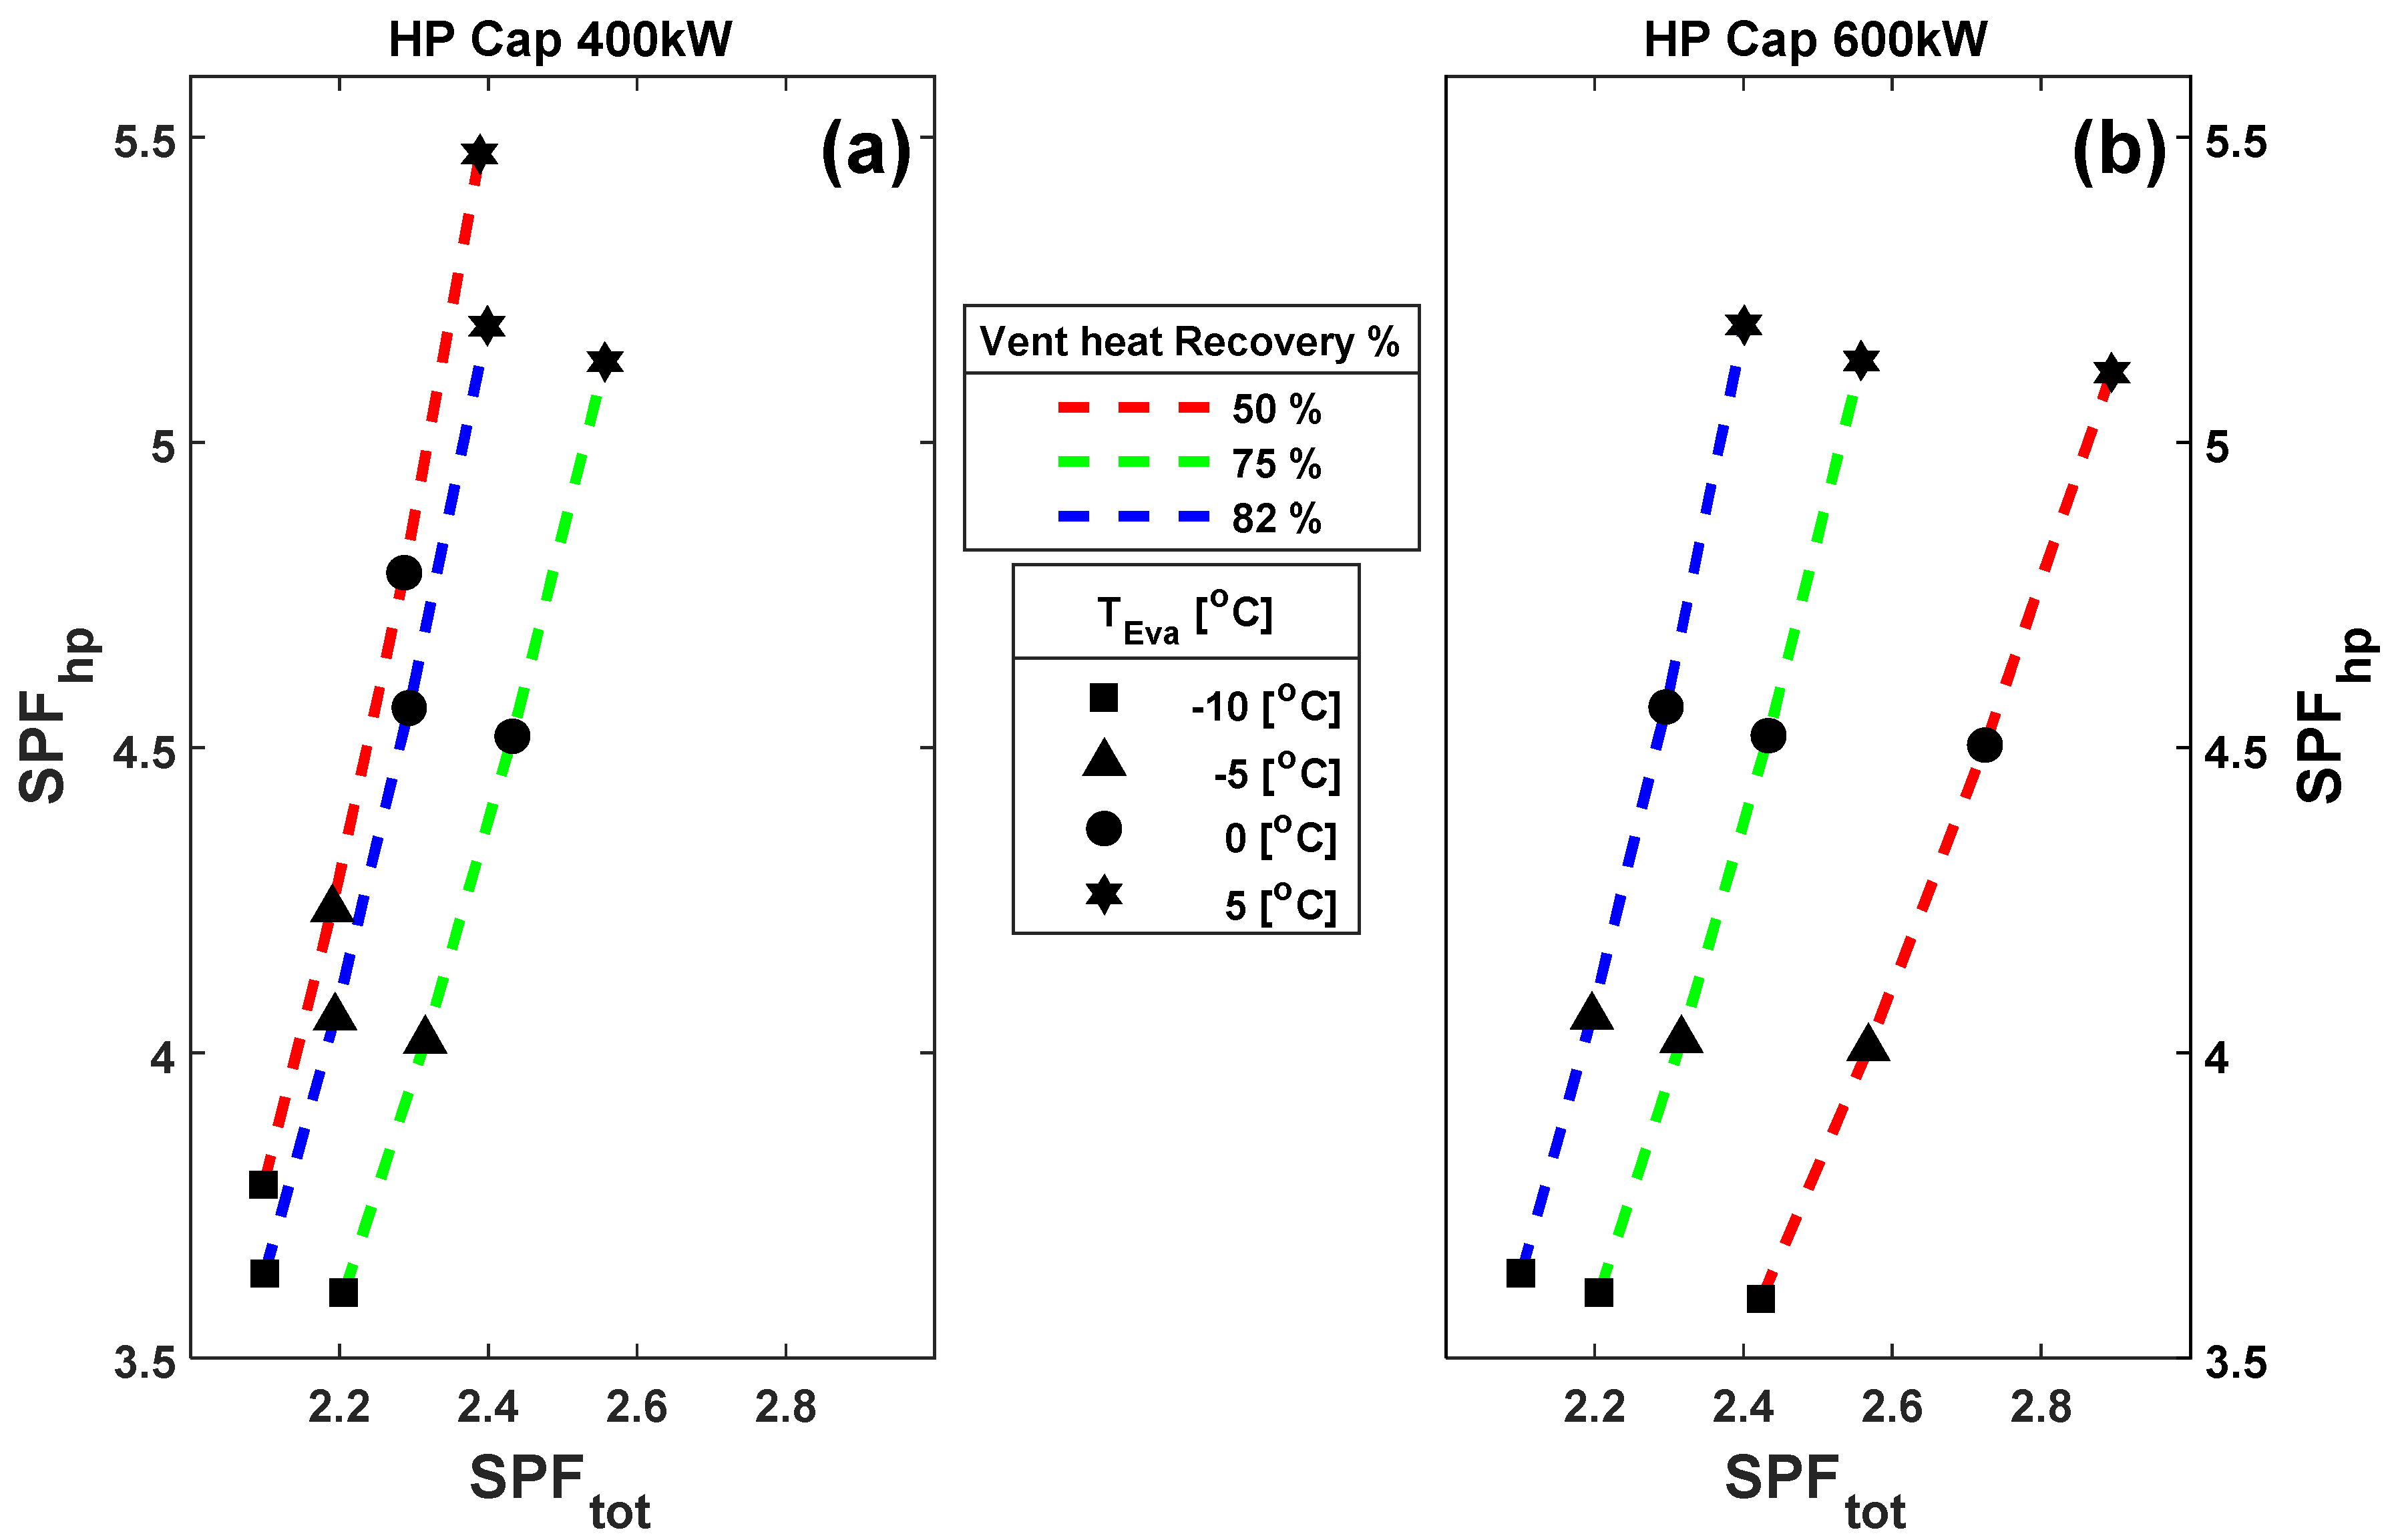
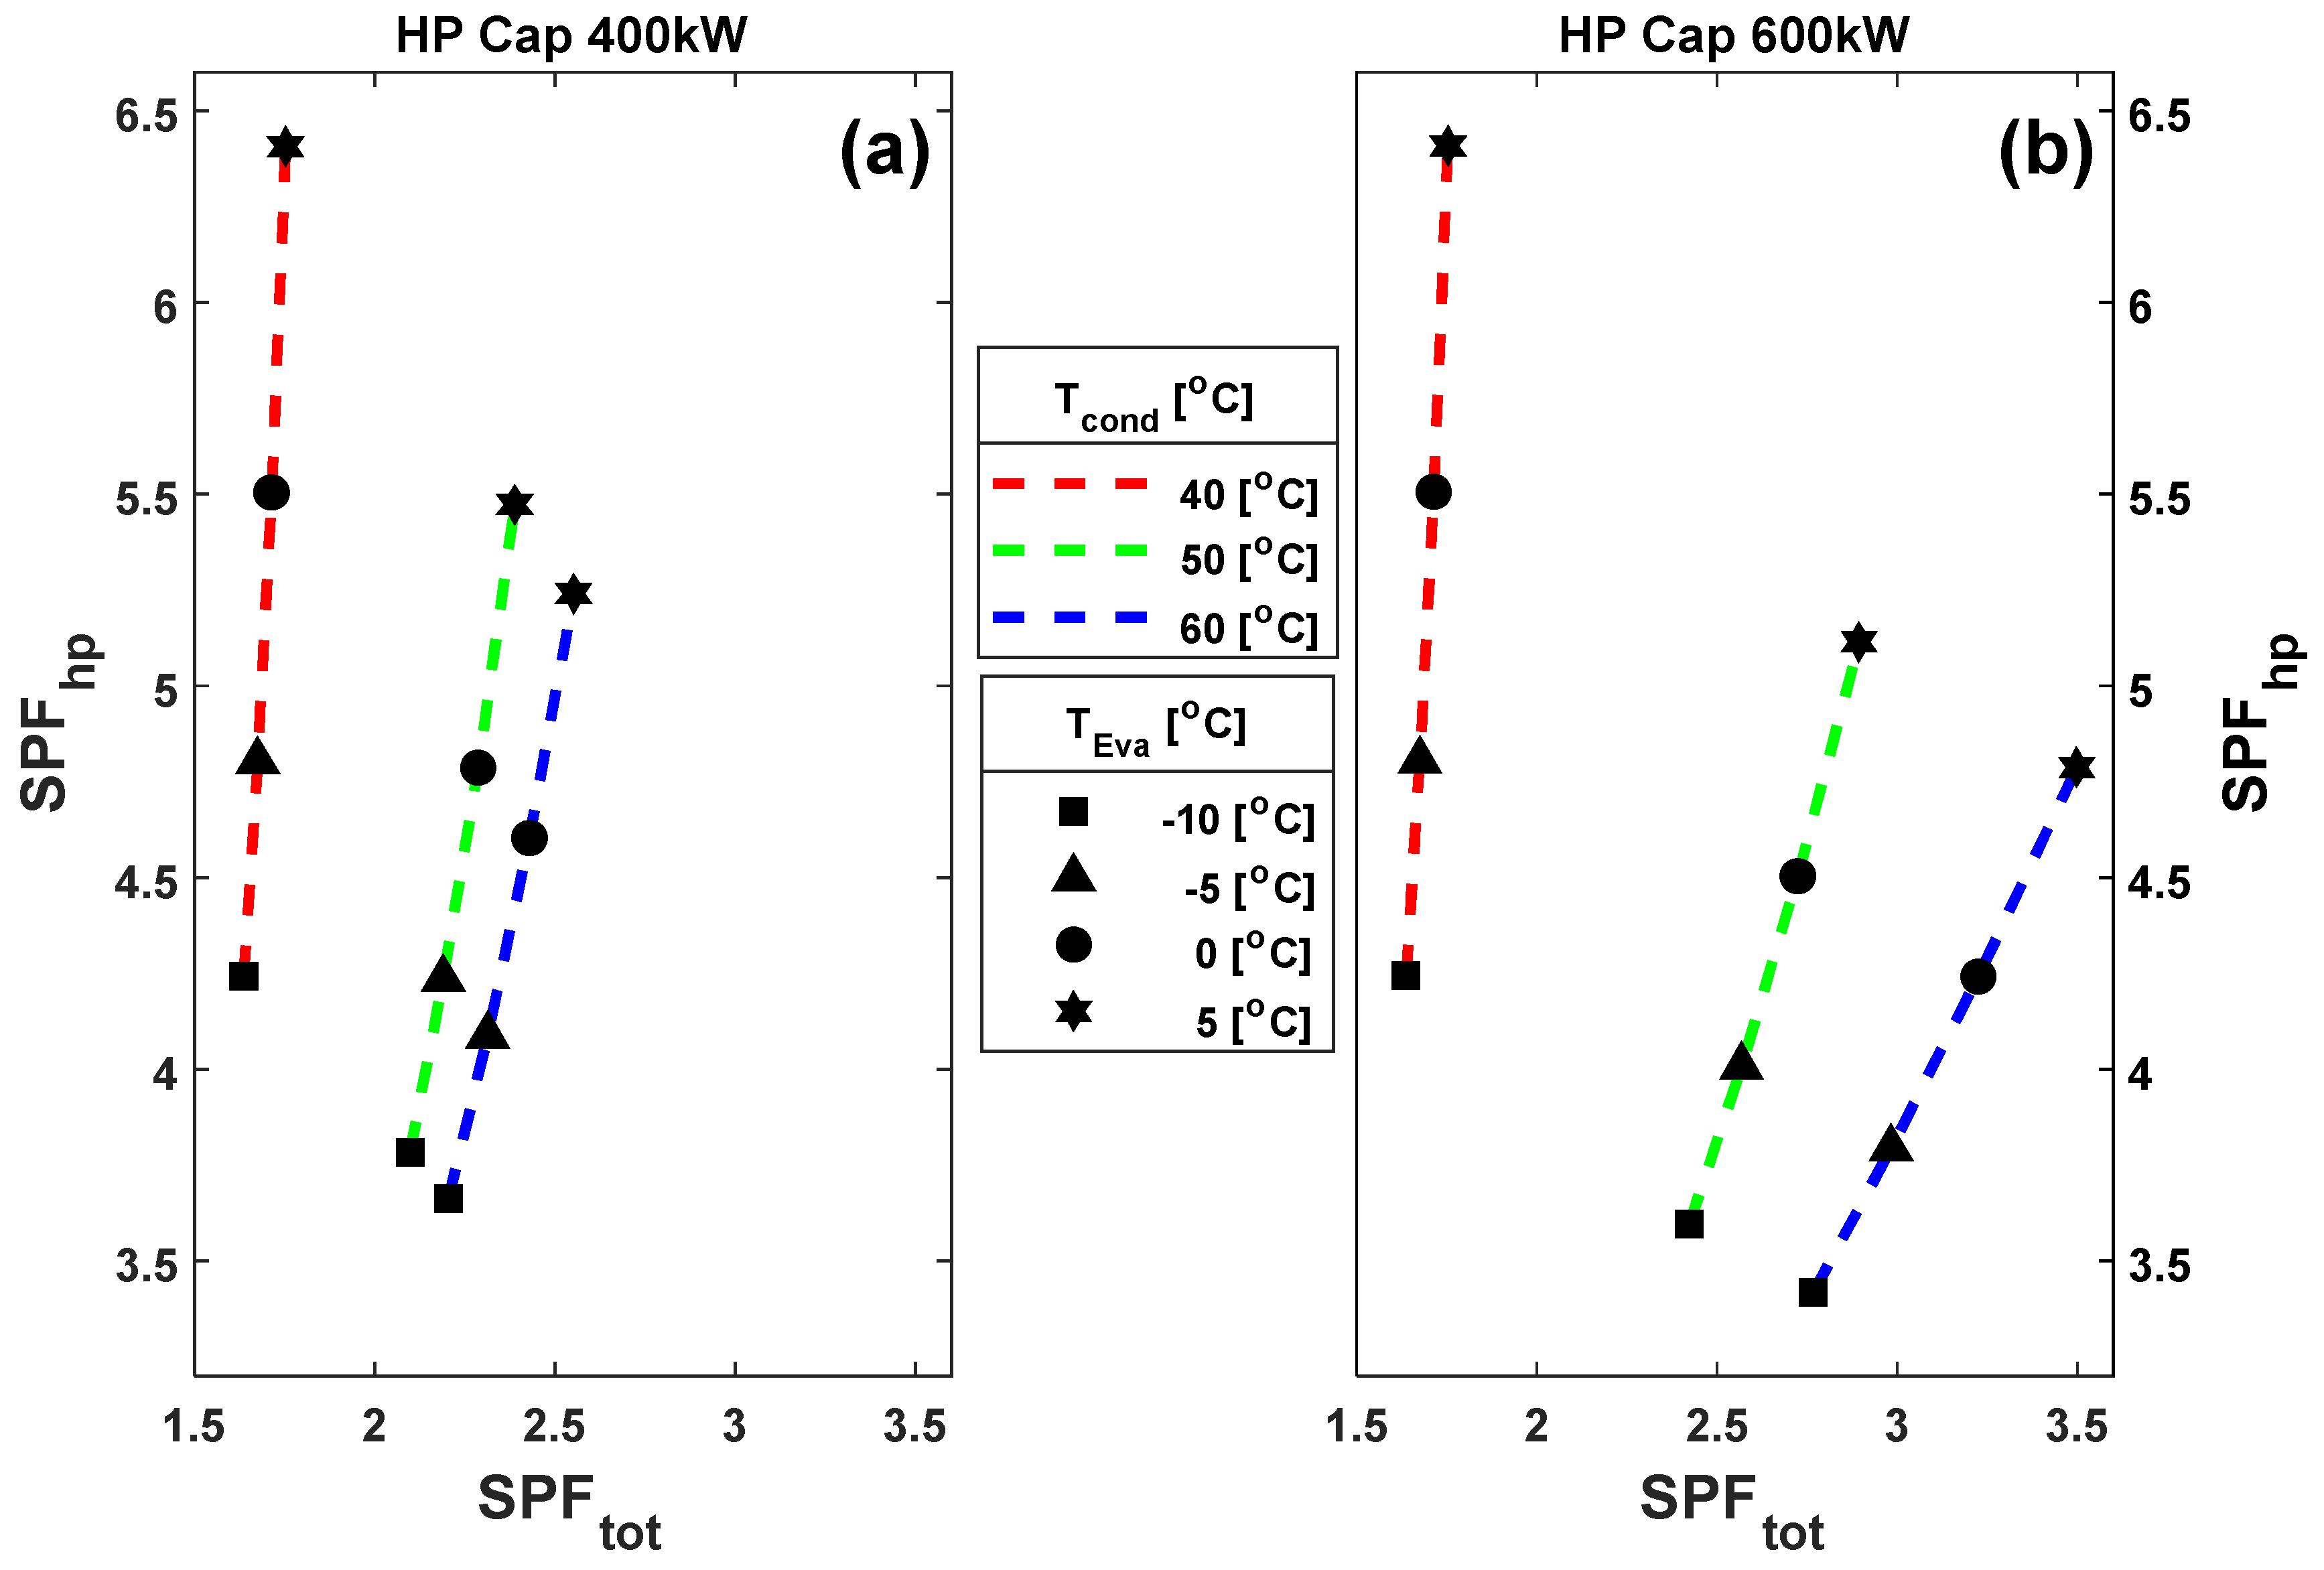
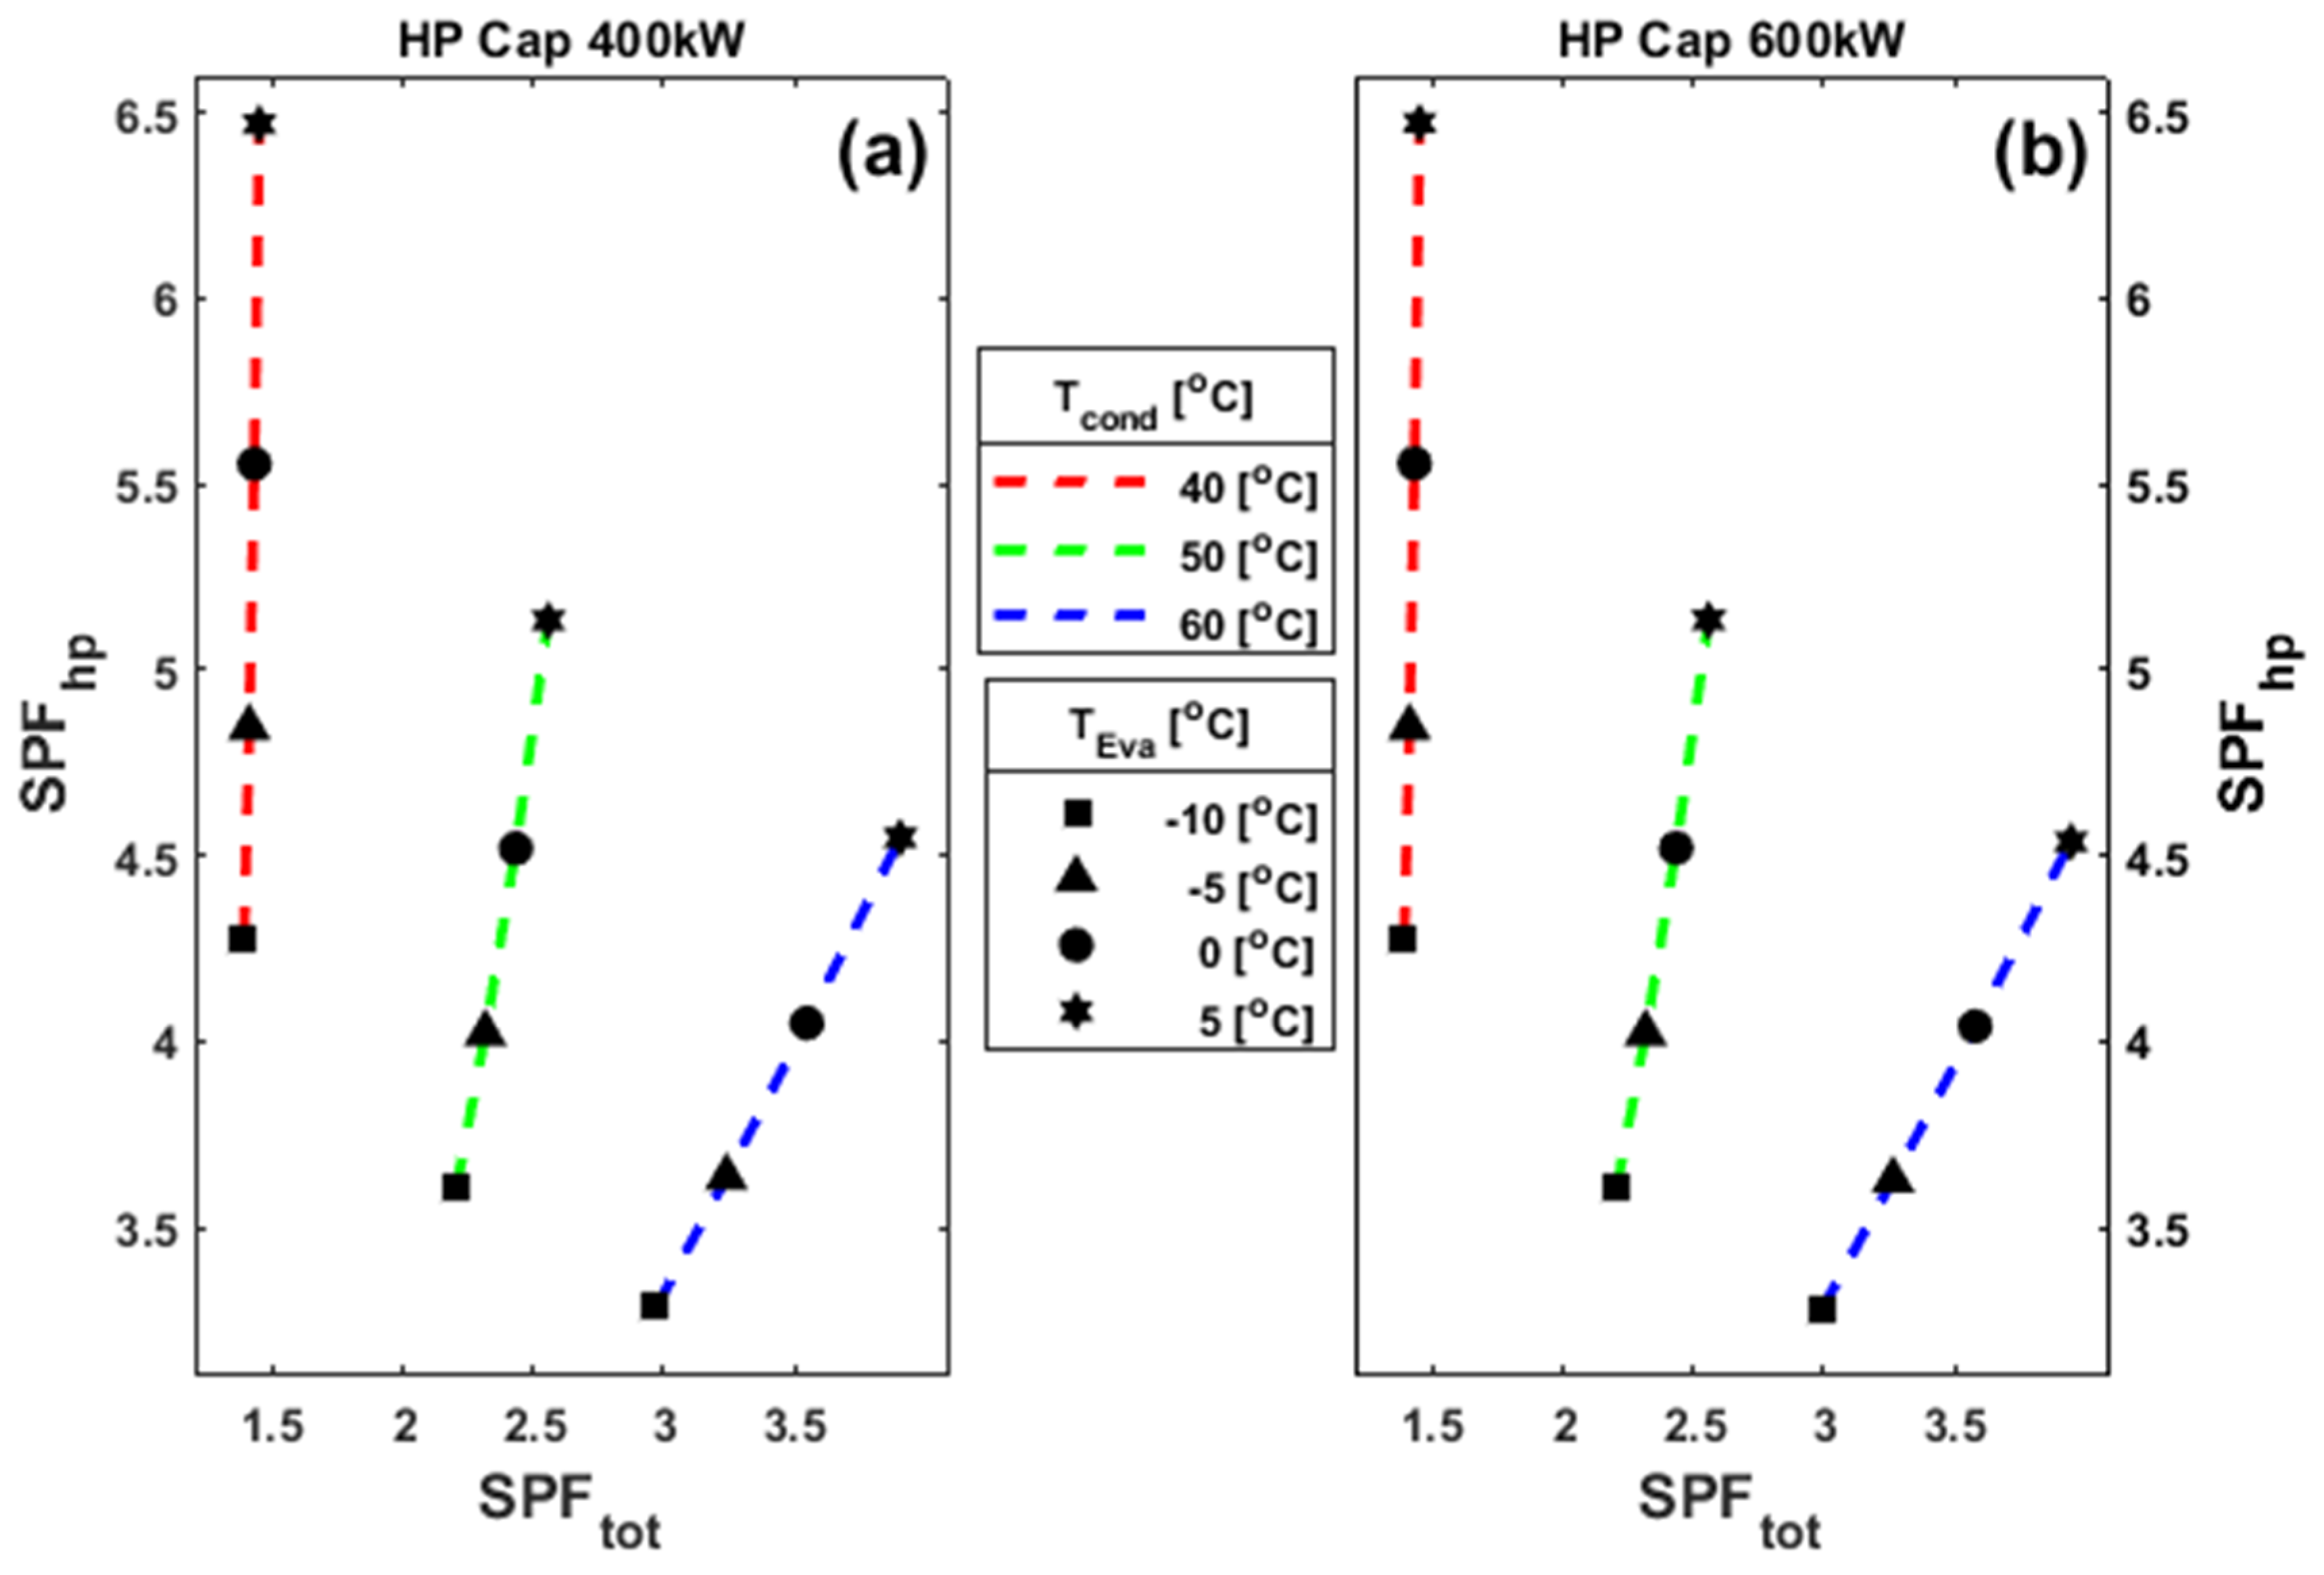
  • According to the parametric study outcomes, the evaporator and condenser temperatures are key parameters that highly affect the heat pump and the total system performance;
  • Because of a longer running time with full capacity, 400 kW is the best option from the heat pump performance viewpoint. However, the highest total seasonal performance factor is achieved by using a heat pump of 600 kW due to delivering more heat for charging the system;
  • The results further show that by varying ventilation ratio from 70/50 °C/°C to 70/30 °C/°C—that is, the reduction of return temperature—the values of heat pump and total seasonal performance factors will increase, indicating the importance of the proposed configuration;
  • What stands out from the results is that for the condensation temperature of 40 °C and the heat recovery of 50%, the increment of heat pump capacity does not change the heat pump and total system performance;
  • At heat recovery of 75% (or greater), choosing a heat pump with a smaller capacity is economically beneficial because the seasonal performance values are independent of heat pump capacity.

Author Contributions

Conceptualization, T.T.H. and S.S.; methodology, T.T.H., B.N.; software, T.T.H.; validation, B.N.; formal analysis, T.T.H., B.N., A.B., S.S.; investigation, T.T.H.; data curation, S.S.; writing—original draft preparation, T.T.H., B.N., A.B., S.S.; writing—review and editing, T.T.H., B.N., A.B., S.S.; visualization, B.N., S.S.; supervision, S.S.; project administration, T.T.H., B.N.; funding acquisition, T.T.H. All authors have read and agreed to the published version of the manuscript.

Funding

This research was partially funded by the Norwegian Research Council.

Institutional Review Board Statement

Not applicable.

Informed Consent Statement

Not applicable.

Conflicts of Interest

The authors declare no conflict of interest.

Nomenclature

Abbreviations
AHUAir handling unit
COPCoefficient of performance
GSHPGround source heat pump
MVHRMechanical ventilation with heat recovery
SPFSeasonal performance factor
TESThermal energy storage
Latin letters
m ˙ Mass flowrate, [kg s−1]
Q ˙ Thermal energy, [kW]
W ˙ Power, [kW]
h Enthalpy, [kJ kg−1]
C p Specific heat capacity, [kJ kg−1 K−1]
T Temperature, [°C] (or [K])
Greek letters
ρ Density, [kgm−3]
η Efficiency, [-]
Subscripts
ambInfiltration gains ( Q ˙ a m b )
capCapacity
condCondensor
equipmentsInternal convective gains ( Q ˙ e q u i p m e n t s )
evaEvaporator
hpHeat pump
inInput
lmLogarithmic mean temperature
outOutput
radRadiator
surfacesTransmission heat gains ( Q ˙ s u r f a c e s )
TTemperature
totTotal (system)
ventVentilation
zZone
zonesHeat transfer among zones ( Q ˙ z o n e s )

References

  1. IEA. Tracking Buildings 2021. Available online: https://www.iea.org/reports/tracking-buildings-2021 (accessed on 5 November 2021).
  2. Behzadi, A.; Arabkoohsar, A.; Yang, Y. Optimization and dynamic techno-economic analysis of a novel PVT-based smart building energy system. Appl. Therm. Eng. 2020, 181, 115926. [Google Scholar] [CrossRef]
  3. Sharma, S.; Agarwal, S.; Jain, A. Significance of Hydrogen as Economic and Environmentally Friendly Fuel. Energies 2021, 14, 7389. [Google Scholar] [CrossRef]
  4. Sadrizadeh, S.; Aganovic, A.; Bogdan, A.; Wang, C.; Afshari, A.; Hartmann, A.; Croitoru, C.; Khan, A.; Kriegel, M.; Lind, M.; et al. A systematic review of operating room ventilation. J. Build. Eng. 2021, 40, 102693. [Google Scholar] [CrossRef]
  5. Yuan, F.; Yao, R.; Sadrizadeh, S.; Li, B.; Cao, G.; Zhang, S.; Zhou, S.; Liu, H.; Bogdan, A.; Croitoru, C. Thermal comfort in hospital buildings–A literature review. J. Build. Eng. 2021, 45, 103463. [Google Scholar] [CrossRef]
  6. Lee, C.-G.; Cho, L.-H.; Kim, S.-J.; Park, S.-Y.; Kim, D.-H. Comparative Analysis of Combined Heating Systems Involving the Use of Renewable Energy for Greenhouse Heating. Energies 2021, 14, 6630. [Google Scholar] [CrossRef]
  7. Stamatakis, M.E.; Ioannides, M.G. State Transitions Logical Design for Hybrid Energy Generation with Renewable Energy Sources in LNG Ship. Energies 2021, 14, 7803. [Google Scholar] [CrossRef]
  8. Cao, X.; Dai, X.; Liu, J. Building energy-consumption status worldwide and the state-of-the-art technologies for zero-energy buildings during the past decade. Energy Build. 2016, 128, 198–213. [Google Scholar] [CrossRef]
  9. Solarin, S.A.; Gil-Alana, L.A.; Lafuente, C. Persistence and non-stationarity in the built-up land footprint across 89 countries. Ecol. Indic. 2021, 123, 107372. [Google Scholar] [CrossRef]
  10. Corradi, E.; Rossi, M.; Mugnini, A.; Nadeem, A.; Comodi, G.; Arteconi, A.; Salvi, D. Energy, Environmental, and Economic Analyses of a District Heating (DH) Network from Both Thermal Plant and End-Users’ Prospective: An Italian Case Study. Energies 2021, 14, 7783. [Google Scholar] [CrossRef]
  11. Spitler, J.D.; Javed, S.; Ramstad, R.K. Natural convection in groundwater-filled boreholes used as ground heat exchangers. Appl. Energy 2016, 164, 352–365. [Google Scholar] [CrossRef]
  12. Maddah, S.; Goodarzi, M.; Safaei, M.R. Comparative study of the performance of air and geothermal sources of heat pumps cycle operating with various refrigerants and vapor injection. Alexandria Eng. J. 2020, 59, 4037–4047. [Google Scholar] [CrossRef]
  13. Chang, Y.; Gu, Y.; Zhang, L.; Wu, C.; Liang, L. Energy and environmental implications of using geothermal heat pumps in buildings: An example from north China. J. Clean. Prod. 2017, 167, 484–492. [Google Scholar] [CrossRef]
  14. Fadejev, J.; Simson, R.; Kurnitski, J.; Kesti, J.; Mononen, T.; Lautso, P. Geothermal Heat Pump Plant Performance in a Nearly Zero-energy Building. Energy Procedia 2016, 96, 489–502. [Google Scholar] [CrossRef]
  15. Fadejev, J.; Kurnitski, J. Geothermal energy piles and boreholes design with heat pump in a whole building simulation software. Energy Build. 2015, 106, 23–34. [Google Scholar] [CrossRef]
  16. Hepbasli, A.; Tolga Balta, M. A study on modeling and performance assessment of a heat pump system for utilizing low temperature geothermal resources in buildings. Build. Environ. 2007, 42, 3747–3756. [Google Scholar] [CrossRef]
  17. Massarotti, N.; Mauro, A.; Normino, G.; Vanoli, L.; Verde, C.; Allocca, V.; Calcaterra, D.; Coda, S.; de Vita, P.; Forzano, C.; et al. Innovative solutions to use ground-coupled heat pumps in historical buildings: A test case in the city of Napoli, Southern Italy. Energies 2020, 14, 296. [Google Scholar] [CrossRef]
  18. Villarino, J.I.; Villarino, A.; de Arteaga, I.; Quinteros, R.; Alañón, A. A comparative energy and economic analysis between a low enthalpy geothermal design and gas, diesel and biomass technologies for a HVAC system installed in an office building. Energies 2019, 12, 870. [Google Scholar] [CrossRef] [Green Version]
  19. Blázquez, C.S.; Borge-Diez, D.; Nieto, I.M.; Martín, A.F.; González-Aguilera, D. Multi-parametric evaluation of electrical, biogas and natural gas geothermal source heat pumps. Renew. Energy 2021, 163, 1682–1691. [Google Scholar] [CrossRef]
  20. Liang, L.; Wang, X.; Zhang, X.; Sun, H. Multi-Building Systems Thermal and Energy Management via Geothermal Heat Pump. IFAC PapersOnLine 2020, 53, 17125–17131. [Google Scholar] [CrossRef]
  21. Farzanehkhameneh, P.; Soltani, M.; Moradi Kashkooli, F.; Ziabasharhagh, M. Optimization and energy-economic assessment of a geothermal heat pump system. Renew. Sustain. Energy Rev. 2020, 133, 110282. [Google Scholar] [CrossRef]
  22. Sun, F.; Hao, B.; Fu, L.; Wu, H.; Xie, Y.; Wu, H. New medium-low temperature hydrothermal geothermal district heating system based on distributed electric compression heat pumps and a centralized absorption heat transformer. Energy 2021, 232, 120974. [Google Scholar] [CrossRef]
  23. Bottarelli, M.; Gallero, F.J.G. Energy analysis of a dual-source heat pump coupled with phase change materials. Energies 2020, 13, 2933. [Google Scholar] [CrossRef]
  24. Shin, J.S.; Park, J.W.; Kim, S.H. Measurement and Verification of Integrated Ground Source Heat Pumps on a Shared Ground Loop. Energies 2020, 13, 1752. [Google Scholar] [CrossRef] [Green Version]
  25. Klein, A.S. TRNSYS: A Transient System Simulation Program; Engineering Experiment Station Report; University Wisconsin-Madison: Madison, WI, USA, 1988; pp. 12–38. [Google Scholar]
  26. Shin, J.S.; Kim, S.H.; Park, J.W. Economic analysis of integrated ground source heat pumps on a shared ground loop. Energies 2020, 13, 2928. [Google Scholar] [CrossRef]
  27. Lee, D.C.; Lee, M.; Cho, W.; Kim, Y. Performance improvement of heat pumps by optimizing refrigerant charge using novel variable liquid-line length system. Appl. Therm. Eng. 2021, 196, 117287. [Google Scholar] [CrossRef]
  28. Trüschel, A. Hydronic Heating Systems—The Effect of Design on System Sensitivity. Ph.D. Thesis, Chalmers University of Technology, Gothenburg, Sweden, January 2002. [Google Scholar]
  29. Behrouz, N.; Wang, Q.; Ploskić, A. Maximizing thermal performance of building ventilation using geothermal and wastewater heat. Resour. Conserv. Recycl. 2019, 143, 90–98. [Google Scholar]
  30. Fakhari, I.; Behzadi, A.; Gholamian, E.; Ahmadi, P.; Arabkoohsar, A. Comparative double and integer optimization of low-grade heat recovery from PEM fuel cells employing an organic Rankine cycle with zeotropic mixtures. Energy Convers. Manag. 2021, 228, 113695. [Google Scholar] [CrossRef]
  31. Dincer, I.; Rosen, M.A.; Ahmadi, P. Optimization of Energy Systems; John Wiley & Sons: Hoboken, NJ, USA, 2017. [Google Scholar]
Figure 1. Schematic view of the hydronic heating system installed in the studied hospital including a ground-source heat pump, auxiliary heater, radiators, and ventilation coils.
Energies 14 08475 g001
Figure 2. Schematic view of the Norwegian, Swedish, and variable flow hydronic connections used in the studied hydronic system, including measurement and regulator valves and a circulation pump.
Energies 14 08475 g002
Figure 3. Comparison between measurements and simulations for hydronic temperature flow.
Energies 14 08475 g003
Figure 4. The influence of the evaporator temperature, ventilation temperature ratio, and the heat pump capacity: (a) 400 kW; (b) 600 kW on the heat pump and total SPF values.
Energies 14 08475 g004
Figure 5. The influence of the evaporator temperature, ventilation heat recovery percentage, and the heat pump capacity: (a) 400 kW; (b) 600 kW on the heat pump and total SPF values for the ventilation temperature ratio of 70/30 °C/°C.
Energies 14 08475 g005
Figure 6. The influence of the evaporator temperature, condenser temperature, and the heat pump capacity: (a) 400 kW; (b) 600 kW on the heat pump and total SPF values for the ventilation temperature ratio of 70/30 °C/°C, and the heat recovery of 50%.
Energies 14 08475 g006
Figure 7. The influence of the evaporator temperature, condenser temperature, and the heat pump capacity: (a) 400 kW; (b) 600 kW on the heat pump and total SPF values for the ventilation temperature ratio of 70/30 °C/°C and the heat recovery of 75%.
Energies 14 08475 g007
Table 1. Main inputs used for the entire simulation model.
DescriptionValueUnit
Maximum delivered heat by radiators614kW
Heat pump maximum delivery400–600kW
Heat pump condensing temperature50 (40–60)°C
Heat pump evaporating temperature−10–+5°C
Auxiliary heater maximum delivery800kW
Maximum design supply/return temperature70/50–70/30°C
Design outdoor temperature−20°C
Maximum ventilation rate194,000m³h−1
Ventilation heat recovery50–82%
Table 2. Variation of performance indicators with ventilation heat recovery percentage and heat pump capacity.
System ConfigurationSPFhpSPFtotTotal Delivered Energy (MWh)Building Heating Demand (MWh)
Heat Pump Capacity (kW)Ventilation Heat Recovery %
40050%4236219011822589
75%402023155391248
82%40582194436957
60050%4008256810092590
75%402123165391248
82%40592196436957
Publisher’s Note: MDPI stays neutral with regard to jurisdictional claims in published maps and institutional affiliations.

