Abstract
There are various traffic calming measures that can be installed in village transition zones. So far, focus was placed on diversified use of pavement markings, amounts of horizontal deflection, shape of the installed chicanes or central islands, presence of gateway, etc., and their location along the transition zone. However, the combined effect of the different transition zone factors on speed reductions has been rarely studied so far. Authors put forward a hypothesis of there being some determinants, which in combination influence speed reduction. To corroborate the hypothesis on the combined impact of the transition zone features on speed reduction in the village transition zones and to validate the established relationships the authors conducted verification study in transition zones containing chicanes or central islands. To verify this hypothesis the authors studied twenty transition zones and managed to confirm the hypothesis at 95% confidence level. The authors used previously adopted binary methods, verified the previously defined factors and added a few new determinants. The contribution of this study is a further investigation of the synergy effect of various relevant factors and the findings can assist in planning new transition zones or suggest additional measures to achieve the desired speed reduction in existing transition zones.
1. Introduction
Fast development of the automotive industry results in increased speeds of road traffic. Taking this into consideration, in 1990s design guidelines regarding the design of traffic calming measures were developed [1,2,3]. In the past, through roads usually crossed villages running through the main street on the way. After a few years, it was observed that speed limit zoning and proper traffic management were necessary on the through road sections within built-up areas [4,5] to inform drivers that the road environment had changed and that they were entering a built-up area and should adjust driving speed accordingly. Thus, the transition zone is a transitional section of the road between consecutive open and built-up areas, and it is important to obtain reduction of the speed of traffic along its length and, moreover, maintain this speed reducing effect on the way across the village [4].
To address the issues related to traffic calming in villages, it is necessary to analyse the evolution of the research related to this problem. Special methodology was applied to prepare the review of literature. The first mention of the need for traffic calming was made in the 1990s. At that time, design guidelines were mainly based on experimental studies carried out in several countries on specially adapted “artificial” test sites. The review of existing studies is based mainly on design guidelines, peer-reviewed scientific papers and reports of experimental studies published between 1990 and 2021 (Figure 1). The analysis has shown that the design guidelines were mainly developed in the last years of the 20th century and the first decade of the 21st century. In contrast, peer-reviewed scientific articles on traffic calming, as well as on traffic calming measures and their effective-ness in reducing speed and increasing traffic safety, were successively published between 2000 and 2020, with their greatest culmination in the period of 2010–2015. After 2020, few researchers have dealt with this issue.
Figure 1.
Progress of studies related to this issue.
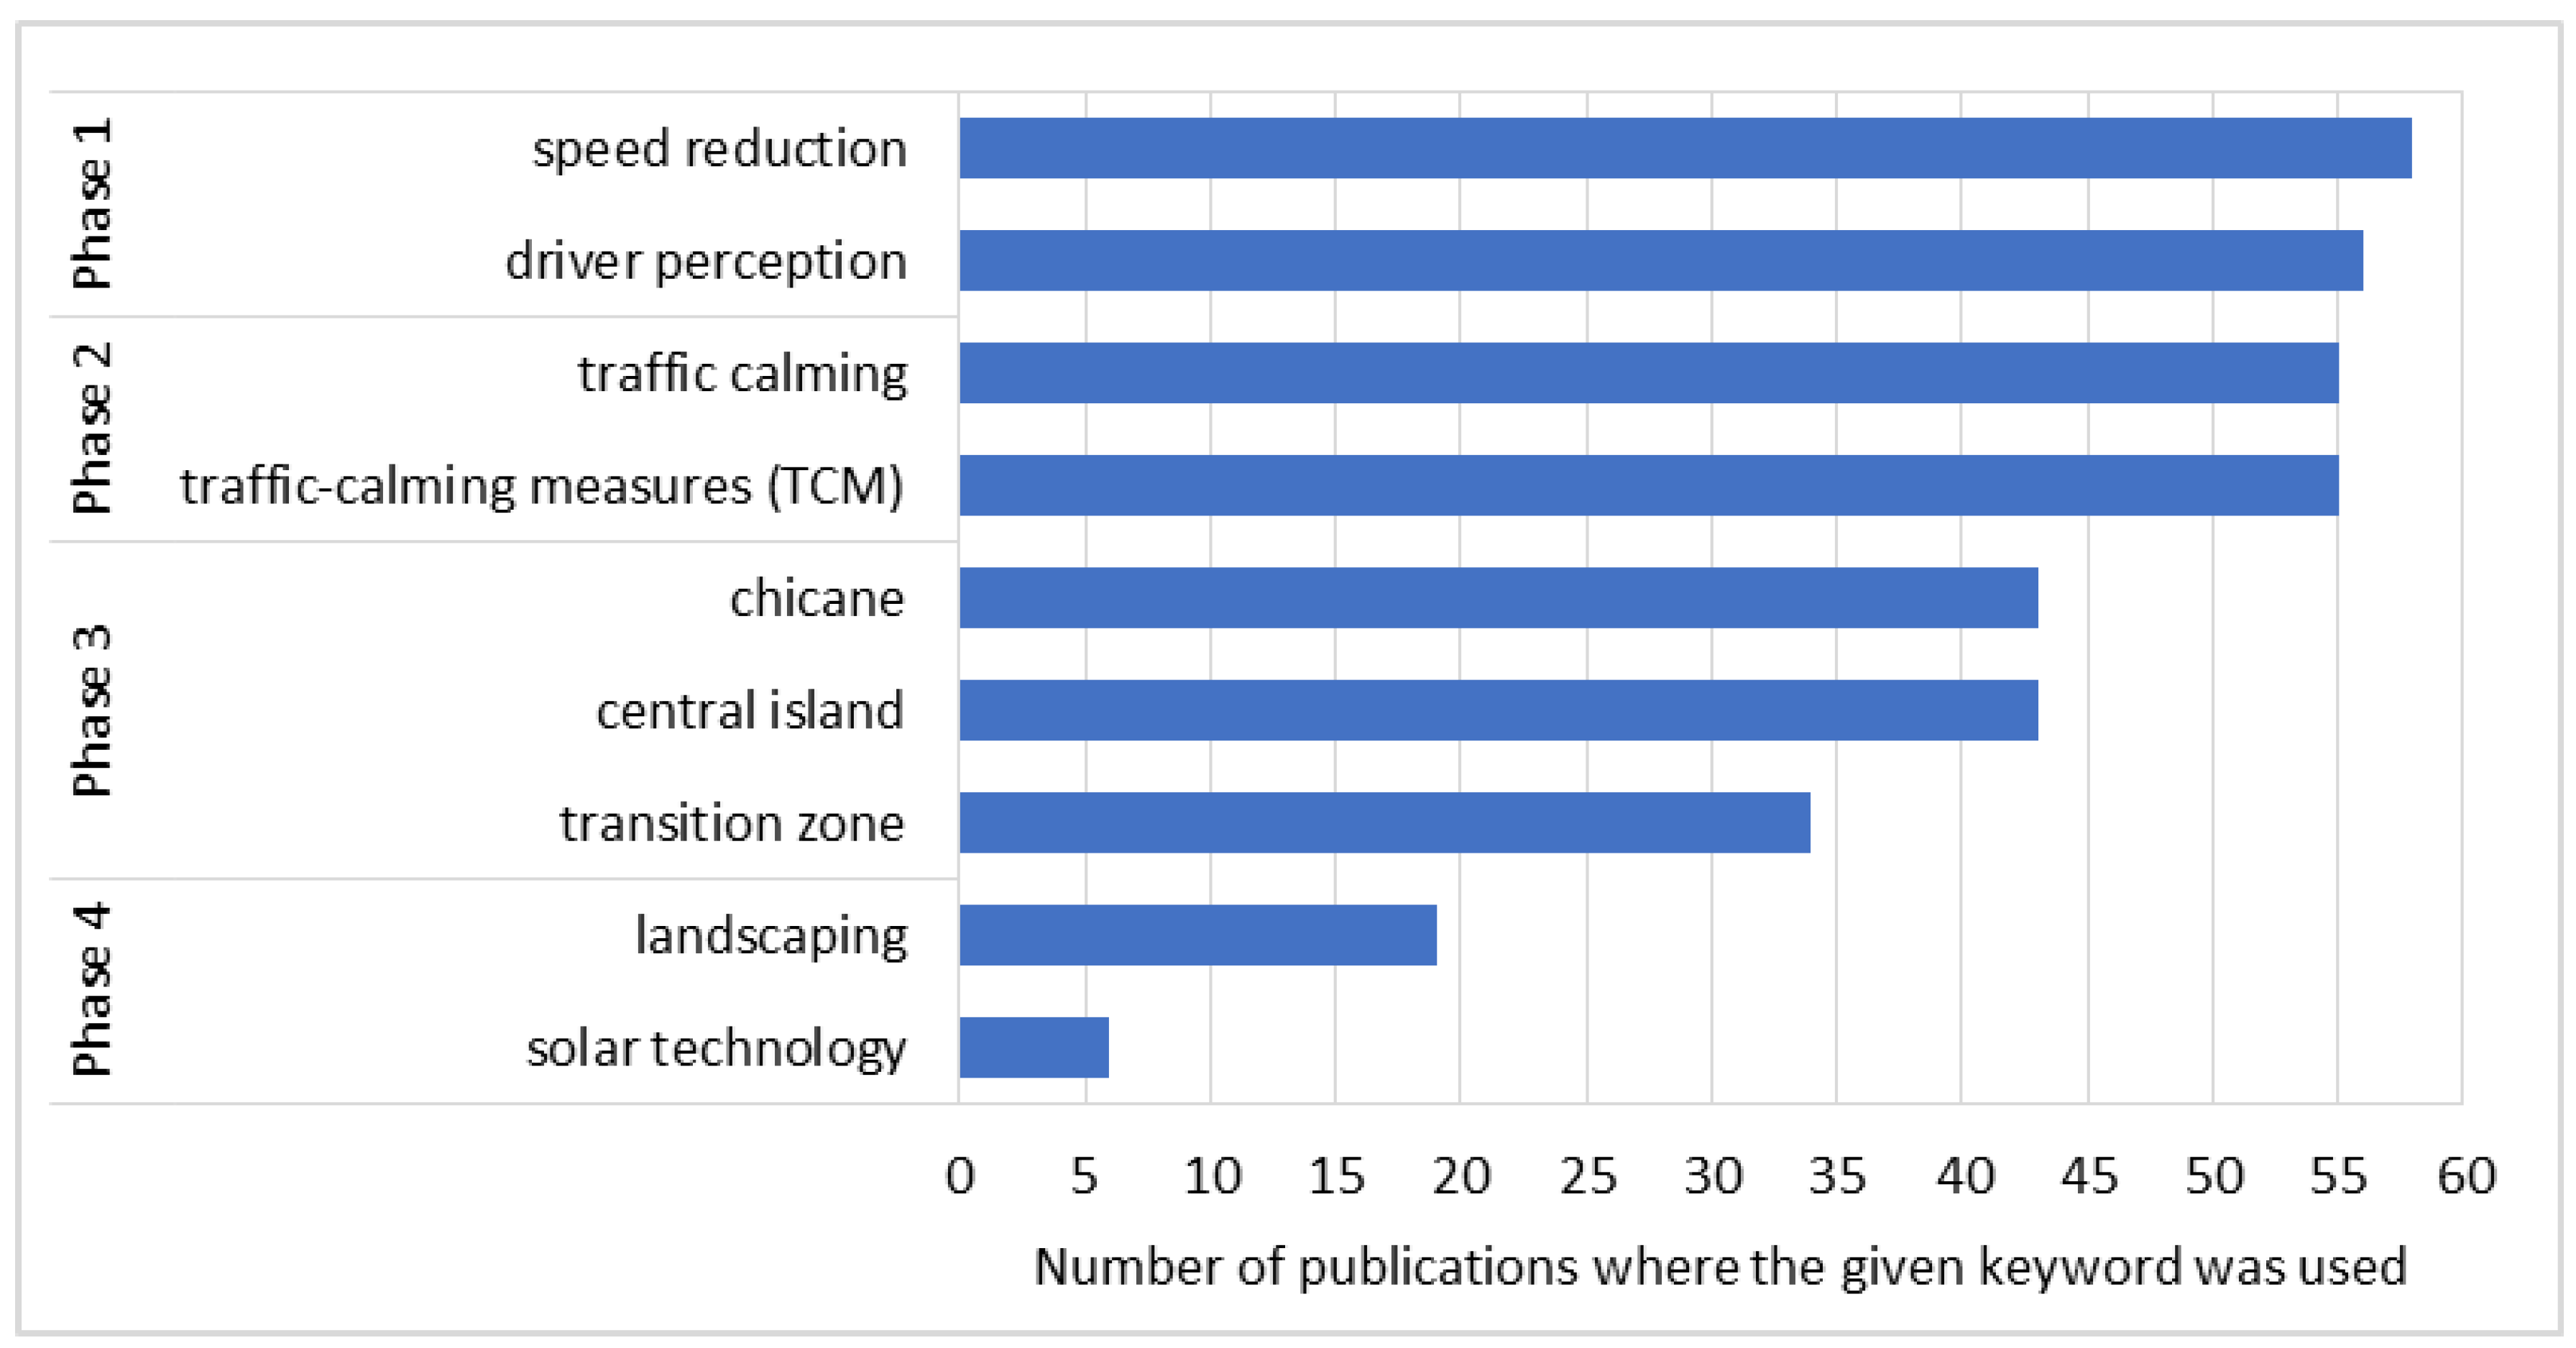
Before the structural review of the literature, the authors searched the Scopus, Science Direct, Google Scholar and Google database in several phases of variously selected key-words, related to the analysed issue (Figure 2). Over a thousand publications have been found, mostly related to traffic calming. Therefore, a selection of keywords was necessary. After several combinations of keywords, a dozen or so design guidelines were finally selected, in which the principles for the design of horizontal and vertical traffic calming measures (TCM) were formulated. Several dozen peer-reviewed scientific articles and over a dozen reports from experimental studies have also been included. An overview of the final selection of literature based on different search phases and keywords is presented in Figure 2.
Figure 2.
Number of found studies for particular keywords.
The main objective of traffic calming schemes implemented on through road sections crossing villages was to improve safety. This transpired for instance from studies [2,6,7] which demonstrated a possible direct relationship between road safety and reduced speed of traffic. The first traffic safety analyses on through roads crossing rural areas were conducted in the 1990s in Denmark [8], in the UK [1,9,10,11] and, later on, also in Canada [12], in Germany [13], in Sweden [14] and in the US [15,16,17]. Consequently, speed zoning and traffic calming schemes were recommended in many countries for through roads of lesser importance. An analysis of the traffic data from various countries compiled in Table 1 demonstrated that after implementation of traffic calming measures and various speed management strategies road crash rates were reduced on average by ca. 40–50% and 20% in rural areas and in village transition zones respectively.
Table 1.
Compilation of the reductions in road crash rates on road sections through villages due to the use of traffic calming measures and various speed management strategies.
As mentioned before, traffic calming is relative to road traffic safety, which is directly associated with speed reduction. The obtained speed reduction in transition zones is further associated with reduction of noise, fuel consumption and air pollution, in the village transition zone and more importantly in the central zone (i.e., in the built-up area itself). In practice, traffic calming problems refer mainly to built-up areas. That said, part of the studies on the subject covered also the transition zones. In line with the research conclusions given in [4] there is still a wide array of problems referring to transition zones that need further investigation. Each location of a transition zone requires a specific approach to the aspects of landscape engineering, as they can be surrounded by a forest, open agricultural land, or land partially planted with greenery. Moreover, according to the conclusions presented in the guidelines [5,25], the easiest and the most economic traffic calming method was to implement proper traffic management measures (i.e., road signs informing drivers about the requirement to reduce speed) and various road markings. However according to [5,25] these measures turned out to be insufficiently effective. Thus, there arose a need for additional traffic calming measures. Table 2 shows the characteristics of the results of studies carried out in different countries with the use of various traffic calming schemes, involving mainly horizontal deflection.
Table 2.
Considered parameters, area locations and results of previous research (supplemented based on [26,27]).
The review of the research status presented in Table 1 shows that various experimental studies on the reduction of speed of inbound traffic in transition zones have been conducted, but final conclusions regarding how to effectively obtain the expected inbound speed are yet to be made. It turned out that traffic management measures, such as a series of warning signs and road surface markings, though most relevant and easiest to apply, are insufficient when used alone [4,5,37]. Speed reduction is only one of the expected changes, and advising the drivers of an incoming change to the road environment and entering into a built-up area is a more important problem. This can be achieved through gradual application of various road geometry and traffic calming elements [38], in association with roadside landscape improvements [22], in order to make drivers slow down and keep the reduction on the way across the village. However, these changes should be implemented gradually and should provide clear information to drivers by means of conspicuous elements [26,27,38,39]. Spot traffic calming elements are effective for a short length only and the amount of speed reduction is hardly satisfactory, which has been confirmed by the results of studies presented in [29,33,35,39].
Still, one should remember that each transition zone is different and surrounded by different landscape elements, and that is why proposed design options should take into consideration these different aspects. The significance of considering the effect of the existing complexity of landscaped road scenes on speed reduction and on the driver’s perception was confirmed presented in [22,40]. However, the findings of [22,38,41] confirmed that the most effective speed reduction schemes involve the use of variable geometry of the inbound lane characterised by appropriate amount of horizontal deflection, forcing drivers to change the driving path, slowing down as a result, that is installation of wide central islands or wide chicanes deflecting the inbound lane only. Furthermore, [25] found out that the path angle created by traffic deflection, especially in the case of central island, smaller than 3 degrees had no effect on speed reduction. This was confirmed also by [20], who additionally observed that actually the height of the kerb installed on the perimeter of the central island or chicane deflecting one lane had a greater impact on speed reduction than a small horizontal deflection.
Central islands or chicanes shifting the lane laterally installed on the carriageway result in the car changing its path in horizontal plane and therefore the driver must be warned of this change and get prepared for the manoeuvre [1,2,10,22,29,33]. Additionally, chicanes can differ in shape [19], size [10] and the applied soft landscaping [4,13,29]. An analysis of the installed chicanes and results of research on their impact on speed reduction presented in Table 2 demonstrated that the size of deflection of the vehicle path from a straight line and the associated path deflection angle are the two most relevant factors. However, this measure has only a localised effect [33,39].
The first results of experimental research on the effect of the size of the horizontal deflection on speed reduction were obtained on the TRL test track [10]. Other results were worked out based on in situ speed surveys conducted under natural conditions [26,27,29,33]. Nevertheless, in a majority of cases described in various studies the research data were obtained from traffic simulator tests [20,34,42,43,44,45,46,47] formulated conclusions from an analysis performed on the basis of driver survey data.
However, analysis of the research results given in the above publications indicates a big impact of the landscaped road scenes on final speed reduction results, which was particularly underlined in [5,22,40,48]. The same applies also to the combination of landscape features, road conditions and the implemented traffic management measures [26,27]. These basic relationships between the physical measures relating to the road geometry employed in traffic calming and integrated urban planning, taking into consideration the surrounding landscape features and village buildings were found already in the 1990s.
The review of the literature performed in Section 1 demonstrated that the existing design guidelines offer recommendations as to the effectiveness of specific traffic calming measures, and detailed recommendations regarding geometric parameters of traffic lane design in the UK [49], Denmark [2], and in Germany [13], yet there are no integrated design guidelines that consolidate the effect of the application of the above-mentioned solutions with consideration of the influence of the landscape surrounding the road on achieving the expected speed reduction of the entrance to the village.
According to [38] as regards village transition zones, it is most important to influence the driver’s perception by facilitating his/her “reading of the road ahead”, which sometimes can prove more effective than speed limit signs. Concepts such as “self-explaining” or “self-enforcing” road, were introduced in [4,38]. This is to be achieved through a visual design approach to explain the roadway function to drivers and thus achieve the desired speed of traffic. Similar conclusions on the need to consider in design guidelines different landscape elements present in village transition zones are presented also in [22,40,48]. The need to consider many elements of the roadside landscape was indicated also in [26,27], where the authors postulated three criteria characterizing transition zones on roads with 50 km/h and 70 km/h speed limits, including chicanes horizontally deflecting one traffic lane with various deflection angles.
In recent years, the development of photovoltaic technologies has also resulted in new studies conducted in transition zones, on the use of photovoltaic cells in traffic signs and road markings used in kerbs and on carriageway edges [50,51,52]. These are major factors associated with eyeball fixation, clear vision field and driver’s perception [22,53].
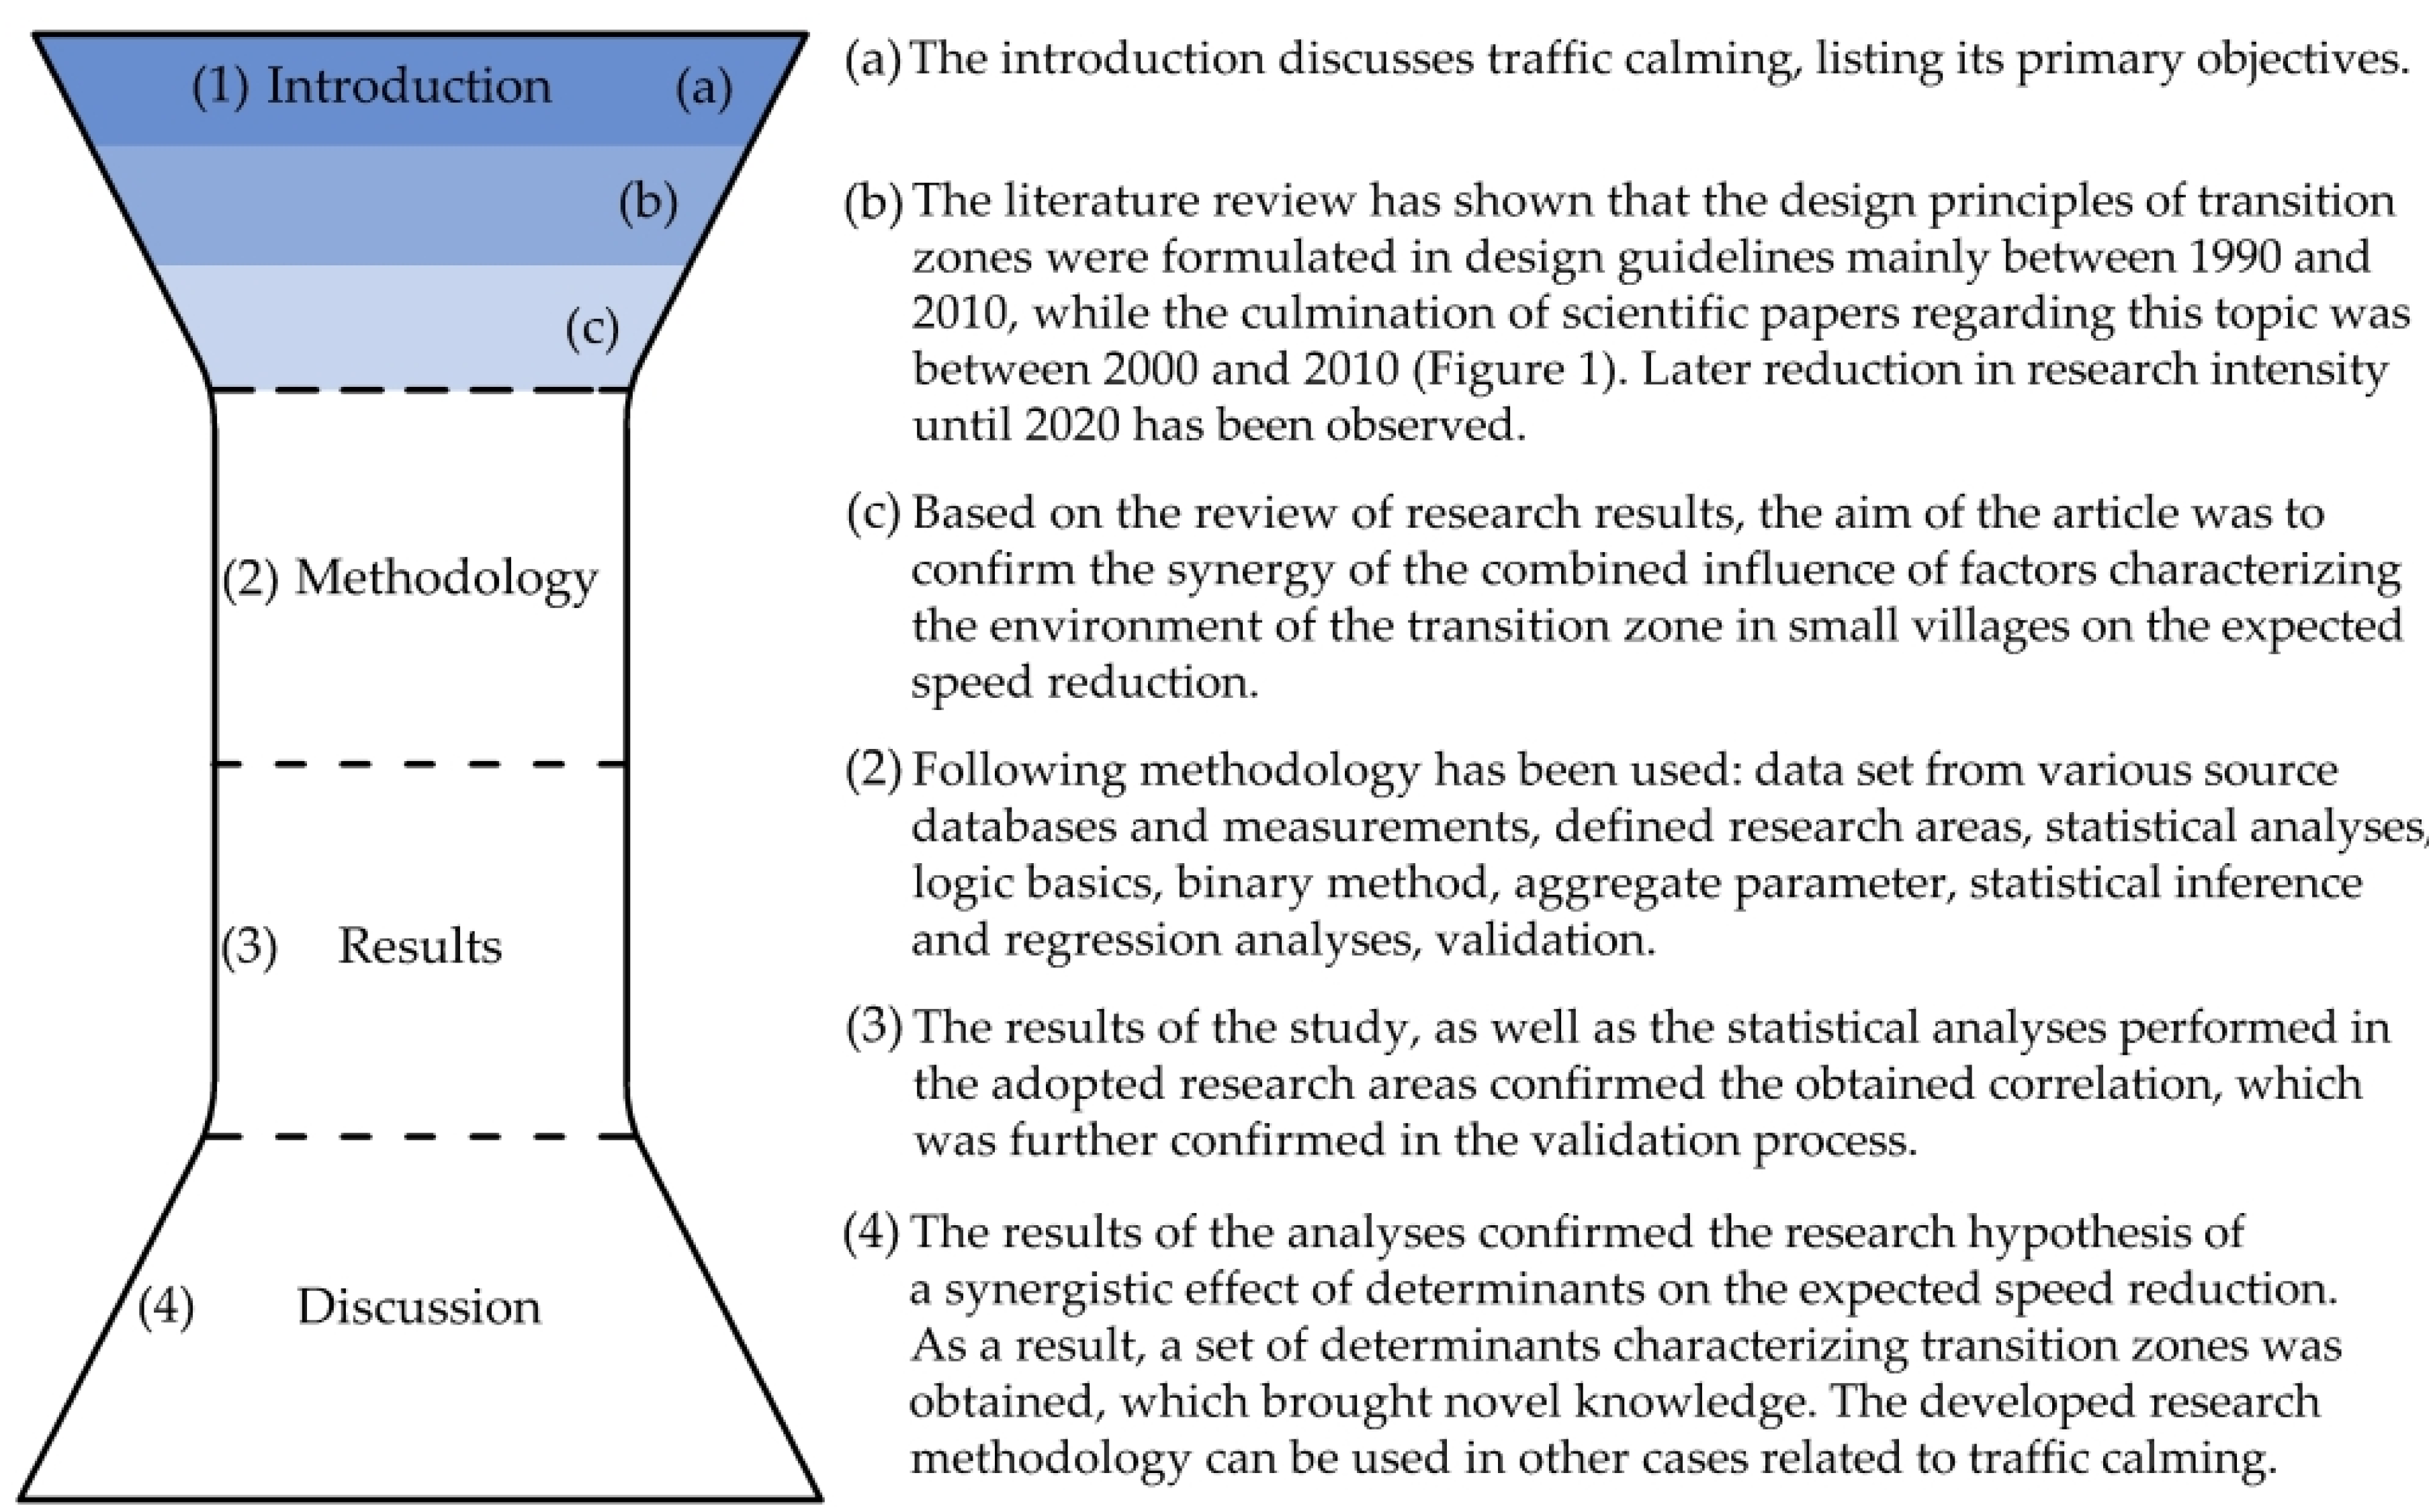
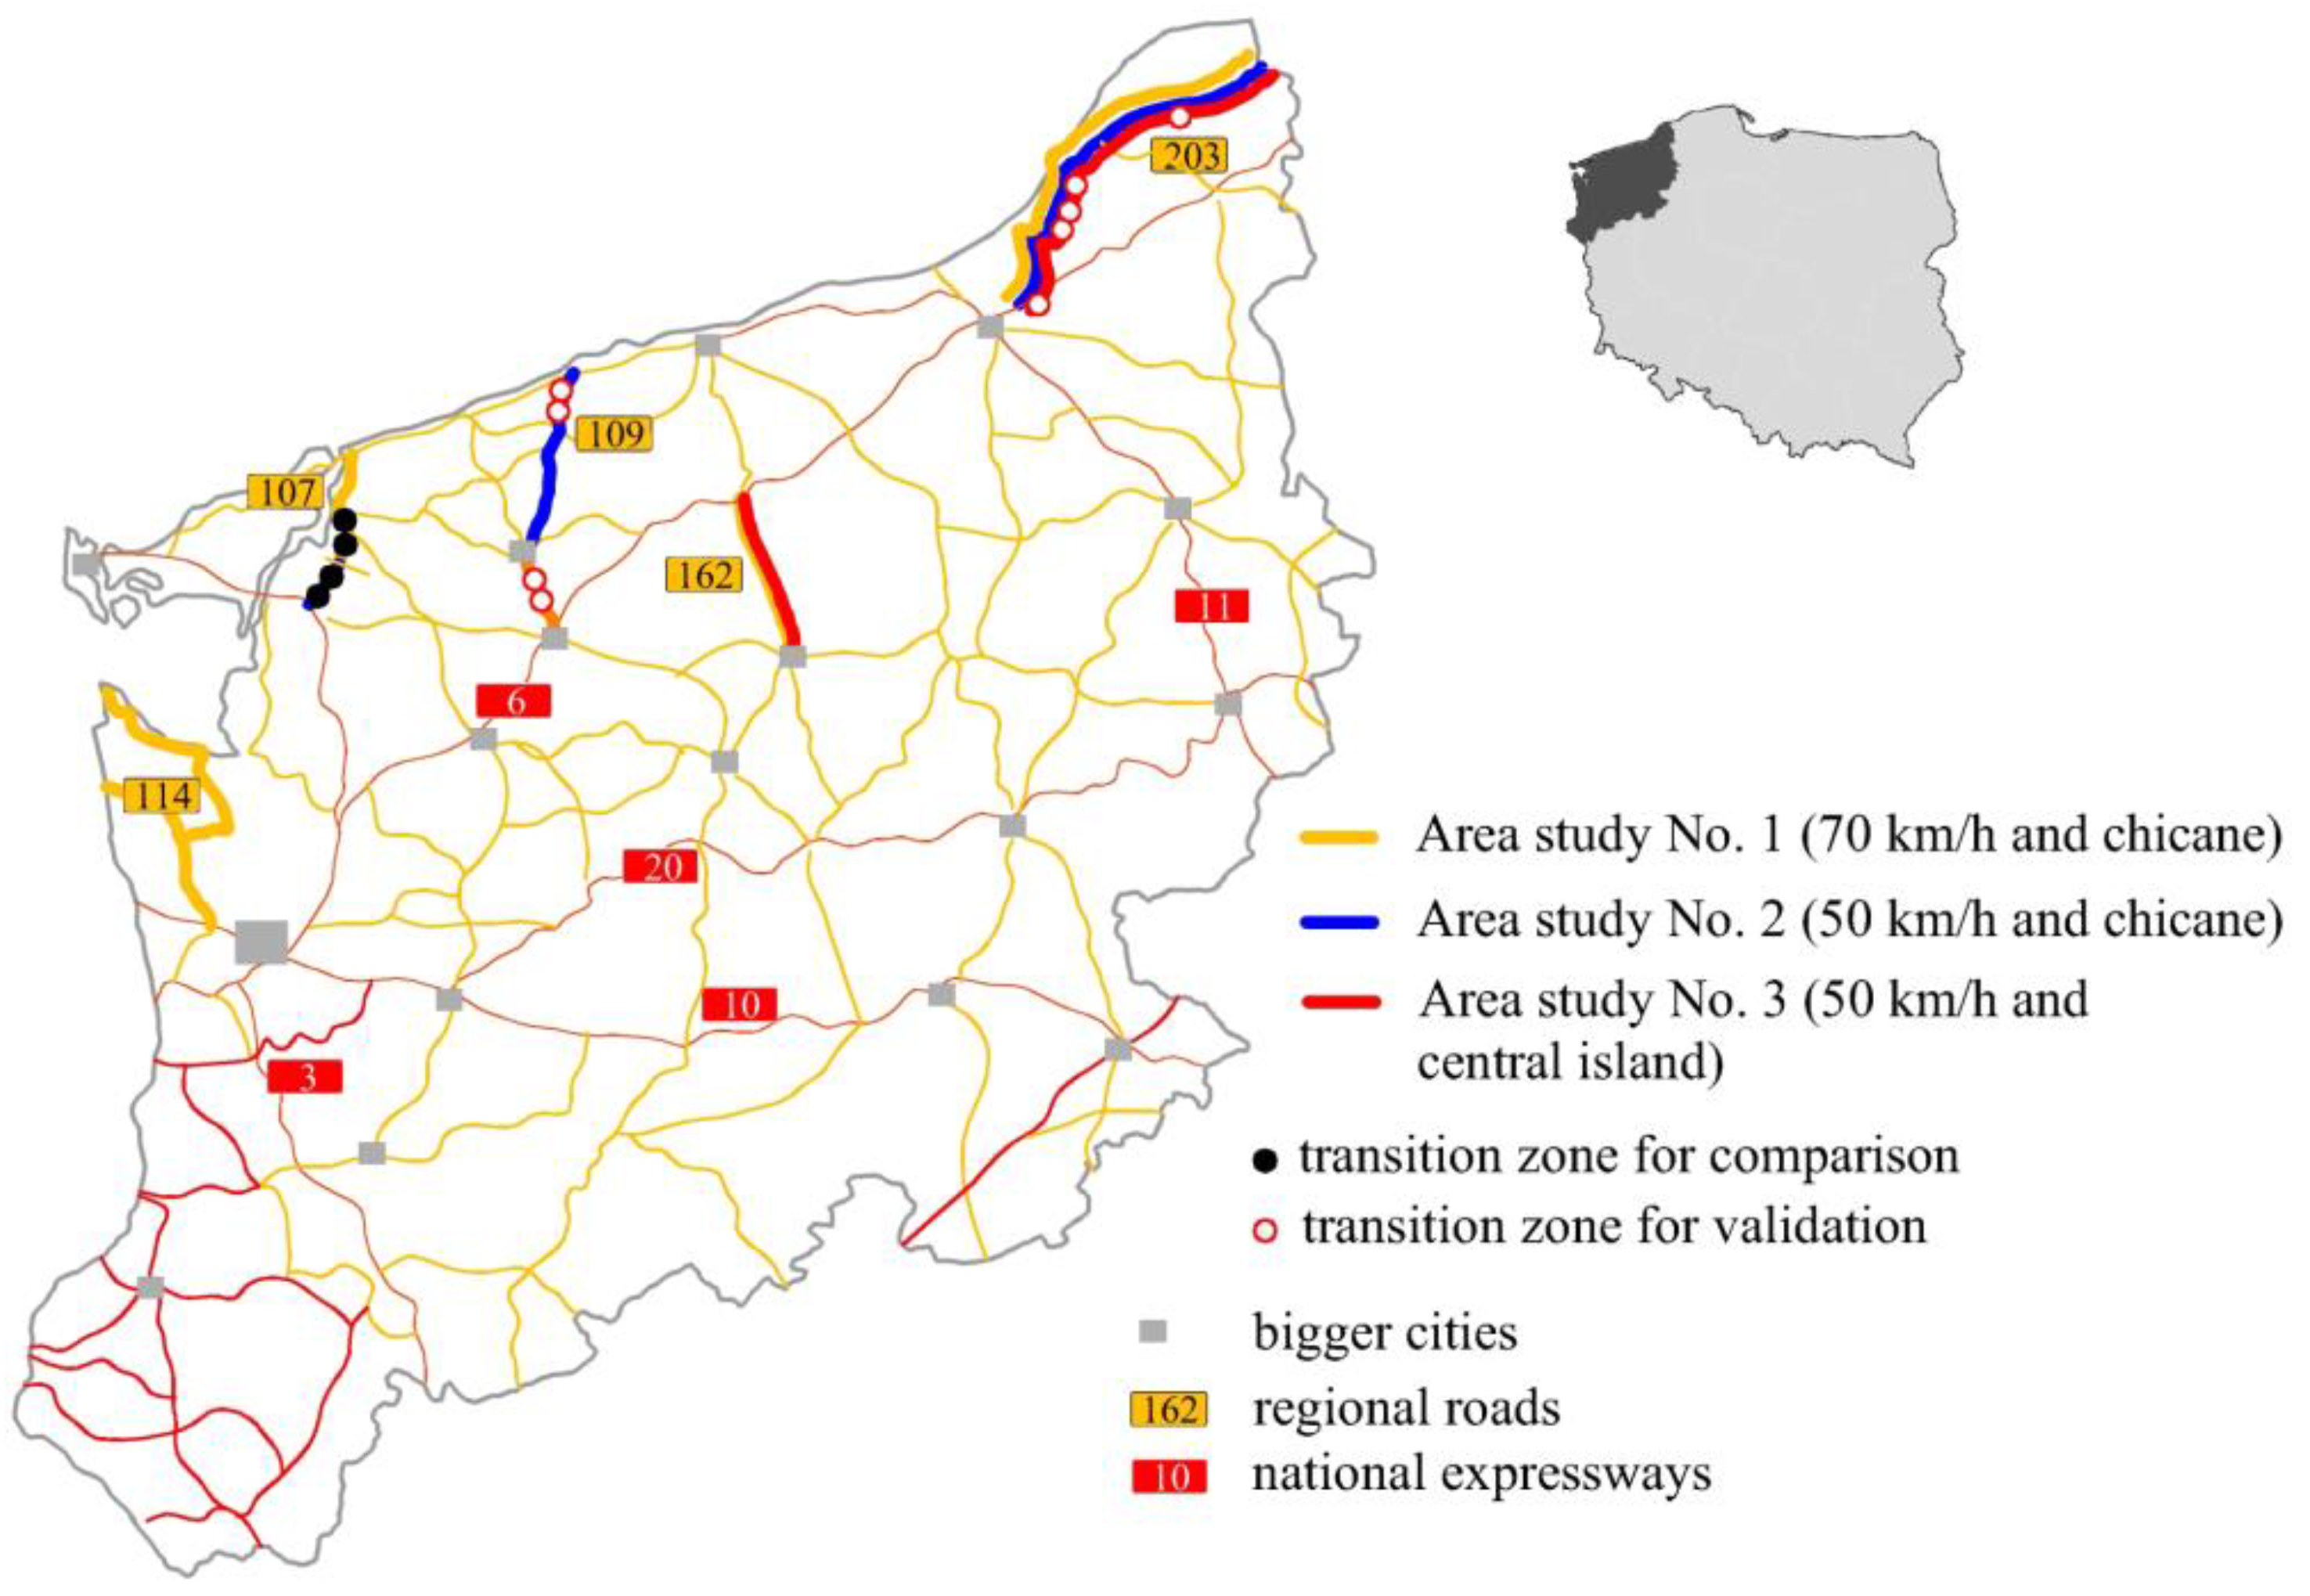
The aim of this study is to confirm the hypothesis of synergistic effect of the combined influence of factors characterizing the surrounding of the transition zone to small villages on the expected speed reduction. The first study areas were analysed in [26] (70 km/h speed limit roads including chicanes) and in [27] (50 km/h speed limit roads including chicanes). In this paper, the authors studied a new area with a speed limit of 50 km/h and a central islands in the transition zones and presented new analyses. In addition, the authors performed a validation of the correlations presented in previous articles [26,
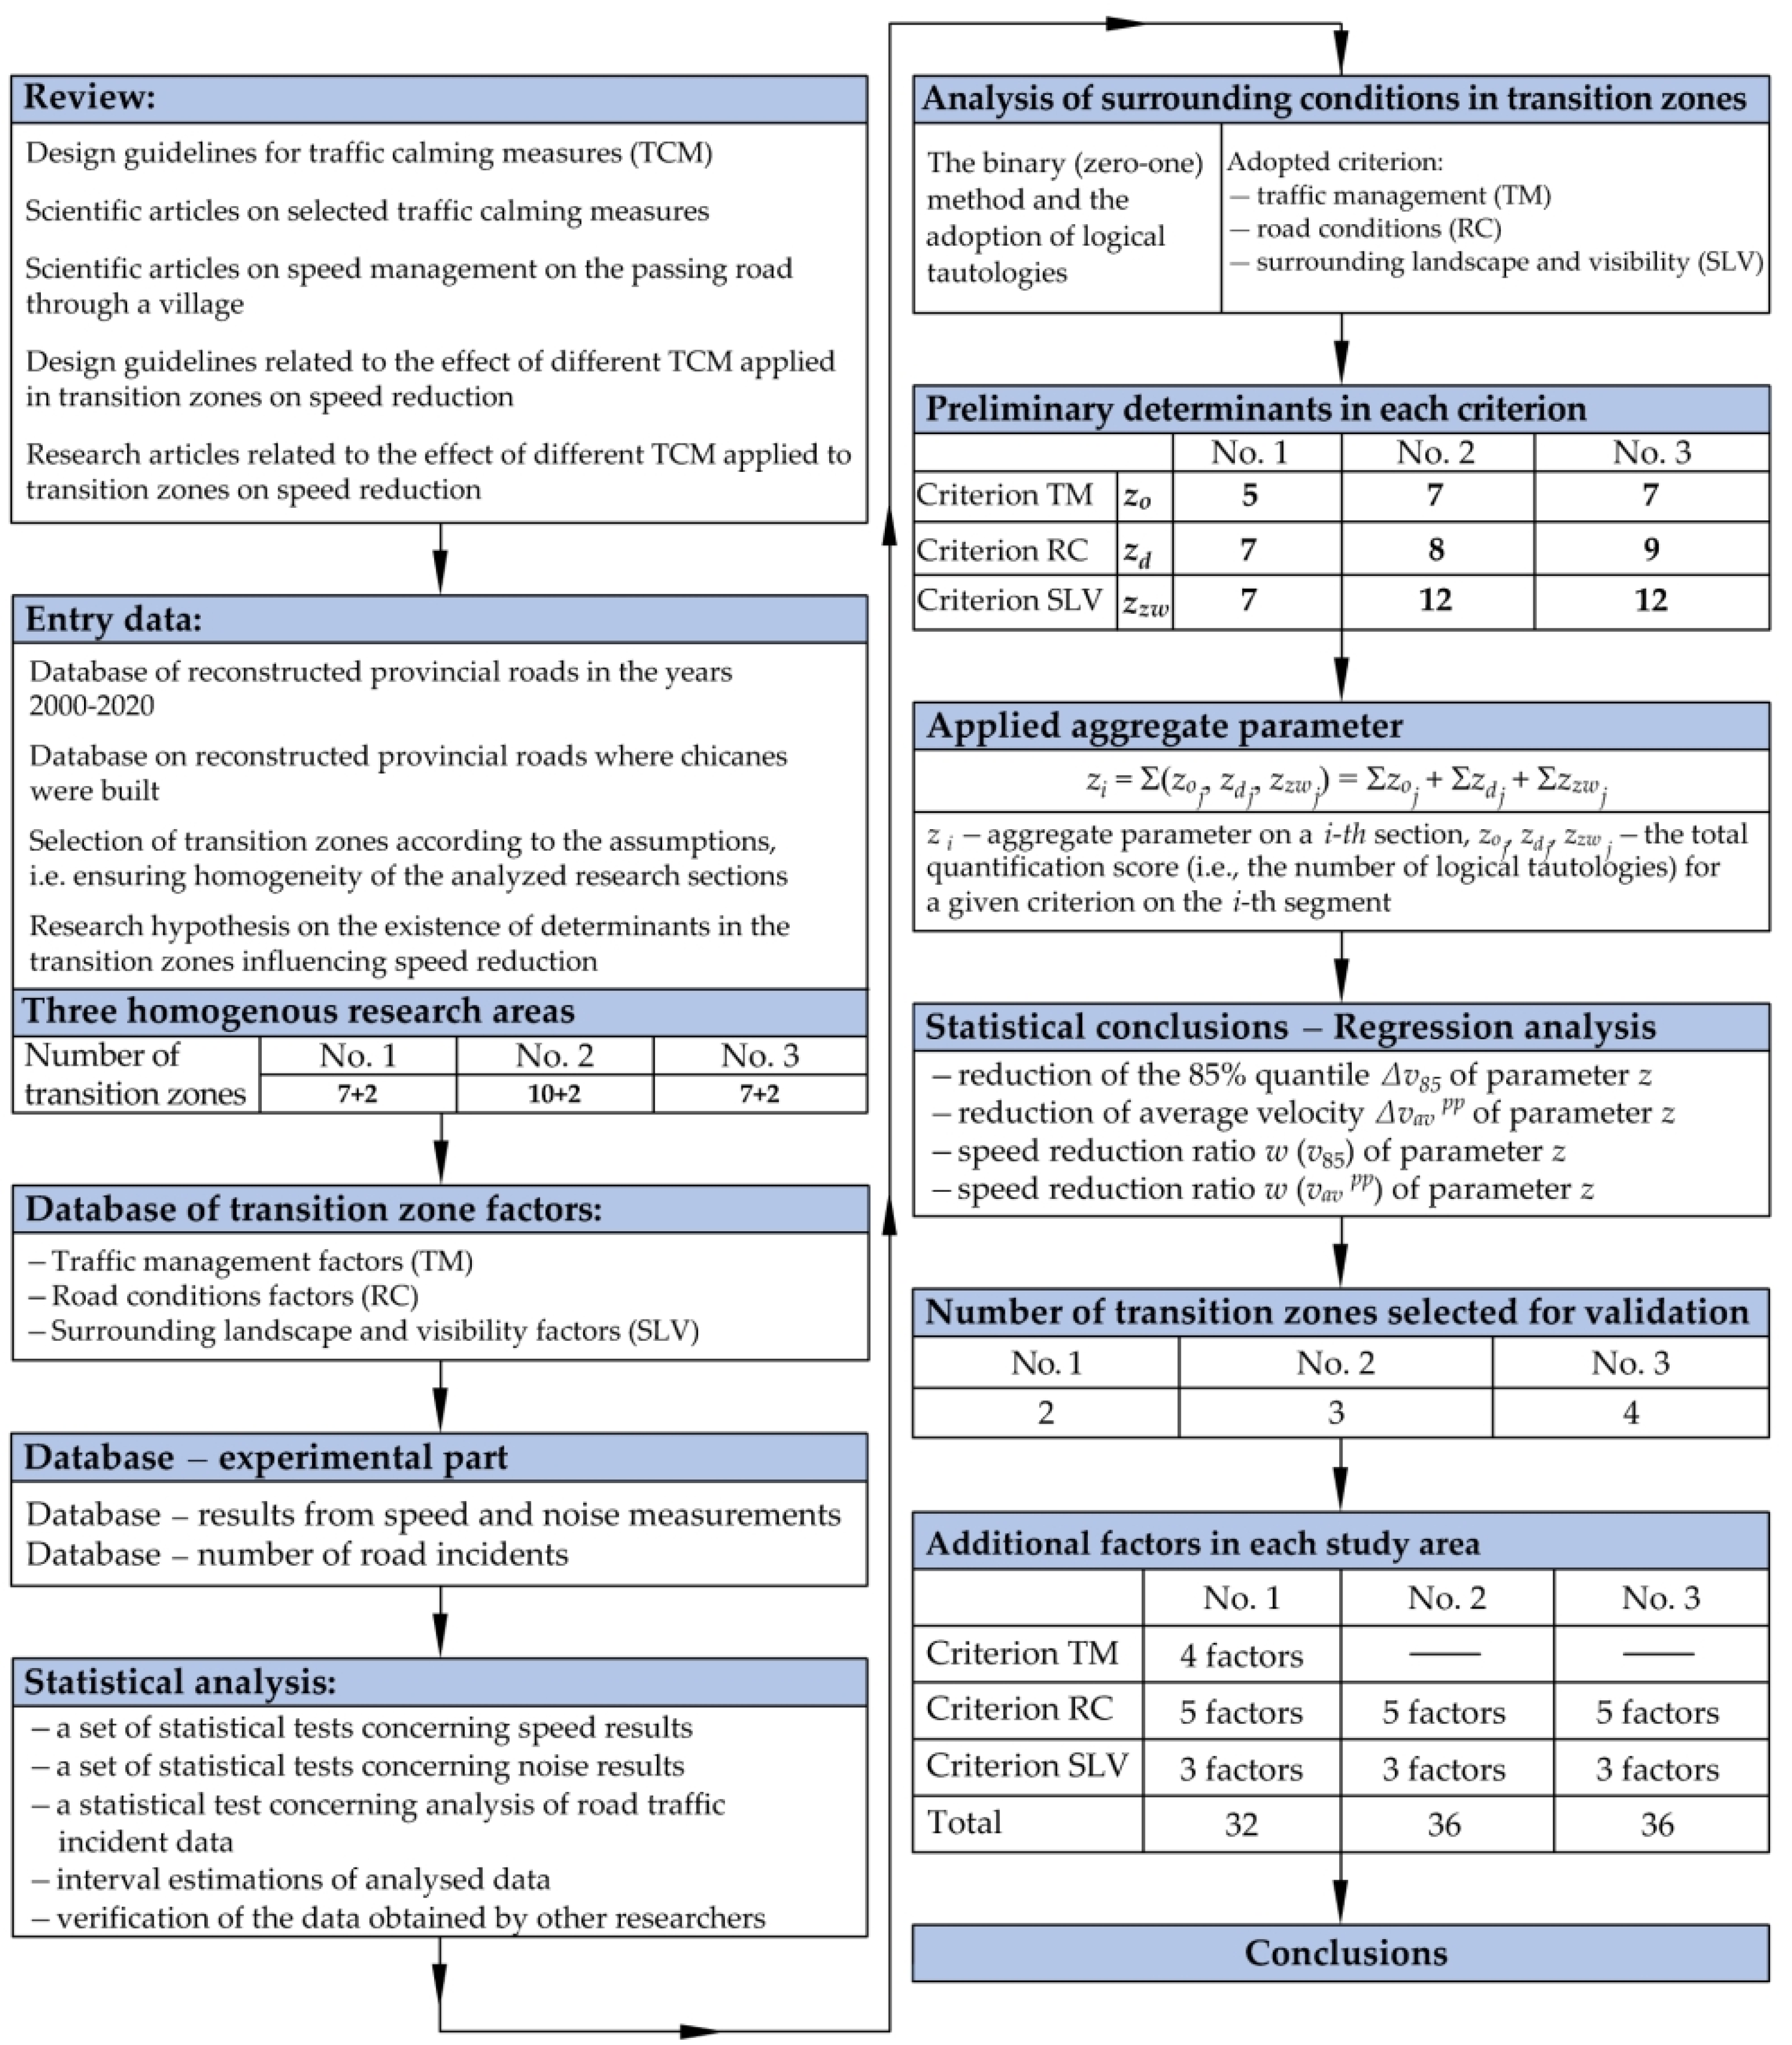
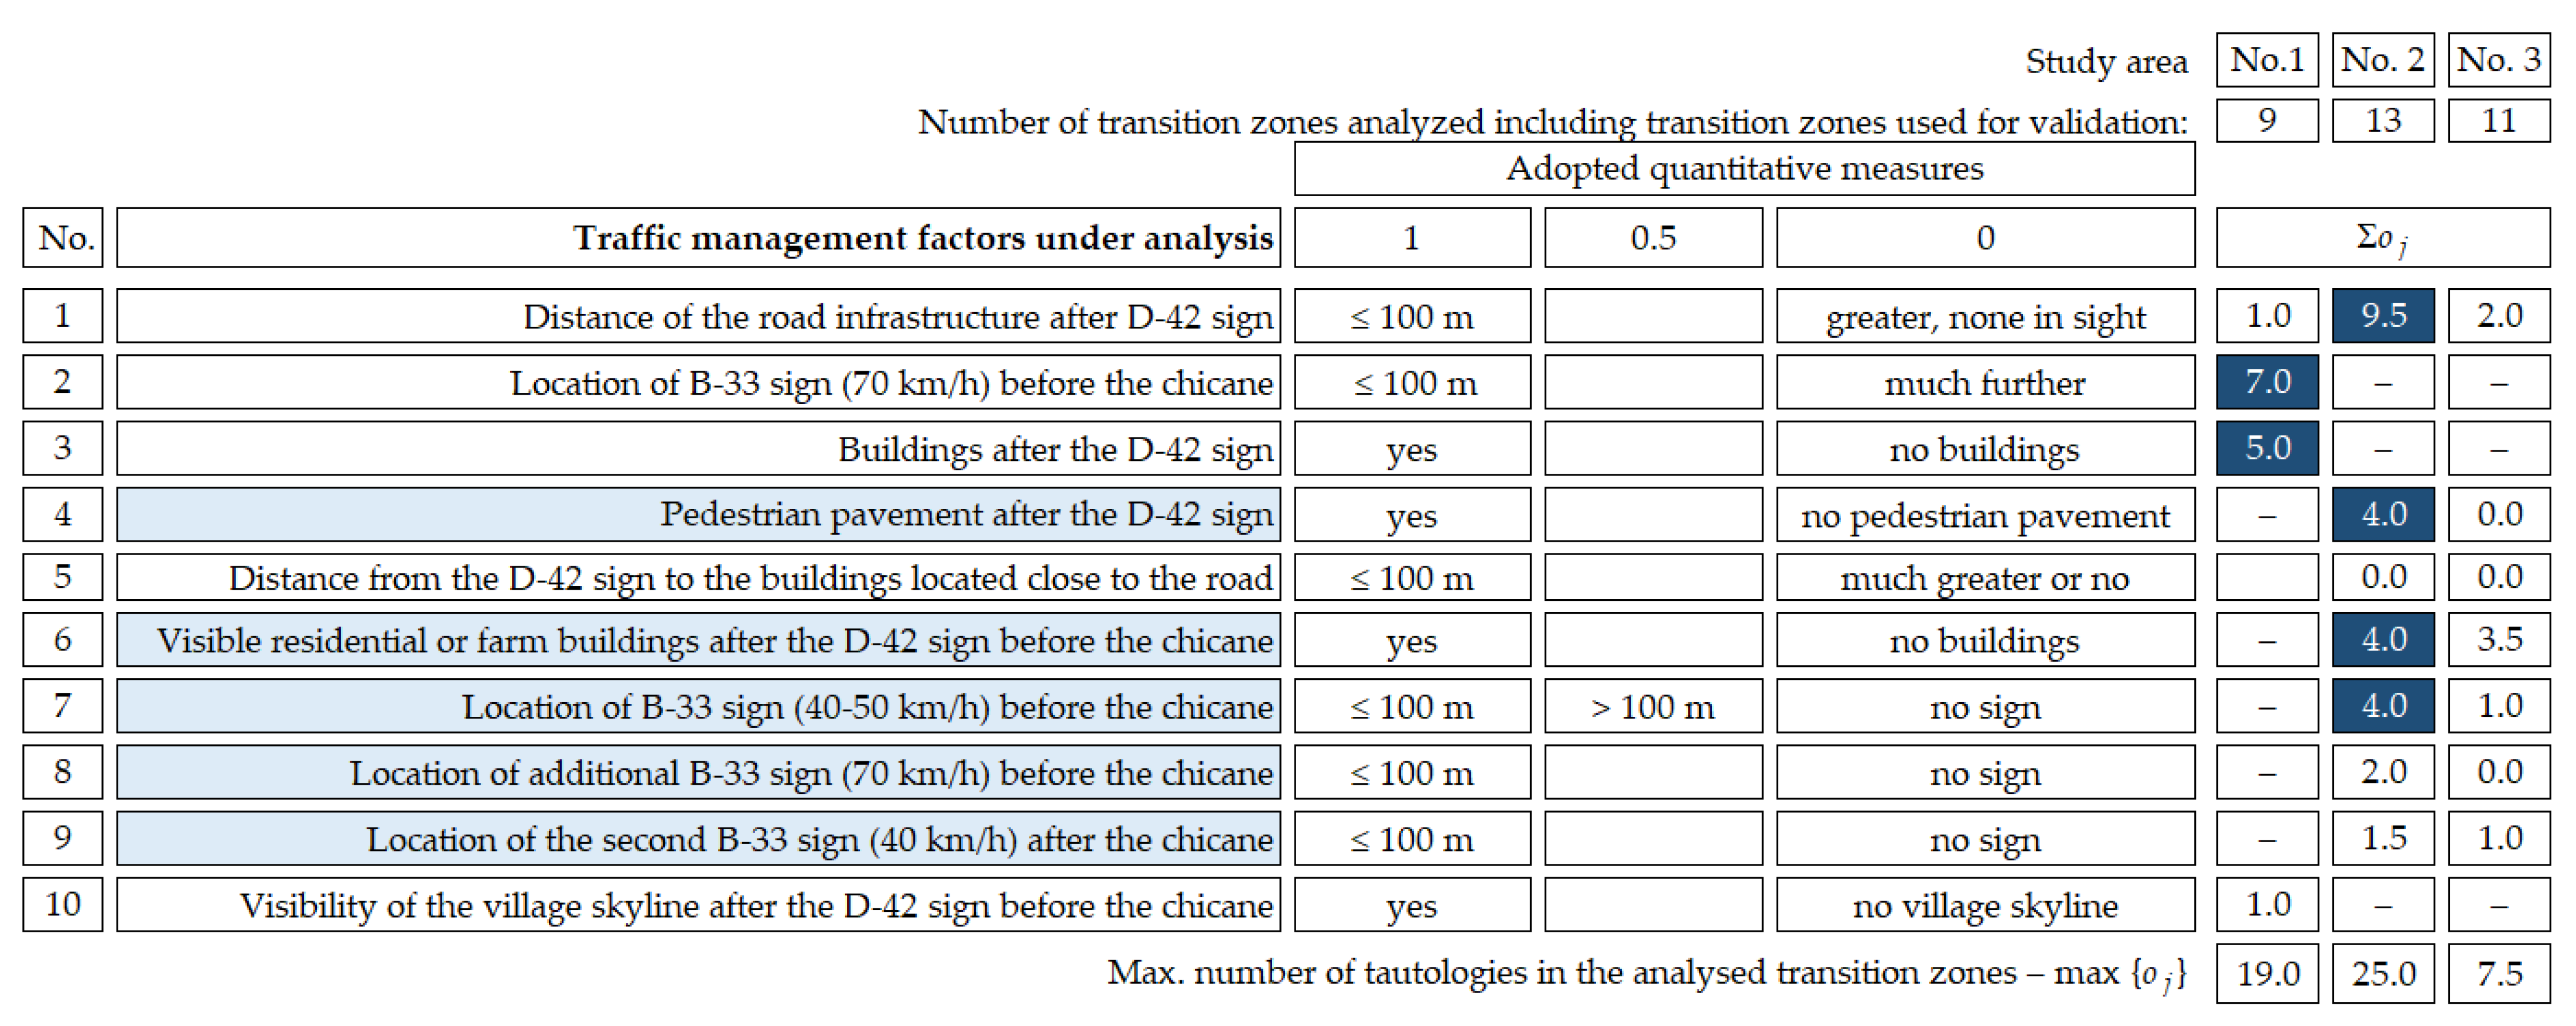
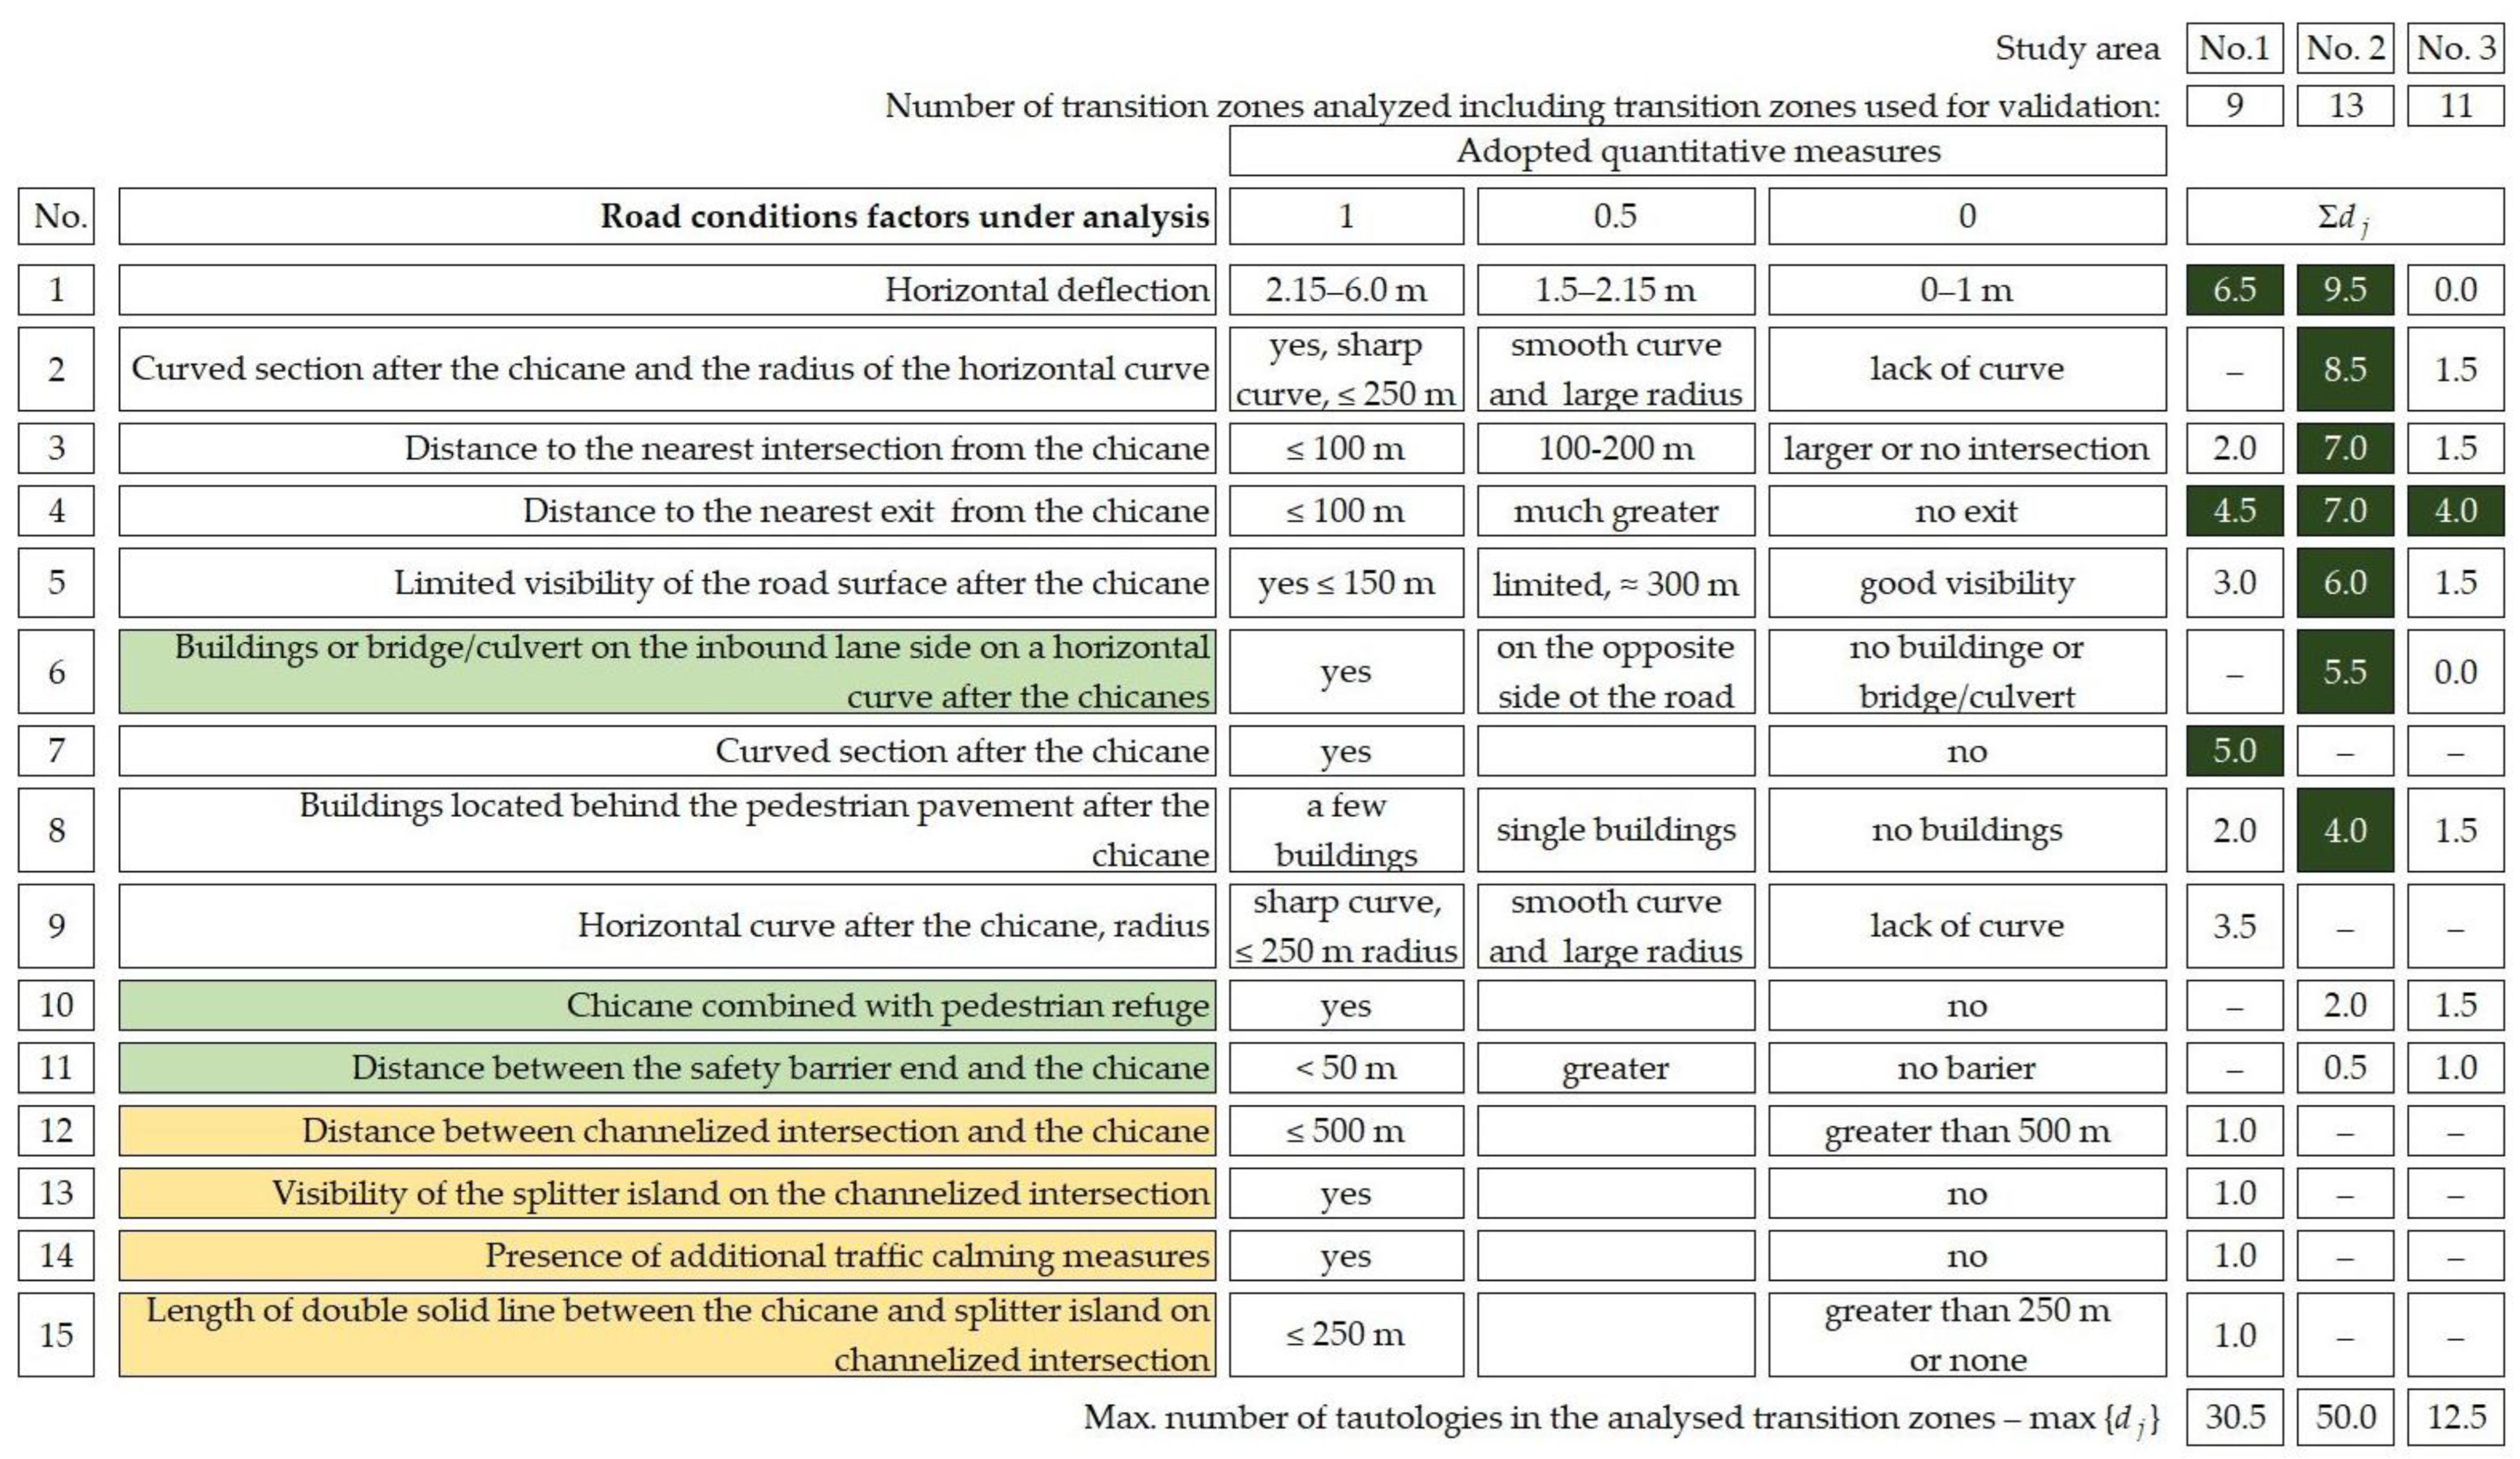
27] and new correlations obtained in new study area. For conducted analysis the authors implemented a binary system of evaluation as applied in [26,27] to characterise the surroundings of the entry zone in three criteria, concerning traffic management (TM), road conditions (RC) and surrounding landscape and visibility (SLV), as shown in Section 3. As a result, statistically significant correlations were obtained confirming the effect of the combined influence of the determinants on speed reduction, thus fulfilling the purpose of the article. Section 4 and Section 5 present the main conclusions and future research directions. Figure 3 below shows the structure of the article using the IMRAD scheme.
Figure 3.
IMRAD structure of the article.
2. Methodology
2.1. Study Area
Elaborating on the above problems, in this article, the authors undertook to validate the relationships presented in [26,27] and added one more study case with the transition zone located on a 50 km/h road with only a narrow central islands were installed, referred to as study area No. 3. The transition zones described in publication [26] are designated as study area No. 1 and in publication [27], as study area No. 2 (Figure 4). Figure 4 shows also the locations of four transition zones without chicanes, chosen for the purposes of comparison with the transition zones including chicanes and nine non-typical transition zones chosen for validation.
Figure 4.
Map of the study area showing the locations of transition zones on regional roads in NW Poland. Source: own work of the authors.
Similar assumptions presented in previous articles [26,27] were also applied here. To validate the results presented in [26,27], in this study, for study areas No. 1 and No 2, transition zones were located on renovated provincial roads. In a village with a population of 35 to 1000 people, a short transition through the village (400 m to 2000 m) was also studied. The same research assumptions were made for the third study area. The transition zones selected for this study were located on roads of the same class with a roadway width of 6 or 7 m. When choosing the transition zones for validation purposes, 150 to 800 veh/h traffic volume was maintained, as in articles [26,27]. Mainly non-typical transition zones were chosen for validation of the relationships obtained in the study areas No. 1 and No. 2. With respect to the new study area No. 3 with central islands, the authors chose transition zones varying in terms of landscaping, roadside buildings and surrounding land (forest or farm fields). Additionally, two transition zones on each of the regional roads, with 50 km/h and 70 km/h speed limit with no chicanes in place were also chosen for analysis. This choice of additional transition zones was dictated by the intention to check whether the transition zone features (landscaping) in three criteria have a combined impact on speed reduction, with neither a median island nor a chicane in place.
2.2. Transition Zones Chosen for Validation Purposes
A few transition zones were chosen in each study area to confirm the demonstrated relationship between speed reduction and speed reduction ratio SRR on the one hand and the aggregate parameter on the other. In accordance with suggestions made in [22,38,40,48], as regards considering the transition zone features non-typical transition zones were chosen for validation for each of the respective study areas.
Taking into account the fact that on 70 km/h roads (study area No. 1) horizontal shifts in carriageway are applied in non-typical zones between villages, it is just these transition zones that were chosen for validation. Design details for on-road chicanes deflecting only one lane are given in the German guidelines [13]. Two zones without chicanes were chosen in addition.
In study area No. 2 three non-typical transition zones were chosen for validation, out of which one was located on a curvy road section with the view ahead additionally restricted by a rail bridge and two other zones were located in the same village in between built-up area composed of two distinct parts. Again, two zones with no chicanes installed were chosen additionally.
In study area No. 3 including central islands in place the following four non-typical transition zones were chosen: (A and B)—two zones, when the distance separating two villages was so small that they shared one transition zone with two opposite traffic directions (C)—one zone with buildings scattered loosely over the village area and the transition zone located amidst them (D) one zone, situated before a curvy road section, with view greatly restricted by a forest complex. Two additional zones, the same as in study area No. 2, without a central island were included in this group.
The analysis of the selected factors characterizing non-typical transition zones, located on 70 km/h roads demonstrated that four additional factors pertaining to specific conditions and presence of two staggered chicanes deflecting the traffic lanes in opposite directions should be considered. An example of such a non-typical transition zone is shown in Figure 5 below.
Figure 5.
A non-typical transition zone with two staggered chicanes deflecting the traffic lanes in the opposite directions. Source: own work of the authors.
Additional factors in the road conditions criterion and quantification measures assumed for these factors were as follows:
- –
- Distance between channelised intersection and the chicane (up to 500 m—1, above 500 m—0),
- –
- Visibility of the splitter island on the channelised intersection to the driver passing through the chicane (yes—1; no—0),
- –
- Presence of additional traffic calming measures (yes—1; no—0),
- –
- Length of double solid line between the chicane and splitter island on channelised intersection (up to 250 m—1; greater distance or no double solid line at all—0).
2.3. Data Collection
Speed surveys were carried out in the transition zones under analysis, with simultaneous traffic counting before and after the chicane. It was assumed that speed surveys will be carried out under continuous traffic flow conditions with automatic traffic counting by means of a special device shown in Figure 6. The electronic software of the measuring device allowed for simultaneous recording of traffic volume data with breakdown of traffic by vehicle type and traffic direction and of speed data (under free and continuous flow conditions). Free traffic flow was understood in accordance with the definition given in [54], i.e., as a flow with 7 s. headway. Continuous flow was applied to all the vehicles travelling along a given road in a given time. However, for further analyses the authors chose only free-flow traffic situation for the sake of consistency of their analyses with studies by other researchers.
Figure 6.
The speed measuring device employed in traffic count and speed survey: (a) Schematic representation of the elevations of the sensors for the automatic traffic count and vehicle classification survey: C, D, E, F and G; (b) speed sensors A and B. Source: own work of the authors.
Based on preliminary measurements and taking into account the hourly traffic volumes in the analysed transition zones it was assumed that the survey would involve measuring the free speed of at least 100 passenger cars before and after the chicane. At sites without on-road chicanes or central islands vehicle speeds were measured before the E-17 “city/town/village” sign and after the D-42 “built-up area” sign respectively. Considering low traffic volumes and a small percentage share of heavy goods vehicles (3–8%), it was decided to measure their speeds only during the span of 100 passenger cars. The speed measuring devices measured also the speeds of farming vehicles, yet they were not considered in further analyses.
2.4. Research Methodology—Binary Method and Logical Tautologies
The analysis of the previously published results demonstrated lack of repeatability and homogeneity of results obtained in the tests by [10,15,19,20,33]. Sayer et al. [10] conducted the study on an “artificial” test track (Transport Research Laboratory TRL) and studied on a designated experimental roadway different shapes of chi-canes with different dimensions. The shape of the chicanes was made using horizontal and vertical elements. More than a dozen experienced drivers participated in the experiment. Many characteristic factors existing on the roads (i.e., green surroundings, open agricultural area, forest area, silhouette view of the village or single buildings, etc.) were omitted in the study. In other study [33] speed measurements were performed on existing roads with chicanes of various sizes. Unfortunately, other parameters of analysed roads were not given in the publication and there was no description of the development of the road surroundings. Beger & Linauer performed speed measurements in four transition zones with various chicanes [19]. Their results do not coincide with the results presented in [33], despite the fact that they were conducted under natural conditions on existing roads. Lantieri et al. [20] conducted speed measurements in 12 transition zones on an existing road with a length of 15 km and also obtained different results that do not coincide with the results described in [33], nor with the results reported in [19]. Dixon et al. [15] con-ducted experimental studies on various roads using traffic simulators and also the results from these studies did not match the results from the studies described above.
After analysing abovementioned information, the authors decided to analyse the results of other studies, which take into account other factors except physical effect of the chicane or central island on speed reduction in a short section of the transition zone. For instance, ref. [38] recommends considering in the transition zone design a few additional factors pertaining to the transition zone geometry, traffic calming treatments and presence of various road infrastructure elements such as bridges, culverts, traffic barriers.
While in [5,22,40,48] consideration of also the elements of the roadside landscape was further recommended. Still, it was only the guidelines [5] that proposed categorisation of certain road surrounding and landscape elements, which however referred only to built-up areas on the outskirts of towns, with pedestrian cross traffic, cycle traffic and public transport system stops.
Considering the above and taking into account the comparison of the results of other studies, summarised in Table 2, the authors adopted the research methodology presented in the flow chart below (Figure 7).
Figure 7.
Flow chart of applied methodology. Source: own work of the authors.
Authors presented the results of research carried out in transition zones by taking into consideration the confirmation of the presence at the site of various factors characterising three adopted criteria by them related to: traffic management (TM), various factors related to road conditions (RC) and the surrounding landscape and visibility (SLV) [26,27]. To facilitate the evaluation of the varied influence of the selected factors on speed reduction, an aggregate parameter was introduced [26,27]. The aggregate parameter consisted in using the basics of logic and the binary method (zero-one coding) specified, for instance, in a publication by the [55]. In reference to the several dozen factors characterising the three adopted criteria, the authors proposed using logical tautologies, indicating whether a given factor is present or not present in the analysed transition zone [26,27]. The aggregate parameter was numerically equal to the sum of confirmed logical tautologies in the three adopted criteria, TM, RC and SLV. An analogical approach was proposed in this article to carry out validation of the relationships given by authors in [26,27] and compare the results obtained, which means that the binary method and logical tautologies were implemented also in this research.
Logical tautologies can be applied both for new and existing transition zones. They can also be subjected to further analysis with the aim of obtaining a practical indication on what should be improved in the transition zone to finally achieve the desired slowing effect.
2.5. Statistical Analysis
With regard to all data, it was checked if speed distribution in a given transition zone is a normal distribution, using the classic goodness-of-fit K–S test. In all cases it was confirmed that the distribution of speed populations obtained was normal and that further statistical analyses relating to them could be carried out. Different speeds are traditionally used in traffic calming studies when analysing the effectiveness of different traffic calming measures [4,38]. Based on the speed data obtained the authors assumed the following for further analyses: 85th percentile speed i.e., the speed at which or below which 85% of motorists drive on a given lane, v85, mean free speed vav, speed reductions Δv and SRR (calculated from the general formula SRR = Δv/vbefore). Taking account of the SRR value in traffic calming analyses allows for comparing independent studies.
All the speed data were subjected to traditional statistical analyses. First the goodness-of-fit K–S test was performed in order to check the distribution of the investigated before and after speed populations (vbefore and vafter) for normality (columns 2–3, 6–7, 10–11 in Table 3 and columns 5–6 in Table 4). As mentioned before, normal distribution was confirmed in all the speed populations under analysis.
Table 3.
Results of standard statistical tests in additional transition zones accepted for validation (in relation to 85th percentile speed). Goodness-of-fit K–S test and Two–sample K–S test λα = 1.36 (α = 0.05), Median test χα2 = 3.84 (α = 0.05).
Table 4.
Results of standard statistical tests on test in study area No. 3 with 50 km/h speed limit and central islands installed (in relation 85th percentile speed). Goodness-of-fit K–S test and Two–sample K–S test λα = 1.36 (α = 0.05), Median test χα2 = 3.84 (α = 0.05).
The next statistical analysis involved checking: whether the “before” and “after” driving speed cumulative density functions belong to the same population or whether they are different, i.e., confirm the hypothesis of the desired slowing. The Two-Sample K–S test and median test were used for this purpose. Two-Sample t-Test was not used, as it can be applied only with positive scores of the F-test of equality of variances. Taking the above into consideration, the median test was used instead of the Two-Sample t-Test, this is in accordance with the principles of statistical analysis [56]. The results of the Two-Sample K–S test are given in Table 3—columns 4, 8, 12 and Table 4—column 7. The results of the median test are given in Table 3—columns 5, 9 and 13 and Table 4—column 8. In all the cases, when a positive Δv85 value was obtained both statistical tests produced positive results, which was a confirmation that the speeds measured before and after the chicane or central island were different, i.e., belonged to different populations. In the remaining cases the test results varied. The values of the 85th percentile “before” and “after” speed and of speed reduction are additionally given in Table 4 (columns 2, 3 and 4).
Based on the analyses made [26,27], authors adopted a research hypothesis that there exist determinants characterizing a transition zone in three criteria (TM, RC and SLV), whose combined energy has an effect on drivers’ perception making them slow down. Only in very specific and rare situations can a single factor cause local speed reduction. In order to prove the above hypothesis or to validate the published relationships, the authors ensured homogeneity of the transition zones chosen, in accordance with the general theory of experimental research.
Taking the above into account, in study area No. 3 five transition zones with 1 m lateral shift and two transition zones with 1.5 m lateral shift were chosen for analysis. No additional factors characterizing a given transition zone were considered.
Figure 8 shows the accumulated relationships between speed reduction and its corresponding SRR value and the aggregate parameter for a given transition zone, in relation to the data from the publication [26,27] supplemented with new data from the study area No. 3.
Figure 8.
Relationship between speed reduction and SRR on the one hand and aggregate parameter on the other in three analysed study areas. (Data from study areas No. 1 and No. 2—based on the data given in [26,27]): (a) speed reduction ∆v85; (b) speed reduction ratio SRR. Source: own work of the authors.
The analysis of the data presented in Figure 4, SRR in particular, justifies the division of the analysed transition zones into three study areas, depending on the posted speed limit and presence of a chicane or central island. The analysis of the value of determination coefficient R2 also indicates that the adopted research hypothesis about the synergy of the combined impact of the proposed factors on the effectiveness of speed reduction is very likely to be true. The established functional relationships were particularly significant in the case of the study areas No. 1 and No. 2 in [26,27], in which the coefficient of determination covered 79% and 91% of the analysed data respectively. On the other hand, in the study area No. 3 with lateral shift of only 1 to 1.5 m, significant statistical dependencies (R2 ≈ 60%) were confirmed, yet no speed reduction but in fact its increase, was achieved in almost half of the transition zones, which, among other things, corroborates also the conclusions resulting from research [20,25,33] that a small deflection angle does not bring about slowing. However, it is possible that in conjunction with other factors even such a small deflection angle can achieve some speed reduction in specific cases.
3. Results
Considering the results of the statistical analyses presented in [
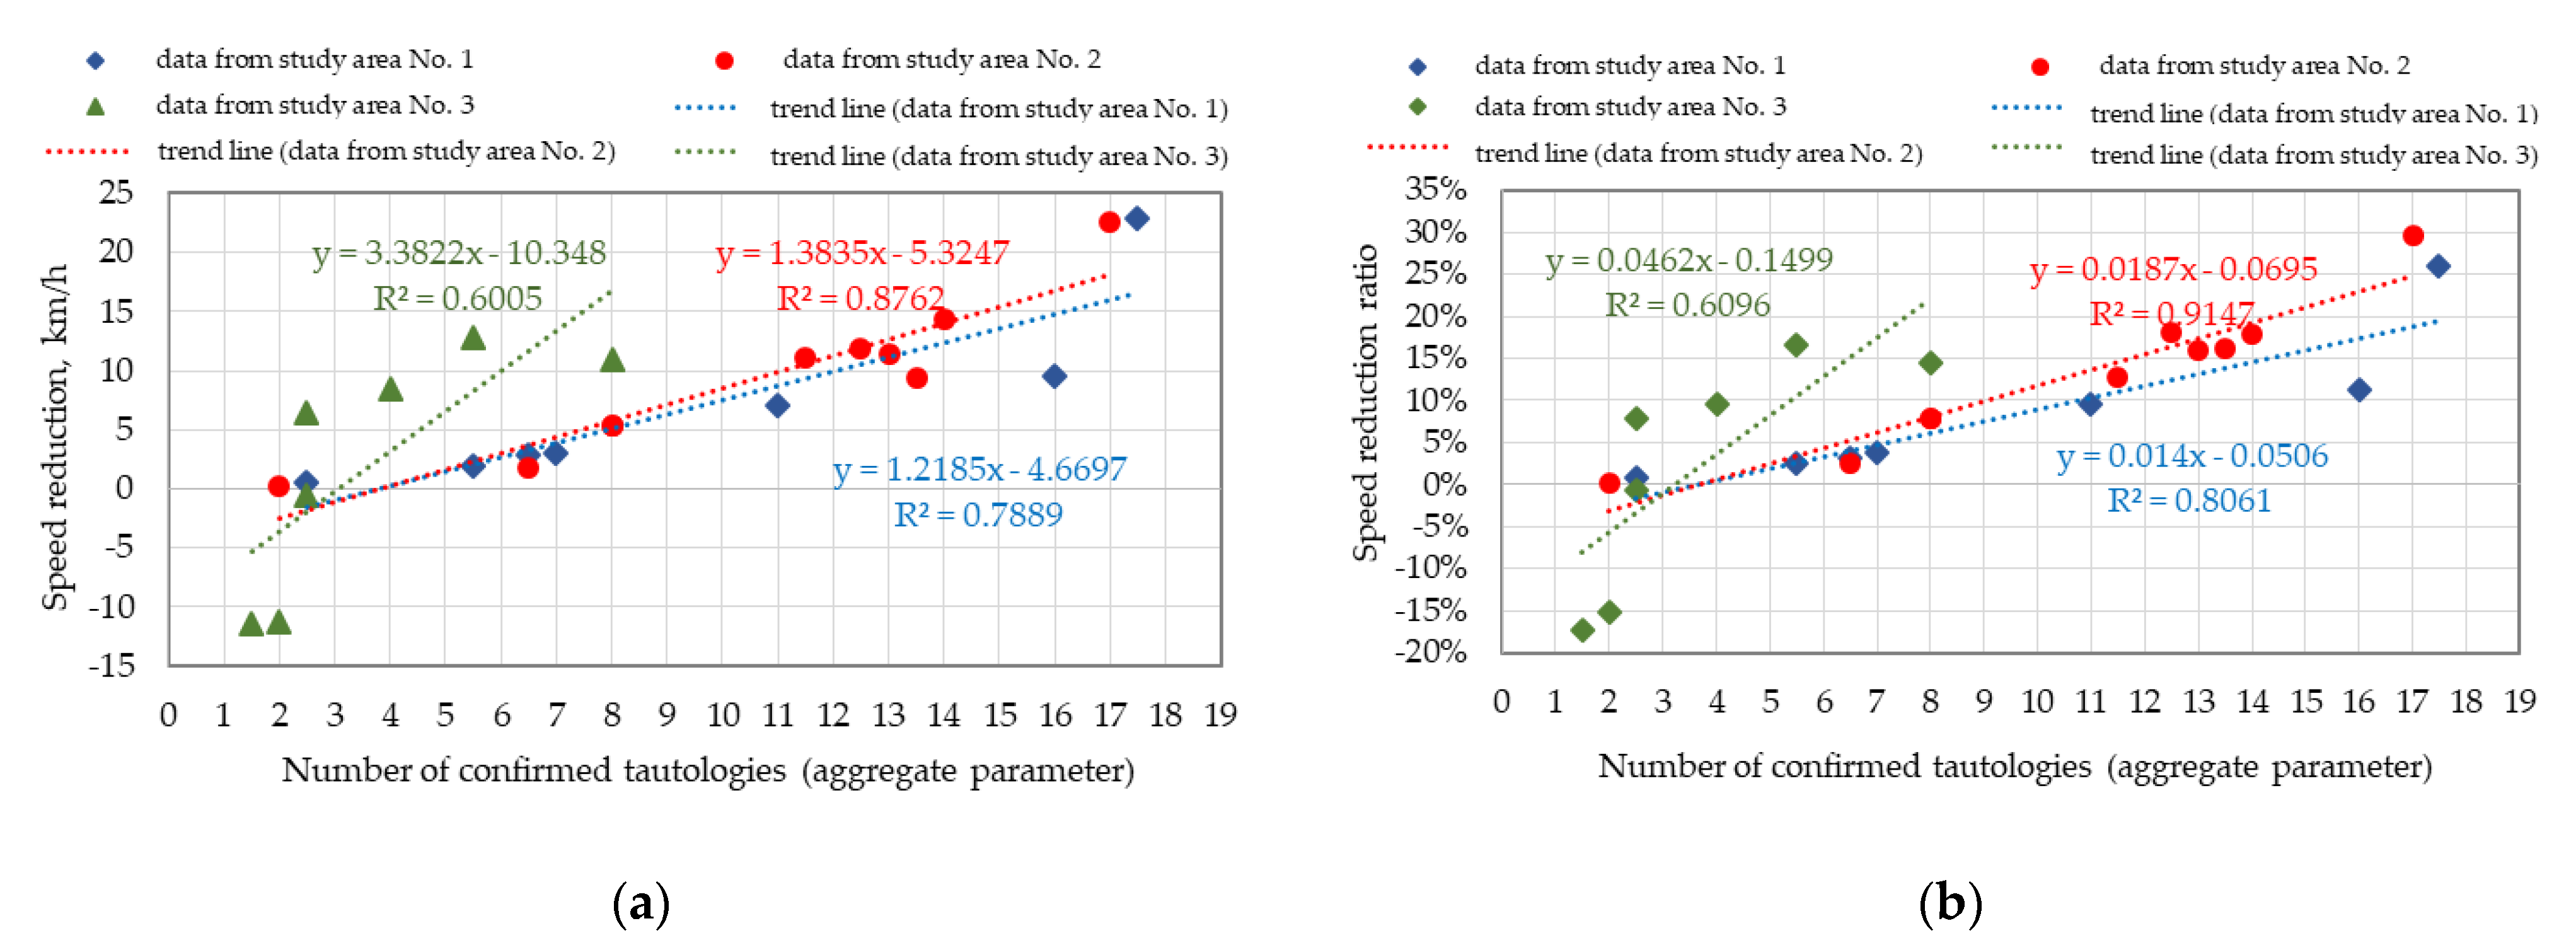
26,27], in the next part of the analysis of the compared results regression analyses were carried out, including in each study area all the analysed transition zones, as presented in Figure 9, Figure 10 and Figure 11 below. The regression analysis, determination model and determination factor are the same for all the analysed data and the purpose of colour coding, described in the legend is to facilitate distinguishing them in the following charts. The analysis of the established relationships demonstrated that all the data fall within the 95% prediction band, and almost all, with only small exceptions, fall within the 95% confidence interval. This testifies to robustness of the results obtained in the course of our research. The lines in the diagrams marked as 95% prediction bands are colloquially called the confidence limits for a single observation. This means that the data satisfy the basic principles of regression analysis, since they fall within this area according to [56]. High values of determination coefficient R2 in study areas No. 1 and No. 2 indicate that speed reduction and SRR indeed depend on the combined impact of various factors operating in the transition zone, i.e., on the value of aggregate parameter proposed in [26,
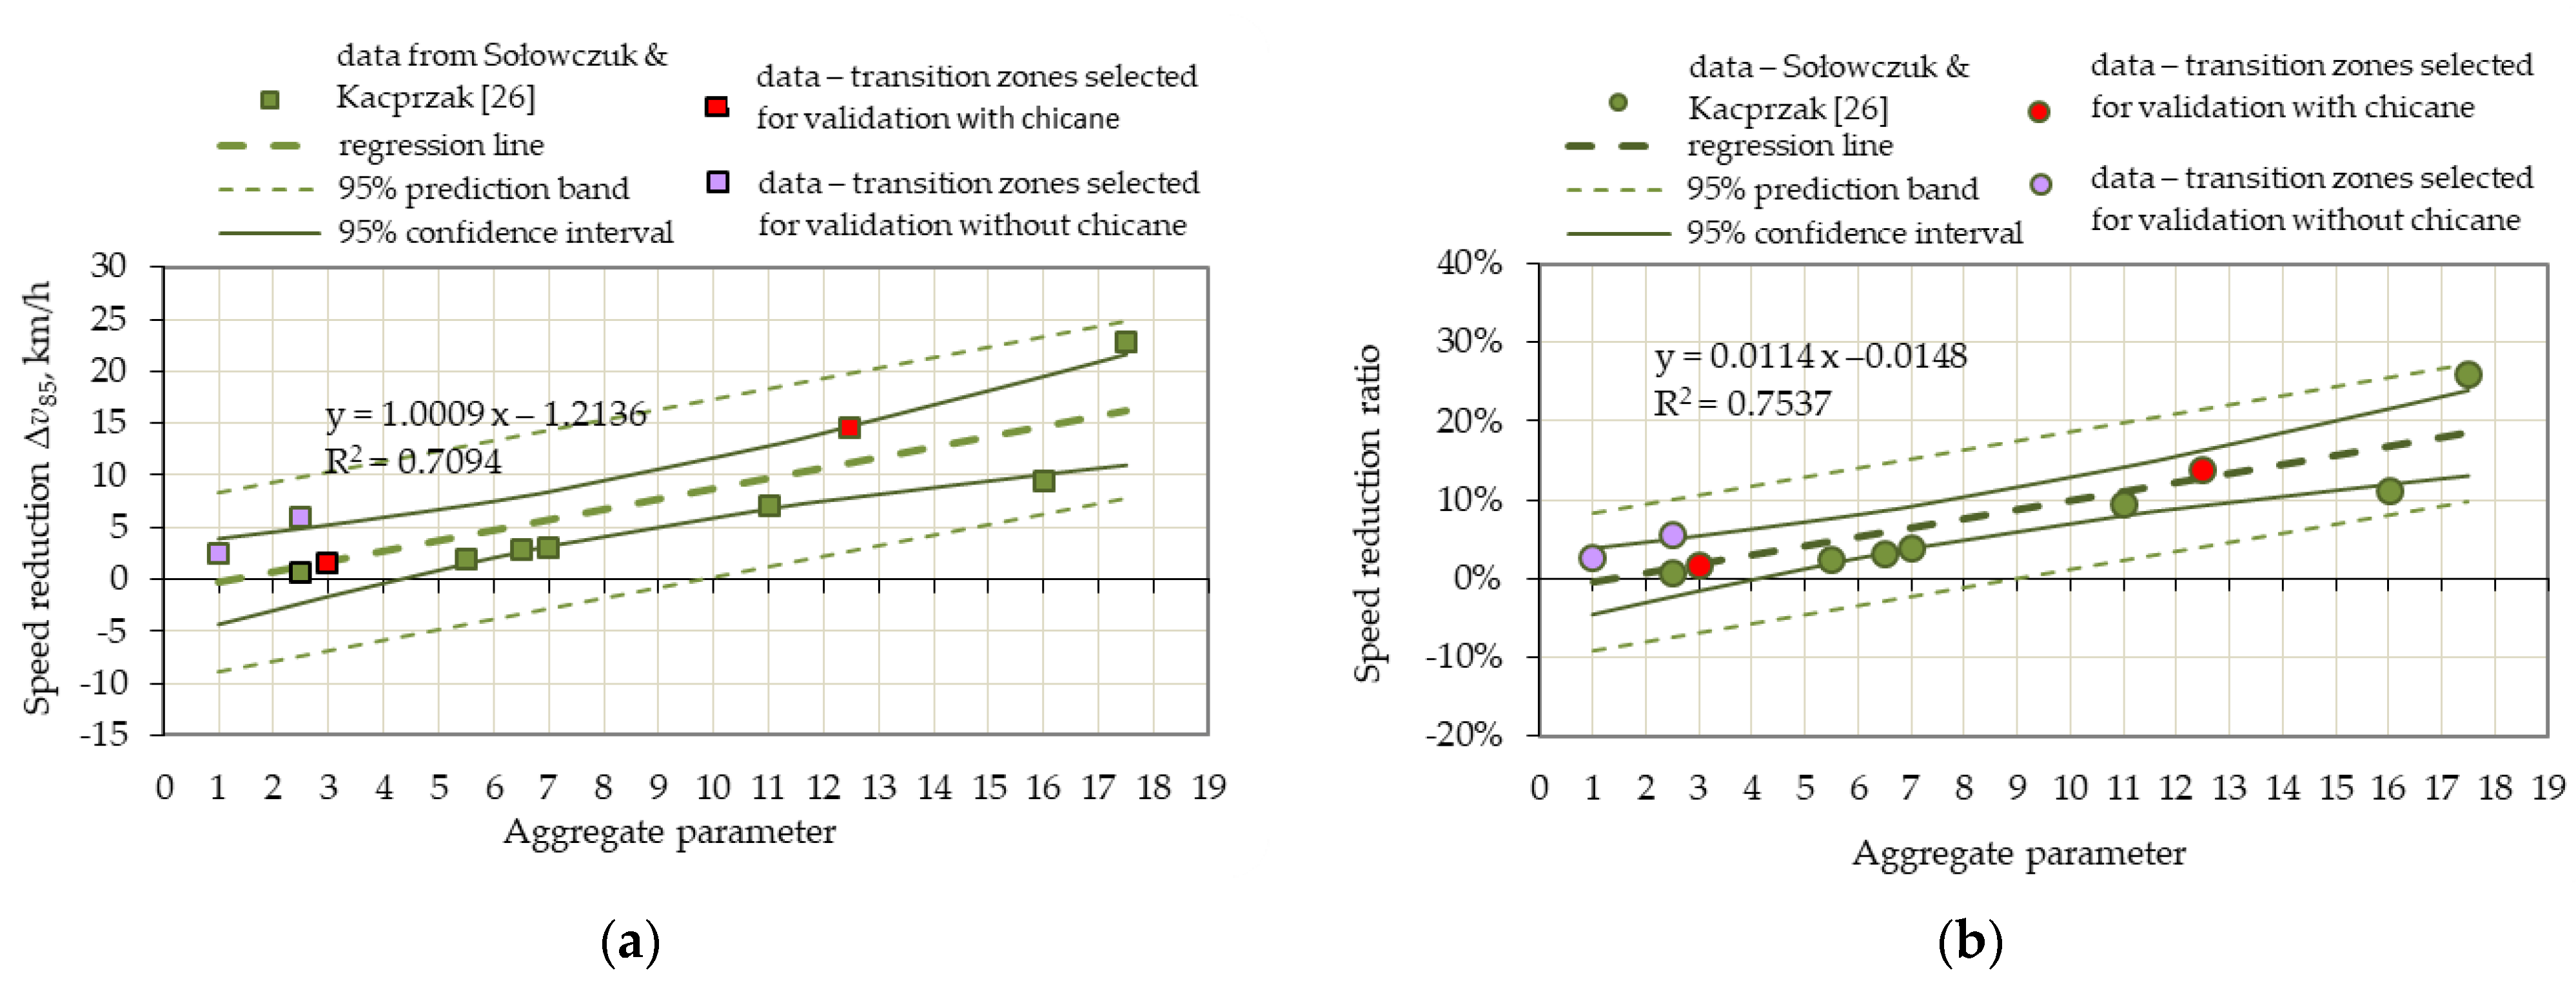
27]. The transition zones chosen for validation confirmed the established relationships since all but two of them fall within the 95% confidence interval in study area No. 3 (Figure 11).
Figure 9.
Linear regression function in the study area No. 1 defining the relationship between the aggregate parameter and speed reduction: (a) Speed reduction ∆v85; (b) Speed reduction ratio SRR. Source: own work of the authors.
Figure 10.
Linear regression function in the study area No. 2 defining the relationship between the aggregate parameter and speed reduction: (a) speed reduction ∆v85; (b) speed reduction ratio SRR. Source: own work of the authors.
Figure 11.
Linear regression function in the study area No. 3 defining the relationship between the aggregate parameter and speed reduction: (a) speed reduction ∆v85; (b) speed reduction ratio SRR. Source: own work of the authors.
The data presented in Figure 5, Figure 6 and Figure 7 confirm also that the chosen study areas should remain unchanged. This is so, because other factors operate in transition zones on 70 km/h roads and other ones characterise the transition zones with 50 km/h speed limit. In study area No. 3 smaller values of determination coefficient R2 were obtained, which is associated mainly with negative values of speed difference and a smaller number of logical tautologies, as well as very small horizontal deflection angles (1 m or 1.5 m). The presented results confirm also the conclusions given in [4,20,25,33], i.e., that central islands with a small horizontal deflection angle in transition zones are hardly effective as regards speed reduction.
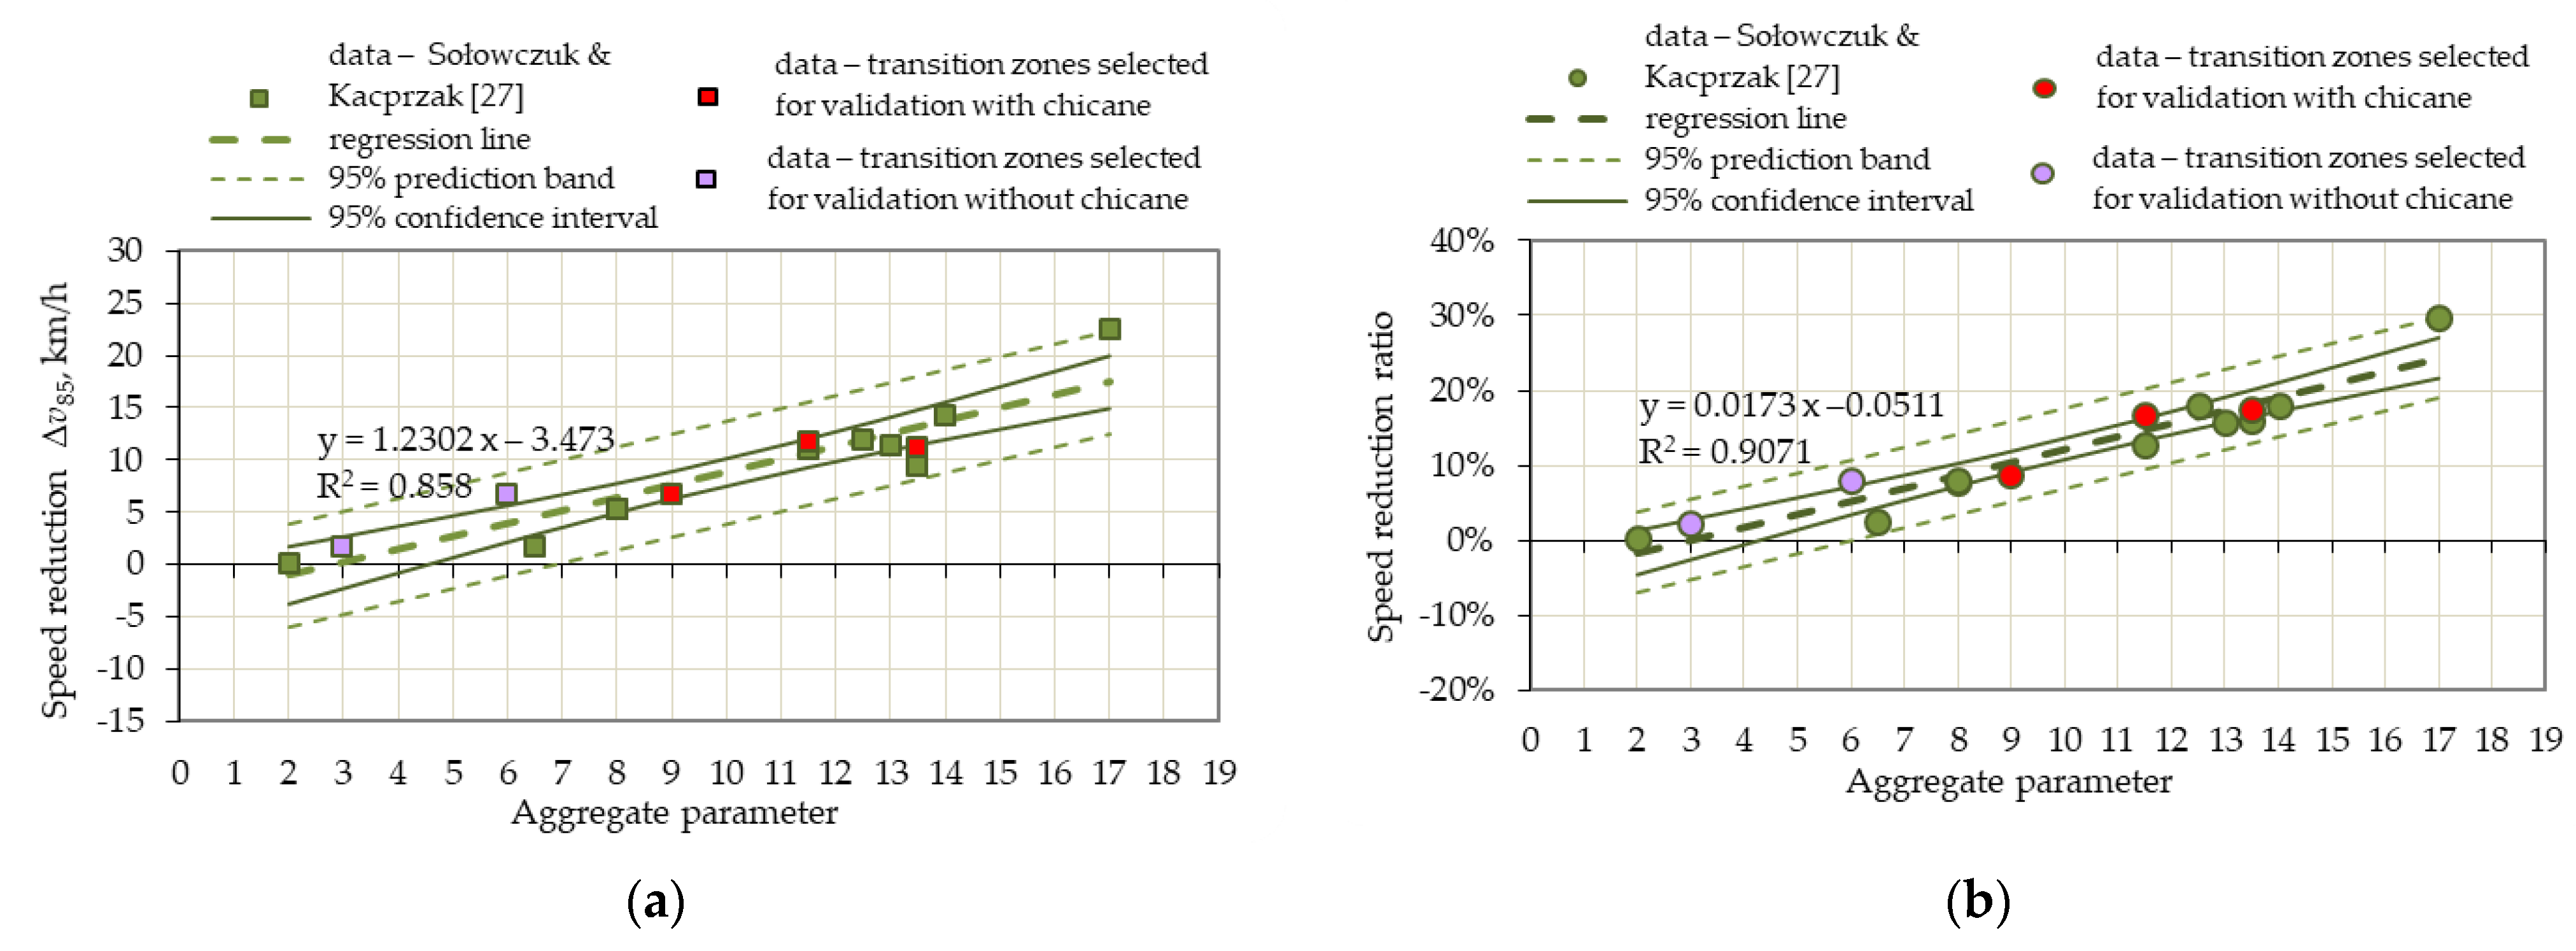
In order to obtain confirmation of the validity of the factors chosen in [26,27], correlation coefficients R, sums of the confirmed logical tautologies in each criterion and of the analysed speed distribution parameters in study area No. 3 and the coefficients of correlation R between the aggregated parameter and speed distribution parameters were compiled in Table 5 below. Bold characters denote correlation coefficients R greater than 0.7. Correlation coefficients R obtained in study area No. 3 confirm that although speed reductions may be in a significant way associated with the aggregate parameter, they are only slight, if any, due to a small horizontal deflection. Moreover, speed increases were even noted after passing the chicane.
Table 5.
Coefficients of correlation R between the sum of logical tautologies in the respective criteria or the aggregate parameter and the selected speed distribution parameters (transition zones in study area No. 3 only).
4. Discussion
Three criteria adopted in [26,27] and the factors characterizing the transition zone and its surroundings adopted preliminarily by authors were implemented in this article.
4.1. Traffic Management Criterion (TM)
In line with the research assumptions adopted in [26,27] under the TM criterion a preliminary analysis in the three study areas was performed, as presented in Figure 8. The factors are adopted preliminarily in study area No. 2 by authors [27] and implemented accordingly in the study area No. 3, with 50 km/h speed limit and central islands installed, are presented on the left side of Figure 8 against blue background. The choice of these factors was probably a direct result of the situations noted on site in the analysed transition zones. The central part of Figure 8 represents the quantification measures of the analysed logical tautologies adopted in [26,27]. The sums of logical tautologies in study areas No. 1 and No. 2 based on data given in [26,27], supplemented with the logical tautologies from the transition zones adopted for validation area shown on the right side of Figure 8. For better visual representation of the representative factors in this part of Figure 12, the sums of the noted logical tautologies greater than 4 are written in dark blue. Moreover, for better selection and ease of finding representative factors noted in the analysed transition zones in Figure 8, they are given in order from largest to smallest sum in respective study areas. An analysis of the data presented in Figure 12 indicates that the representative determinants in the study area No. 1 are different than the determinants in study areas No. 2 and No. 3, with a lower speed limit. Following a detailed analysis of the TM factors on 50 km/h roads [27] decided to:
- –
- Use the view of residential buildings on the approach to chicane (line 6) in place of the village skyline (line 10),
- –
- Use a different factor confirming the presence of a pedestrian crossing (line 4) in place of location of buildings after the road sign D-42 “city/town/village” (line 3),
- –
- Use in the study area No. 2 location of the 40 km/h and 50 km/h speed limit signs (line 7) instead of the location of the road sign B-33 (70 km/h) in study area No. 1 (line 2).
Figure 12.
Comparison of initially adopted TM factors in the analysed study areas based on [26,27]. Legend: oj—number of confirmed logical tautologies in all the analysed transition zones in a given study area; (–) indicates that the factor was excluded from consideration in a given study area.
Furthermore, noted in the study area No. 2 was an additional sign B-33 (70 km/h) in advance of the 50 km/h speed limit sign (line 8) and another B-33 40 km/h speed limit sign located after the chicane (line 9). In Figure 12 all the above replacement factors are presented against the blue background.
The analysis of the data presented in Figure 8 indicates that the most representative factors in study area No. 1 pertain to the location of sign B-33 (line 2), location of buildings after the sign D-42 (line 3) and the distance between these buildings and sign B-33 (line 5). While in study area No. 2 the most representative factors also pertain to the location of the B-33 sign (line 7), buildings in view after the D-42 sign (line 6) or pedestrian crossing (line 4) and the distance of the road infrastructure from the D-42 sign indicating the beginning of a built-up area (line 1). In the case of study area No. 3 only few factors were confirmed that disagreed with the representative factors in study areas No. 1 and No. 2. For the adopted TM factors, the following numbers of logical tautologies were confirmed in the respective study areas:
- –
- 19 No. in the study area No. 1,
- –
- 25 No. in the study area No. 2,
- –
- Only ca. 8 No. in the study area No. 3.
4.2. Road Conditions Criterion (RC)
The factors of the RC criterion initially adopted in [26,27] are presented in Figure 13. The chronology of the description used in Figure 12 is similar to the description of the TM criterion in Figure 8. However, different font colours were used for the respective factors. The additional factors taken into account in study area No. 2 [27], in line with the actual road conditions are shown against green background. The additional factors taken into account by the authors in this article (Section 2.2), that characterised the non-typical transition zone selected for validation in the study area No. 1, are presented against orange background. Horizontal deflection represented by line 1 in Figure 13, turned out to be one of the most important factors, as corroborated for instance by results given in the study in [11,33]. In [26] only two measures relating to horizontal deflection in study area No. 1, since in the transition zones under analysis all the horizontal deflections fell in the range of 1–2 m. In the study area No. 2, authors adopted in [27] only two measures relating to horizontal deflection, since all the horizontal deflections under analysis fell in the range of 2–6 m. Conversely, in study area No. 3 hand horizontal deflections were only 1–1.5 m. Taking the above into consideration when comparing the three analysed study areas, the authors entered respectively three quantification measures (Figure 13), combining all the research assumptions, in order to determine robust factors relevant to speed reduction.
Figure 13.
Comparison of initially adopted RC factors in the analysed study areas, based on [26,27]. Legend: dj—number of confirmed logical tautologies in all the analysed transition zones in a given study area; (–) indicates that the factor was excluded from consideration in a given study area.
In the study area No. 1, the greatest number of logical tautologies was noted for the three following factors: the above mentioned horizontal deflection (line 1), presence of a horizontal curve after the chicane (line 7) and small distance between an access point and chicane (line 4). In study area No. 2, the two previously mentioned factors relating to the presence of horizontal curves in study area No. 1 (lines 2 and 9), were replaced by a single factor, combining the full characteristics of the horizontal curve (line 2), for which a large number of research tautologies was also noted. The other factors with a large number of confirmed logical tautologies were small distances between access points and junctions and the chicane (lines 3 and 4) and two factors characterizing the location of buildings in the village (lines 6 and 8).
Two transition zones with untypically placed chicanes (Figure 5) were also chosen for validation. In one of the additional zones the presence of all initially chosen factors and speed reduction of 14.4 km/h were noted, while in the other one only one logical tautology related to horizontal deflection and the associated speed reduction by 1.5 km/h were observed. Considering that schemes involving installation of chicanes horizontally deflecting one traffic lane are increasingly often employed on straight in plane road sections, the authors still recommend that these four additional factors should be also considered valid for non-typical transition zones, if the zones include staggered chicanes deflecting the lanes in the opposite directions.
Keeping in mind the confirmed impact of gateways on slowing [20,22], which effect was neglected in [26,27], due to a lack of this treatment in the study areas No. 1 and No. 2, in the authors’ opinion this factor should be included in the RC criterion. Taking into account the recommendations given in [20,22], according to which a gateway should be located past the chicane, in advance of the speed limit related to the built-up area and that the gateway height should be greater than the carriageway width these two factors and their corresponding quantification measures should be added to the RC criterion.
Additionally, based on the study results Lantieri et al. [20] claimed that high kerbing on the edges of chicanes or central islands is highly relevant to speed reduction. However, this measure in agricultural areas may be an obstacle to farm vehicles, as they may have to run over such high kerb with one wheel, which will lead to its premature deterioration. It should also be noted that the use of mountable kerbs results in passenger car wheels running over them freely and surfacing the shoulder with asphalt millings results in passenger and other car wheels running over the shoulder without slowing (Figure 14 and Figure 15).
Figure 14.
Examples of poor design of horizontal deflection treatments related to the road surface construction: (a) Agricultural machine overrunning the shoulder surfaced with milled asphalt after passing the central island; (b) resulting road shoulder deterioration. Source: own work of the authors.
Figure 15.
Example of poor design in village transition zone: (a) example of high kerbing installed at the pedestrian refuge situated ca. 150 m from the central island; (b) grass strip deterioration caused by overrunning vehicle tyres, past the pedestrian refuge depicted in Figure 11a. Source: own work of the authors.
The strip of asphalt rubble “artificially” extends the travel lane sideways (Figure 14a), tempting the driver to negotiate the treatment without slowing. Figure 15a shows the existing design with high kerbing around the central island and along the carriageway edge. A missing element for the aggressive taper of 1:5 is hazard marker post to optically narrow the traffic corridor and thus make the drivers slow down. Taking the above into consideration, it is necessary to include an appropriate factor and its corresponding quantification measures into the factors under the RC criterion. However, considering the examples of shoulder, kerb or planting strip damage shown in Figure 14 and Figure 15 and the conclusions of the research in [11,57] it is necessary to include a factor related to the use of bollards at the entry to and exit from the chicane or central island, that determine the travel trajectory and have a strong impact on driver’s perception, which was presented in visualisations in [27]. Even with the overrun areas extending over the width of three natural paving stones, as shown in Figure 15b, damaged kerbs and wheel tracks at the exit from the village past the pedestrian refuge and at the entry to the village before the refuge are clearly visible, marked in Figure 15a by orange delineations. The arrow in Figure 15a indicates a central island situated ca. 150 m from a pedestrian refuge. Similar damage to the road shoulder, reaching even 0.7 m sideways of the carriageway edge was noted at the central island.
To sum up the discussion on transition zones in small villages, the problem transition zones on roads with paved shoulders still needs to be considered. An important result found in study area No. 2 was the analysis of the different speed reductions obtained for four one-sided chicanes with a 6 m horizontal deflection of the travel path, as described in detail in the article [27]. This large variation of the obtained speed reduction can be justified by the actual different factors in the three criteria (TM, RC, SLV), confirmed in situ in the analysed transition zones [27]. The conclusions drawn by Agkol et al. [29] has been tested in this study on a two-lane two-way road with roadway narrowing to one lane and the recommended use of two chicanes consecutively. However, considering that both lanes should be maintained on passing roads, the authors propose to add one more factor in the RD criterion and then apply one of the proposed solutions shown in Figure 16. The solution is to apply a bulb-outs island before the chicane and remove the paved shoulder after the chicane. However, no such studies have been carried out so far. This being so, in designing the proposed scheme the engineer can only refer to the principles of design of small roundabouts on roads with hard shoulders, removed before the roundabout. Thus, further research is needed, even with the use of road traffic simulation techniques.
Figure 16.
Chicane scheme, where the chicane is preceded by a bulb-out with removal of hard shoulders following the chicane: (a) with bollards; (b) with hedgerows. Source: own work of the authors.
Recapitulating the above observations, a compilation of the additional factors and their corresponding quantification measures, which should be taken into account in the RC criterion is given in Table 6.
Table 6.
Additional factors and their corresponding quantification measures.
4.3. Surrounding Landscape and Visibility Criterion (SLV)
Surrounding landscape and visibility (SLV) is the last criterion adopted in [26,27]. The factors in the three study areas are presented graphically in Figure 17 similarly to the previous criteria except for different colour coding. In the study area No. 2 authors applied five factors in addition (lines 8–12) to account for different surroundings or approach conditions with 50 km/h speed limit [27]. In the study area No. 1, the greatest number of confirmed logical tautologies was obtained for the surrounding landscape (line 1) and restricted view of the road ahead (line 5). In the study area No. 2, the greatest number of confirmed logical tautologies was obtained for the first six SLV factors (lines 1–5). In the study area No. 3, the most important factors were the surrounding features (line 1) and a view of the nearby village buildings (line 6) and their distance from the central island (line 4). No more logical tautologies which could increase slowing were found in this study area. The additional five factors at 50 km/h speed limit were noted only in rare cases and concerned primarily the driver’s perception and the associated driving speed on the approach to the chicane. The number of confirmed logical tautologies was small, yet whenever confirmed, they had a considerable effect on the achieved slowing.
Figure 17.
Comparison of initially adopted SLV factors in the analysed study areas based on the studies in [26,27]. Legend: zwj—number of confirmed tautologies on all the analysed transition zones in a given study area; (–) excluded from consideration in a given study area.
Presence of vegetation on the chicane or central island is an important factor related to the SLV criterion that previously was omitted in [26,27], as this was not the case in the study areas No. 1 and No. 2. According to [11,15] any vertical obstruction installed on the chicane which obscures the forward view has a determining effect on slowing. Croundall in [58] postulated distinguishing two types of driver’s eyeball movements: fixations and saccades. Fixations are movements made to focus on a given feature present in the visual scene and saccadea are ballistic jumps serving orientation in the space and shifting of focus from one point of interest to another. Figure 13 presents the share of driver’s attention paid to the different elements of the road, i.e., summed fixation on a single element, taking into account saccadea. The above theories on allocation of visual attention were confirmed also by the studies of Werneke & Vollrath [59], who additionally related perception of road elements in the inner fringe with the speed of travel. Fixations of the driver’s eyeballs and their orientation on features present in the inner fringe were also confirmed by Babkov [53] leading to the conclusion that the driver focuses the eyes primarily on the road centreline and its nearest surroundings (Figure 18), which confirms the relevance of soft landscaping in the chicane or central island to the slowing effect [15,20]. Dixon also made a distinction between lower and higher vegetation [15], which, when falling in the inner fringe, can hinder the view of the road ahead. Soft landscaping in chicanes is popularly used in the Netherlands with due attention paid in the guidelines [60] and report [4]. The conclusions from the studies by Babkov [53] and Chartier [43] are compiled in Figure 19 and an example of a chicane containing vegetation, located in the outskirts of a Dutch town is shown next to it (Figure 19).
Figure 18.
Conclusions of the studies by authors [26,27]. Source: own work of the authors.
Figure 19.
Example of a chicane containing vegetation. Source: Google Earth [61].
Additional factors should be included in the SLV criterion based on the conclusions made by Jun et al. [50] and Jägerbrand et al. [51,52] in their studies on the use of solar-powered devices installed in the chicane or central island kerbs and on the roadway edge and their effect on the driver’s perception and slowing down.
To sum up the above observations, additional factors to be included in the SLV criterion and the applicable quantification measures are compiled in Table 7.
Table 7.
Additional factors and the applicable quantification measures.
5. Conclusions
Altogether, ten factors have been proposed in the TM criterion, eighteen in the RC criterion, including the new factors and fifteen in the SLV criterion. From the data presented in Figure 4, Figure 5 and Figure 6 it transpires that for a minimum speed reduction of 5 km/h at least 6–8 robust logical tautologies should be confirmed in the field.
In the case of existing transition zones with a chicane or central island, in which the desired slowing was not achieved, it would be advisable to apply a few factors which are likely to increase the speed reduction. Cheaper options, such as gateways, solar-powered devices fitted in the kerbs and on the roadway edge, barriers [10] (p. 11 Figure 7) or hedgerows [4] (p. 46 Appendix A), solar-powered lighting, etc., can be used in this case.
On the other hand, in the case of transition zones planned as part of the road renewal projects it is recommended to analyse the road surroundings as the first step (for example by examining satellite imagery of the approach section to the village) and on this basis locate a chicane or central island, considering various relevant factors, such as view of the village skyline or scattered buildings, presence of road infrastructure elements, etc. Next, the appropriate amount of horizontal deflection should be determined, taking into consideration the available width of the right-of-way. For transition zones located on a straight section with a narrow right-of-way it is advisable to analyse the possible horizontal deflection of the route with shifting the road centreline in order to fit in a minimum 3 m wide chicane deflecting one lane. Use of vegetation, solar-powered devices, barriers or hedgerows is also suggested for planned transition zone schemes to improve the effectiveness of speed reduction measures, in line with the conclusions of the studies of [11,15,20,22,50,51,52].
Author Contributions
Conceptualisation, A.S.; methodology, A.S.; validation, A.S., D.K.; formal analysis, A.S. and D.K.; investigation, D.K.; resources, D.K.; data curation, D.K.; writing—original draft preparation, A.S. and D.K.; writing—review and editing, A.S. and D.K.; visualisation, A.S. and D.K.; supervision, A.S.; project administration, D.K.; funding acquisition, D.K. All authors have read and agreed to the published version of the manuscript.
Funding
The research included in the paper are partly financed by Dean Grants of Faculty of Civil and Architecture Engineering West Pomeranian University of Technology in Szczecin: DKD Decision No. 517-02-033-6728/17.
Institutional Review Board Statement
Not applicable.
Informed Consent Statement
Not applicable.
Data Availability Statement
Not applicable.
Conflicts of Interest
The authors declare no conflict of interest.
References
- Traffic Calming Guidelines; Devon County Council Engineering & Planning Department: Devon, UK, 1992.
- Urban Traffic Areas—Part 7—Speed Reducers; Vejdirektoratet-Vejregeludvalget: Copenhagen, Denmark, 1991.
- Vahl, H.G.; Giskes, J. Traffic Calming through Integrated Urban Planning; Amarcande: Paris, France, 1990. [Google Scholar]
- Stamatiadis, N.; Kirk, A.; Cull, A.; Dahlem, A. Transition Zone Design—Final Report; Research Report Kentucky Transportation Center KTC—13-14/SPR431-12-1F; University of Kentucky: Lexington, MA, USA, 2013. [Google Scholar]
- Guidelines for Urban/Rural Speed Thresholds, RTS 15; Land Transport Safety Authority: Wellington, New Zealand, 2002.
- Poe, C.M.; Tarris, J.M.; Mason, J.M. Relationship of Operating Speeds to Roadway Geometric Design Speeds; Report FHWA-RD-96-024, PTI RR 9606; Pennsylvania State University: University Park, PA, USA; Federal Highway Administration: Washington, DC, USA, 1996.
- Prato, C.G.; Rasmussen, T.K.; Kaplan, S. Risk Factors Associated with Crash Severity on Low-Volume Rural Roads in Denmark. J. Transp. Safety Secur. 2014, 6, 1–20. [Google Scholar] [CrossRef]
- Urban Traffic Areas, Booklet 3, Cross-sectional Profiles; Danish Road Directorate—Road Regulation Committee DRD-RRC: Copenhagen, Denmark, 2000.
- Roads Development Guide; Strathclyde Roads & South Ayrshire Council SAC: Ayrshire, UK, 1995.
- Sayer, I.A.; Parry, D.I. Speed Control Using Chicanes—A Trial At TRL; TRL Project Report PR 102; Transport Research Laboratory: Crowthorne, UK, 1994. [Google Scholar]
- Sayer, I.A.; Parry, D.I.; Barker, J.K. Traffic Calming—An Assessment of Selected On-Road Chicane Schemes, Report 313; Transport Research Laboratory TRL: Crowthorne, UK, 1998. [Google Scholar]
- Crevier, C. Les Aménagements en Modération de la Circulation, Étude et Applications; École De Technologie Supérieure Université Du Québec: Montreal, Canada, 2007. [Google Scholar]
- Directives for the Design of Urban roads. RASt 06; Road and Transportation Research Association; Working Group Highway Design; FGSV: Kӧln, Germany, 2006.
- Safe Road Design Manual, Amendments to the WB Manual; Transport Rehabilitation Project ID PO75207; Swedish National Road Consulting AB (SweRoad): Solna, Sweden, 2011.
- Dixon, K.; Hong Zhu, H.; Ogle, J.; Brooks, J.; Hein, C.; Aklluir, P.; Crisler, M. Determining Effective Roadway Design Treatments for Transitioning from Rural Areas to Urban Areas on State Highways; Final Report SPR 631, FHWA-OR-RD-09-02; Federal Highway Administration: Washington, DC, USA, 2008.
- Guidelines for Traffic Calming, Public Works; Traffic Division; City of Sparks: Sparks, NV, USA, 2007.
- Streetscape Design Guidelines, Chapter 6; City of Seattle Staff Directory: Seattle, DC, USA, 2020.
- Curtis, L. Traffic Calming of Towns and Villages on National Roads; RS 472, Traffic Advisory Leaflet 1/05; Department for Transport: London, UK, 2008.
- Berger, W.J.; Linauer, M. Speed Reduction at City Limits by Using Raised Traffic Islands; Institut fuer Verkehrswesen, Universitaet fuer Bodenkultur: Vienna, Austria, 1998. [Google Scholar]
- Lantieri, C.; Lamperti, R.; Simone, A.; Costa, M.; Vignali, V.; Sangiorgi, C.; Dondi, G. Gateway design assessment in the transition from high to low speed areas. Transp. Res. Part F Traffic Psychology Behav. 2015, 34, 41–53. [Google Scholar] [CrossRef]
- Jateikienė, L.; Andriejauskas, T.; Lingytė, I.; Jasiūnienė, V. Impact assessment of speed calming measures on road safety. Transp. Res. Procedia 2016, 14, 4228–4236. Available online: https://cyberleninka.org/article/n/1426267 (accessed on 18 March 2020). [CrossRef] [Green Version]
- Mok, J.H.; Landphair, H.C.; Rosenblatt-Naderi, J. Landscape improvement impacts on roadside safety in Texas. Landsc. Urban Plan. 2006, 78, 263–274. [Google Scholar] [CrossRef]
- Hummel, T.; Mackie, A.; Wells, P. Traffic Calming Measures in Built-Up Areas; Literature Review, PR/SE/622/02 Vägverket TR80 2002:15779; Swedish National Road Administration: Vägverket, Sweden, 2002. Available online: https://citeseerx.ist.psu.edu/viewdoc/download?doi=10.1.1.585.960&rep=rep1&type=pdf (accessed on 18 September 2021).
- Global Status Report on Road Safety 2018; World Health Organization WHO: Geneva, Switzerland, 2018; Available online: http://apps.who.int/iris/bitstream/handle/10665/277370/WHO-NMH-NVI-18.20-eng.pdf?ua=1 (accessed on 18 June 2021).
- Forbes, G.J. Speed Reduction Techniques for Rural High-to-Low Speed Transitions. A Synthesis of Highway Practice; TRB’s National Cooperative Highway Research Program (NCHRP) Synthesis 412; Transportation Research Board: Washington, DC, USA, 2011; pp. 1–111. Available online: https://www.infrastructureusa.org/wp-content/uploads/2011/04/nchrp_syn_412.pdf (accessed on 18 June 2020).
- Sołowczuk, A.; Kacprzak, D. Identification of the Determinants of the effectiveness of on-road chicanes in transition zones to villages subject to a 70 km/h speed limit. Energies 2020, 13, 5244. [Google Scholar] [CrossRef]
- Sołowczuk, A.; Kacprzak, D. Identification of the determinants of the effectiveness of on-road chicanes in transition zones to villages subject to a 50 km/h speed limit. Energies 2021, 14, 4002. [Google Scholar] [CrossRef]
- Local Transport Note 01/07; Traffic Calming; Department for Regional Development (Northern Ireland) DTDRD N-I: London, UK, 2007. Available online: https://assets.publishing.service.gov.uk/government/uploads/system/uploads/attachment_data/file/918429/ltn-1-07_Traffic-calming-guidance.pdf (accessed on 10 January 2020).
- Akgol, K.; Gunay, B.; Aydin, M.M. Geometric optimisation of chicanes using driving simulator trajectory data. In Proceedings of the Institution of Civil Engineers—Transport; Transport ICE Publishing: London, UK, 2019; pp. 1–11. [Google Scholar] [CrossRef]
- Distefano, N.; Leonardi, S. Effects of speed table, chicane and road narrowing on vehicle speeds in urban areas. In Proceedings of the VI International Symposium New Horizons 2017 of Transport and Communications, Sarajevo, Bosnia and Herzegovina, 17–18 November 2018; Available online: https://www.researchgate.net/publication/328738163_EFFECTS_OF_SPEED_TABLE_CHICANE_AND_ROAD_NARROWING_ON_VEHICLE_SPEEDS_IN_URBAN_AREAS (accessed on 10 January 2020).
- Gonzalo-Ordena, H.; Pérez-Acebob, H.; Unamunzagaa, A.L.; Arcea, M.R. Effects of traffic calming measures in different urban areas. Transp. Res. Procedia 2018, 33, 83–90. [Google Scholar] [CrossRef]
- Yilmaz, S.; Yildiz, N.D.; Irmak, M.A.; Yilmaz, H. Livable city: An approach to pedestrianization through tactical urbanism. Alex. Eng. J. 2014, 58, 251–259. [Google Scholar] [CrossRef]
- Wirksamkeit Geschwindigkeitsdämpfender Maßnahmen Außerorts; Dezernat Verkehrssicherheit und Verkehrstechnik; Hessisches Landesamt für Straßen—Und Verkehrswesen: Hessen, Germany, 1997. Available online: https://mobil.hessen.de/sites/mobil.hessen.de/files/content-downloads/Wirksamkeit%20geschwindigkeitsd%C3%A4mpfender%20Ma%C3%9Fnahmen%20au%C3%9Ferorts.pdf (accessed on 10 January 2020).
- Ariën, C.; Brijs, K.; Brijs, T.; Ceulemans, W.; Vanroelen, G.; Jongen, E.; Daniels, S.; Wets, G. Does the effect of traffic calming measures endure over time? A simulator study on the influence of gates. Geogr. Psychol. Transp. Res. Part Traffic Psychol. Behav. 2013, 22, 63–75. [Google Scholar] [CrossRef]
- Afghari, A.P.; Haque, M.M.; Washington, S. Applying fractional split model to examine the effects of roadway geometric and traffic characteristics on speeding behaviour. Bus. Med. Eng. Traffic Inj. Prev. 2018, 19, 860–866. [Google Scholar] [CrossRef] [PubMed] [Green Version]
- Theeuwes, J.; van der Horst, R.; Kuiken, M. Designing Safe Road Systems: A Human Factors Perspective, 1st ed.; Taylor & Francis Group: London, UK, 2012. [Google Scholar] [CrossRef]
- A Policy in Geometric Design of Highways and Streets; American Association of State Highway Transportation Officials AASTO: Washington, DC, USA, 2004.
- Lamm, R.; Cafiso, S.; La Cava, G.; Beck, A. To What Extent the Human Being Is So Far Regarded in Modern Highway Geometric Design—An International Review and a Personal Outlook, Compendium of Papers CD-ROM. In Proceedings of the 3rd International Symposium on Highway Geometric Design, Chicago, IL, USA, 29 June–1 July 2005. [Google Scholar]
- Stamatiadis, N. International Scanning Tour on Highway Geometric Design; FHWA-PL-01-026; Federal Highway Administration: Washington, DC, USA, 2000.
- Rosenblatt-Naderi, J. Landscape design in the clear zone: Effect of landscape variables on pedestrian health and driver safety. Transp. Res. Rec. 2003, 1851, 119–130. [Google Scholar] [CrossRef] [Green Version]
- Andersson, P.K.; Kjemtrup, K. Byporte: Hvordan gøres Designet Trafiksikkert? pp. 26–28. Available online: https://www.trafitec.dk/sites/default/files/publications/byporte%20artikel.pdf (accessed on 10 January 2020).
- Caliendo, C.; de Guglielmo, M.L. Road Transition zones between the rural and urban environment: Evaluation of speed and traffic performance using a microsimulation approach. J. Transp. Eng. 2012, 139, 295–305. [Google Scholar] [CrossRef]
- Chartier, G. Rural-Urban Transition Zones: Problems, Principles, and Practice; Presentation to the ITE BC Interior; Canada’s Community of Transportation Professionals: Kamloops, BC, Canada, 2009. [Google Scholar]
- Lamberti, R.; Abate, D.; De Guglielmo, M.L.; Dell’Acqua, G.; Esposito, T.; Galante, F.; Mauriello, F.; Montella, A.; Pernetti, M. Perceptual measures and physical devices for traffic calming along a rural highway crossing a small urban community: Speed behavior evaluation in a driving simulator. In Proceedings of the Transportation Research Board 88th Annual Meeting, Washington DC, USA, 11–15 January 2009; pp. 1–15. Available online: https://trid.trb.org/view/882174 (accessed on 18 January 2020).
- Yssaad, R. Analyse Psychophysique du Champ Visuel—Détection, Identification, Effet de groupement et Apprentissage Perceptif. Ph.D. Thesis, Université Lumière, Lyon, France, 28 September 2001. Available online: http://theses.univ-lyon2.fr/documents/lyon2/2001/yssaad_r#p=0&a=top (accessed on 18 July 2021).
- Xu, T.; Sun, X.; Wang, W.; He, Y. Speed transition zone design based on driving simulator research. In Proceedings of the Tenth International Conference of Chinese Transportation Professionals (ICCTP), Beijing, China, 4–8 August 2010; Available online: https://ascelibrary.org/doi/abs/10.1061/41127%28382%2945 (accessed on 10 February 2020).
- Wang, X.; Bie, Y.; Qiu, T.Z.; Niu, L. Effect of speed limits at speed transition zones. Can. J. Civil Eng. 2017, 44, 10–17. [Google Scholar] [CrossRef]
- Stamatiadis, N.; Pigman, J.; Hartman, D. Safety Consequences from Flexibility in Highway Design for Rural Communities; Final Report NCHRP 15-22; TRB, National Research Council: Washington, DC, USA, 2004.
- Roads Development Guide; Strathclyde Regional Council: East Ayrshire, UK, 1995.
- Jun, W.; Ha, J.; Jeon, B.; Lee, J.; Jeong, H. LED traffic sign detection with the fast radial symmetric transform and symmetric shape detection. In Proceedings of the 2015 IEEE Intelligent Vehicles Symposium (IV), Seoul, Korea, 28 June–1 July 2015. [Google Scholar] [CrossRef]
- Jägerbrand, A.K.; Johansson, M.; Laike, T. Speed responses to speed humps as affected by time of day and light conditions on a residential road with light-emitting diode (LED) road lighting. Safety 2018, 4, 10. [Google Scholar] [CrossRef] [Green Version]
- Jägerbrand, A.K.; Sjöbergh, J. Speed responses of trucks to light and weather conditions. J. Cogent Eng. 2019, 6, 1685365. Available online: https://www.tandfonline.com/doi/full/10.1080/23311916.2019.1685365 (accessed on 10 February 2020). [CrossRef]
- Babkov, V.F. Road Design Parameters and the Safety of Traffic; WKŁ: Warszawa, Poland, 1975. [Google Scholar]
- Lamm, R.; Choueri, E.M.; Psarianos, B.P. A practical safety approach to highway geometric design, international case studies. In Proceedings of the International Symposium on Highway Geometric Design Practices, Boston, MA, USA, 30 August–1 September 1995. [Google Scholar]
- Logic, Chapter 1; University of Victoria, Department of Mathematics and Statistics: Victoria, BC, Canada, 2015; Available online: https://www.math.uvic.ca/faculty/gmacgill/guide/Logic.pdf (accessed on 18 July 2021).
- Taylor, J.R. An Introduction to Error Analysis. The Study of Uncertainties in Physical Measurements, 2nd ed.; University Science Books: Sausalito, CA, USA, 1997. [Google Scholar]
- Yang, Q.; Overton, R.; Han, L.D.; Yan, X.; Richards, S.H. Driver behaviours on rural highways with and without curbs—A driving simulator based study. Int. J. Inj. Control. Safety Promot. 2013, 21, 115–126. [Google Scholar] [CrossRef] [PubMed]
- Crundall, D.; Underwood, G. Visual attention while driving. In Handbook of Traffic Psychology; Porter, B.E., Ed.; Elsevier: Amsterdam, The Netherlands, 2011; pp. 137–148. [Google Scholar] [CrossRef]
- Werneke, J.; Vollrath, M. What does the driver look at? The influence of intersection characteristics on attention allocation and driving behawior. Accid. Anal. Prev. 2012, 45, 610–619. [Google Scholar] [CrossRef] [PubMed]
- van Schagen, I. (Ed.) Traffic Calming Schemes, Opportunities and Implementation Strategies, R-2003-22; SWOV Institute for Road Safety Research: Leidschendam, The Netherlands, 2003; Available online: https://www.gtkp.com/assets/uploads/20100110-011359-5067-R-2003-22.pdf (accessed on 18 July 2021).
- Google Earth. Available online: http://www.earth.google.com (accessed on 15 July 2019).
Publisher’s Note: MDPI stays neutral with regard to jurisdictional claims in published maps and institutional affiliations. |
© 2021 by the authors. Licensee MDPI, Basel, Switzerland. This article is an open access article distributed under the terms and conditions of the Creative Commons Attribution (CC BY) license (https://creativecommons.org/licenses/by/4.0/).