Abstract
The present paper compares the flow structure and flame dynamics during combustion of methane and syngas in a model gas-turbine swirl burner. The burner is based on a design by Turbomeca. The fuel is supplied through injection holes between the swirler blades to provide well-premixed combustion, or fed as a central jet from the swirler’s centerbody to increase flame stability via a pilot flame. The measurements of flow structure and flame front are performed by using the stereo particle image velocimetry and OH planar laser-induced fluorescence methods. The measurements are performed for the atmospheric pressure without preheating and for 2 atm with the air preheated up to 500 K. The flow Reynolds numbers for the non-reacting flows at these two conditions are 1.5 × 10³ and 1.0 × 10³, respectively. The flame dynamics are analyzed based on a high-speed OH* chemiluminescence imaging. It is found that the flame dynamics at elevated conditions are related with frequent events of flame lift-off and global extinction, followed by re-ignition. The analysis of flow structure via the proper orthogonal decomposition reveals the presence of two different types of coherent flow fluctuations, namely, longitudinal and transverse instability modes. The same procedure is applied to the chemiluminescence images for visualization of bulk movement of the flame front and similar spatial structures are observed. Thus, the longitudinal and transverse instability modes are found in all cases, but for the syngas at the elevated pressure and temperature the longitudinal mode is related to strong thermoacoustic fluctuations. Therefore, the present study demonstrates that a lean syngas flame can become unstable at elevated pressure and temperature conditions due to a greater flame propagation speed, which results in periodic events of flame flash-back, extinction and re-ignition. The reported data is also useful for the validation of numerical simulation codes for syngas flames.
1. Introduction
The efficient combustion of synthesis gas or ‘syngas’ in gas turbines is becoming more relevant due to the development of integrated gasification combined cycle (IGCC) power plants, where the products of coal gasification are burned in gas turbines [1]. Moreover, syngas can be obtained from biomass and even some types of waste [2]. Therefore, the studies of syngas combustion at elevated pressure and temperature conditions are important. Modern low-emission gas turbine combustors are based on a lean premixed combustion technology [3]. The optimization of the flow aerodynamics allows organizing efficient fuel combustion with low concentrations of both CO and NOx in combustion products. In particular, NOx lower than 5 ppm (corrected to 15% O2) can be obtained for modern swirl burners [4,5,6]. However, it is well recognized that the lean combustors are prone to unstable operation and thermoacoustic pulsations [7,8], which results in reduced efficiency of the burning and leads to damage to the turbine. Therefore, it is important to study the contribution of different physical and chemical processes to the feedback mechanism of the thermoacoustic resonance [9,10,11,12]. Another important issue for syngas premixed flames in lean combustors is an increased probability of the flame flash-back due to the increased turbulent flame speed because of the hydrogen presence [13,14].
Modern optical measurement techniques provide detailed information on the local pulsations of the gas velocity, temperature, and species concentration. However, such measurements are quite expensive and difficult for real combustion chambers due to several reasons, including strong vibrations and limited optical access. Therefore, the impact of different processes on unsteady flow and flame dynamics is performed for research combustion sectors, which are equipped with observation windows, allowing for detailed optical measurements and modeling basic phenomena in real combustors [15,16,17,18,19,20,21,22]. Nowadays, planar optical methods like the particle image velocimetry (PIV) and planar laser-induced fluorescence (PLIF) have become very popular for the measurements of flow structure and dynamics and for the analysis of flow/flame interactions [23,24,25,26].
PLIF provides the detection of different types of molecules in a selected cross-section of the reacting flow studied, including OH, CO, NO, SO2, and others [27,28,29,30,31,32,33]. Therefore, the PIV and PLIF methods are used simultaneously for the measurements of the velocity flow field and visualization of high-temperature regions, where chemical reactions take place. In particular, PLIF for HCO or simultaneously for HCHO and OH can be used to visualize the regions with intensive heat release [34,35,36,37,38]. Two-line or thermally-assisted OH PLIF can be used for the evaluation of temperature fields hot combustion products [39,40,41,42]. Since swirl-stabilized combustors for gaseous or liquid fuels are commonly used in gas turbines, the flow and flame for their models are intensively studied by using the PIV and OH PLIF methods [43,44,45]. There is also a growing interest in the optical diagnostics of syngas combustion in swirl-stabilized burners [21].
Currently, the flow structure and dynamics, the flame stability and thermoacoustic pulsations, flame blow-off or flash-back are studied for different types of model and realistic gas-turbine swirl burners. The most popular ones among them are a low-swirl injector [4,5,8,14], a TECFLAM burner [46], model combustors based on a design by Turbomeca (a generic nozzle studied in Janus and others [15,47] and a model gas-turbine burner studied in Meier and others [7,24]), a G30 dry low emission burner by Siemens [48,49,50], a dual-swirler as a model of air-blast injector [16,23]. There are also a number of papers for dual swirlers of more sophisticated designs, e.g., LPP (lean premixing prevaporizing, [51,52]) and PERM (partially evaporated, rapidly mixed, [53,54]) injectors by Avio or so-called BIMER experimental setup [55,56]. There are also some studies for triple swirlers [57,58,59] and for realistic burners, like different lean premixed prevaporized injectors (see studies in cooperation with General Electric [18,20], Rolls-Royce [17,19,22,60], Jaxa [45], and other companies [61,62]) and lean premixed burners by Siemens [21,63].
There are also several detailed studies of flame dynamics and flow structure for syngas combustion under gas-turbine conditions for simple flame configurations [64] and for model [65,66,67,68] and realistic [69,70,71] swirl burners. It is generally recognized that the methane replacement by syngas leads to flame flash-back problems due to a higher flame propagation speed. It is also noted that the flame propagation speed affects the frequency (and mode) of thermo-acoustic instabilities [66,70]. Therefore, further investigations of syngas flame dynamics and stability in swirl-stabilized combustion chambers are needed.
The present paper compares the flow and flame dynamics for methane and syngas burning in a model gas-turbine combustor based on the design by Turbomeca [15] utilizing PIV, OH PLIF measurements, and high-speed imaging of OH* chemiluminescence. The data is processed by a snapshot proper orthogonal decomposition (POD) to extract large-scale coherent structures [72]. Section 2 of the paper provides details on the experimental setup and data processing. The time-averaged data are reported in Section 3.1. The coherent structures, extracted from the PIV/PLIF data OH* images, are discussed in Section 3.2 and Section 3.3, respectively. The obtained results demonstrate that at elevated pressure and temperature conditions, syngas lean flames can become unstable due to periodical events of flame flash-back, extinction, and re-ignition.
2. Experimental Setup
2.1. Combustor
The details on the combustion chamber, including a 3D model of the geometry, can be found in [47]. The combustion chamber is equipped with observation windows, which are made of fused silica and provide flame observation and optical diagnostics for the pressure up to 8 atm. A radial swirler is placed upstream of the inlet (with the inner diameter D of 37 mm) of the combustion chamber. The chamber outlet is organized by an axisymmetric contraction choked nozzle. The throat of the nozzle is cooled by water. The air is supplied through the swirler and two peripheral slots inside the chamber. The slots are used for the film-cooling of the observation windows and contraction nozzle.
The swirler provides two zones of gas combustion, viz., a pilot central jet and a main premixed zone. Therefore, the fuel gas can be supplied from a central nozzle drilled through the centerbody of the swirler, or between the vanes of the swirler. The air and fuel flow rates are controlled by mass-controllers (Bronkhorst). Methane and syngas (H2/CO mixture) are supplied from pressurized vessels. In practice, the syngas composition differs strongly depending on a feedstock, processing technology, and gas treatment [73]. In laboratory studies, the H2:CO ratio is often fixed as 1:2 or 1:1 (e.g., [74]) by referring to coal or oil gasification processes, respectively [1]. For simplicity, the 1:1 H2/CO mixture is used in the present case, expecting a higher flash-back effect for the greater hydrogen content. The global equivalence ratios of the studied flames are 0.33 and 0.2 for the methane and syngas, respectively. The ratios between the flowrates of the pilot and main fuel are 0.3 and 0.17, respectively. These flowrates were selected close to lean blow-off conditions for the flames.
The swirler is mounted between the combustion chamber and a cylindrical plenum chamber, equipped with a cord-shaped electric wire heater for the air preheating and a perforated plate to produce well-determined inflow conditions. The flows were studied for the normal (293 K and 1 atm.) and elevated (500 K and 2 atm.) temperature and pressure. The Reynolds numbers for non-reacting air flows at these conditions are 1.5 × 10⁴ and 1 × 10⁴, respectively. The flame parameters are provided in Table 1 (please note that the values of normal liter per minute, ln/min, correspond to the normal temperature and pressure standard of NIST). For the PIV measurements, the air flow was seeded with TiO2 solid particles by a mechanical mixer, placed upstream of the plenum chamber.

Table 1.
Flame parameters.
2.2. Measurement Equipment
The used stereo PIV system consisted of 4 Mpix CCD cameras (ImperX Bobcat IGV-B2020) and a double-head pulsed Nd:YAG laser (Beamtech Vlite 200). The cameras were equipped with optical lenses (Sigma 105 mm) with scheimpflug adapters and band-pass (532 ± 5 nm) optical filters. The PIV system was combined with a OH PLIF system (see Figure 1), which consisted of a tunable dye laser (Sirah Precision Scan), pumped by a pulsed Nd:YAG laser (QuantaRay) and an sCMOS camera equipped with an intensifier (LaVision IRO). The radiation of the dye laser passed through BBO doubling crystal to obtain the wavelength of 283 nm to excite the fluorescence of OH for the Q1(8) line of the A2Σ+–X2Π (1–0) band. The fluorescence images were captured by the intensified camera, equipped with an optical lens, made of fused silica, and a band-pass optical filter (300–320 nm). The lasers and cameras were synchronized by a TTL signal generator.
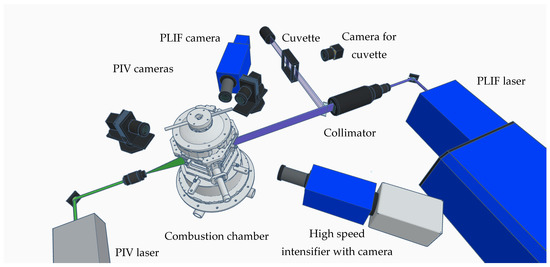
Figure 1.
The scheme of the experimental setup.
The cameras were also spatially calibrated by putting a flat calibration target inside the combustion chamber, imaged in different normal-to-plane locations prior to the experiments. A part of the PLIF laser sheet was reflected into a calibration cuvette, filled with Rhodamine solution. The fluorescence inside the cuvette was captured by another CCD camera (ImperX Bobcat IGV-B4820) to compensate for a non-uniform laser sheet distribution during PLIF image processing. It was also used to account for the shot-to-shot fluctuations of PLIF laser energy. The PLIF laser pulse was arranged between the time interval of two PIV laser shots. The exposition of the PLIF camera was 200 ns.
High-speed visualization of the flame dynamics was performed separately by using a high-speed intensifier (LaVision high-speed IRO) connected to a CMOS camera (Photron SA5). The intensifier included an S20 photocathode and was equipped with another fused silica UV lens and a band-pass optical filter for OH* (300–340 nm). The acquisition frame rate was 9.9 kHz. Direct images of the flames were also captured by using a photo camera.
2.3. Data Processing
The images were stored and processed by using an in-house “ActualFlow” software. The PIV images were processed by an iterative cross-correlation algorithm with continuous window shift and deformation [75]. The stereo calibration and reconstruction are based on 3rd-order polynomial mapping functions, evaluated for each camera during the stereo calibration [76]. The same model was used for the back-projection of the PLIF images. Before that, the PLIF images were processed to remove a background signal (captured without combustion, when the PLIF laser was running), correct for the non-uniform laser sheet and energy variation, account for the laser beam attenuation during the absorption inside the combustion chamber [47]. In total, 1500 snapshots of the PIV/PLIF data were captured for each flame case.
Afterwards, the PIV/PLIF snapshots were processed by a proper orthogonal decomposition method. This was done based on the singular value decomposition (SVD) of the data matrix [77] U = [u′(x, t1)… u′(x, tN)], where u′(x, ti) is the snapshot of fluctuating velocity at the time instant ti.
Here, the matrix of left-singular vectors W = [ϕ1(x)…ϕN(x)] contains the POD modes, VT corresponds to the normalized temporal coefficients αq (V is the matrix of right-singular vectors), and Σ = diag[σ1… σN] is the matrix of singular values, which are equal to square root values of the eigenvalues of covariation matrix. The POD modes and temporal coefficients are orthonormal:
In Equation (2) δij is the Kronecker symbol and I is the identity matrix. The concentration fluctuation fields C = [c′(x, t1)… c′(x, tN)] can be phase-averaged to obtain the coherent pulsations of the concentration [78,79].
3. Results
3.1. Average Flow Structure
Figure 2 compares the mean velocity and OH PLIF intensity data for different flames. The velocity field is shown by vectors and normalized by the bulk velocity of the main air flow, which are 6.36 and 5.43 m/s for the cases of normal and elevated conditions, respectively. For each flame case, the OH PLIF data is normalized by a maximum value. The data are captured in the central (x, y) plane with the origin (0, 0) defined at the center of the pilot nozzle outlet.
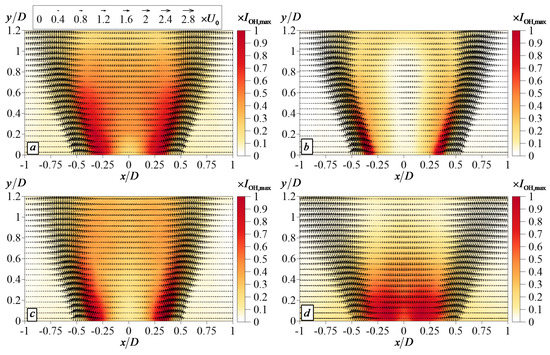
Figure 2.
Time-averaged velocity field and OH PLIF signal for methane (a,c) and syngas (b,d) flames at normal conditions (a,b) and elevated pressure and temperature (c,d).
In all cases, there is a central recirculation zone present. For the methane and syngas flames at normal conditions the maximum lateral cross-section of the recirculation zone is approximately of 0.76D and 0.88D, respectively. For methane, the elevated pressure and temperature do not affect strongly the velocity distribution. However, the chemical reaction zone in the inner shear layer appears to be thinner for the high pressure and temperature case. For syngas at normal conditions, the time-averaged reaction zone is even thinner. For the elevated pressure and temperature, the chemical reaction zone is stabilized close to the centerbody and is much shorter. For this flame the lateral size of the recirculation zone is also smaller, viz., approximately 0.62D. Moreover, the reverse flow magnitude in the recirculation zone is considerably higher, because the flame is shifted upstream in comparison to other flames.
Figure 3 shows the flame images captured by the photo camera. The soot is visible for the flames at normal conditions because the flame is stabilized with the aid of the central non-premixed jet. For syngas, the flame at elevated conditions is brighter and the nozzle is incandescent due to intensive heating by the closely located flame front. This is demonstrated by the average OH PLIF data, which indicates that the flame is stabilized close to the centerbody. Remarkably, a very strong soot luminosity is observed for the methane flame at the elevated pressure and temperature.
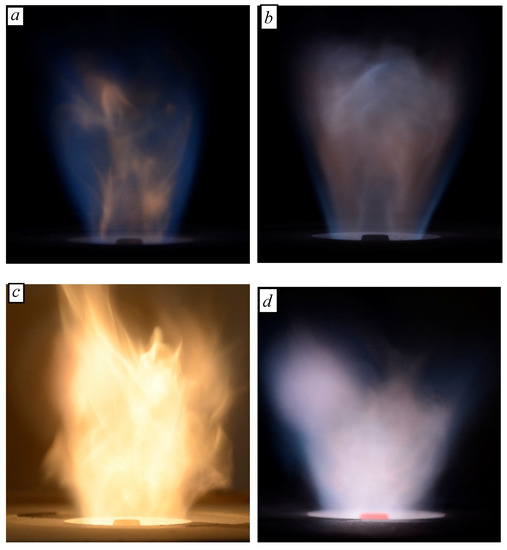
Figure 3.
Images of methane (a,c) and syngas (b,d) flames at normal conditions (a,b) and elevated pressure and temperature (c,d).
Figure 4 shows the spatial distributions of the variance of the y-component of the velocity fluctuations. There are two separate shear layers with intensive turbulent fluctuations around the annular swirling flows for the methane and syngas flames at normal conditions. For the elevated pressure and temperature, the shear layers are not distinct for the methane and could not be seen at all for the syngas flame. Moreover, it is noteworthy that the local variance of the vertical velocity component reaches 100% of the flow bulk velocity for the latter case.
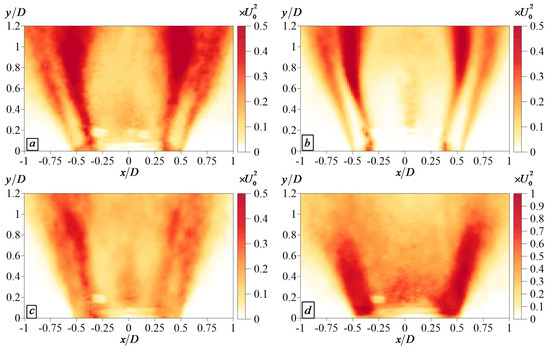
Figure 4.
Variance of the longitudinal velocity component for methane (a,c) and syngas (b,d) flames at normal conditions (a,b) and elevated pressure and temperature (c,d).
3.2. Coherent Flow Structures
Figure 5 shows the instantaneous snapshots of the PIV and PLIF data. For each flame they were captured simultaneously. The velocity fields demonstrate that large-scale vortex structures are present around the annular swirling flow. Moreover, the reverse flow is not steady. The PLIF snapshot for the methane flame at normal conditions demonstrates that the flame can be detached, viz., its root on one side is located outside the swirler nozzle. For the elevated conditions, the flame is stabilized inside the nozzle almost all the time. For the syngas flame at normal conditions, the PLIF snapshot visualizes a flame front around the central jet. The central jet is not seen in the velocity fields, because it was not seeded by tracer particles. However, since the bulk velocity of the central jet is higher (more than twice) for the syngas cases, it penetrates further inside the recirculation zone. For the elevated temperature and pressure conditions a tip of the flame front is located close to the central body and most of the flame surface is inside the swirler. Thus, the present flow case is characterized by a partial flame flash-back.
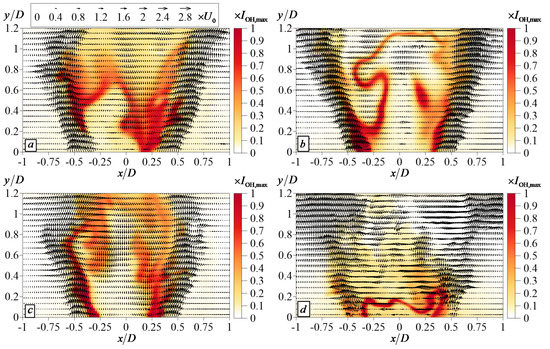
Figure 5.
Instantaneous PIV and OH PLIF snapshots for methane (a,c) and syngas (b,d) flames at normal conditions (a,b) and elevated pressure and temperature (c,d).
The POD spectra of the velocity fluctuations for the studied flames are shown in Figure 6. One most intensive mode is detected for the methane flame at normal conditions. This mode is shown by vectors in Figure 7, where the color corresponds to the phase-averaged value of the OH PLIF intensity fluctuations. This mode corresponds to a transverse hydrodynamics instability mode with almost asymmetrical pulsations of velocity components and OH PLIF intensity on opposite sides of the flow. In contrast, the second and the third POD modes are related to almost symmetrical pulsations of the velocity along the annular jet and symmetrical variation of the OH PLIF signal in the flow core. These two different types of POD modes are considered to be related to a large-scale transversal and longitudinal hydrodynamic instability modes. For the methane flame at elevated pressure and temperature, the POD spectrum corresponds to a monotonous decrease of the kinematic energy content with the mode number. As Figure 8 shows, the first mode is related to nearly symmetric OH PLIF intensity pulsations in the upper part of the recirculation bubble and strong coherent pulsations of the longitudinal flow velocity. This POD mode should correspond to a longitudinal instability mode, whereas the transverse hydrodynamics mode appears only as the fourth POD mode.
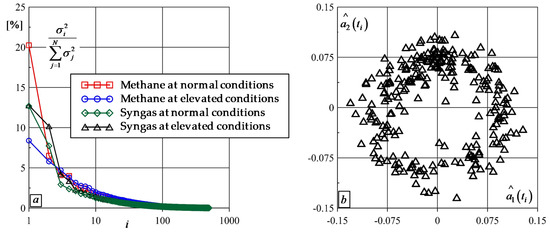
Figure 6.
POD spectra of velocity fields (a) and temporal coefficients of the first two POD modes for the syngas flame at elevated pressure (b).
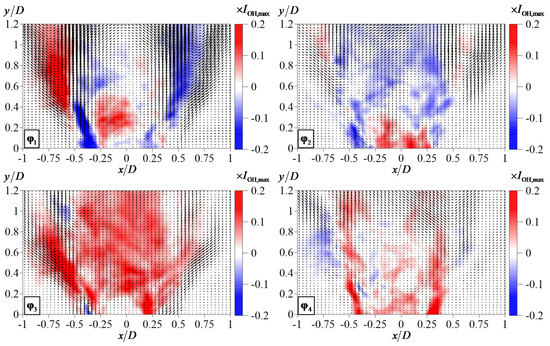
Figure 7.
First four POD modes with phase-averaged OH PLIF intensity for methane flame at normal conditions.
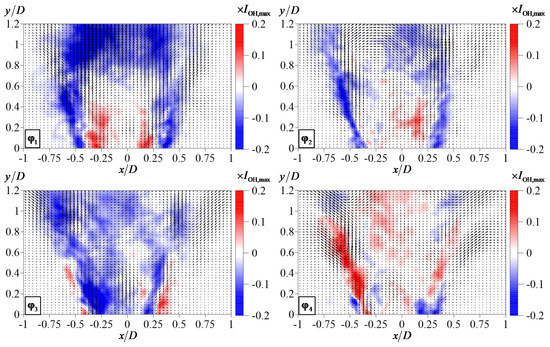
Figure 8.
First four POD modes with phase-averaged OH PLIF intensity for methane flame at elevated conditions.
For the syngas flame at normal conditions, the first and second POD modes have considerably greater energy than the remaining modes. Their spatial distributions in Figure 9 show that the second POD mode corresponds to nearly symmetrical coherent fluctuations of OH PLIF signal around the central jet and also along the annular swirling jet. The velocity fluctuations are related to a flapping motion of the annular jet. Traces of a transversal hydrodynamic mode are seen in the first, third, and fourth POD modes with low coherent fluctuations of the OH PLIF intensity. For the syngas at elevated conditions, the first and second POD modes, depicted in Figure 10 are not perfectly symmetrical, but appear to be related to two phases (shifted by π/2) of a strong longitudinal hydrodynamics instability mode (they correspond to a much greater kinematic energy than the other modes), coupled with very strong pulsations of the OH PLIF intensity (up to 20%). The third and fourth POD modes are nearly asymmetrical and expected to be produced by a transversal mode.
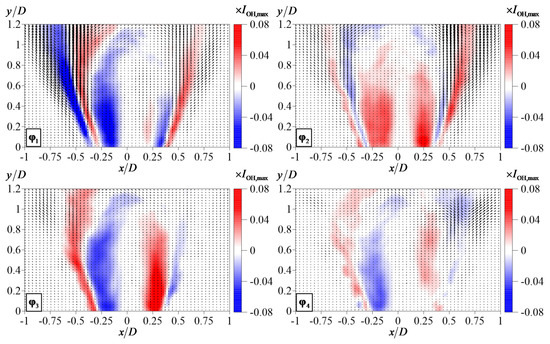
Figure 9.
First four POD modes with phase-averaged OH PLIF intensity for syngas flame at normal conditions.
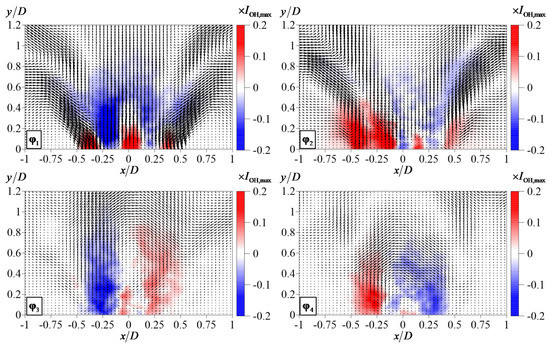
Figure 10.
First four POD modes with phase-averaged OH PLIF intensity for syngas flame at elevated conditions.
3.3. High-Speed Imaging of Flame Front Dynamics
Figure 11 and Figure 12 show the time-averaged and instantaneous distributions of OH* chemiluminescence signal, respectively. Generally, except for one case, the time-averaged data of the chemiluminescence projection onto the image corresponds well to the time-averaged OH PLIF data, obtained for the central cross-section of the flame. For the syngas at normal and elevated conditions, the OH* chemiluminescence signal is the most intensive above the diffusion central flame (at y/d ≈ 1.2 and 0.4, respectively), whereas the OH fluorescence intensity is greater for the flame front near the swirler’s nozzle exit. This can be due to the fact that the OH radical in hydrocarbon flames is produced mainly via chemical reaction (4), whereas the electronically excited OH* is formed predominantly by another chemical reaction (5) [80,81]. Moreover, the chemiluminescence of CO2* also should significantly contribute to flame radiation in the wavelength range of 300–340 nm [82].
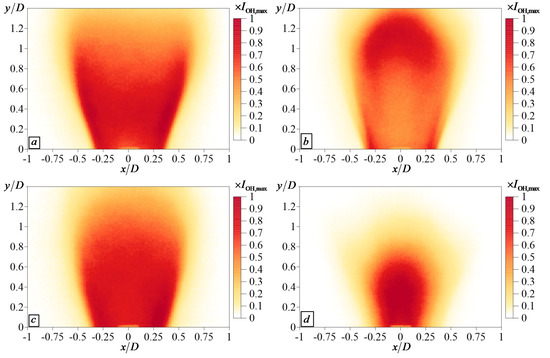
Figure 11.
Time-averaged OH* chemiluminescence images for methane (a,c) and syngas (b,d) flames at normal conditions (a,b) and elevated pressure and temperature (c,d).
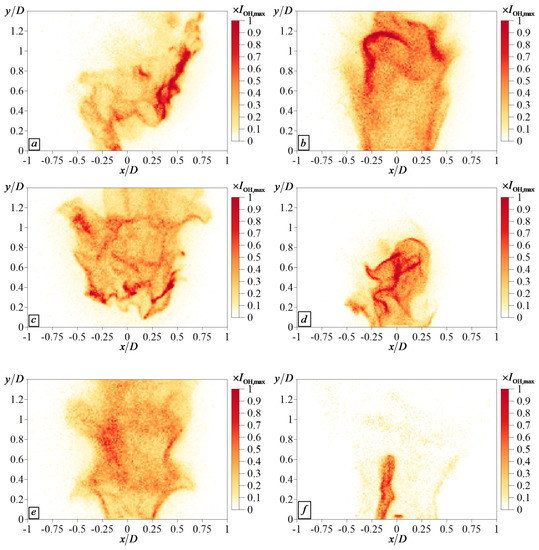
Figure 12.
Instantaneous snapshots of OH* chemiluminescence for methane (a,c,e) and syngas (b,d,f) flames at normal conditions (a,b) and elevated pressure and temperature (c–f).
The animations of the OH* high-speed imaging are provided as Supplementary Materials for this paper. The examples of the snapshots are shown in Figure 12. At normal conditions, the flame front was stabilized around the central recirculation zone and penetrated inside the nozzle. It is also observed to be partially lifted, when the flame is blown-off on one side by the flow (see the example in Figure 12a). For the elevated conditions, the flame dynamics are found to be more complex, associated with periodical lift-off of the entire flame (Figure 12c), turbulent propagation against the rotating annular flow and also frequent events of global extinction (Figure 12e,f), after the flame front penetration inside the swirler. However, the flame was not blown-out by the flow due to the presence of the central diffusion pilot flame.
The local variance for OH* image is shown in Figure 13. To visualize a bulk, coherent movement of the flame front, the SVD (1) is applied to the OH* chemiluminescence images. Whereas the POD is a common term for the velocity data analysis, the SVD decomposition for the projections OH* chemiluminescence is referred to as principle component analysis (PCA), as it is more common in literature. The PCA spectrum is shown in Figure 14. In analogy to the POD of velocity data, for the case of methane flame at normal conditions, the first PCA mode has a much greater magnitude in comparison to the remaining modes.
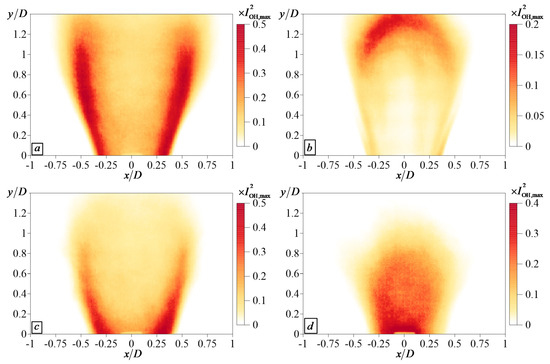
Figure 13.
Local variance of OH* chemiluminescence intensity for methane (a,c) and syngas (b,d) flames at normal conditions (a,b) and elevated pressure and temperature (c,d).
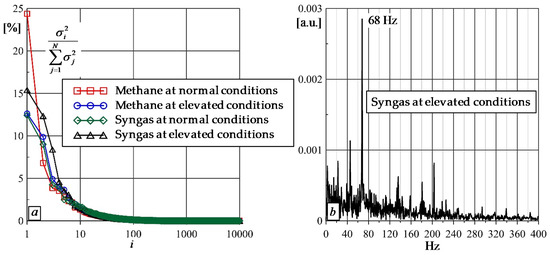
Figure 14.
PCA spectra of OH* images (a) and spectrum of the temporal coefficient of the first mode for the syngas flame at elevated pressure (b).
The first four modes of the PCA for the OH* chemiluminescence images for the methane flame at normal conditions are shown in Figure 15. The first and second modes are clearly related to the transversal and longitudinal modes of large-scale coherent variations of the flame front pattern. For the present case, the characteristic frequency of the temporal coefficient variation for the transversal bulk mode corresponds to 26 Hz and the Strouhal number of StT = 0.15. For the longitudinal mode, no such peak is found for the spectrum of α(t). For the other flame case, the difference in modes’ amplitude is not so strong. However, for each flame such two different types of bulk modes, viz., nearly symmetrical and asymmetrical, are detected.
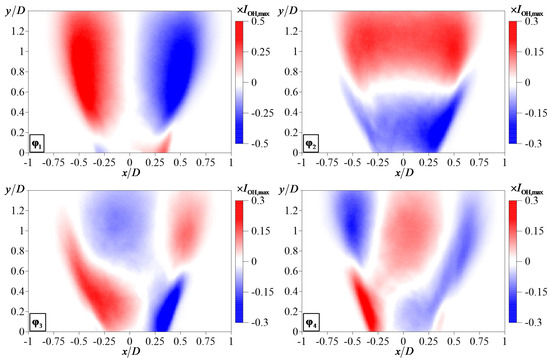
Figure 15.
Four first PCA modes of OH* chemiluminescence images for methane flame at normal conditions.
Figure 16 shows the PCA modes of the OH* images for the methane flame at the elevated conditions. The first PCA mode is related to the transversal movement, whereas the longitudinal movement appears in the second and third PCA modes, which correspond to a phase shift of π/2. The longitudinal oscillations correspond to a peak near 22 Hz in the Fourier spectrum of α(t) or to StL = 0.15. The PCA modes for the syngas flames at normal and elevated conditions are shown in Figure 17 and Figure 18, respectively. For the normal condition, the bulk movements in the transversal and longitudinal directions correspond to the first and second PCA, correspondingly. The Fourier spectra of the temporal coefficients for these modes do not have a distinguishing peak for a certain dedicated frequency. For the elevated conditions, the longitudinal bulk mode is related to the first and third PCA modes, for which a very sharp peak was found at 68 Hz (StL = 0.46) in the spectra of the temporal correlation coefficients (see the example in Figure 14b). The transverse bulk movement mode was also detected for the present case (second PCA mode), but its spectrum does not contain any distinguished peak.
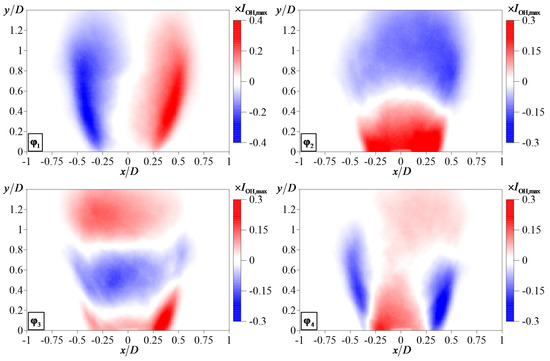
Figure 16.
Four first PCA modes of OH* chemiluminescence images for methane flame at elevated conditions.
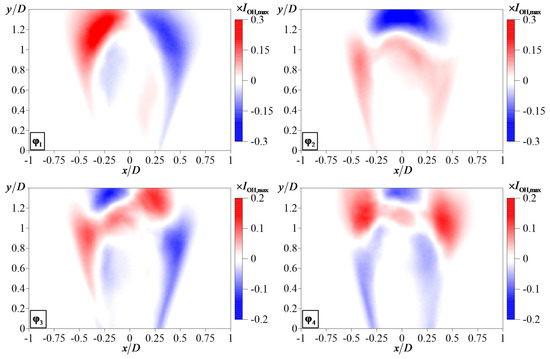
Figure 17.
First four PCA modes of OH* chemiluminescence images for syngas flame at normal conditions.
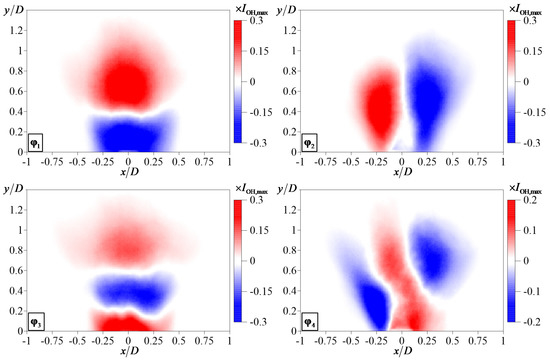
Figure 18.
First four PCA modes of OH* chemiluminescence images for syngas flame at elevated conditions.
4. Conclusions
The present paper reports on the PIV and OH PLIF measurements of the flow structure during the combustion of methane and syngas in a model gas-turbine combustor. The flames are stabilized by a generic swirler, based on a design by Turbomeca, which supplies a part of the fuel as a pilot central jet and injects the remaining part between the vanes of the swirler to organize the premixed lean combustion. The flames are studied at both normal and elevated pressure and temperature for the equivalence ratios close to the lean blow-off limits. The flame dynamics are also visualized by using high-speed OH* chemiluminescence imaging. The data are processed by SVD to reveal coherent flow structures and bulk movement of the turbulent flame.
The methane flame at normal conditions is not perfectly stable with the events of partial lift-off. However, the dynamics are much more complex for the elevated pressure and temperature conditions, associated with the lift-off of the entire flame, global extinction, and re-ignition. The first few POD modes for PIV/PLIF data reveal the presence of coherent longitudinal and transversal modes. These modes are not perfectly symmetrical, or asymmetrical, since the local gas density fluctuations are not accounted for during the decomposition. Nevertheless, the traces of the longitudinal and transversal coherent modes of velocity fluctuations are detected in all cases.
The SVD analysis of OH* chemiluminescence also reveals similar spatial modes for the bulk flame movement. The Fourier analysis of the temporal coefficients for these modes show that for atmospheric methane flame, which is less stable than the syngas flame, the transversal mode corresponds to the Strouhal number StT = 0.15. For the elevated pressure, the unsteady flame dynamics is associated with longitudinal oscillating bulk movement of the turbulent flame pattern. For the syngas flame with strong pulsations, the Fourier spectrum features several peaks at different frequencies with the most intensive for the Strouhal number of StL = 0.46.
In summary, the dynamics of the lean methane flame close to the lean blow-off limit is found to be related with the events of asymmetrical flame lift-off, accumulation of the me-thane inside the recirculation zone (due to the presence of the pilot jet), and flame re-entrance into the swirler nozzle. Therefore, detected transversal and longitudinal spatial modes for this flame are associated with these events of the flame lift-off and re-entrance. For the elevated conditions, the lift-off of the entire methane flame is observed, followed by the flame re-entrance into the swirler with global extinction inside, followed by re-ignition inside the combustion chamber by the diffusion central jet. The unsteady dynamics of the syngas flame at elevated conditions, coupled with strong thermoacoustic pulsations, is also related with periodic events of the flame flash-back, extinction inside the nozzle, and re-ignition, but without flame lift-off due to a higher flame propagation speed.
Therefore, the present study shows that the scenario of unsteady dynamics lean syngas flames can be sufficiently different from that for methane flames. Thus, the combustion of lean syngas flames in model gas-turbine combustion chambers deserves additional studies for a wider range of parameters to develop efficient methods for the suppression of thermoacoustic pulsations in lean combustors.
Supplementary Materials
The following are available online at https://zenodo.org/record/5724552#.YbHTRXIo-Uk, An archive, containing four video animations of high-speed OH* chemiluminescence imaging of methane flame and syngas flames in a model gas-turbine combustor at normal and elevated conditions, is provided as Supplementary Materials. Video S1: Animation of OH* chemiluminescence for methane flame at normal conditions. Video S2: Animation of OH* chemiluminescence for syngas flame at normal conditions. Video S3: Animation of OH* chemiluminescence for methane flame at elevated conditions. Video S4: Animation of OH* chemiluminescence for syngas flame at ele-vated conditions.
Author Contributions
Conceptualization, D.M. and Y.L.; methodology, V.D. and L.C.; data processing, D.S., A.L.; data acquisition, D.S., R.T.; writing—original draft preparation, V.D.; writing—review and editing, Z.L. and X.S.; visualization, A.L.; supervision, V.D. and Y.L.; project administration, L.C.; funding acquisition, D.M. and Y.L. All authors have read and agreed to the published version of the manuscript.
Funding
Research was supported by the Ministry of Science and Higher Education of the Russian Federation, agreement No. 075-15-2020-806, and the National Key R&D Program of China (2017YFE0123100).
Data Availability Statement
The data that support the findings of this study are available from the corresponding author upon reasonable request.
Acknowledgments
We thank Alexey Savitskii for his assistance during the experiments.
Conflicts of Interest
The authors declare no conflict of interest.
References
- Wang, T.; Stiegel, G. Integrated Gasification Combined Cycle (IGGC) Technologies; Elsevier: New York, NY, USA, 2017. [Google Scholar]
- Higman, C.; van der Burgt, M. Gasification; Elsevier: New York, NY, USA, 2010. [Google Scholar]
- Dunn-Rankin, D. Lean Combustion: Technology and Control; Academic Press: Cambridge, UK, 2008. [Google Scholar]
- Johnson, M.R.; Littlejohn, D.; Nazeer, W.A.; Smith, K.O.; Cheng, R.K. A comparison of the flowfields and emissions of high-swirl injectors and low-swirl injectors for lean premixed gas turbines. Proc. Combust. Inst. 2005, 30, 2867–2874. [Google Scholar] [CrossRef]
- Cheng, R.K.; Littlejohn, D.; Strakey, P.A.; Sidwell, T. Laboratory investigations of a low-swirl injector with H2 and CH4 at gas turbine conditions. Proc. Combust. Inst. 2009, 32, 3001–3009. [Google Scholar] [CrossRef]
- Asai, T.; Dodo, S.; Karishuku, M.; Yagi, N.; Akiyama, Y.; Hayashi, A. Performance of multiple-injection dry low-NOx combustors on hydrogen-rich syngas fuel in an IGCC pilot plant. J. Eng. Gas Turbines Power 2015, 137, 091504. [Google Scholar] [CrossRef]
- Meier, W.; Weigand, P.; Duan, X.R.; Giezendanner-Thoben, R. Detailed characterization of the dynamics of thermoacoustic pulsations in a lean premixed swirl flame. Combust. Flame 2007, 150, 2–26. [Google Scholar] [CrossRef]
- Davis, D.W.; Therkelsen, P.L.; Littlejohn, D.; Cheng, R.K. Effects of hydrogen on the thermo-acoustics coupling mechanisms of low-swirl injector flames in a model gas turbine combustor. Proc. Combust. Inst. 2013, 34, 3135–3143. [Google Scholar] [CrossRef]
- Huang, Y.; Yang, V. Dynamics and stability of lean-premixed swirl-stabilized combustion. Prog. Energy Combust. Sci. 2009, 35, 293–364. [Google Scholar] [CrossRef]
- Lieuwen, T.; Torres, H.; Johnson, C.; Zinn, B.T. A mechanism of combustion instability in lean premixed gas turbine combustors. J. Eng. Gas Turbines Power 2001, 123, 182–189. [Google Scholar] [CrossRef]
- Candel, S.; Durox, D.; Schuller, T.; Bourgouin, J.-F.; Moeck, J.P. Dynamics of swirling flames. Ann. Rev. Fluid Mech. 2014, 46, 147–173. [Google Scholar] [CrossRef]
- Lieuwen, T.C. Unsteady Combustor Physics; Cambridge University Press: Cambridge, UK, 2021. [Google Scholar]
- Lieuwen, T.; Yang, V.; Yetter, R. Synthesis Gas Combustion: Fundamentals and Applications; CRC Press: New York, NY, USA, 2009. [Google Scholar]
- Beerer, D.; McDonell, V.; Therkelsen, P.; Cheng, R.K. Flashback and turbulent flame speed measurements in hydrogen/methane flames stabilized by a low-swirl injector at elevated pressures and temperatures. J. Eng. Gas Turbines Power 2014, 136, 031502. [Google Scholar] [CrossRef]
- Janus, B.; Dreizler, A.; Janicka, J. Experimental study on stabilization of lifted swirl flames in a model GT combustor. Flow Turbul. Combust. 2005, 75, 293–315. [Google Scholar] [CrossRef]
- Wehr, L.; Meier, W.; Kutne, P.; Hassa, C. Single-pulse 1D laser Raman scattering applied in a gas turbine model combustor at elevated pressure. Proc. Combust. Inst. 2007, 31, 3099–3106. [Google Scholar] [CrossRef]
- Lazik, W.; Doerr, T.; Bake, S.V.; vd Bank, R.; Rackwitz, L. Development of lean-burn low-NOx combustion technology at Rolls-Royce Deutschland. In Proceedings of the ASME Turbo Expo 2008: Power for Land, Sea and Air, Berlin, Germany, 9–13 June 2008; Volume 43130, pp. 797–807. [Google Scholar] [CrossRef]
- Dhanuka, S.K.; Temme, J.E.; Driscoll, J.F. Unsteady aspects of lean premixed prevaporized gas turbine combustors: Flame-flame interactions. J. Eng. Gas Turbines Power 2011, 27, 631–641. [Google Scholar] [CrossRef]
- Meier, U.; Freitag, S.; Heinze, J.; Lange, L.; Magens, E.; Schroll, M.; Willert, C.; Hassa, C.; Bagchi, I.K.; Lazik, W.; et al. Characterization of lean burn module air blast pilot injector with laser techniques. J. Eng. Gas Turbines Power 2013, 135, 121508. [Google Scholar] [CrossRef]
- Temme, J.E.; Allison, P.M.; Driscoll, J.F. Combustion instability of a lean premixed prevaporized gas turbine combustor studied using phase-averaged PIV. Combust. Flame 2014, 161, 958–970. [Google Scholar] [CrossRef]
- Canepa, E.; Nilberto, A. Experimental flame front characterisation in a lean premix burner operating with syngas simplified model fuel. Energies 2019, 12, 2377. [Google Scholar] [CrossRef]
- Greifenstein, M.; Heinze, J.; Willert, C.; Voigt, L.; Zedda, M.; Richter, C.; Dreizler, A. Time-resolved temperature profile measurements in the exhaust of a single sector gas turbine combustor at realistic operating conditions. Exp. Fluids 2020, 61, 177. [Google Scholar] [CrossRef]
- Stöhr, M.; Sadanandan, R.; Meier, W. Phase-resolved characterization of vortex–flame interaction in a turbulent swirl flame. Exp. Fluids 2011, 51, 1153–1167. [Google Scholar] [CrossRef]
- Boxx, I.; Arndt, C.M.; Carter, C.D.; Meier, W. High-speed laser diagnostics for the study of flame dynamics in a lean premixed gas turbine model combustor. Exp. Fluids 2012, 52, 555–567. [Google Scholar] [CrossRef]
- Coriton, B.; Steinberg, A.M.; Frank, J.H. High-speed tomographic PIV and OH PLIF measurements in turbulent reactive flows. Exp. Fluids 2014, 55, 1–20. [Google Scholar] [CrossRef]
- Liu, X.; Wang, S.; Wang, G.; Xu, L.; Li, L. High-speed simultaneous PLIF/PIV imaging of a lift-off swirling flame under acoustic forcing. Exp. Therm. Fluid Sci. 2021, 121, 110259. [Google Scholar] [CrossRef]
- Allen, M.G.; Parker, T.E.; Reinecke, W.G.; Legner, H.H.; Foutter, R.R.; Rawlins, W.T.; Davis, S.J. Fluorescence imaging of OH and NO in a model supersonic combustor. AIAA J. 1993, 31, 505–512. [Google Scholar] [CrossRef]
- Bombach, R.; Käppeli, B. Simultaneous visualisation of transient species in flames by planar-laser-induced fluorescence using a single laser system. Appl. Phys. 1999, 68, 251–255. [Google Scholar] [CrossRef]
- Sick, V. Exhaust-gas imaging via planar laser-induced fluorescence of sulfur dioxide. Appl. Phys. B 2002, 74, 461–463. [Google Scholar] [CrossRef][Green Version]
- Mosburger, M.; Sick, V. Single laser detection of CO and OH via laser-induced fluorescence. Appl. Phys. B 2010, 99, 1–6. [Google Scholar] [CrossRef]
- Bessler, W.G.; Schulz, C. Quantitative multi-line NO-LIF temperature imaging. Appl. Phys. B 2004, 78, 519–533. [Google Scholar] [CrossRef]
- Yang, X.; Fu, C.; Wang, G.; Li, Z.; Li, T.; Gao, Y. Simultaneous high-speed SO2 PLIF imaging and stereo-PIV measurements in premixed swirling flame at 20 kHz. Appl. Opt. 2019, 58, C121–C129. [Google Scholar] [CrossRef] [PubMed]
- Liu, X.; Wang, Y.; Wang, Z.; Qi, F. Single camera 20 kHz two-color formaldehyde PLIF thermometry using a dual-wavelength-switching burst mode laser. Opt. Lett. 2021, 46, 5149–5152. [Google Scholar] [CrossRef]
- Najm, H.N.; Paul, P.H.; Mueller, C.J.; Wyckoff, P.S. On the adequacy of certain experimental observables as measurements of flame burning rate. Combust. Flame 1998, 113, 312–332. [Google Scholar] [CrossRef]
- Fayoux, A.; Zähringer, K.; Gicquel, O.; Rolon, J. Experimental and numerical determination of heat release in counterflow premixed laminar flames. Proc. Combust. Inst. 2005, 30, 251–257. [Google Scholar] [CrossRef]
- Röder, M.; Dreier, T.; Schulz, C. Simultaneous measurement of localized heat-release with OH/CH2O–LIF imaging and spatially integrated OH∗ chemiluminescence in turbulent swirl flames. Proc. Combust. Inst. 2013, 34, 3549–3556. [Google Scholar] [CrossRef]
- Kariuki, J.; Dowlut, A.; Yuan, R.; Balachandran, R.; Mastorakos, E. Heat release imaging in turbulent premixed methane–air flames close to blow-off. Proc. Combust. Inst. 2015, 35, 1443–1450. [Google Scholar] [CrossRef]
- Dulin, V.M.; Lobasov, A.S.; Chikishev, L.M.; Markovich, D.M.; Hanjalic, K. On impact of helical structures on stabilization of swirling flames with vortex breakdown. Flow Turbul. Combust. 2019, 103, 887–911. [Google Scholar] [CrossRef]
- Copeland, C.; Friedman, J.; Renksizbulut, M. Planar temperature imaging using thermally assisted laser induced fluorescence of OH in a methane–air flame. Exp. Therm. Fluid Sci. 2007, 31, 221–236. [Google Scholar] [CrossRef]
- Kostka, S.; Roy, S.; Lakusta, P.J.; Meyer, T.R.; Renfro, M.W.; Gord, J.R.; Branam, R. Comparison of line-peak and line-scanning excitation in two-color laser-induced-fluorescence thermometry of OH. Appl. Opt. 2009, 48, 6332–6343. [Google Scholar] [CrossRef]
- Dulin, V.; Sharaborin, D.; Tolstoguzov, R.; Lobasov, A.; Chikishev, L.; Markovich, D.; Wang, S.; Fu, C.; Liu, X.; Li, Y.; et al. Assessment of single-shot temperature measurements by thermally-assisted OH PLIF using excitation in the A2Σ+–X2Π (1-0) band. Proc. Combust. Inst. 2021, 38, 1877–1883. [Google Scholar] [CrossRef]
- Grib, S.W.; Fugger, C.A.; Hsu, P.S.; Jiang, N.; Roy, S.; Schumaker, S.A. Two-dimensional temperature in a detonation channel using two-color OH planar laser-induced fluorescence thermometry. Combust. Flame 2021, 228, 259–276. [Google Scholar] [CrossRef]
- Stöhr, M.; Sadanandan, R.; Meier, W. Experimental study of unsteady fame structures of an oscillating swirl fame in a gas turbine model combustor. Proc. Combust. Inst. 2009, 32, 2925–2932. [Google Scholar] [CrossRef]
- Stöhr, M.; Boxx, I.; Carter, C.D.; Meier, W. Experimental study of vortex-flame interaction in a gas turbine model combustor. Combust. Flame 2012, 159, 2636–2649. [Google Scholar] [CrossRef]
- Renaud, A.; Yokomori, T.; Tachibana, S. Study of a thermo-acoustic instability triggering in a low-swirl burner using simultaneous time-resolved acetone and OH-PLIF. Proc. Combust. Inst. 2019, 37, 2627–2633. [Google Scholar] [CrossRef]
- Keck, O.; Meier, W.; Stricker, W.; Aigner, M. Establishment of a confined swirling natural gas/air flame as a standard flame: Temperature and species distributions from laser Raman measurements. Combust. Sci. Technol. 2002, 174, 117–151. [Google Scholar] [CrossRef]
- Sharaborin, D.K.; Savitskii, A.G.; Bakharev, G.Y.; Lobasov, A.S.; Chikishev, L.M.; Dulin, V.M. PIV/PLIF investigation of unsteady turbulent flow and mixing behind a model gas turbine combustor. Exp. Fluids 2021, 62, 96. [Google Scholar] [CrossRef]
- Ng, W.B.; Syed, K.J.; Zhang, Y. The study of flame dynamics and structures in an industrial-scale gas turbine combustor using digital data processing and computer vision techniques. Exp. Therm. Fluid Sci. 2005, 29, 715–723. [Google Scholar] [CrossRef]
- Bulat, G.; Stopford, P.; Turrell, M.; Frach, D.; Buchanan, E.; Stöhr, M. Prediction of aerodynamic frequencies in a gas turbine combustor using transient CFD. In Proceedings of the ASME Turbo Expo 2009: Power for Land, Sea and Air, Orlando, FL, USA, 8–12 June 2009; Volume 48838, pp. 585–594. [Google Scholar] [CrossRef]
- Stopper, U.; Aigner, M.; Ax, H.; Meier, W.; Sadanandan, R.; Stöhr, M.; Bonaldo, A. PIV, 2D-LIF and 1D-Raman measurements of flow field, composition and temperature in premixed gas turbine flames. Exp. Therm. Fluid Sci. 2010, 34, 396–403. [Google Scholar] [CrossRef]
- Allouis, C.; Beretta, F.; Amoresano, A. Experimental study of lean premixed prevaporized combustion fluctuations in a gas turbine burner. Combust. Sci. Technol. 2008, 180, 900–909. [Google Scholar] [CrossRef]
- Canepa, E.; Di Martino, P.; Formosa, P.; Ubaldi, M.; Zunino, P. Unsteady aerodynamics of an aeroengine double swirler lean premixing prevaporizing burner. J. Eng. Gas Turbines Power 2006, 128, 29–39. [Google Scholar] [CrossRef]
- Marinov, S.; Kern, M.; Zarzalis, N.; Habisreuther, P.; Peschiulli, A.; Turrini, F.; Sara, O.N. Similarity issues of kerosene and methane confined flames stabilized by swirl in regard to the weak extinction limit. Flow, Turbul. Combust. 2012, 89, 73–95. [Google Scholar] [CrossRef]
- Keller, J.; Gebretsadik, M.; Habisreuther, P.; Turrini, F.; Zarzalis, N.; Trimis, D. Numerical and experimental investigation on droplet dynamics and dispersion of a jet engine injector. Int. J. Multiph. Flow 2015, 75, 144–162. [Google Scholar] [CrossRef]
- Providakis, T.; Zimmer, L.; Scouflaire, P.; Ducruix, S. Characterization of the acoustic interactions in a two-stage multi-injection combustor fed with liquid fuel. J. Eng. Gas Turbines Power 2012, 134, 111503. [Google Scholar] [CrossRef]
- Renaud, A.; Ducruix, S.; Scouflaire, P.; Zimmer, L. Flame shape transition in a swirl stabilised liquid fueled burner. Proc. Combust. Inst. 2015, 35, 3365–3372. [Google Scholar] [CrossRef]
- Li, G.; Gutmark, E.J. Geometry effects on the flow field and the spectral characteristics of a triple annular swirler. In Proceedings of the ASME Turbo Expo 2003: Power for Land, Sea and Air, Atlanta, GA, USA, 16–19 June 2003; Volume 36851, pp. 593–602. [Google Scholar] [CrossRef]
- Yi, T.; Gutmark, E.J. Combustion instabilities and control of a multiswirl atmospheric combustor. J. Eng. Gas Turbines Power 2007, 129, 31–37. [Google Scholar] [CrossRef]
- Vashahi, F.; Lee, J. Effects of the interaction point of multi-passage swirlers on the swirling flow field. J. Eng. Gas Turbines Power 2019, 141, 061013. [Google Scholar] [CrossRef]
- Butcher, D.; Spencer, A. Analysis of multi-stream fuel injector flow using zonal proper orthogonal decomposition. Energies 2021, 14, 1789. [Google Scholar] [CrossRef]
- Zhao, Q.; Yang, J.; Mu, Y.; Li, Y.; Liu, C.; Liu, F.; Xu, G. Experimental investigation of flow field features and spark ignition process in a multi-swirl airblast injector. Fuel 2021, 306, 121732. [Google Scholar] [CrossRef]
- Mingalev, S.; Inozemtsev, A.; Gomzikov, L.; Sipatov, A.; Abramchuk, T. Simulation of primary film atomization in prefilming air-assisted atomizer using volume-of-fluid method. Microgravity Sci. Technol. 2020, 32, 465–476. [Google Scholar] [CrossRef]
- Subash, A.A.; Kim, H.; Möller, S.I.; Richter, M.; Brackmann, C.; Aldén, M.; Lörstad, D. Investigation of fuel and load flexibility in a Siemens gas turbine-600/700/800 burner under atmospheric pressure conditions using high-speed hydroxyl-PLIF and hydroxyl radical chemiluminescence imaging. J. Eng. Gas Turbines Power 2021, 143, 081009. [Google Scholar] [CrossRef]
- Daniele, S.; Jansohn, P.; Mantzaras, J.; Boulouchos, K. Turbulent flame speed for syngas at gas turbine relevant conditions. Proc. Combust. Inst. 2011, 33, 2937–2944. [Google Scholar] [CrossRef]
- Tsurikov, M.; Meier, W.; Geigle, K.P. Investigations of a syngas-fired gas turbine model combustor by planar laser techniques. In Proceedings of the ASME Turbo Expo 2006: Power for Land, Sea and Air, Barcelona, Spain, 8–11 May 2006; Volume 42363, pp. 303–309. [Google Scholar] [CrossRef]
- Allison, P.M.; Driscoll, J.F.; Ihme, M. Acoustic characterization of a partially-premixed gas turbine model combustor: Syngas and hydrocarbon fuel comparisons. Proc. Combust. Inst. 2013, 34, 3145–3153. [Google Scholar] [CrossRef]
- Sayad, P.; Schönborn, A.; Klingmann, J. Experimental investigation of the stability limits of premixed syngas-air flames at two moderate swirl numbers. Combust. Flame 2016, 164, 270–282. [Google Scholar] [CrossRef]
- Choi, M.; Park, Y.; Li, X.; Sung, Y.; Park, S.; Moon, K.; Choi, G. Study on flame structures and emission characteristics according to various swirl combinations and fuel compositions in a CH4/H2/CO syngas swirl-stabilized combustor. Fuel 2019, 253, 887–903. [Google Scholar] [CrossRef]
- Lee, M.C.; Seo, S.B.; Chung, J.H.; Kim, S.M.; Joo, Y.J.; Ahn, D.H. Gas turbine combustion performance test of hydrogen and carbon monoxide synthetic gas. Fuel 2010, 89, 1485–1491. [Google Scholar] [CrossRef]
- Lee, M.C.; Yoon, J.; Joo, S.; Kim, J.; Hwang, J.; Yoon, Y. Investigation into the cause of high multi-mode combustion instability of H2/CO/CH4 syngas in a partially premixed gas turbine model combustor. Proc. Combust. Inst. 2015, 35, 3263–3271. [Google Scholar] [CrossRef]
- Lee, M.C. Effects of H2/CO/CH4 syngas composition variation on the NO x and CO emission characteristics in a partially-premixed gas turbine combustor. Sci. China Technol. Sci. 2016, 59, 1804–1813. [Google Scholar] [CrossRef]
- Sirovich, L. Turbulence and the dynamics of coherent structures. I. Coherent structures. Q. Appl. Math. 1987, 45, 561–571. [Google Scholar] [CrossRef]
- Chacartegui, R.; Torres, M.; Sánchez, D.; Jiménez, F.; Munoz, A.; Sánchez, T. Analysis of main gaseous emissions of heavy duty gas turbines burning several syngas fuels. Fuel Process. Technol. 2011, 92, 213–220. [Google Scholar] [CrossRef]
- Daniele, S.; Jansohn, P.; Boulouchos, K. Lean premixed combustion of undiluted syngas at gas turbine relevant conditions: NOx emissions and lean operational limits. In Proceedings of the ASME Turbo Expo 2008: Power for Land, Sea and Air, Berlin, Germany, 9–13 June 2008; Volume 43130, pp. 137–144. [Google Scholar] [CrossRef]
- Scarano, F. Iterative image deformation methods in PIV. Meas. Sci. Technol. 2001, 13, R1–R19. [Google Scholar] [CrossRef]
- Soloff, S.M.; Adrian, R.J.; Liu, Z.C. Distortion compensation for generalized stereoscopic particle image velocimetry. Meas. Sci. Technol. 1997, 8, 1441–1454. [Google Scholar] [CrossRef]
- Kerschen, G.; Golinval, J.C.; Vakakis, A.F.; Bergman, L.A. The method of proper orthogonal decomposition for dynamical characterization and order reduction of mechanical systems: An overview. Nonlinear Dyn. 2005, 41, 147–169. [Google Scholar] [CrossRef]
- Duwig, C.; Fuchs, L. Large eddy simulation of vortex breakdown/flame interaction. Phys. Fluids 2007, 19, 075103. [Google Scholar] [CrossRef]
- Lobasov, A.S.; Alekseenko, S.V.; Markovich, D.M.; Dulin, V.M. Mass and momentum transport in the near field of swirling turbulent jets. Effect of swirl rate. Int. J. Heat Fluid Flow 2020, 83, 108539. [Google Scholar] [CrossRef]
- Warnatz, J.; Maas, U.; Dibble, R.W.; Warnatz, J. Combustion; Springer: Berlin/Heidelberg, Germany, 2006. [Google Scholar]
- Dandy, D.S.; Vosen, S.R. Numerical and experimental studies of hydroxyl radical chemiluminescence in methane-air flames. Combust. Sci. Technol. 1992, 82, 131–150. [Google Scholar] [CrossRef]
- Lauer, M.; Sattelmayer, T. On the adequacy of chemiluminescence as a measure for heat release in turbulent flames with mixture gradients. J. Eng. Gas Turbines Power 2010, 132, 061502. [Google Scholar] [CrossRef]
Publisher’s Note: MDPI stays neutral with regard to jurisdictional claims in published maps and institutional affiliations. |
© 2021 by the authors. Licensee MDPI, Basel, Switzerland. This article is an open access article distributed under the terms and conditions of the Creative Commons Attribution (CC BY) license (https://creativecommons.org/licenses/by/4.0/).