Abstract
The article presents an active bridge system that enables the solution of a significant problem consisting in ensuring correct indications of temperature values in a wide measuring range for a Pt100 temperature sensor with properties defined by the standard (EN-60751 + A2). The presented active bridge system combines the properties of the measuring amplifier with the stabilization of the current value in the branch in which the Pt100 sensor was placed. The article focuses on the comparison of the temperature measurement in a typical resistance bridge and the measurement made in the developed active bridge, which has also become the subject of a patent. For the performed tests, in which the correctness of the temperature measurement system operation was verified, and on the basis of the obtained results, the quality of temperature measurements was compared in a wide range of changes.
1. Introduction
Temperature sensors are among the most commonly used sensors because the physical quantity of temperature is measured, regulated, recorded, and monitored in a variety of environments and in most technological processes. Almost every device used in domestic, industrial, or laboratory environments, ranging from computers, cars, power trains, air conditioners, measuring devices, or thermostats, uses temperature sensors. The most common types of temperature sensors include thermistors, thermocouples, resistance temperature detectors (RTDs), digital thermometer integrated circuits, and analog thermometer integrated circuits [1,2,3,4,5,6,7,8,9,10,11,12,13].
This article describes an accurate thermometer measurement system that includes resistive temperature detectors RTDs, which are temperature sensors that contain a resistor. The resistor used in an RTD changes its resistance value as the temperature changes. The most common example of an RTD detector are Pt100 series temperature sensors, which have been used for many years to measure temperature in laboratory and industrial processes. The Pt100 is one of the most accurate temperature sensors. It does not only provide good accuracy but also excellent stability and repeatability of the measured values. The Pt100 sensors are also relatively resistant to electrical interference and are therefore well suited for temperature measurements in industrial environments, especially around motors, generators, and other high voltage equipment [14,15,16,17].
The most RTD temperature detectors consist of a thin and coiled wire that is wrapped around a ceramic or glass core. There are also designs of the sensor in the form of platinum sputtered onto a ceramic substrate. The sensor is usually fragile, so it is often placed in a probe sheath. The RTD sensor is made of a specific material, which is the most important element of this sensor in this case.
The performance of the sensor depends on the material it is made of. Most RTD sensors are made of platinum or nickel. The temperature characteristics of these materials are precisely documented, which makes it possible to precisely determine the temperature based on them. There are two standards for Pt100 thermoresistors, one of which is the European standard, also known as the standard DIN (Deutsches Institut für Normung, Berlin, Germany) or the IEC standard (International Electrotechnical Commission, Geneva, Switzerland) and the American standard ASTM (American Society for Testing and Materials, West Conshehocken, PA, USA). The European standard is considered the world standard for platinum RTD sensors. DIN/IEC 60,751 (or simply IEC751), requires the RTD to have the electrical resistance of 100.00 Ω at 0 °C and the temperature coefficient of resistance (TCR) of 0.00385 O/O/°C over a temperature range from 0 °C to 100 °C [14].
The paper presents a method of precise evaluation of a real temperature value in a large range of temperature TC = 0 ÷ 850 °C using a thermoresistor Pt100. A special active measuring bridge was developed as well as the method of connecting a thermoresistor, effectively eliminating the influence of the wire’s resistance.
An important problem that occurs during temperature measurement using a resistive temperature sensor is the need to limit the influence of the resistance of the wires, by which such a sensor is connected to the measuring system, and which is the cause of erroneous temperature determination by such a sensor. Basically, three approaches are considered [8], i.e., using two wires [9,10], three wires [11], and the third approach, using four wires [13]. It should be mentioned that the described measurement system uses the compensation of the resistance of the lead wires by the three-wire method [16], which was improved and adapted to the system described below in this paper.
The paper presents a method of accurate determination of the actual temperature value of a Pt100 thermoresistor in a wide temperature measurement range TC = 0 ÷ 850 °C, using an active measuring bridge developed for this purpose and taking into account the compensation of the influence of the wires connecting the sensor. The contents of the article are based on the patent descriptions [16,17], of which the author is a co-author.
2. Active Measuring Bridge with Current Stabilization
In most applications, the Pt100 thermoresistor is used in a passive measuring bridge system, which is made of matched resistors, as shown in Figure 1 [6,7,14].
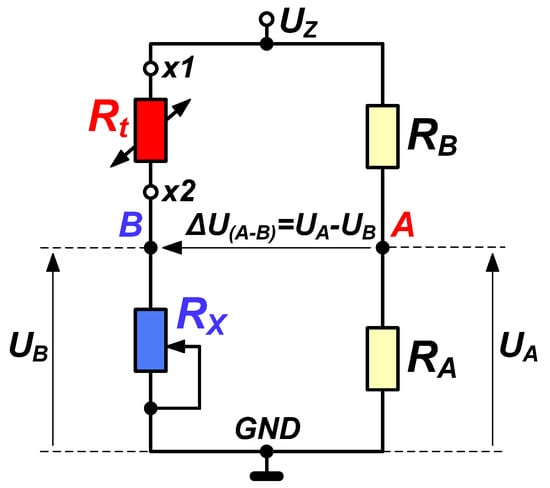
Figure 1.
A passive measuring bridge with a thermoresistor Pt100 represented by resistance Rt.
The circuit in Figure 1 is a passive bridge for determining the resistance value Rt. It contains a thermoresistor, represented by resistance Rt, and resistors RB and RA, which are placed in the second branch of the bridge. Resistor RX is connected (in the first branch of the bridge) in series with the resistor Rt. For a specific value of the temperature TC expressed in [°C], it is possible, by changing the value of the resistance RX, to bring the voltage UA = UB into equilibrium. Then the condition according to Equation (1) occurs.
A change in temperature causes a change in the resistance value Rt, which introduces (Figure 1) a change in the voltage value UB and it affects the value of the deviation ΔU(A−B). The change of the UB value will cause the nonzero ΔU(A−B) value. Another adjustment of the RX value will cause the voltage deviation ΔU(A−B) to approach zero.
The following analysis of the values of voltages UB and UA for the passive bridge shown in Figure 1 is carried out in order to obtain a relationship, from which the temperature of a Pt100 thermoresistor can be easily calculated. The voltage drop UB is expressed by the formula:
where UZ—the value of the bridge supply voltage. Whereas the voltage drop UA is given by the relation:
If RA = RB, then α in (3) is equal to: α = ½.
Since the voltage difference ΔU(A−B) is calculated from Equation (1). Then after substituting the relations (2) and (3) into this formula one can obtain:
After ordering the right-hand side of Equation (5), the relation for the voltage difference ΔU(A−B) (6) is obtained. This relation is crucial in determining the temperature.
In the circuit of Figure 1, the measurement and calculation of the resistance value Rt is performed when the principle of voltages’ equality UA = UB is applied. For the case when UA = UB, the resistance value Rt corresponds to the resistance value RX. On the basis of the resistance value Rt and the knowledge of the temperature characteristics of platinum, the temperature value TC can be calculated based on the formula obtained by solving the quadratic equation included in the European standard EN-60751 + A2 or by using the calculated temperature values, which, in tabulated form, are included in that standard [14,15,16,17].
In the European standard (EN-60751 + A2), the change of a platinum thermoresistor Pt100 resistance value (7) was described analytically as the value dependent on the temperature value in the range from 0 to 850 °C.
Rt—the resistance value of the thermoresistor at temperature TC (°C), R0—the resistance value of the thermoresistor at temperature TC = 0 °C, according to the standard (EN-60751 + A2), R0 = 100 Ω (or 500 Ω, and also 1000 Ω), A, B—constants connected with the material property of platinum Pt according to the standard (EN-60751 + A2), A = 3.9083 × 10⁻³ (1/°C), B = −5775 × 10−7 (1/°C2).
By solving the quadratic Equation (7) the relation according to Equation (8) is obtained [15]. It determines the temperature value TC of the thermoresistor depending on the resistance value Rt;
In the Formula (8), the fragment described by the relation (9) is important;
The calculation of the temperature value directly according to Formula (8) introduces a great simplification, whereas if one introduces into Formula (8) the voltage value UP resulting from the measurement of this voltage in the bridge system, a new relation is obtained equal to the product of the proportionality coefficient (SK) and the measurement voltage (UP) (10);
An important disadvantage of the passive bridge presented in Figure 1 is the fact that the output voltage ΔU(A−B) according to Formula (6) does not represent the relations given in (9) and (10). This passive bridge limitation evoked considerations about an active resistance bridge using an operational amplifier presented in Figure 2 [10,13]. This solution permits stabilizing current I = Iconst flowing through the thermoresistor Rt.
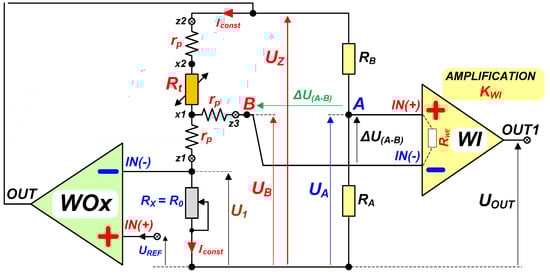
Figure 2.
Scheme of an active measuring bridge with the current value stabilization I = Iconst in the bridge branch with a Pt100 thermoresistor.
Operational amplifiers have been known for many years in electronics, and due to their well-known properties, they are still used in many applications [16,17,18,19,20,21]. The amplifier marked as WOx in Figure 2 acts as a current source, whose task is to stabilize the current in the bridge branch, including the resistor Rt. On the other hand, the instrumental amplifier marked as WI acts as a scaling circuit for the output voltage representing the measured temperature [13,14].
Similarly as in the case of the passive bridge (Figure 1), the analysis of the system in Figure 2 is carried out below. Its aim is to derive the relation, which allows calculating the relation given by the Equation (1).
At the beginning of the analysis, voltage drops UA and UB were determined according to the scheme presented in Figure 2:
where rp—resistance of the wire used to connect the thermoresistor.
If in the Formula (11) RA = RB, then α = ½. The relation ΔU(A−B) for an active measuring bridge is equal to:
After reducing it to a common denominator and applying the substitution α = ½, we obtain:
For the purpose of stabilizing the current value I in the bridge branch, in which the thermoresistor Rt is placed, Formula (15) expresses the dependence of the current value I on the voltage UREF.
Inserting into Equation (14) the expression (17), one can obtain the form:
Or
where KWI—the gain value of the WI amplifier, UREF—the reference voltage for the adopted measurement range.
In particular, it is important that the relation (9), resulting from the equation solution given in EN-60751 + A2 is equal:
On the other hand, if we take the resistor value RX to be the resistor value R0 from Formula (9), then Formula (20) will take the form (21).
From the analysis presented above, it follows that the structure of the active measuring bridge (Figure 2) with the stabilization of the current value in the bridge branch, in which the thermoresistor Rt is placed, provides the output voltage Uout in the form convenient for the substitution into Formula (8).
Comparing Formula (9) with Formula (21), Formula (8) can be written in the form (22) or in the form (23):
or
where SK—denotes the calibration constant equal to:
3. Selection of the Partition Coefficient α and the Resistance R0
In Formulas (3) and (11), the division coefficient α was introduced. Theoretically, in the bridges under consideration, it is possible to assume any resistance value in the range 100 ÷ 1000 Ω, which meets the condition RA = RB = R, while from the point of view of the resistance measurement Rt it is more important to be able to tune the values of these resistors, e.g., by laser correction. In practical applications, it is possible to take the resistance value RA and then match the resistance value RB to it very precisely. You can also do the opposite, i.e., take the value of RB resistance and then match the value of the resistance RA to it. The absolute resistance value of RA and RB is not important in this case, but the exact value of the ratio of these resistances is very important and must be equal to α = ½. An accurate value of α contributes to effective influence elimination of the wires resistance rp connecting the Pt100 sensor to the measuring amplifier system (Figure 2).
Another issue is the selection of the resistor value R0 (RX). If the temperature measuring range is to start from TC = 0 °C, the resistor value R0 must be R0 = 100.00 Ω. Selecting a different resistor value R0 allows you to set a different reference point for the initial value of the measured temperature. When selecting the resistor value R0, which is not an easy task, one can try to use highly stable MFR resistors with a small coefficient of the resistance change versus temperature. This type of resistors are difficult to obtain and very expensive. Therefore, a different solution was used in the design of the bridge measuring the amplifier. The resistor R0 is a more complex design. The resistor value RX was initially assumed to be a parallel combination of two MRF 1% (25 ppm) resistors with the respective values of 150 Ω and 330 Ω.
The resultant resistance value RX is RX ≈ 150 Ω//330 Ω ≈ 103 Ω. Then an additional resistor R1 with a potentiometer P1 connected in series was connected in parallel to RX. By changing the value of the potentiometer P1 one can vary the resultant value of R0 around the value R0 = 100 Ω ±1 Ω. By setting the adjustable resistor decade to Rt = 100.00 Ω it is possible to obtain a voltage value of ΔU(A−B) = 0.00 V (measured with the use of a 6½-digit voltmeter). Moreover, the potentiometer P1 makes it possible to change the sign of the voltage value ΔU(A−B). In this way, the resistance value R0 can be determined precisely.
The value of the current I0 flowing through the thermoresistor Pt100 depends on the type of the environment, in which the measuring sensor is located. It is connected with the phenomenon of self-heating of the thermoresistor Rt, because the electrical power P[W] is emitted on the thermoresistor and converted into heat:
When the temperature value t [°C] is measured in an air (gas) environment, the heat transfer between the environment and the thermoresistor Rt (heated due to I0 current flow) is weak. In an aqueous environment (liquids), the heat transfer from the heated sensor is more intensive. Therefore, lower values of I0 current are assumed for the measurements in a gaseous environment. In the liquid environment, the value of I0 current may be higher. In the project, it was initially assumed (for the analysis) that the measurement of temperature t (°C) takes place in the water environment. (e.g., in district heating systems). For this case, the safe current value I0 is I0 = 7 mA.
4. Problem of Connecting a Pt100 Sensor to a Measuring Amplifier
Figure 3 presents the sensor Pt100 and two wires connecting its terminals (x1 i x2) to wire terminals denoted as z1 i z2, which were connected to the operational amplifier input. The measurement system using the thermoresistor Pt100 generates two following problems:
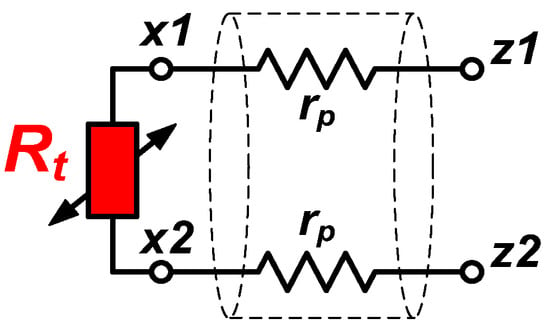
Figure 3.
The Pt100 sensor (thermoresistor) with connection wires of the resistance rp.
- The resistance rp of connecting wires is never precisely known;
- The environment temperature influences a change of the resistance rp value.
Figure 4 shows an incorrect (two-wire) connection of a Pt100 sensor to a bridge measuring the amplifier circuit.
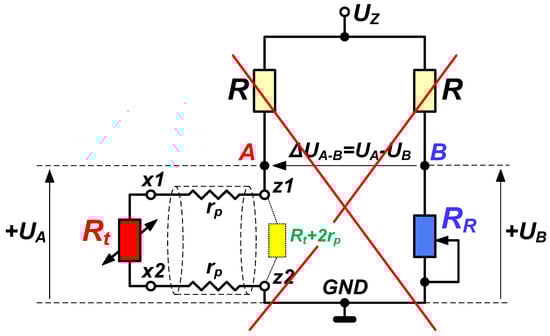
Figure 4.
The incorrect connection of the Pt100 sensor to the measuring bridge system.
In the bridge circuit of the amplifier (Figure 4) between terminals z1 and z2, the value of the measuring resistance defined by Formula (26) must also be taken into account [22].
With the long connection wires between the sensor location and the measuring bridge, the resistance value rp starts to be comparable to the resistance value of the Pt100 sensor. As a reminder, the resistance value of the Pt100 sensor is RPt100 ≈ 100.00 Ω. Figure 5 and Figure 6 show the 3-wire method of connecting the Pt100 sensor to the measuring amplifier. The applied 3-wire connection system eliminates the influence of changes in the resistance value rp on the measurement result of the resistance value of the Pt100 sensor Rt.
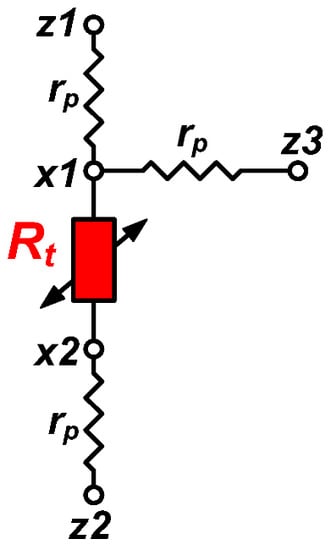
Figure 5.
The 3-wire circuit to connect the Pt100 sensor takes into account the wire’s resistance rp between the x1, x2 and z1 ÷ z3 terminals incorrect connection of the Pt100 sensor to the measuring bridge system.
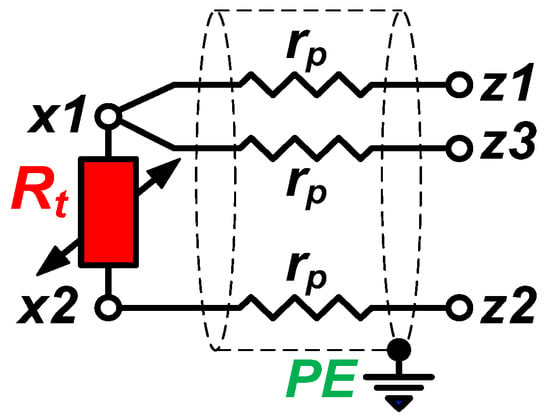
Figure 6.
The 3-wire circuit for the Pt100 sensor includes the wire’s resistance rp and their insulation.
Figure 7 shows the method of connecting the Pt100 sensor in a measuring amplifier circuit with the structure of a resistive measuring bridge. The resistance rp of the connection wire between the z2 and x2 terminals was connected to the bridge branch, in which the Pt100 measuring thermoresistor was located. The resistance rp of the connection wire between the z1 and x1 terminals was connected to the bridge branch, in which the reference resistor RX = R0 was located. This method of connection effectively eliminates the influence of the wires resistance rp. This property is due to the fact that the resistance of the connection wires rp in this connection adds simultaneously to the resistance of the thermoresistor (Rt + rp) and the reference resistance (R0 + rp) in the corresponding branches of the measuring bridge. On the other hand, such a connection does not disturb the balance of the measuring bridge because the changes in the resistance rp value (also due to temperature changes) take place simultaneously in both branches of the measuring bridge included in the measuring amplifier circuit (Figure 2).
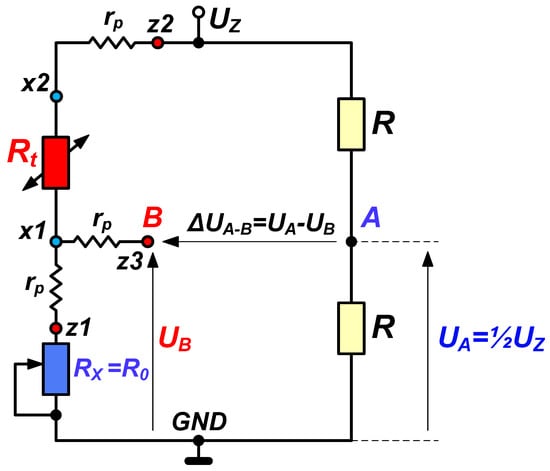
Figure 7.
The measuring bridge circuit with a 3-wire Pt100 sensor connection.
The resistance rp of the connection cable between the terminals z3 and x1 serves to transfer the potential of the x1 point to the z3 terminal of the measuring bridge. The use of the terminal z3 requires the use of a bridge measuring amplifier WI with a high value of the input resistance Rin. The value of the input resistance Rin of the instrumental amplifier WI (Figure 8) cannot cause a significant voltage value drop on the resistance rp between the terminal x2 and z3. In the actual circuit of the instrumental amplifier WI, the resistance value Rin is very high. Therefore, the problem raised here does not exist in it.
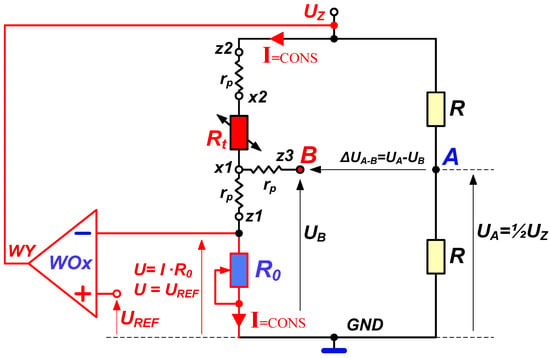
Figure 8.
The operational amplifier WOx forming the structure of the current source, stabilizing the current I value connected to the bridge circuit.
5. Implementation of the Active Measurement Bridge on the LM723 IC
The LM723 integrated circuit and the WI instrumental amplifier were used to build the measurement amplifier. The LM723 integrated circuit is a voltage stabilizer containing in its structure (Figure 9) all components appearing in Figure 2, i.e.:
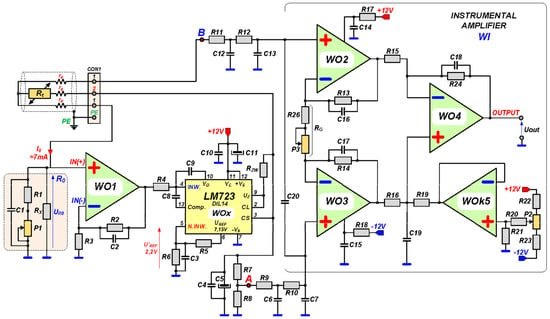
Figure 9.
Schematic diagram of the bridge measuring amplifier with current I stabilization based on LM723 IC.
- The operational amplifier WOx with the maximum output current I = 150 mA;
- The reference voltage source (temperature stable) with the voltage value UREF = 7.15 V;
- The output amplifier WOx has short-circuit protection which can occur between the wires connecting the Pt100 sensor and the measuring amplifier. The value of limiting current IZW is set by the resistor value RZW;
- The WOx amplifier is equipped with compensation (capacitor C8), which effectively eliminates the excitation possibility of the WOx amplifier.
Figure 9 shows a schematic diagram of an active measuring bridge with I value stabilization in the branch, where a Pt100 thermoresistor is placed. An important limitation arising from the use of the LM723 integrated circuit is that it is adapted to be supplied only with a single positive voltage. Therefore, the voltage value on the pins number 4 and 5 of this IC must be higher than 2 V.
The design of the LM723 chip allows the use of short-circuit protection in the form of a current limiter. A short circuit occurs when the failure of the insulation occurs. It happens when the wires connecting the Pt100 sensor to the measuring bridge fell in damage. Such a case is not so rare when there is a large distance between the place of installation of the Pt100 sensor, e.g., on the pipeline, and the place of installation of the measuring amplifier. The resistor value RZW can determine the limiting current IO. The maximum value of the IO output current of the LM723 chip is IO = 150 mA. The value of the IO current required for the proper operation of the bridge supply system with a Pt100 thermoresistor does not exceed IO = 10 mA.
Figure 10 shows the connection diagram of the bridge measuring the amplifier module (as the analog measuring part) using the microprocessor computing block. The analog-to-digital (A/D) converter is a circuit that converts the analog voltage from the output of the bridge measuring amplifier to a digital value. The digital form of this voltage value is used by the calculation algorithm. A 16-bit A/D converter was applied. It allows achieving the required accuracy of the t (°C) temperature value calculation. The calculated value of the temperature t (°C) is presented on a digital indicator. Technical capabilities of contemporary microprocessors allow for easy transmission of the measurement results and their archiving.
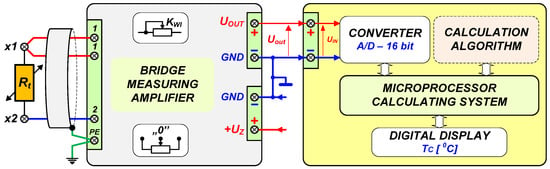
Figure 10.
Block diagram of the connection system of the bridge measuring amplifier and the microprocessor system calculating the temperature value.
As soon as the electronic modules have been completed, the entire measurement path should be calibrated. The calibration procedure should be as follows:
- (a)
- Set the value of the resistor Rt (calibration decade) Rt = 100.00 Ω for TC = 0 °C;
- (b)
- Measure the voltage value between points A and B of the active measuring bridge;
- (c)
- (d)
- (e)
- Set the resistor value Rt (calibration resistor decade) Rt = 313.71 Ω, which corresponds to the temperature value TC_MAX = 850 °C;
- (f)
- On the output of the measuring bridge amplifier set the value of the output voltage Uout = 5.00 V; the fine adjustment is made with the potentiometer P3;
- (g)
- Repeat the adjustment process from pt. 3 ÷ 5;
- (h)
- Enter into the calculation program the value of the calibration constant SK given by the Formula (24).
It is obvious that the exact value of the calibration constant SK is never known. This is so because the actual platinum used to build the Pt100 thermoresistor may have a different value of the calibration constants A and B (1). Therefore, the tuning of the calibration constant SK should be performed as follows:
- Using the calculation program based on Formula (2) it is necessary to achieve the indication value of the temperature TC = 850 °C. This value can be reached by entering the pre-calculated value of the calibration constant SK. For example, for the temperature value TC = 850 °C and the voltage Uout = 5 V the value of the calibration constant SK will be SK = −1,005,991.341991(341991);
- Then, by correcting the value of the calibration constant SK, the value of TC = 850.0 °C on the digital indicator should be obtained;
- Decreasing (e.g., using the calibration decade) the values of the resistor settings Rt according to the values in Table 1; check the correctness of the temperature indication TC(°C) calculated by the program. The temperature indication value must correspond to the values given in Table 1.
 Table 1. The tabulated resistance values of a Pt100 thermoresistor with the corresponding temperatures.
For other ranges of the maximum measured temperature values TC_MAX (°C), different values of the calibration constant SK must be adopted. The calibration constant always refers to the maximum voltage value Uout = 5 V, which is present at the output of the measuring amplifier. The analog-to-digital converter (A/D converter) used in the project can process the analog input voltage of the maximum value UIN−A/D = 5 V. Therefore, the gain value KWI of the measurement amplifier (representing the resistance/voltage converter—R/U) is regulated in such a way that at its output (for the Rt value resulting from the maximum temperature value) the voltage value Uout = 5 V is obtained.
Formula (28) is the universal calculation formula of the calibration constant value SK. Formula (28) assumes the value of B, R0, and Uout = 5 V. For the maximum temperature value tMAX (°C), the corresponding resistance value Rt is assumed according to the calculation results. Table 2 shows the calculated values of the calibration constant SK, referring to the maximum value of the measuring temperature range tMAX (°C), at which at the measuring amplifier output there will be the voltage of the value Uout = 5 V.
Table 2.
The calculated values of the calibration constant SK in relation to the maximum value of the temperature measurement range (value of voltage Uout = 5 V of the amplifier WI).
6. Calculation Software
Figure 11 shows a diagram illustrating the operation of the calculation program that was used in the study. In order to check the correctness of the calculations carried out by the program, an analysis of the algorithm enabling the temperature defining was carried out. The Formulas (44 ÷ 51) present the analysis carried out.
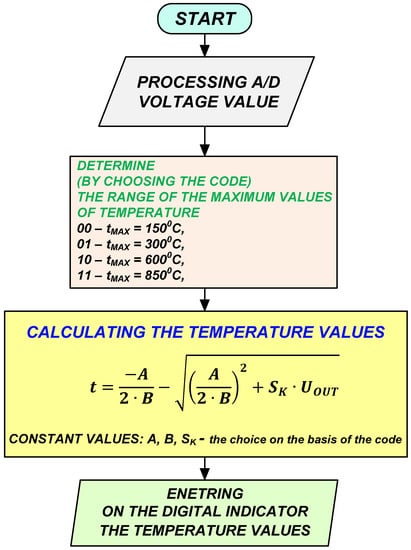
Figure 11.
Algorithm scheme for the temperature value t (°C) calculation.
For temperature t = 850 °C and at Uout = 5 V, the value of the calibration constant was: SK = −1,005,991.341991(341991).
For the output voltage value Uout = 5 V, the temperature value tMAX (°C) will be:
For the assumed temperature range TC = 0 ÷ 850 °C the value of the calibration constant SK can be calculated according to Formula (28). Then, based on Formula (37), the intermediate values of the output voltages Uout should be estimated.
By applying the voltage within the range Uout = 0 ÷ 5 V to the input of the A/D converter, it is possible to control the correct intermediate indications of the TC temperature values. For example, for calibration of the calculating system indications, the following relation was assumed: TC (°C) = 0 ÷ 850 → UIN−A/D = 0 ÷ 5 V. Table 3 presents the calculated intermediate values of the voltage UIN A/D for the range of the temperature value measurement TC = 0 ÷ 850 °C.
Table 3.
The intermediate values of the UIN A/D voltages.
Figure 12 shows the change in the resistance value Rt(Ω) = f(TC) for a temperature value change using the linear and quadratic approximation. As the TC temperature value increases, the linear approximation will cause an overestimation of the resistance Rt value. The EN-60751 + A2 standard introduces the possibility of presenting the characteristics of the Pt100 thermoresistor using the linear approximation [14,15,16,17]. Formula (38) defines the coefficient α.
where:
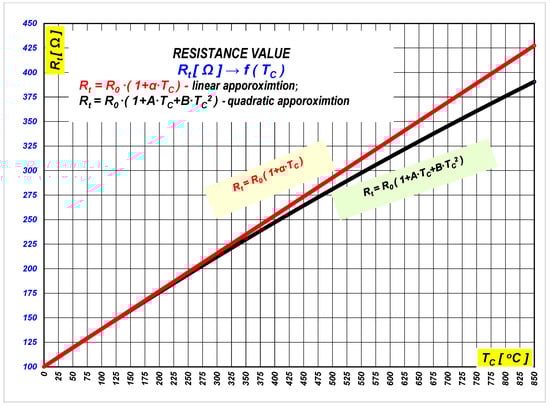
Figure 12.
The resistance value Rt = f(TC) for the linear and quadratic approximation in the range from 0 to 800 °C.
- R100—the resistance value of the thermoresistor Pt100 at temperature TC = 100 °C, R100 = 138.51 Ω,
- R0—the resistance value of the thermoresistor Pt100 at temperature TC = 0 °C, R0 = 100.00 Ω.
The value of α according to the definition given by Formula (38):
After the transformation of Formula (39), the resistance value Rt is determined for the range of the temperature value changes TC = 0 ÷ 100 °C. Formula (39) should be applied for the temperature measurement TC_MAX = 100 °C. This is the so-called linear approximation. For the temperature measurements TC_MAX ≥ 100 °C, even up to 850 °C, Formula (7) should be used—the so-called quadratic approximation [14,15,16,17].
Figure 13 shows the course of the temperature indication difference ΔTC for the linear and quadratic approximation.
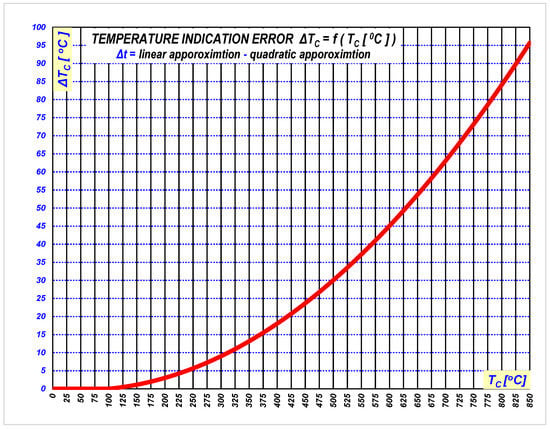
Figure 13.
Distribution of the temperature indication error Δt for the linear and quadratic approximation.
For example (Figure 7): for the temperature value TC = 500 °C the difference ΔTC of TC temperature readings will be +30 °C. The value of the ΔTC difference increases with an increase of the TC temperature value. After the analysis, it is clear that the use of the temperature measuring system presented in this paper very effectively reduces the value of the measurement error of the TC temperature. Especially in the range of measuring the TC temperature values ≥ 100 °C [14,15,16,17].
7. Conclusions
The material offered in the paper presents a ready to use, measurement circuit of the temperature meter based on Pt100 transducer. The novelty of the solution is proved by the patent PL226444B1 [16,17]. Really, passive and active bridges are well known but are still useful and are not out of the question. Authors suppose that using such a circuit, in order to design a precise and relatively cheap measuring device is probably an optimal decision. They are right that stabilizing the bias current in the device is also known, but it was mandatory to use such a solution in order to obtain the highest accuracy.
The article presents an active bridge system, which makes it possible to solve an important problem consisting in ensuring the correct indications of temperature values in a wide measuring range TC = 0 ÷ 850 °C. The temperature sensor (thermoresistor) Pt100 used in the system has the properties defined by the standard (EN-60751 + A2). The presented active bridge system integrates the properties of a bridge measuring amplifier with stabilization of the current value in the branch, in which the Pt100 sensor is placed.
According to the standard EN-60751 + A2 the Pt100 resistance temperature dependence has a form of a quadratic function. Solving this function, one can receive the relation between temperature value TC and the resistance value Rt. The root of the equation has a form (8). In this Formula, one can find a very characteristic term (9). Since the output voltage value UP is proportional to this term (10), then the temperature Tc is directly related to the measurement voltage UP. A real advantage of the proposed solution is no additional components to correct the temperature value, and it concerns the total measurement range (TC = 0 ÷ 850 °C) of Pt100.
The paper focuses on the comparison of the temperature measurement in a typical resistive bridge and in the developed active bridge. For the performed tests the correctness of the temperature measuring system using the Pt100 thermoresistor was verified. The highest quality of the measurements in a wide temperature range was analyzed and confirmed the gathered results.
8. Patents
- Piechowski, L. Patent PL272139A1, Linearization amplifier of resistance sensing elements, 30 October 1989.
- Piechowski, L.; Rządkowski, R. Patent PL226444B1, Method and system for determining real temperature of platinum thermoresistor, 21 December 2015.
Author Contributions
Conceptualization, methodology, analysis, supervision, J.I.; resources, analysis, simulation studies, software, writing—review and editing, project administration, A.M.; conceptualization, methodology, resources, analysis, simulation studies, software, writing—review and editing, L.P. All authors have read and agreed to the published version of the manuscript.
Funding
The project was financed within the program of the Ministry of Science and Higher Education called “Regionalna Inicjatywa Doskonałości” in the years 2019–2022, the project number 006/RID/2018/19, the sum of financing 11 870 000 PLN.
Institutional Review Board Statement
Not applicable.
Informed Consent Statement
Not applicable.
Data Availability Statement
Not applicable.
Conflicts of Interest
The authors declare no conflict of interest.
References
- Chang, H. Inventing Temperature: Measurement and Scientifc Progres; Oxford University Press: Oxford, UK, 2004. [Google Scholar]
- Michalski, L.; Eckersdorf, K.; Kucharski, J.; McGhee, J. Temperature Measurement. Meas. Sci. Technol. 2002, 13, 10. [Google Scholar] [CrossRef]
- Górecki, K.; Ptak, P.; Janicki, M.; Napieralska, N. Comparison of Properties for Selected Experimental Set-Ups Dedicated to Measuring Thermal Parameters of Power LEDs. Energies 2021, 15, 3240. [Google Scholar] [CrossRef]
- Górecki, P.; Górecki, K.; Zarębski, J. Accurate Circuit-Level Modelling of IGBTs with Thermal Phenomena Taken into Account. Energies 2021, 14, 2372. [Google Scholar] [CrossRef]
- Górecki, K. Influence of the Semiconductor Devices Cooling Conditions on Characteristics of Selected DC–DC Converters. Energies 2021, 14, 1672. [Google Scholar] [CrossRef]
- Padilla, B. Temperature Sensing with Thermistors; Texas Instruments: Dallas, TX, USA, 2020. [Google Scholar]
- Jack, K.E.; Nwangwu, E.O.; Etu, I.A.; Osuagwu, E.U. A Simple Thermistor Design for Industrial Temperature Measurement. IOSR J. Electr. Electron. Eng. 2016, 11, 57–66. [Google Scholar] [CrossRef]
- Li, W.; Xiong, S.; Zhou, X. Lead-Wire-Resistance Compensation TechniqueUsing a Single Zener Diode for Two-Wire ResistanceTemperature Detectors (RTDs). Sensors 2020, 20, 2742. [Google Scholar] [CrossRef] [PubMed]
- Zhao, Y.; Donaldson, W.R. Systematic Study on Aluminum Composition Nonuniformity in Aluminum Gallium Nitride Metal–Semiconductor–Metal Photodetectors, IEEE Trans. Electron. Devices 2018, 65, 4441–4447. [Google Scholar] [CrossRef]
- Maiti, T.K. A novel lead-wire-resistance compensation technique using two-wire resistance temperature detector. IEEE Sens. J. 2006, 6, 1454–1458. [Google Scholar] [CrossRef]
- Tipparat, J. Interface Circuit for Three-Wire Resistance Temperature Detector with Lead Wire Resistance Compensation. In Proceedings of the 2019 Research, Invention, and Innovation Congress (RI2C), Bangkok, Thailand, 11–13 December 2019; IEEE: New York, NY, USA, 2020. [Google Scholar]
- Xu, K. Silicon electro-optic micro-modulator fabricated in standard CMOS technology as components for all silicon monolithic integrated optoelectronic systems. J. Micromech. Microeng. 2021, 31, 054001. [Google Scholar] [CrossRef]
- Erkan, K.; Akkoyunlu, B.; Balkan, E.; Tayanc, M. A portable borehole temperature logging system using the four-wire resistance method. J. Geophys. Eng. 2017, 14, 1413–1419. [Google Scholar] [CrossRef] [Green Version]
- Standard EN-60751 + A2, Industrial Platinum Resistance Thermometers and Platinum Temperature Sensors. 19 September 2008. Available online: https://standards.iteh.ai/catalog/standards/clc/597005af-1426-4595-8a9a-3d65d1563388/en-60751-2008 (accessed on 2 December 2021).
- Plessis, M.D.; Wen, H.; Bellotti, E. Temperature characteristics of hot electron electroluminescence in silicon. Opt. Express 2015, 23, 12605. [Google Scholar] [CrossRef] [PubMed] [Green Version]
- Piechowski, L. Linearization Amplifier of Resistance Sensing Elements. Patent PL272139A1, 30 October 1989. [Google Scholar]
- Piechowski, L.; Rządkowski, R. Method and System for Determining Real Temperature of Platinum Thermoresistor. Patent PL226444B1, 21 December 2015. [Google Scholar]
- Robert, A. Troubleshooting Analog Circuits; Polish Edition Copyright 2005 by BTC Korporacja; BTC Korporacja: Legionovo, Polish, 1991. [Google Scholar]
- Camenzind, H. Designing Analog Chips by Hans Camenzind; Polish Edition Copyright 2010 by BTC Korporacja; BTC Korporacja: Legionovo, Polish, 2005. [Google Scholar]
- Kitchin, C.; Counts, L. A Designer’s Guide to Instumentation Amplifiers, 3rd ed.; Analog Devices 2006; Polish Edition Copyright 2009 by BTC Korporacja; BTC Korporacja: Legionovo, Polish, 2006. [Google Scholar]
- Carter, B.; Mancini, R. OP AMPS for Everyone, Texas Instruments Incorporated; Polish Edition Copyright 2011 by BTC Korporacja; BTC Korporacja: Legionovo, Polish, 2008. [Google Scholar]
- Xu, K. Integrated Silicon Directly Modulated Light Source Using p-Well in Standard CMOS Technology. IEEE Sens. J. 2016, 16, 6184–6191. [Google Scholar] [CrossRef]
Publisher’s Note: MDPI stays neutral with regard to jurisdictional claims in published maps and institutional affiliations. |
© 2021 by the authors. Licensee MDPI, Basel, Switzerland. This article is an open access article distributed under the terms and conditions of the Creative Commons Attribution (CC BY) license (https://creativecommons.org/licenses/by/4.0/).