Abstract
One of the strategic objectives of the European Union is a reduction in greenhouse gas emissions and improvement of energy efficiency by at least 32.5% in different areas of the economy by 2030. However, little is known about the impact of payment in retail on energy consumption. The purpose of this paper is to assess the chain of losses of time and energy, and therefore financial losses, that occur due to the imperfection of payment infrastructure and instruments using data of cashiers’ working time. The research is based on a regression analysis method, where the energy cost per payment transaction is considered in this study as a function of the number of customers per hour and the energy cost. The results of the panel models highlight that the number of customers per hour has a negative impact on the cost of energy per payment transaction. Furthermore, modern means and methods of payment, including cryptocurrencies, do not solve the problem of the excessive time that it takes to service payments, which entails a waste of energy and money. The empirical results give valuable insights into how to best organise payment in retail to achieve lower energy costs and improve energy efficiency in payment infrastructure.
1. Introduction
By September 2020, the main climate and energy targets of the EU countries up to 2030 were based on a reduction in greenhouse gas emissions by at least 40% (compared with the 1990 levels). However, the European Commission has proposed to increase the target for reducing greenhouse gas emissions, including emissions and removals, by at least 55% compared with the 1990 levels by 2030. Other climate and energy targets that should be reached by 2030 include at least a 32% share of renewable energy in energy consumption and an improvement of energy efficiency by at least 32.5% []. To achieve this objective, investment in energy efficiency and renewable energy sources to the tune of EUR 275 billion per year is needed in the period 2021–2030 []. It is important, however, to note that “energy efficiency is the most cost effective way to reduce emissions, improve energy security, enhance competitiveness and make energy consumption more affordable for all consumers” [] in each economic sector. Furthermore, the main energy consumers of the EU are the transport and industry sectors [], which have the greatest potential to implement energy efficiency measures. Nevertheless, energy consumption in other sectors of the EU economy is significant and they should also be taken into account in achieving the targets of a climate-neutral economy by 2050 and the sustainable development of society [,,,,,].
One of the sectors receiving insufficient attention today in the context of energy consumption is payment instruments, systems, and infrastructure. In addition to their crucial role in the organisation and circulation of money, they also have their cost, consisting of the expense of payment equipment, infrastructure, and payment instruments on the one hand, and the expense of energy for their manufacture and maintenance on the other. In this case, for example, the maintenance of blockchain-based payment infrastructure requires high electricity costs, which are now estimated at 8 GW and are equivalent to the costs incurred by Austria per year (8.2 GW) [,].
Modern payment methods have a significant impact on the daily lives of the population, the loyalty of consumers to the seller who accepts such methods, and the commercial activity of businesses []. In addition to time, payment also consumes energy, the cost of which should be determined for the proper cost management of companies. The importance of this issue is emphasised by the fact that 97% of social costs for servicing payments [,] are borne by trade facilities and banks [,,]. Some of these costs are associated with the provision of energy to the payment infrastructure and the creation and maintenance of the means of payment. Therefore, the issue of energy efficiency in this industry is of significant importance both at micro and macro levels in the economic context, and for environmental sustainability in general. Consequently, the total environmental impact caused by the 3 billion Euro banknotes produced in 2003 was equivalent to the environmental impact of every European citizen driving one kilometre or leaving a 60 W light bulb on for 12 h []. Most of these emissions come from the supply chain of financial services and energy, which is used for the production, transportation, and utilisation of cash, equipment for servicing payments, mining of cryptocurrencies, and ensuring their circulation. This applies to a part of the world where the environmental issues of production, in particular of banknotes, are given considerable attention, and consumers tend to prefer non-cash alternatives. However, the majority of people in the world live in countries where at least 90 percent of transactions are in cash [].
In this study, the energy efficiency of a payment transaction should be understood as not only the fastest method of payment, but one whose energy consumption is as low as possible, thus ensuring that it is sustainable. This is the amount of energy spent on initiating, confirming, and completing a payment transaction per unit of time. Accordingly, increasing or improving energy efficiency is to reduce this amount or to increase the number of operations per unit of time, as well as, accordingly, to increase the number of customers served per unit of time.
Undoubtedly, high-speed data transfer technologies [] and the implementation of artificial intelligence in payment transactions [,,] will speed up payment times, but today waiting times account for a significant share of the total time of interactions between sellers and customers, as shown in this study.
With this in mind, the problem tackled in this study is that excessive time is spent on servicing payments made by currently available payment methods and means of payment. This entails a waste of energy and money due to the imperfection of the payment infrastructure and payment instruments.
Thus, the purpose of the study was to assess the chain of losses of time and energy (and therefore financial losses) that occur due to the imperfection of payment infrastructure and payment instruments. In this case, the losses associated with each resource are directly proportional to those of the resource preceding it in this chain. This is similar to what the previous research literature has revealed [], when a monetary-based activity measurement approach for productive sectors was combined with labour force from the European productive sectors. The prior research in the field of payments mostly focuses on the time required to complete a payment transaction, in order to assess buyer loyalty to the seller [,,] and trust in the payment technology—in particular trust in mobile payments [,] or resistance to their use []. All of these prior studies discuss the benefits of saving time when making mobile and other non-cash payments. The study by M. Valentová, M. Horák, and L. Dvořáček [] is devoted to the role of time in transaction costs that arise during the transfer of property rights or information and knowledge. The authors emphasize that “one of the key factors influencing transaction costs is time” [], but their study focuses on energy efficiency programs and government policies in this area, rather than on payment transactions. Another study of the use of blockchain technology is devoted to electricity consumption in financial transactions and aims to discuss methods that can be used to reduce electricity consumption []. It also analyses the energy consumption of today’s predominant PoW blockchains, which are the basis for most cryptocurrencies []. The latest payment technologies cannot be fully used in the implementation of the concept of a smart city due to the huge energy needs of these systems, which actually contradicts the idea of reducing energy consumption to achieve sustainable development []. The results of a study of the effect of financial development on renewable energy consumption suggest that “the banking sector, the capital market, and the bond market development can promote the implementation of green technologies in the energy sector” [].
Thus, modern research does not take into account the time of payment as a factor of costs and related energy and financial resources lost during the period of its inefficient use in payment transactions with payment instruments such as payment cards, mobile payments, or cash. This study fills this gap in the scientific literature.
This study makes the following contributions to the existing body of knowledge. First, due to a lack of evidence that too much energy is spent on servicing payments in retail, this study seeks to expand current knowledge of the imperfection of modern payment instruments and means of payment. To the best of the author’s knowledge, this document is one of the first to quantitatively analyse the impact of payment service time on costs associated with electricity consumption in retail outlets in the European Union. Empirical findings can help managers of these firms take action to improve customer service approaches. Central banks could also use this research for the development of payment infrastructure in the context of sustainability. While this article joins a large body of literature attempting to explain the relationship between payment instruments and payment time, it fills the gap in the literature by focusing on energy-related costs and using data from retailers. The analysis shows that the waiting time for payment, which, given the current level of development of means of payment and instruments, takes up a significant part of cashiers’ time. This leads to increased energy costs.
The paper is organized as follows. After the introduction, the author demonstrates the relevance of the energy efficiency of payment methods and payment infrastructure based on the scientific literature analysed. Then, data from the author’s own research is provided, which confirms the relevance of the issue of time, energy, and financial resources spent on the service of retail payments. Section 3 and Section 4 present the data and the methodology used. The empirical results are presented in Section 5. The final parts present conclusions, discussion, and limitations.
2. Literature Review
Currently, according to various estimates, there are 13 types of payment for goods and services []. The most popular among them are cash and non-cash payments. At the same time, the popularity of the latter, according to central banks, is constantly and significantly growing [,]. These are mainly payment card and mobile transactions which, according to the European Central Bank, have reached 52% of all transactions. These are obviously associated with the production of contactless cards based on near-field communication (NFC) technology [,] such as Visa Paywave and MasterCard PayPass for contactless payments, as the wide transmission of COVID-19 has also prompted the need to avoid contact with banknotes and coins [,,,]. SARS-CoV-2 (severe acute respiratory syndrome coronavirus 2), which causes COVID-19, can survive for 72 h on plastic and stainless-steel surfaces, 4 h on copper surfaces, and 24 h on paper surfaces []. People infected with the virus can transfer it to paper money or coins, potentially making any physical currency a carrier of the virus [].
The use of mobile payments is also influenced by the trust of users and their cognitive perspectives, which depend on empirical problems (e.g., hacker attacks, breaches of confidentiality, etc.) []. This is one of the reasons why cash continues to be used even where it would be possible and also convenient to make non-cash payments. Another reason for using cash is that “cash payment could represent a stronger self-regulating tool” [].
Today, even in the world’s most successful countries, there are still places where access to payment infrastructure can be limited [], so the means of payment there is very likely to be cash. However, cash also requires significant energy consumption for its production, transport, circulation, destruction, etc. These trends pose two important problems. First, payment system expenses are 1% to 3% of gross domestic product [,]. This cost falls markedly when electronic payments replace paper-based payments because the social cost of an electronic payment may only be one-third to one-half that of a paper-based transaction []. Second, the environmental impact of cash payment systems is considerably high. For example, that of the Dutch cash payment system in 2015 was “2.42 milliPoint (expressed in eco points. “The standard Eco-indicator values can be regarded as dimensionless figures. As a name we use the Eco-indicator point (Pt). In the Eco-indicator lists usually the unit milli-point (mPt) is used, so 700 mPt = 0.7 Pt. The absolute value of points is not very relevant as the main purpose is to compare relative differences between products or components. The scale is chosen in such a way that the value of 1 Pt is representative for one thousandth of the yearly environmental load of one average European inhabitant” [66].) [] and its global warming potential (GWP) was 19 million kg CO2 equivalents (CO2e). For an average single cash transaction, the environmental impact was 654 microPoint and the GWP was 5.1 g CO2e. The operation phase (e.g., energy use of ATMs, transport of banknotes and coins) (64%) and coin production phase (31%) had the largest impact on the environment, while the operation phase also had the largest impact on climate change human health (89%) and climate change ecosystems (56%)” []. “In 2020, 389 natural disasters were reported. The results of these disasters were: 15,080 people killed, 98.4 million people injured and $171.3 billion in economic losses. Of these, 41 cases were recorded in Europe, resulting in 42.9% of all deaths during the mentioned period” [,]. The financial sector, as one of the most sensitive economic sectors, is alert to all trends and changes in the environment []. Therefore, research in the financial sector in the context of climate change, energy efficiency, and green energy sustainability is one of the key directions in the modern business environment. “In recent ten years, due to the global energy crisis and environmental pollution, the related publications grow exponentially in the field of energy and environment” []. Numerous studies in the modern scientific literature in the field of energy sovereignty and energy crisis during the COVID-19 pandemic [,] are devoted to this direction. The financiers and the author of this article also could not stand aside, disregarding this line of research. Such studies are especially important in the context of the emphasis on the use of “green energy” and sustainable development in order to highlight their role in every socio-economic sphere of modern society.
At the same time, the tendency to expand the coverage of the payment infrastructure [] and the increasing proportion of the population living in cities indicates that the ability to pay for goods or services in the non-cash form will also increase. Water, energy, and transport are the most important infrastructure in growing cities with an increasing population [].
For both individual users and sellers who are also interested in using modern technologies for accepting payments, the speed of payment is important [] in view of the fact that rapid, timely, and cost-effective movement of goods and people fundamentally influences the economy and quality of life []. Some studies indicate time as one of the most important factors in determining the form of payment []. Other factors, which depend on the speed of payment, include staff working time, customer waiting time, and costs generated by waiting for transaction completion.
In addition, one of the main quantitative indicators of these costs is energy in the broad sense [,], as well as in the narrow sense of the term—for example, electricity needed for the operation of a commercial entity that sells goods or provides services. Therefore, while waiting for a transaction on a payment in non-cash form, the seller incurs costs which become even higher when the payment is made in cash, and these costs rise as the number of denominations used in the transaction increases. In this case, cash or client flows are not generated. In other words, the seller’s income is inversely proportional to transaction time [], as the energy expended is lost: a unit of expended energy does not bring any new clients and does not generate income. In such case, the buyer also loses time and opportunities while waiting passively for the completion of the transaction. The introduction of non-cash payments entails advantages over cash payments for both sellers and buyers. According to Ming-Hsiung Hsiao [], this is value co-creation. For merchants, the benefits generated can be realized in the form of profits or performance. ”For customers the value created is typically conceptualized as the subjective perception of the trade-off between benefits and sacrifices, both in monetary and non-monetary terms, involved in the exchange” []. At the same time, the author also relates the time and energy required to non-monetary benefits. In my opinion, this statement is false, as energy (at least for a seller who has a space that consumes a lot of electricity) is defined in absolute financial terms. Moreover, the cost of this energy is directly proportional to time.
Depending on the method of payment and other factors, the transaction waiting time can be from a few seconds [], if the payment is made by bank card or mobile payment, or a few minutes (in the case of cash payment) to several hours or even days (waiting for a bitcoin transaction to be confirmed (based on blockchain technology) at a certain time point lasted 3380 min) [,,]. The acceleration of the transaction time has been facilitated by the implementation of NFC in payments. This technology saves time and, consequently, other resources during clients’ payments at outlets. The convenience of such a payment method is difficult to overestimate given the development of the smart industry involving phones, watches, etc. with NFC tags, which are tools used by methods such as Apple Pay and Google Pay, among others []. At the same time, paying with these technologies feels much less “painful” than paying in cash [,]. Furthermore, existing studies [] show that, for several scenarios, touch, on which the NFC payment algorithm is based, is the preferred method of interaction for diverse groups of users because of its intuitive and error-tolerant nature [].
One of the newest payment methods is cryptocurrencies, defined as “digital financial assets, for which ownership and transfers of ownership are guaranteed by a cryptographic decentralised technology” [], which are also extracted and used for other purposes, such as obtaining a fee for mining, obtaining speculative investment income, implementing anonymous transactions, etc. [,]. However, the use of cryptocurrencies in retail is limited by a slow confirmation of transactions and high commissions []. The lower the commission for the implementation of the operation, the longer the waiting time for its completion [].
Biometric cards (which will not replace the existing form factors of payment but will complement them or combine with state-issued ID cards and improve the payment system), identification, and management of things in the Internet of Things could become the next step in the development of payment technologies [,,,].
Thus, all previous studies have dealt with the relationship between payment methods and payment security [,], psychological aspects of self-regulation [], social costs of payments, the impact of cash settlements on the environment [,], and the implementation and use of mobile payments in the context of ease of use [,]. Several studies have examined the factors affecting consumers’ choice of a payment instrument [], as well as energy costs when using blockchain []. There are also studies on transaction costs in the context of energy efficiency and time as a key factor influencing transaction costs [], which provides evidence against the predominant negative impact of time-related factors. Some research show that “an increase in average work time by 1% leads to an increase in energy use or emissions by >1%” []. A few studies “argue that working time reduction (WTR) could be an environmentally beneficial demand-side strategy for reducing resource use and GHG emissions” []. However, these and other studies are not focused on transactions’ costs related to time, energy, and financial costs that occur in retail and that are associated with payment for goods or services.
Unlike previous research, this study examined the relationship between the time taken to complete a payment transaction in retail and the electricity consumption. This entails financial losses due to imperfect payment infrastructure and payment instruments. In this study, these losses were determined using simple linear regression by calculating the time cashiers spend servicing customers and the cost of energy expended while servicing these payments.
The possibility of addressing the lack of energy-efficient payment methods motivates this research. It is highly important to create a healthy environment in the EU and to analyse how to reduce the time for completing a payment transaction, which would lower energy consumption and sellers’ costs, increase customer satisfaction, and ultimately help reduce the impact of payment transactions on greenhouse gas emissions.
Second, the study hopes to communicate that modern means of payment and payment methods do not address the problem of the excessive amount of time that it takes to service payments, the waiting time to complete the payment, lines at the cash register, and customers’ satisfaction. These issues entail energy losses from the cost of heating and cooling spaces in the cooler and warmer months, respectively, and additionally entail other energy losses. The approach to the buying algorithm should be changed through the broad use of artificial intelligence, smart contracts, and the Internet of Things.
The third contribution of the research lies in the study of energy losses in the context of reducing greenhouse gas emissions. The reduction in payment confirmation times by improving existing payment methods will not fundamentally solve the problem of greenhouse gas emissions. However, this niche problem in the energy sector is one of the thousands of spheres of human life in which it is worth looking for solutions. At the same time, it is a sensitive area for most people since it is around retail purchases that most of the population’s daily lives revolve.
Therefore, this research is expected to contribute to the literature by providing important data on the performance of retail point-of-sale cashiers and the solutions that can be found in various economic aspects: cashier working conditions, energy costs, customer satisfaction and loyalty, purchasing and selling approach, etc.
3. Data
3.1. Data for the Time Losses Assess
The study was based on cashiers’ performance in a supermarket in Poland during the period from 17 to 22 December 2019. This period was chosen as it represented the time when the load that is placed on cashiers, and on all the supermarket’s resources related to customer service, reached its yearly peak due to the demand for gifts and traditional food for the Christmas season. The study was conducted based on 109 cashier shifts. The sample of 109 shifts in a supermarket in Poland made it possible to extrapolate the generalized data used at national or transnational (EU) levels because the payment technology is identical throughout the country and throughout the EU, and the equipment used by cashiers is either similar or the same. The data were obtained from the ERP system of one of the supermarkets in Poland, one of the largest supermarket chains in the EU []. The panel data collection was carried out by an automated supermarket accounting system. Its function was not only in the cashiers’ work accounting, but also in the information accumulation about purchase, payments, balances, and time, as well as the inactivity of cashiers when there is no request for processing—that is, there is no queue at a checkout and a cashier is idle. The data processing and calculation of derived indicators were carried out by the author to identifying the correlation between time and energy costs.
As a dependent variable, the energy cost per payment transaction (CPT) was considered (see Table 1). It is the ratio of the energy cost by a POS per shift to the number of customers served per shift. The share of the time for a customer payment for purchases in the total working time of the cashier (RTPT) shows how much time a cashier spends with customer payment in relation to the cashier’s total working time. Time for a payment transaction (TPT) is the time after the cashier has finished scanning the purchases and initiated payment at the cash register. This is the time between the payment initiation by the cashier and its completion, which is confirmed by the cashier at the cash register after the payment is made. The number of customers serviced by the cashier’s shift (CN), the cashier’s working time (WT), the time for purchases scanning (TS), and the time for a payment transaction (TPT) were obtained from the ERP system of the supermarket.

Table 1.
Variables employed in the panel data analysis.
Table 2 shows descriptive statistics for the full unbalanced panel dataset with 109 cashier shifts. The standard deviation of CPH is 8.14, indicating how diverse the sample was with respect to the customers served per hour. The lowest level of this indicator (14.35) has the cashier needing an average of 52 s, which is the most time spent on servicing a payment (Figure 1). However, this same cashier has the best results in terms of the share of the time for payment by customers in the total working time of this cashier (26.85%). However, this indicates the quality of his work in terms of scanning purchases and other skills. This is an extreme case in the sample, as shown in Figure 1. In the panel data, the minimum level of customers per hour (58.15) is registered by the cashier, whose other indicators are at a level close to the average sample. On average, 42.78% of the working time of a supermarket cashier is spent on payment processing (RTPT), and on 19 cashier’s shifts, more than 50% of their working time is spent on payment processing. The total energy costs for payments in the sample amount to EUR 18,965.42 for 19,732 customers.
Table 2.
Descriptive statistics for variables employed in the analysis.
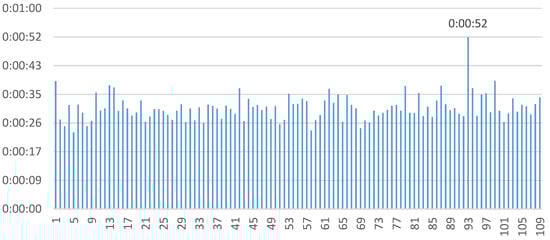
Figure 1.
The average payment time per customer. Source: Author’s elaboration based on empirical studies.
It is necessary to consider at this point the stages of this process, which depend on the type of payment means and tools (in the case of an automated cash desk operated by a cashier):
- Cash payment:
- (a)
- The cashier informs the customer of the payment amount;
- (b)
- The cashier chooses a payment form in the information system;
- (c)
- The cashier waits for the customer to produce the cash;
- (d)
- The cashier counts the cash;
- (e)
- The cashier counts the change;
- (f)
- The customer counts the change while the receipt is printed.
- Non-cash payment:
- (a)
- The cashier informs the customer of the payment amount;
- (b)
- The cashier chooses a payment form in the information system;
- (c)
- The cashier waits for the customer to use the payment terminal;
- (d)
- The payment terminal displays the transaction confirmation;
- (e)
- The receipt and the payment confirmation are printed.
- The form of mixed payment in which, in addition to the combination of the two previous payment methods used to make a purchase, there can also be partial payment by vouchers, electronic money, discount coupons, etc.
Table 3 presents the correlation matrix of dependent and independent variables. The cost of energy per payment transaction indicator shows a negative correlation with the customers per hour. In addition, there are negative correlations between the number of seconds for a payment per client and the number of customers per hour, and between the share of the time for purchases scanning in the total working time of the cashier and the number of customers per hour. It also shows the multicollinearity among the variables WT, TS, and CN. The cost of energy per payment transaction directly depends on the number of seconds for a payment per client.
Table 3.
Correlation matrix.
3.2. Data for the Energy Losses Assess
To estimate the costs associated with the implementation of payments in the European Union, the European Central Bank’s data on payments in 2019 was used. These data show that 86,691,000,000 card payment transactions were made, out of a total of 152,498,600,000 payments [].
Poindus Systems Corp.’s POS devices’ average electricity consumption was determined to be 111.66 Watts, based on three of its fairly typical small business systems, which consume 65 Watts (VariPOS 750 model), 90 Watts (VariPOS 850 and VariPOS 890 models), and 180 Watts (VariPPC 250i/270i models) [,].
The average cost of electricity in the EU is 115 euros per 1 megawatt for non-household consumers [].
Additionally, the energy consumption in tonnes of oil equivalent was calculated in order to determine how much of the total amount of energy consumed in the EU goes towards servicing the POS, specifically payment transactions, taking into account that 1 tonne of oil equivalent (toe) is an amount of energy equal to 11.63 megawatt hours (MWh) [].
The data on the time to make a payment, which is 30.31 s per customer, was based on the research. At the same time, payments at the cash registers involved in the study were made using both cash and non-cash payment methods. As part of the simulation for the analysis of energy consumption, further calculations show the costs provided when only non-cash payment methods and cryptocurrencies are used. For this, the data on the minimum, maximum, and average waiting times for the implementation of the transaction were used, namely:
- It takes about two seconds to confirm a transaction through the POS terminal, according to the official website of the global payment technology company Visa, after inserting a payment card or other payment device to the terminal or holding it near a contactless terminal []. A waiting period is possible when the quality of the connection between the payment terminal and the servers involved is poor.
- Cryptocurrency payment is based on blockchain technology. The average transaction confirmation time on 5 May 2021 was 3380 min (202,800 s) []. The minimum amount of time required to approve a transaction block when using a blockchain is 10 min [,], and the maximum is the value of the average transaction confirmation. In order to carry out a simulation and find out what the energy and financial costs would be if all payments were made using cryptocurrency, the same number of payments were used for the calculations.
This issue when working with cash is unpredictable because the combination of the amount of the sale and the assortment of banknotes and coins needed for payment is the not predictable.
4. Methodology
Following the most relevant previous studies [,], the energy cost per transaction is the indicator for assessing the impact of the number of customers per hour in order to further assess the energy efficiency of payment transactions. Therefore, the energy cost per transaction (CPT) in terms of the energy efficiency of the payment transaction was considered in this study as a function of the number of customers per hour (CPH) and the energy cost (EC) as follows:
where cashiers’ shifts are denoted by the subscript i (i = 1, …, N), and b1, b2 are the coefficients of the regressors estimated by the regression analysis. It shows that, assuming the variable remains fixed, a one-unit increase in one explanatory variable increases (or decreases) the cost of energy per payment transaction by b units. εi is the random error term capturing all factors that influence the cost of energy per payment transaction but that are not included in the model specification’s variables.
CPT = b0 + b1 * CPHi + b2 * ECi + εi
At the same time, CPH is a measure that is determined as a function of the time for a payment transaction (TPT), a cashier’s working time (WT), the time for purchases scanning (TS), the number of customers (CN), and other factors such as automatization level of POS, cashier’s skills, and equipment reliability. The number of customers per hour can be described by the following equation:
where cashiers’ shifts are denoted by the subscript i (i = 1, …, N), and b1, b2, b3, b4 are the coefficients of the regressors estimated by the regression analysis. It shows that, assuming the variable remains fixed, a one-unit increase in one explanatory variable increases (or decreases) the number of customers per hour by b units. εi is the random error term capturing all factors that influence the measure CPH but that are not included in the model specification’s variables.
CPH = b0 + b1 * TPTi + b2 * WTi + b3 * TSi + b4 * CNi + εi
Given that the energy cost per transaction is the indicator for assessing the level of a payment transaction’s energy efficiency, lower costs for a payment transaction are critical for an enterprise’s energy efficiency. It means that the more customers are served per unit of time, the better the cashier’s efficiency and the lower the costs for a payment transaction are.
A negative relationship between the energy cost per transaction and the number of customers per time unit is expected. The following hypothesis was tested:
Hypothesis.
increase in the number of customers per hour leads to a reduction in the energy cost per transaction.
The economic theory behind the derivation of Equations (1) and (2) is represented by the following:
- −
- Customers per hour indicator shows the efficiency of customer service by a system of the cash register, cashier, payment infrastructure, and payment instruments. The more customers per hour who are serviced, the better and faster the system works, which leads to economic effects for enterprises such as reduced costs for maintaining cash registers, personnel, and equipment since one cashier shift can serve a larger number of customers.
- −
- A cashier’s work time contains two main stages: the purchase registering or scanning and the payment step. The time for a payment per client is one of the key indicators, which shows the efficiency second stage of a cashier’s work. The shorter that the time for a payment is, the higher is the level of the customer servicing system efficiency by POS of this stage.
- −
- The energy cost per transaction is a measure that shows the energy efficiency of payment infrastructure and payment instruments. Whatever payment methods are used, the time needed to complete the transaction remains relevant. In the case of cash, in order for a transaction to take place, it must be double-handled by both the cashier and the customer. For bank cards, it is the time needed to confirm the transaction by banks, payment organisations, and other participants in the payment transaction, as well as the time of the transmission and receipt of information from these participants, which also depends on the seller’s devices and the technical capabilities of telecommunication operators. If cryptocurrencies are used, time is needed for the transaction to be confirmed by other network participants. The more time that is needed for a payment transaction leads to more energy that is consumed by the payment infrastructure and higher costs that are borne by enterprises such as trade facilities.
The model in Equation (1) represents a general specification, aimed at examining the role of time indicators, respectively CPH and the energy cost on the cost of energy per payment transaction, where the energy cost per payment transaction is treated as a dependent variable while the number of customers per hour and the energy cost are treated as explanatory variables. In the analysis, potentially omitted variables were POS types with different levels of energy consumption, equipment speed, automatization level of POS, cashier’s skills, and equipment reliability, and these characteristics were expected to be correlated with the number of customers per hour.
5. Research Results
5.1. Empirical Results
Table 4 reports the results of the estimations of the measure of energy costs per transaction. According to the panel model, the number of customers per hour has a negative impact on the cost of energy per payment transaction. An increase in the customers per hour indicator leads to a reduction in the energy cost per transaction of EUR 0.0084, and this effect is statistically significant at 0%.
Table 4.
Empirical results.
The robustness of the findings was tested by running the models only on a subsample formed by cashier shifts, with the different share of the time for a customer payment for purchases in the total working time of the cashier. The results are displayed in Table 5 and Table 6, and they confirm the previous findings. Overall, the results suggest that the number of customers per hour and the energy cost have a negative impact on the cost of energy per payment transaction. The findings are in line with those reported by [,], the results of which indicate that a decrease in working time by 1% may reduce energy use and greenhouse gas emissions by about 0.7% and 0.8%, respectively.
Table 5.
Empirical results on a subsample formed by above average share of the time for a customer payment.
Table 6.
Empirical results on a subsample formed by below average share of the time for a customer payment.
Both subsample tests show a statistically insignificant effect of energy costs on the dependent variable (p = 0.48 and p = 0.059)
Table 7 reports the results of the estimations of the measure of the customers per hour. According to the panel model, the cashier’s working time has a negative impact on the number of customers per hour. A reduction in the cashier’s working time indicator leads to an increase in the customers per hour of 42.3694 persons, and this effect is statistically significant at 0.04%. The measures TPT, TS, and CN were not taken for calculation, since TPT and TS suggested multicollinearity with WT, and CN showed a weak correlation.
Table 7.
Empirical results on the customers per hour (CPH) indicator.
5.2. Research Results’ Extrapolation
As part of this study, we focused on the cost of electricity used to ensure the operation of a retail trade enterprise—in particular, the cost that most directly related to the work of the cashier, i.e., electricity used by the cash register equipment (payment terminals and automated workplaces of cashiers).
Therefore, the following data were obtained on the costs incurred while waiting for the completion of a POS terminal operation in the European Union (Table 8).
Table 8.
The maintenance cost of a POS terminal to complete a payment transaction.
In 2019, sectors other than the industry and the transport sector of the EU (27 countries in 2020) used 129,004,425 thousand tonnes of oil equivalent [], which is 13.8% of total energy use (935,607,268 thousand tonnes of oil equivalent). While energy costs for servicing payments account for only 0.00132% of total energy consumption in the EU, there are thousands and thousands of areas where energy efficiency can and should be improved, from match production to payment transactions, which are the subject of this study.
6. Conclusions and Discussion
The aim of the paper was to assess the chain of losses of time and energy, and therefore financial losses, that occur due to imperfect payment infrastructure and payment instruments. A model based on a regression analysis method was built to demonstrate the dependence of the cost of energy per payment transaction at the checkout in a retail outlet. Additionally, scenarios of energy consumption and costs were considered depending on the type of payment instrument under the existing payment infrastructure. The paper confirms the hypothesis that an increase in the number of customers per hour leads to a reduction in the energy cost per transaction.
The results of the panel models highlight that the number of customers per hour has a negative impact on the cost of energy per payment transaction. According to the empirical findings, an increase in the customers per hour indicator leads to a reduction in the energy cost per transaction of EUR 0.0084, and this effect is statistically significant. Overall, the number of customers per hour and the energy cost have a negative impact on the cost of energy per payment transaction. The robustness of the findings was tested by running the models only on subsamples formed by cashier shifts with a different share of the time for a customer payment for purchases in the total working time of the cashier.
Additionally, modern means of payment and payment methods do not solve the problem of reducing the time that it takes to service payments, which entails a waste of time, energy, and money. These indicators can be reduced through the use of new and promising technologies (such as new-generation data transmission systems), the processing power of new-generation computers, the replacement of means of payment with “faster” ones, and the use of more efficient cashiers, or their replacement by functional machines.
These findings are consistent with the variable findings internationally on the relationship between time and money in a broad meaning, and the findings support research’s conclusions, in that “management practices that make the connection between time and money salient can heighten the economic evaluation of time” []. The results of this study are also consistent with the results of a survey of store owners who noted that reducing payment processing times significantly improved overall checkout efficiency [] and customers’ satisfaction []. Bishop also notes that “the services and application teams spend an inordinate amount of time interfacing with the infrastructure and facilities operations team” []; however, the author does not estimate this time, as did this study, which actually confirms the research about sustainable retailing, in that energy savings as a factor of sustainability “helps businesses expand margins by cutting fixed and variable costs” [].
This paper is also consistent with research that examined sustainable development policies where “public institutions have attempted to force people to comply to the sustainable transition by means of price-based mechanisms, such as taxes and subsidies” [].
The payment system and money circulation are niche problems in the energy field. However, this is a very delicate topic because people often spend their earnings in supermarkets, buying food and basic necessities. They expend their energy in vain, waiting in a queue for a payment transaction. This study has shown that, on average, 42.78% of the working time of a supermarket cashier is spent on payment processing. At the same time, 18 out of 109 cashiers spent more than 50% of their working time servicing customers’ payments. Each cashier receives both cash and non-cash forms of payment (bank cards, vouchers, electronic money, etc.). During this time, other customers are waiting in line and because of this, their dissatisfaction increases [,]. Meanwhile, the employee could be performing more productive tasks that would benefit the employer. In the analysis, potentially omitted variables were POS types with different levels of energy consumption, equipment speed, automatization level of POS, cashier’s skills, and equipment reliability, and we expect these characteristics to be correlated with the number of customers per hour. Moreover, while the cashier is directly involved in processing a cash payment (although this is inefficient considering that he or she could be serving the next customer), during non-cash payment, both the cashier and the customer can only passively wait for the completion of the transaction. This time is paid for by the employer. Thus, this part of cashiers’ working time can be characterised as inefficient. To this time we can add the time of inactivity, when the cashier does not serve customers at all due to a lack of service requests, waiting for a customer who has returned to the sales floor to collect additional goods, weighing products, technical problems with the system, etc. Although this aspect is not discussed, as it is not the subject of this study, it is important to emphasise that inefficient cashier time is a significant problem for trade institutions, as it incurs high costs due to imperfect customer service and imperfections of payment systems, means of payment, and payment infrastructure. This is all without considering the different cognitive limitations and skill levels of cashiers, which also affect the speed of customer service, customer satisfaction, and the efficiency of the company as a whole.
This study highlights the issues of spending excessive time on servicing payments using currently available payment methods and means of payment. The imperfection of the payment infrastructure and payment instruments leads to a waste of time, energy, and money. Still, the EU ambition of increasing energy efficiency by 32.5% can be achieved either by improving the energy efficiency of each individual industry by 32.5% or by improving some industries more than others.
Costs will be reduced with the reduction in transaction time due to the use of more modern payment infrastructure and data transmission systems. Therefore, investments in high-speed data technology (5G, 6G) can speed up payments with electronic payment instruments such as bank cards or mobile payments by up to 0.2 s or less [].
In this sense, cash can be classified as a payment instrument with average energy efficiency. Depending on the amount of cash and the amount of payment, such a transaction lasts from a few seconds (when the client has prepared the exact payment amount in advance and there was no interference of other factors) to several minutes (when the client pays in banknotes or coins of insignificant value for a rather expensive purchase—for example, EUR 1 or 2 coins for a purchase worth 500 euros). Many countries, however, seek to displace cash in order to expand access to financial services, to modernise the international financial architecture, and to reduce fraud and related crimes [,]. However, as noted by Mersch, a member of the Executive Board of the ECB for Project Syndicate, “the differences among member states are pronounced: the share of cash transactions ranges from 42% in Finland to 92% in Malta. But, overall, the public’s commitment to cash remains strong” []. “79% of all Euro area payments at points of sale are still cash transactions and these transactions account for more than half of the total value of such payments” []. Anyway, based on this study, the use of cash and non-cash instruments for payments in retail (which is today the traditional approach to organizing cash registers) gives the results shown in Table 7.
7. Limitations
This study has some limitations. First, the inferences derived from the research are limited by the data on which the results are based. Specifically, the research results do not differentiate between cash and non-cash payments, which is why, empirically, a relationship between time and the energy consumption of cash payments and non-cash payments, was not shown. The sample of 109 cashier shifts in a supermarket in Poland is limited, but the payment technology is identical throughout the country and throughout the EU, and the equipment used by cashiers is similar or the same, which makes it possible to extrapolate the generalised data used to national or transnational levels.
8. Future Research Directions
Given the above limitations, further research should focus on the analysis of samples from different regions and countries where the level of high-speed Internet coverage is different than in Poland, the proportion of modern POS terminals at customer service points is higher, the work of cashiers is differently organised, and cashiers are of different nationalities, gender, age, etc.
Future research directions should also involve either studying the energy and financial costs of manufacturing and installing faster and more modern POS systems, which will reduce the cost of servicing payments, or the costs of replacing the money transfer technology. A relevant question is whether it will be possible to increase energy efficiency, given that it will be necessary to manufacture new devices and replace every POS terminal at every outlet. However, the need for a more detailed study of this topic remains—it is important to investigate not only the energy costs of servicing payments directly related to the maintenance of POS systems but also the energy costs involved in ensuring the operation of the trade as a whole, the maintenance costs of personnel and equipment, and lost profits resulting from waiting for the completion of transactions because of human mistakes, technical restrictions, and eventual failure. Additionally, using complex statistical methods such as SEM, MANOVA, etc. to address the multilevel relationship between variables will allow consideration of the available panel data about the cashiers’ work in a more comprehensive and deep way.
The least energy-efficient payment method today is cryptocurrency payment based on blockchain technology, as the average transaction confirmation time reaches the time of significant indicators, and on 5 May 2021 it was 3380 min (202,800 s) []. Accordingly, the cost of servicing a POS terminal to complete a transaction using cryptocurrency would be significant, and energy efficiency would be low under the same conditions of the payment infrastructure, provided that non-cash payments are using a cryptocurrency transaction based on blockchain technology, other things being equal. It is an interesting issue, and the possibilities of using cryptocurrencies should also be considered for payment in retail in further research.
The issue of the energy efficiency of payments brings us to the idea of finding a payment instrument that could replace the traditional payment form, or monetary instruments in general, which, from an energy efficiency standpoint, are outdated, inefficient, and require significant energy for cash production and the maintenance of information processing related to non-cash payments and cryptocurrencies. Future research should also focus on the use of artificial intelligence in the decision-making process involving the purchase of goods and services, as well as the search for modern non-monetary payment methods, which can be, for example, energy as a means of payment, medium of exchange, store of value, and unit of account.
A prospect that avoids the excessive energy consumption associated with imperfect payment infrastructure and payment instruments may include the replacement of the algorithm from “choose–put in basket–pay” to “pay–choose–put in basket”. With this, individuals carry out household budgeting and, as customers, their decisions should focus on planning expenditures and determining spending limits for a given period. At the same time, the task of selection can be delegated to artificial intelligence, which is able to analyse trends, collect global data on trends and limitations, and learn preferences and habits. In turn, the payment process will be merely a technical and automated stage of the chain, not requiring time or money to interact with the cashier, as well as eliminating the costs and energy involved in payments in the context of this study.
Funding
This research received no external funding.
Institutional Review Board Statement
Not applicable.
Informed Consent Statement
Not applicable.
Data Availability Statement
The datasets analysed during the current study are not publicly available due to commercial confidence but are available from the corresponding author on reasonable request.
Acknowledgments
The author is grateful to the referees for helpful comments on earlier versions of this paper.
Conflicts of Interest
The author declares no conflict of interest.
References
- 2030 Climate & Energy Framework. Available online: https://ec.europa.eu/clima/policies/strategies/2030_en (accessed on 8 February 2021).
- Financing Energy Efficiency. Available online: https://ec.europa.eu/energy/topics/energy-efficiency/financing-energy-efficiency_en (accessed on 10 February 2021).
- Malinauskaite, J.; Jouhara, H.; Egilegor, B.; Al-Mansour, F.; Ahmad, L.; Pusnik, M. Energy efficiency in the industrial sector in the EU, Slovenia, and Spain. Energy 2020, 208, 118398. [Google Scholar] [CrossRef]
- Final Energy Consumption by Sector. Available online: https://ec.europa.eu/eurostat/databrowser/view/ten00124/default/table?lang=en (accessed on 8 February 2021).
- Dalevska, N.; Khobta, V.; Kwilinski, A.; Kravchenko, S. A model for estimating social and economic indicators of sustainable development. Entrep. Sustain. Issues 2019, 6, 1839–1860. [Google Scholar] [CrossRef]
- Kharazishvili, Y.; Kwilinski, A.; Grishnova, O.; Dzwigol, H. Social Safety of Society for Developing Countries to Meet Sustainable Development Standards: Indicators, Level, Strategic Benchmarks (with Calculations Based on the Case Study of Ukraine). Sustainability 2020, 12, 8953. [Google Scholar] [CrossRef]
- Lakhno, V.; Malyukov, V.; Bochulia, T.; Hipters, Z.; Kwilinski, A.; Tomashevska, O. Model of Managing of the Procedure of Mutual Financial Investing In Information Technologies and Smart City Systems. Int. J. Civ. Eng. Technol. 2018, 9, 1802–1812. [Google Scholar]
- Tkachenko, V.; Kwilinski, A.; Korystin, O.; Svyrydiuk, N.; Tkachenko, I. Assessment of Information Technologies Influence on Financial Security of Economy. J. Secur. Sustain. 2019, 8, 375–385. [Google Scholar] [CrossRef]
- Kostyrko, R.; Kosova, T.; Kostyrko, L.; Zaitseva, L.; Melnychenko, O. Ukrainian Market of Electrical Energy: Reforming, Financing, Innovative Investment, Efficiency Analysis, and Audit. Energies 2021, 14, 5080. [Google Scholar] [CrossRef]
- Nair, R.; Gupta, S.; Soni, M.; Shukla, P.K.; Dhiman, G. An approach to minimize the energy consumption during blockchain transaction. Mater. Today Proc. 2020, in press. [Google Scholar] [CrossRef]
- Vatamanyuk-Zelinska, U.; Melnychenko, O. The effectiveness of financial and economic regulation of land relations in the context of stimulating entrepreneurial activity in the regions of Ukraine. Probl. Perspect. Manag. 2020, 18, 11–27. [Google Scholar] [CrossRef]
- De Vries, A. Bitcoin’s Growing Energy Problem. Joule 2018, 2, 801–805. [Google Scholar] [CrossRef]
- Brits, R.; Lindeboom, L.; Raubenheimer, H. On ideals of generalised invertible elements in banach algebras. Math. Proc. R. Ir. Acad. 2005, 105, 1–10. Available online: http://www.jstor.org/stable/40656905 (accessed on 11 January 2021). [CrossRef]
- Schmiedel, H.; Kostova, G.; Ruttenberg, W. The Social and Private Costs of Retail Payment Instruments: A European Perspective. ECB Occasional Paper. 2012. Available online: https://www.ecb.europa.eu/pub/pdf/scpops/ecbocp137.pdf (accessed on 3 May 2021).
- Melnychenko, O. Economic analysis tools of electronic money and transactions with it in banks. Financ. Credit Act. Probl. Theory Pract. 2013, 2, 59–66. [Google Scholar] [CrossRef]
- Przenajkowska, K.; Polasik, M. Koszty gotówki i elektronicznych instrumentów płatniczych w Unii Europejskiej [Costs of cash and electronic payment instruments in the European Union]. Ekon. Probl. Usług [Econ. Serv. Probl.] 2018, 2, 283–290. [Google Scholar] [CrossRef]
- Samorodov, B.; Melnychenko, O.; Koshcheeva, N. Assessment of the bank’s electronic money using the method of hierarchies analysis. Financ. Credit Act. Probl. Theory Pract. 2014, 2, 204–217. [Google Scholar] [CrossRef][Green Version]
- European Central Bank. How Much Does It Cost to Make a Payment? 2012.. Available online: https://www.ecb.europa.eu/paym/groups/pdf/cogeps/121022/A_11_ECB_Cost_of_payments_study.pdf?f952dbf6849bf1babce0df7c95711601 (accessed on 3 May 2021).
- European Central Bank. Environment, Health and Safety. Available online: https://www.ecb.europa.eu/euro/banknotes/environmental/html/index.en.html (accessed on 3 May 2021).
- Brugge, J.; Denecker, O.; Jawaid, H.; Kovacs, A.; Shami, I. Attacking the Cost of Cash. Available online: https://www.mckinsey.com/industries/financial-services/our-insights/attacking-the-cost-of-cash# (accessed on 10 May 2021).
- Kyungroul, L.; Kangbin, Y. Study on the transaction linkage technique combined with the designated terminal for 5G-enabled IoT. Digit. Commun. Netw. 2021, in press. [Google Scholar] [CrossRef]
- Bogachov, S.; Kwilinski, A.; Miethlich, B.; Bartosova, V.; Gurnak, A. Artificial Intelligence Components and Fuzzy Regulators in Entrepreneurship Development. Entrep. Sustain. Issues 2020, 8, 487–499. [Google Scholar] [CrossRef]
- Kuzior, A.; Kwilinski, A.; Tkachenko, V. Sustainable Development of Organizations Based on the Combinatorial Model of Artificial Intelligence. Entrep. Sustain. 2019, 7, 1353–1376. [Google Scholar] [CrossRef]
- Melnychenko, O. Is Artificial Intelligence Ready to Assess an Enterprise’s Financial Security? J. Risk Financ. Manag. 2020, 13, 191. [Google Scholar] [CrossRef]
- Román-Collado, R.; Economidou, M. The role of energy efficiency in assessing the progress towards the EU energy efficiency targets of 2020: Evidence from the European productive sectors. Energy Policy 2021, 156, 112441. [Google Scholar] [CrossRef]
- Chen, L.-d. A model of consumer acceptance of mobile payment. Int. J. Mob. Commun. 2008, 6, 32–52. [Google Scholar] [CrossRef]
- Lai, P.M.; Chuah, K.B. Developing an Analytical Framework for Mobile Payments Adoption in Retailing: A Supply-Side Perspective. In Proceedings of the 2010 International Conference on Management of e-Commerce and e-Government, Chengdu, China, 23–24 October 2010; pp. 356–361. [Google Scholar] [CrossRef]
- Yan, L.-Y.; Tan, G.W.-H.; Loh, X.-M.; Hew, J.-J.; Ooi, K.-B. QR code and mobile payment: The disruptive forces in retail. J. Retail. Consum. Serv. 2021, 58, 102300. [Google Scholar] [CrossRef]
- Talwar, S.; Dhir, A.; Khalil, A.; Mohan, G.; lIslam, A.K.M.N. Point of adoption and beyond. Initial trust and mobile-payment continuation intention. J. Retail. Consum. Serv. 2020, 55, 102086. [Google Scholar] [CrossRef]
- Teo, A.-C.; Tan, G.W.-H.; Ooi, K.-B.; Hew, T.-S.; Yew, K.-T. The effects of convenience and speed in m-payment. Ind. Manag. Data Syst. 2015, 115, 311–331. [Google Scholar] [CrossRef]
- Kaur, P.; Dhir, A.; Singh, N.; Sahu, G.; Almotairi, M. An innovation resistance theory perspective on mobile payment solutions. J. Retail. Consum. Serv. 2020, 55, 102059. [Google Scholar] [CrossRef]
- Valentová, M.; Horák, M.; Dvořáček, L. Why transaction costs do not decrease over time? A case study of energy efficiency programmes in Czechia. Energy Policy 2020, 147, 111871. [Google Scholar] [CrossRef]
- Sedlmeir, J.; Buhl, H.U.; Fridgen, G.; Keller, R. The Energy Consumption of Blockchain Technology: Beyond Myth. Bus. Inf. Syst. Eng. 2020, 62, 599–608. [Google Scholar] [CrossRef]
- Tanwar, S.; Popat, A.; Bhattacharya, P.; Gupta, R.; Kumar, N. A taxonomy of energy optimization techniques for smart cities: Architecture and future directions. Expert Syst. 2021, e12703. [Google Scholar] [CrossRef]
- Anton, S.G.; Afloarei Nucu, A.E. The effect of financial development on renewable energy consumption. A panel data approach. Renew. Energy 2020, 147, 330–338. [Google Scholar] [CrossRef]
- Świecka, B.; Terefenko, P.; Paprotny, D. Transaction factors’ influence on the choice of payment by Polish consumers. J. Retail. Consum. Serv. 2021, 58, 102264. [Google Scholar] [CrossRef]
- Card Payments in Europe—Current Landscape and Future Prospects: A Eurosystem Perspective. Available online: https://www.ecb.europa.eu/pub/pubbydate/2019/html/ecb.cardpaymentsineu_currentlandscapeandfutureprospects201904~30d4de2fc4.en.html#toc1 (accessed on 15 December 2020).
- Cabello, G.J. Money Leaks in Banking ATM’s Cash-Management Systems. Virtual Econ. 2020, 3, 25–42. [Google Scholar] [CrossRef]
- Pourghomi, P.; Saeed, M.Q.; Ghinea, G. A Proposed NFC Payment Application. Int. J. Adv. Comput. Sci. Appl. 2013, 4, 173–181. [Google Scholar] [CrossRef][Green Version]
- Kwilinski, A.; Volynets, R.; Berdnik, I.; Holovko, M.; Berzin, P. E-Commerce: Concept and Legal Regulation in Modern Economic Conditions. J. Leg. Ethical Regul. Issues 2019, 22, 1–6. [Google Scholar]
- Naeem, M.; Ozuem, W. The role of social media in internet banking transition during COVID-19 pandemic: Using multiple methods and sources in qualitative research. J. Retail. Consum. Serv. 2021, 60, 102483. [Google Scholar] [CrossRef]
- Perlman, Y.; Yechiali, U. Reducing risk of infection—The COVID-19 queueing game. Saf. Sci. 2020, 132, 104987. [Google Scholar] [CrossRef]
- Shkodina, I.; Melnychenko, O.; Babenko, M. Quantitative easing policy and its impact on the global economy. Financ. Credit Act.-Probl. Theory Pract. 2020, 2, 513–521. [Google Scholar] [CrossRef]
- Sreelakshmi, C.C.; Prathap, S.K. Continuance adoption of mobile-based payments in Covid-19 context: An integrated framework of health belief model and expectation confirmation model. Int. J. Pervasive Comput. Commun. 2020, 16, 351–369. [Google Scholar] [CrossRef]
- Doremalen, N.V.; Bushmaker, T.; Morris, D.H.; Holbrook, M.G.; Gamble, A.; Williamson, B.N.; Tamin, A.; Harcourt, J.L.; Thornburg, N.J.; Gerber, S.I.; et al. Aerosol and surface stability of SARS-CoV-2 as compared with SARS-CoV-1. N. Engl. J. Med. 2020, 382, 1564–1567. [Google Scholar] [CrossRef]
- Ren, T.; Tang, Y. Accelerate the Promotion of Mobile Payments during the COVID-19 Epidemic. Innovation 2020, 1, 100039. [Google Scholar] [CrossRef]
- Nelloh, M.L.A.; Santoso, A.S.; Slamet, M.W. Will Users Keep Using Mobile Payment? It Depends on Trust and Cognitive Perspectives. Procedia Comput. Sci. 2019, 161, 1156–1164. [Google Scholar] [CrossRef]
- Ceravolo, M.G.; Fabri, M.; Fattobene, L.; Polonara, G.; Raggetti, G. Cash, Card or Smartphone: The Neural Correlates of Payment Methods. Front. Neurosci. 2019, 13, 1188. [Google Scholar] [CrossRef]
- Johnson, V.L.; Kiser, A.; Washington, R.; Torres, R. Limitations to the rapid adoption of M-payment services: Understanding the impact of privacy risk on M-Payment services. Comput. Hum. Behav. 2018, 79, 111–122. [Google Scholar] [CrossRef]
- Humphrey, D.; Pulley, L.; Vesala, J. Cash, Paper, and Electronic Payments: A Cross-Country Analysis. J. Money Credit Bank. 1996, 28, 914–939. [Google Scholar] [CrossRef]
- Zhang, Y.; Zhang, G.; Liu, L.; De Renzis, T.; Schmiedel, H. Retail payments and the real economy. J. Financ. Stab. 2019, 44, 100690. [Google Scholar] [CrossRef]
- Learn about SM Single Score Results. Available online: http://www.sustainableminds.com/showroom/shared/learn-single-score.html (accessed on 3 May 2021).
- Hanegraaf, R.; Larçin, A.; Jonker, N.; Mandley, S.; Miedema, J. Life cycle assessment of cash payments in the Netherlands. Int. J. Life Cycle Assess. 2020, 25, 120–140. [Google Scholar] [CrossRef]
- Melnychenko, O.; Kalna-Dubinyuk, T.; Vovchak, O.; Girchenko, T. The influence of climate change on the lifeinsurance in the EU: A panel data approach. E3S Web Conf. 2021, 307, 07001. [Google Scholar] [CrossRef]
- The Non-Covid Year in Disasters: Global Trends and Perspectives. Available online: https://dial.uclouvain.be/pr/boreal/en/object/boreal%3A245181/datastream/PDF_01/view (accessed on 4 October 2021).
- Tan, H.; Li, J.; He, M.; Li, J.; Zhi, D.; Qin, F.; Zhang, C. Global evolution of research on green energy and environmental technologies: A bibliometric study. J. Environ. Manag. 2021, 297, 113382. [Google Scholar] [CrossRef]
- Brosemer, K.; Schelly, C.; Gagnon, V.; Arola, K.L.; Pearce, J.M.; Bessette, D.; Olabisi, L.S. The energy crises revealed by COVID: Intersections of Indigeneity, inequity, and health. Energy Res. Soc. Sci. 2020, 68, 101661. [Google Scholar] [CrossRef]
- Jiang, P.; Klemeš, J.J.; Fan, Y.V.; Fu, X.; Bee, Y.M. More Is Not Enough: A Deeper Understanding of the COVID-19 Impacts on Healthcare, Energy and Environment Is Crucial. Int. J. Environ. Res. Public Health 2021, 18, 684. [Google Scholar] [CrossRef]
- Kalinic, Z.; Marinkovic, V.; Molinillo, S.; Liébana-Cabanillas, F. A multi-analytical approach to peer-to-peer mobile payment acceptance prediction. J. Retail. Consum. Serv. 2019, 49, 143–153. [Google Scholar] [CrossRef]
- Ercan, T.; Kutay, M. 24—Smart cities critical infrastructure recommendations and solutions. In Solving Urban Infrastructure Problems Using Smart City Technologies, Handbook on Planning, Design, Development, and Regulation; Joe Hayton: Chennai, India, 2021; pp. 503–541. [Google Scholar] [CrossRef]
- Yang, A.S. Exploring adoption difficulties in mobile banking services. Can. J. Adm. Sci./Rev. Can. Sci. L’adm. 2009, 26, 136–149. [Google Scholar] [CrossRef]
- Muratori, M.; Jadun, P.; Bush, B.; Bielen, D.; Vimmerstedt, L.; Gonder, J.; Gearhart, C.; Arent, D. Future integrated mobility-energy systems: A modeling perspective. Renew. Sustain. Energy Rev. 2020, 119, 109541. [Google Scholar] [CrossRef]
- Swiecka, B.; Grima, S. Factors Affecting the Consumers’ Choice of Payment Instrument in Poland. Eur. Res. Stud. J. 2019, 12, 179–198. [Google Scholar] [CrossRef]
- Melnychenko, O. The Energy of Finance in Refining of Medical Surge Capacity. Energies 2021, 14, 210. [Google Scholar] [CrossRef]
- Melnychenko, O.; Kwiliński, A. Energy management: Analysis of the retrospective in the perspective context for economic development. Eur. Coop. 2017, 7, 66–80. [Google Scholar]
- Eco-indicator 99. A Damage Oriented Method for Life Cycle Impact Assessment; Ministry of Housing, Spital Planning and the Environment: Amersfoort, The Netherlands, 2000; 49p. [Google Scholar]
- Hsiao, M.-H. Mobile payment services as a facilitator of value co-creation: A conceptual framework. J. High Technol. Manag. Res. 2019, 30, 100353. [Google Scholar] [CrossRef]
- Liu, Y.; Luo, J.; Zhang, L. The effects of mobile payment on consumer behavior. J. Consum. Behav. 2021, 20, 512–520. [Google Scholar] [CrossRef]
- Erdin, E.; Cebe, M.; Akkaya, K.; Solak, S.; Bulut, E.; Uluagac, S. A Bitcoin payment network with reduced transaction fees and confirmation times. Comput. Netw. 2020, 172, 107098. [Google Scholar] [CrossRef]
- Kwilinski, A. Implementation of Blockchain Technology in Accounting Sphere. Acad. Account. Financ. Stud. J. 2019, 23, 1–6. [Google Scholar]
- Melnychenko, O.; Hartinger, R. Role of blockchain technology in accounting and auditing. Eur. Coop. 2017, 9, 27–34. [Google Scholar]
- Boden, J.; Maier, E.; Wilken, R. The effect of credit card versus mobile payment on convenience and consumers’ willingness to pay. J. Retail. Consum. Serv. 2020, 52, 101910. [Google Scholar] [CrossRef]
- Zellermayer, O. The Pain of Paying. Ph.D. Thesis, Carnegie Mellon University, Pittsburgh, PA, USA, 1996. Available online: https://www.researchgate.net/profile/Ofer-Zellermayer/publication/280711796_The_Pain_of_Paying/links/55c1d9ca08aed9dff2a52e9f/The-Pain-of-Paying.pdf?_sg%5B0%5D=olhVUoMVH_097K09TkIu6D_eCvZ3SO7ojtdnnkK3pO36oAnjw_r-6ofolFuHPREwSwL5GJkViXoZHymomEUa0A.Zh_5l61h0Sh3klh3xqdzDtpSJ6rK4ixzBO1W07DlpUTzpF3zamrdSH2298oZmfF-lVVLbr6vrpFPp0XNJ8F94A.jkuHB5I0c8youQFuPYdQraxNFUQGYSkFlSXReDCknqqciprHukfgW6p8ESE538MUB29QsCf3MFWVsdZwwHdPlA&_sg%5B1%5D=Z-EW9J0wcfjIeLsP9c1-9_Ubz0lsYe04k3tXXl8D2KN_nZ94qKPegoUIz_DZMrLeSCL2ghD57pLCLYEhI8q87q_uKEuovyLlmrKV5u9ZUhAz.Zh_5l61h0Sh3klh3xqdzDtpSJ6rK4ixzBO1W07DlpUTzpF3zamrdSH2298oZmfF-lVVLbr6vrpFPp0XNJ8F94A.jkuHB5I0c8youQFuPYdQraxNFUQGYSkFlSXReDCknqqciprHukfgW6p8ESE538MUB29QsCf3MFWVsdZwwHdPlA&_iepl= (accessed on 8 February 2021).
- Rukzio, E.; Leichtenstern, K.; Callaghan, V.; Holleis, P.; Schmidt, A.; Chin, J.S.-Y. An Experimental Comparison of Physical Mobile Interaction Techniques: Touching, Pointing and Scanning. In Proceedings of the UbiComp 2006: Ubiquitous Computing, 8th International Conference, Orange County, CA, USA, 17–21 September 2006; pp. 87–104. [Google Scholar]
- Cappiello, I.; Puglia, S.; Vitaletti, A. Design and Initial Evaluation of a Ubiquitous Touch-Based Remote Grocery Shopping Process. In Proceedings of the 2009 First International Workshop on Near Field Communication, Hagenberg, Austria, 24 February 2009; pp. 9–14. [Google Scholar] [CrossRef]
- Giudici, G.; Milne, A.; Vinogradov, D. Cryptocurrencies: Market analysis and perspectives. J. Ind. Bus. Econ. 2020, 47, 1–18. [Google Scholar] [CrossRef]
- Mercan, S.; Erdin, E.; Akkaya, K. Improving transaction success rate in cryptocurrency payment channel networks. Comput. Commun. 2021, 166, 196–207. [Google Scholar] [CrossRef]
- Bochulia, T.; Melnychenko, O. Accounting and analytical provision of management in the times of information thinking. Eur. Coop. 2019, 1, 52–64. [Google Scholar] [CrossRef]
- Breebaart, J.; Buhan, I.; de Groot, K.; Kelkboom, E. Evaluation of a template protection approach to integrate fingerprint biometrics in a PIN-based payment infrastructure. Electron. Commer. Res. Appl. 2011, 10, 605–614. [Google Scholar] [CrossRef]
- Kim, M.; Kim, S.; Kim, J. Can mobile and biometric payments replace cards in the Korean offline payments market? Consumer preference analysis for payment systems using a discrete choice model. Telemat. Inform. 2019, 38, 46–58. [Google Scholar] [CrossRef]
- Sealy, P. Get smart: Why biometric cards will reshape the payments industry. Biom. Technol. Today 2018, 2018, 5–8. [Google Scholar] [CrossRef]
- Klein, F.; Drews, S.; Savin, I.; van den Bergh, J. How work patterns affect leisure activities and energy consumption: A time-use analysis for Finland and France. Energy Res. Soc. Sci. 2021, 76, 102054. [Google Scholar] [CrossRef]
- Antal, M.; Plank, B.; Mokos, J.; Wiedenhofe, D. Is working less really good for the environment? A systematic review of the empirical evidence for resource use, greenhouse gas emissions and the ecological footprint. Environ. Res. Lett. 2021, 16, 013002. [Google Scholar] [CrossRef]
- Top 7 Supermarket Chains in Europe. Available online: https://payspacemagazine.com/retail/top-7-supermarket-chains-in-europe/ (accessed on 10 July 2021).
- Number of Payments per Type of Payment Service (Cont’d). Available online: https://sdw.ecb.europa.eu/reports.do?node=1000004051 (accessed on 25 January 2021).
- VariPPC 250i/270i. Available online: http://www.poindus.com/en/products/panel-pc/varippc-250i/ (accessed on 1 June 2021).
- VariPOS Series. Available online: http://www.poindus.com/en/products/all-in-one/varipos/ (accessed on 1 June 2021).
- Study on Energy Prices, Costs and Their Impact on Industry and Households; Final Report. Trinomics B.V.: Rotterdam, The Netherlands, 2020; p. 71. Available online: https://op.europa.eu/en/publication-detail/-/publication/16e7f212-0dc5-11eb-bc07-01aa75ed71a1/language-en?WT.mc_id=Searchresult&WT.ria_c=37085&WT.ria_f=3608&WT.ria_ev=search (accessed on 2 August 2021).
- Unit Converter and Glossary. Available online: https://www.iea.org/reports/unit-converter-and-glossary (accessed on 20 February 2021).
- Creating the Optimal Tap to Pay Experience. Available online: https://usa.visa.com/run-your-business/small-business-tools/payment-technology/contactless-payments.html (accessed on 19 February 2021).
- Average Confirmation Time. Available online: https://www.blockchain.com/charts/avg-confirmation-time (accessed on 8 March 2021).
- Nässén, J.; Larsson, J. Would shorter working time reduce greenhouse gas emissions? An analysis of time use and consumption in Swedish households. Environ. Plan. C Gov. Policy 2015, 33, 726–745. [Google Scholar] [CrossRef]
- Pfeffer, J.; De Voe, S.E. The economic evaluation of time: Organizational causes and individual consequences. Res. Organ. Behav. 2012, 32, 47–62. [Google Scholar] [CrossRef]
- Moghavvemi, S.; Mei, T.X.; Phoong, S.W.; Phoong, S.Y. Drivers and barriers of mobile payment adoption: Malaysian merchants’ perspective. J. Retail. Consum. Serv. 2021, 59, 102364. [Google Scholar] [CrossRef]
- Verkijika, S.F.; Neneh, B.N. Standing up for or against: A text-mining study on the recommendation of mobile payment apps. J. Retail. Consum. Serv. 2021, 63, 102743. [Google Scholar] [CrossRef]
- Bishop, T. Real Time Enterprise. In Next Generation Datacenters in Financial Services. Driving Extreme Efficiency and Effective Cost Savings; Elsevier Science: Burlington, MA, USA, 2009; pp. 23–36. [Google Scholar] [CrossRef]
- Vadakkepatt, G.G.; Winterich, K.P.; Mittal, V.; Zinn, W.; Beitelspacher, L.; Aloysius, J.; Ginger, J.; Reilman, J. Sustainable Retailing. J. Retail. 2021, 97, 62–80. [Google Scholar] [CrossRef]
- Caferra, R.; Colasante, A.; Morone, A. The less you burn, the more we earn: The role of social and political trust on energy-saving behaviour in Europe. Energy Res. Soc. Sci. 2021, 71, 101812. [Google Scholar] [CrossRef]
- Martinusa; Wahaba, M.S.; Yudia; Hama, H. Data Transmission Using RFID System on Smart Shopping Carts for Checkout Process Efficiency in Supermarket at Indonesia. Procedia Comput. Sci. 2021, 179, 902–912. [Google Scholar] [CrossRef]
- Melachrinoudis, E.; Olafsson, M. A microcomputer cashier scheduling system for supermarket stores. Int. J. Phys. Distrib. Logist. Manag. 1995, 25, 34–50. [Google Scholar] [CrossRef]
- Ng, D.; Kauffman, R.J.; Griffin, P.; Hedman, J. Can we classify cashless payment solution implementations at the country level? Electron. Commer. Res. Appl. 2021, 46, 101018. [Google Scholar] [CrossRef]
- Global Data. Top Countries Moving toward a Cashless Society by 2022, Revealed by Global Data; Global Data: London, UK, 13 January 2020. [Google Scholar]
- Mersch, Y. Why Europe Still Needs Cash. Available online: https://www.ecb.europa.eu/press/key/date/2017/html/ecb.sp170428.en.html (accessed on 18 August 2021).
- European Central Bank. Report on a Digital Euro. October 2020.. Available online: https://www.ecb.europa.eu/pub/pdf/other/Report_on_a_digital_euro~4d7268b458.en.pdf (accessed on 18 August 2021).
Publisher’s Note: MDPI stays neutral with regard to jurisdictional claims in published maps and institutional affiliations. |
© 2021 by the author. Licensee MDPI, Basel, Switzerland. This article is an open access article distributed under the terms and conditions of the Creative Commons Attribution (CC BY) license (https://creativecommons.org/licenses/by/4.0/).