
Impacts of OFDI on Host Country Energy Consumption and Home Country Energy Efficiency Based on a Belt and Road Perspective


Abstract
:1. Introduction
2. Literature Review
2.1. Motivations for OFDI
2.2. Factors Influencing OFDI
2.3. The Relevance of the Belt and Road Initiative to OFDI and Energy
3. Methodology and Data
3.1. Methodology
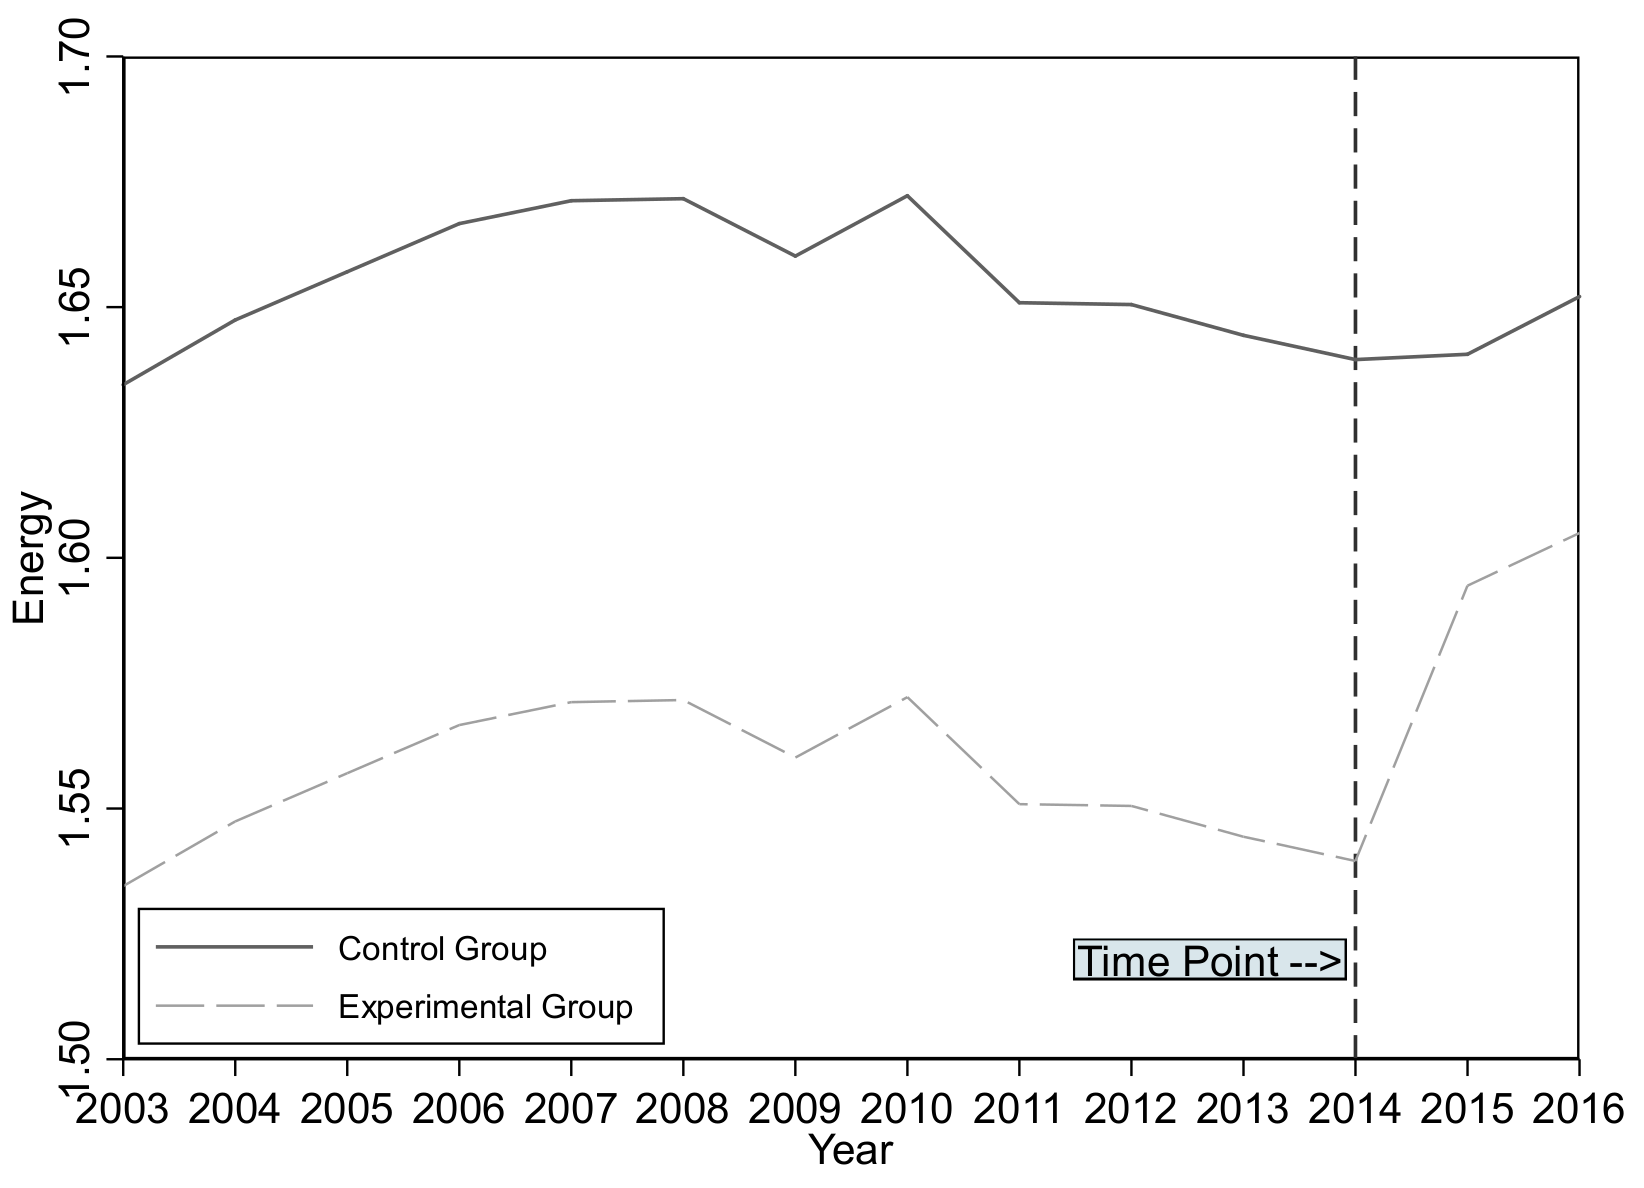
3.1.1. DID Model
3.1.2. SNA Model
3.1.3. SYS-GMM
3.2. Data Sources
- (1)
- Considering data availability, only 57 countries along the Belt and Road were studied: Mongolia, Indonesia, Thailand, Malaysia, Vietnam, Singapore, Philippines, Myanmar, Cambodia, Laos, India, Pakistan, Bengal, Sri Lanka, Nepal, Saudi Arabia, United Arab Emirates, Oman, Iran, Turkey, Israel, Egypt, Kuwait, Iraq, Qatar, Jordan, Lebanon, Bahrain, Yemen, Georgia, Azerbaijan, Armenia, Russia, Poland, Romania, Czech, Slovakia, Bulgaria, Hungary, Latvia, Lithuania, Slovenia, Estonia, Croatia, Albania, Serbia, Ukraine, Belarus, Moldova, Macedonia, Bosnia and Herzegovina, Montenegro, Kazakhstan, Uzbekistan, Turkmenistan, Kyrgyzstan, and Tajikistan.
- (2)
- The primary data for the Belt and Road countries came from the World Bank. Market size and economic freedom indexes were from the UNCTAD database. Primary energy data were from the U.S. Energy Agency. The Government Governance Index was calculated from global governance indicators provided by Heritage, combined with the entropy method.
- (3)
- The data of China’s OFDI in 2003–2016 were from the Statistical Bulletin of China’s Foreign Direct Investment. The rest of China’s data were mainly from the China Statistical Yearbook; the China Energy Statistics Yearbook; the China Labor Statistics Yearbook; the China Science and Technology Statistics Yearbook; the China Population and Employment Statistics Yearbook; the China Foreign Economic Statistics Yearbook; the China Statistical Bulletin of Foreign Direct Investment; and the statistical yearbooks of the corresponding years in 30 provinces, municipalities, and autonomous regions. China’s foreign direct investment data came from the UNCTAD database, and R&D expenditures of various countries were from the OECD database.
4. Results and Analysis
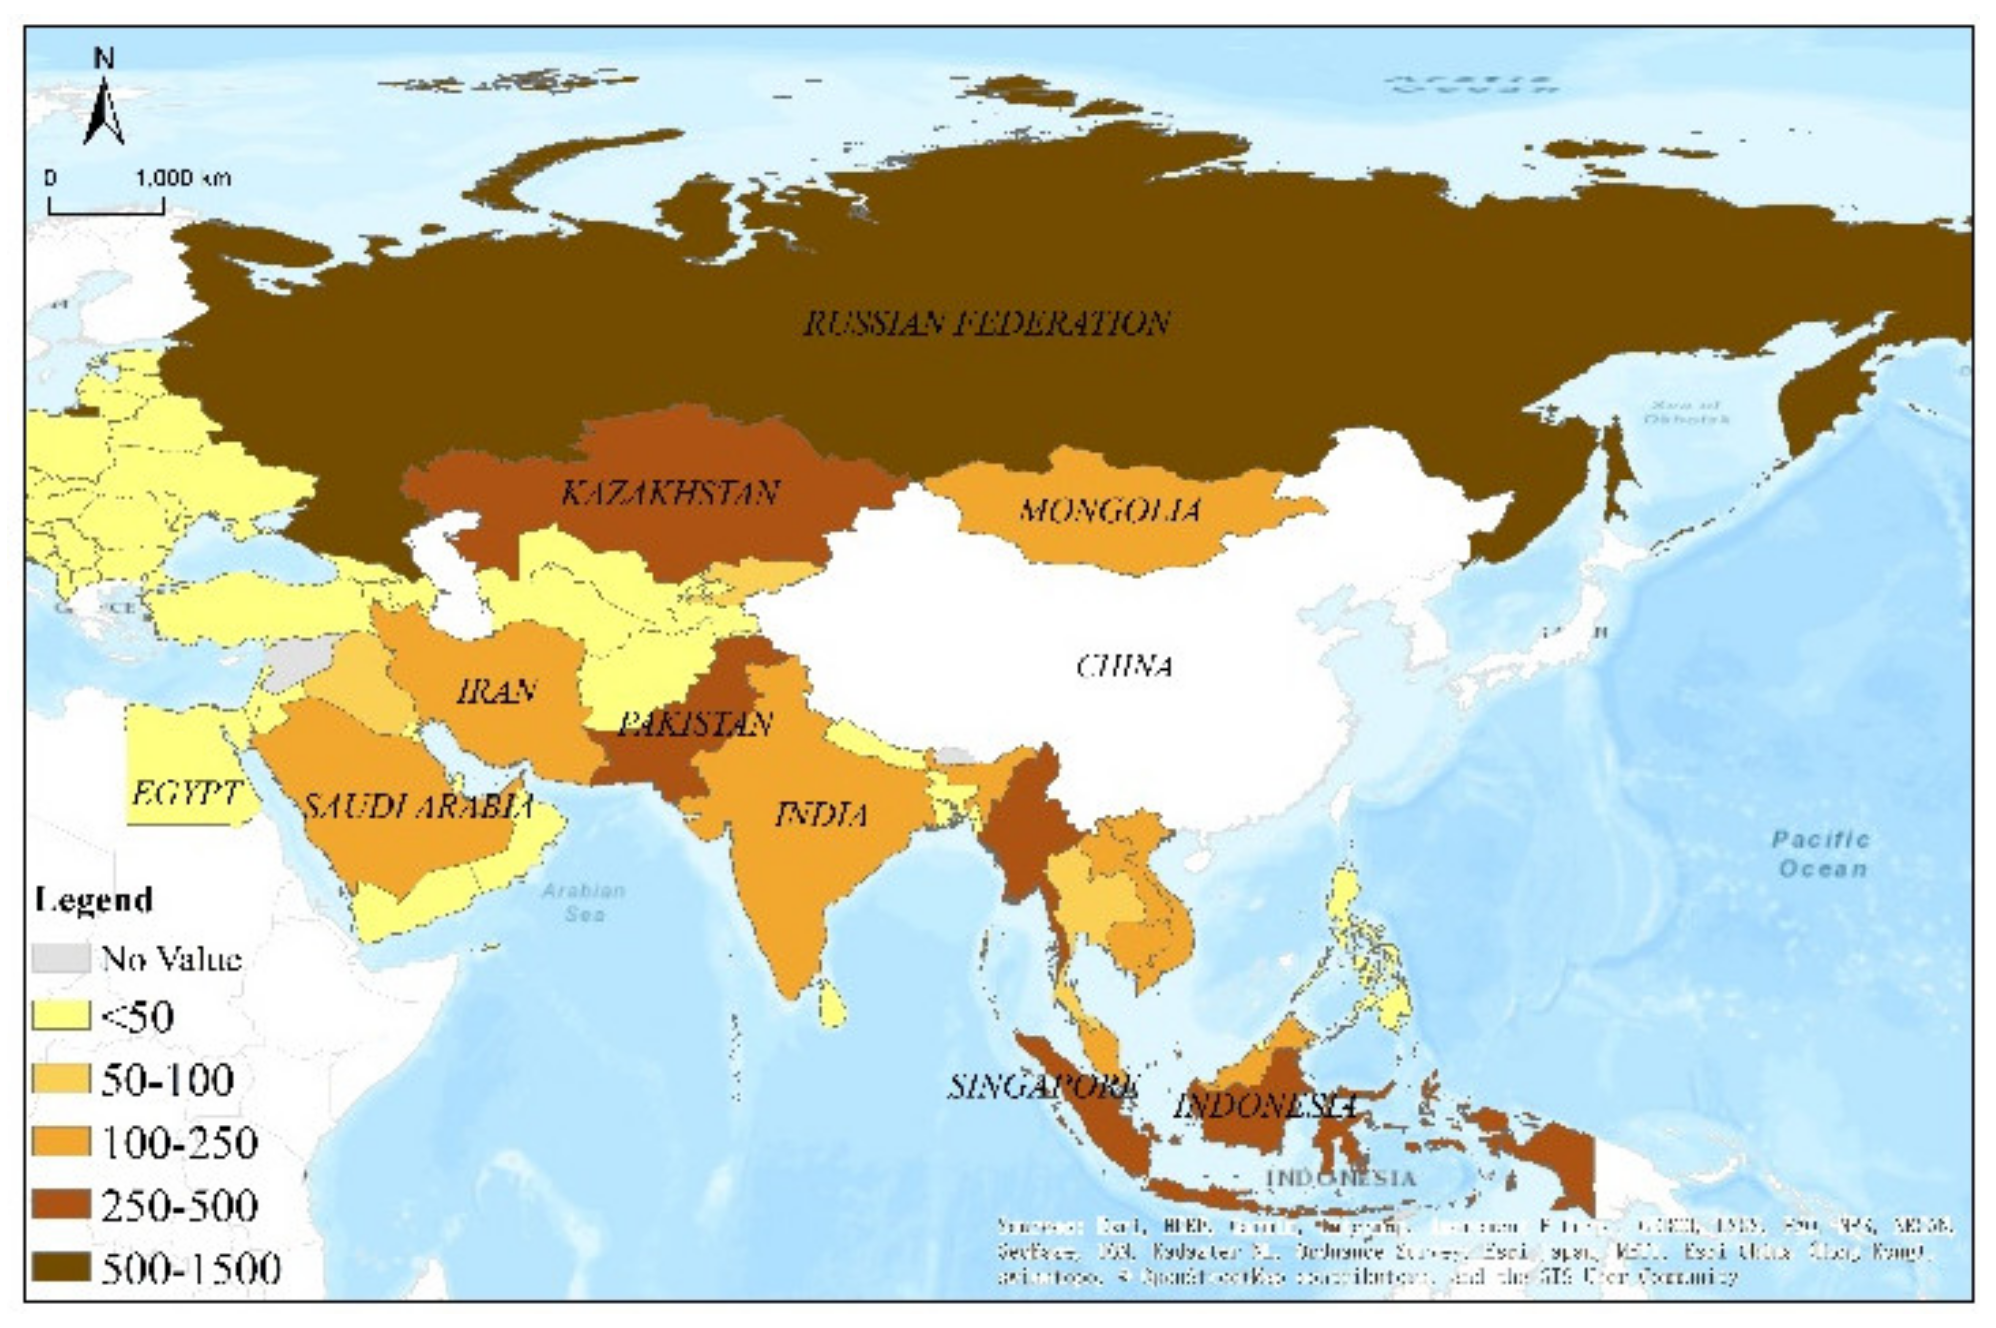
4.1. Location Preferences for China’s OFDI
4.2. The Impact of China’s OFDI on the Energy Consumption of Host Countries
4.2.1. Model Specification
4.2.2. Empirical Analysis
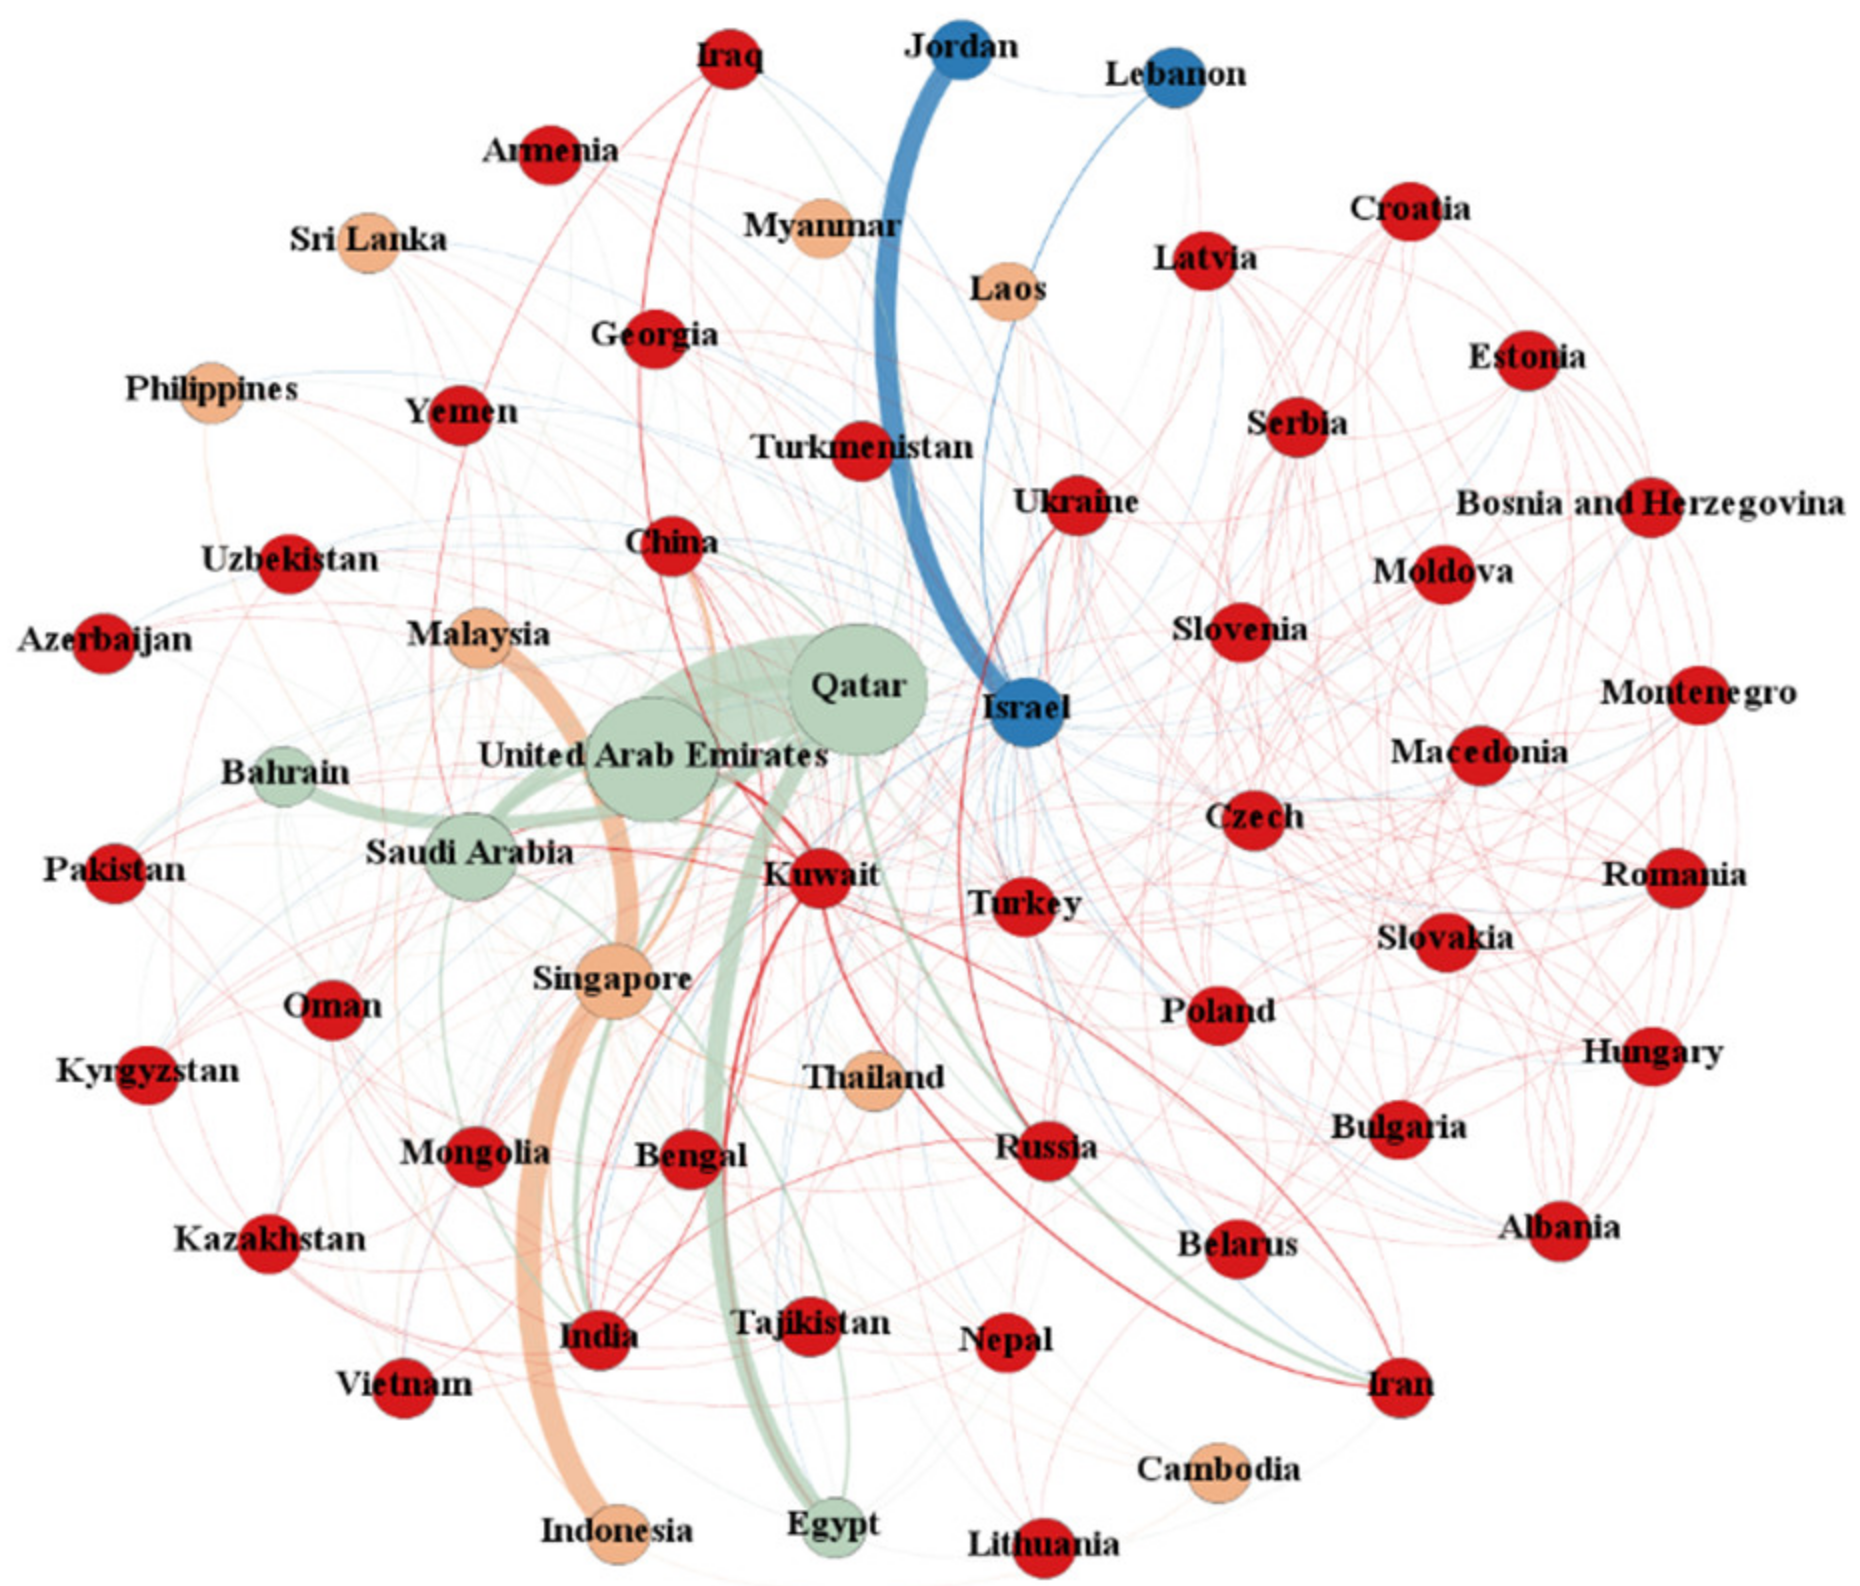
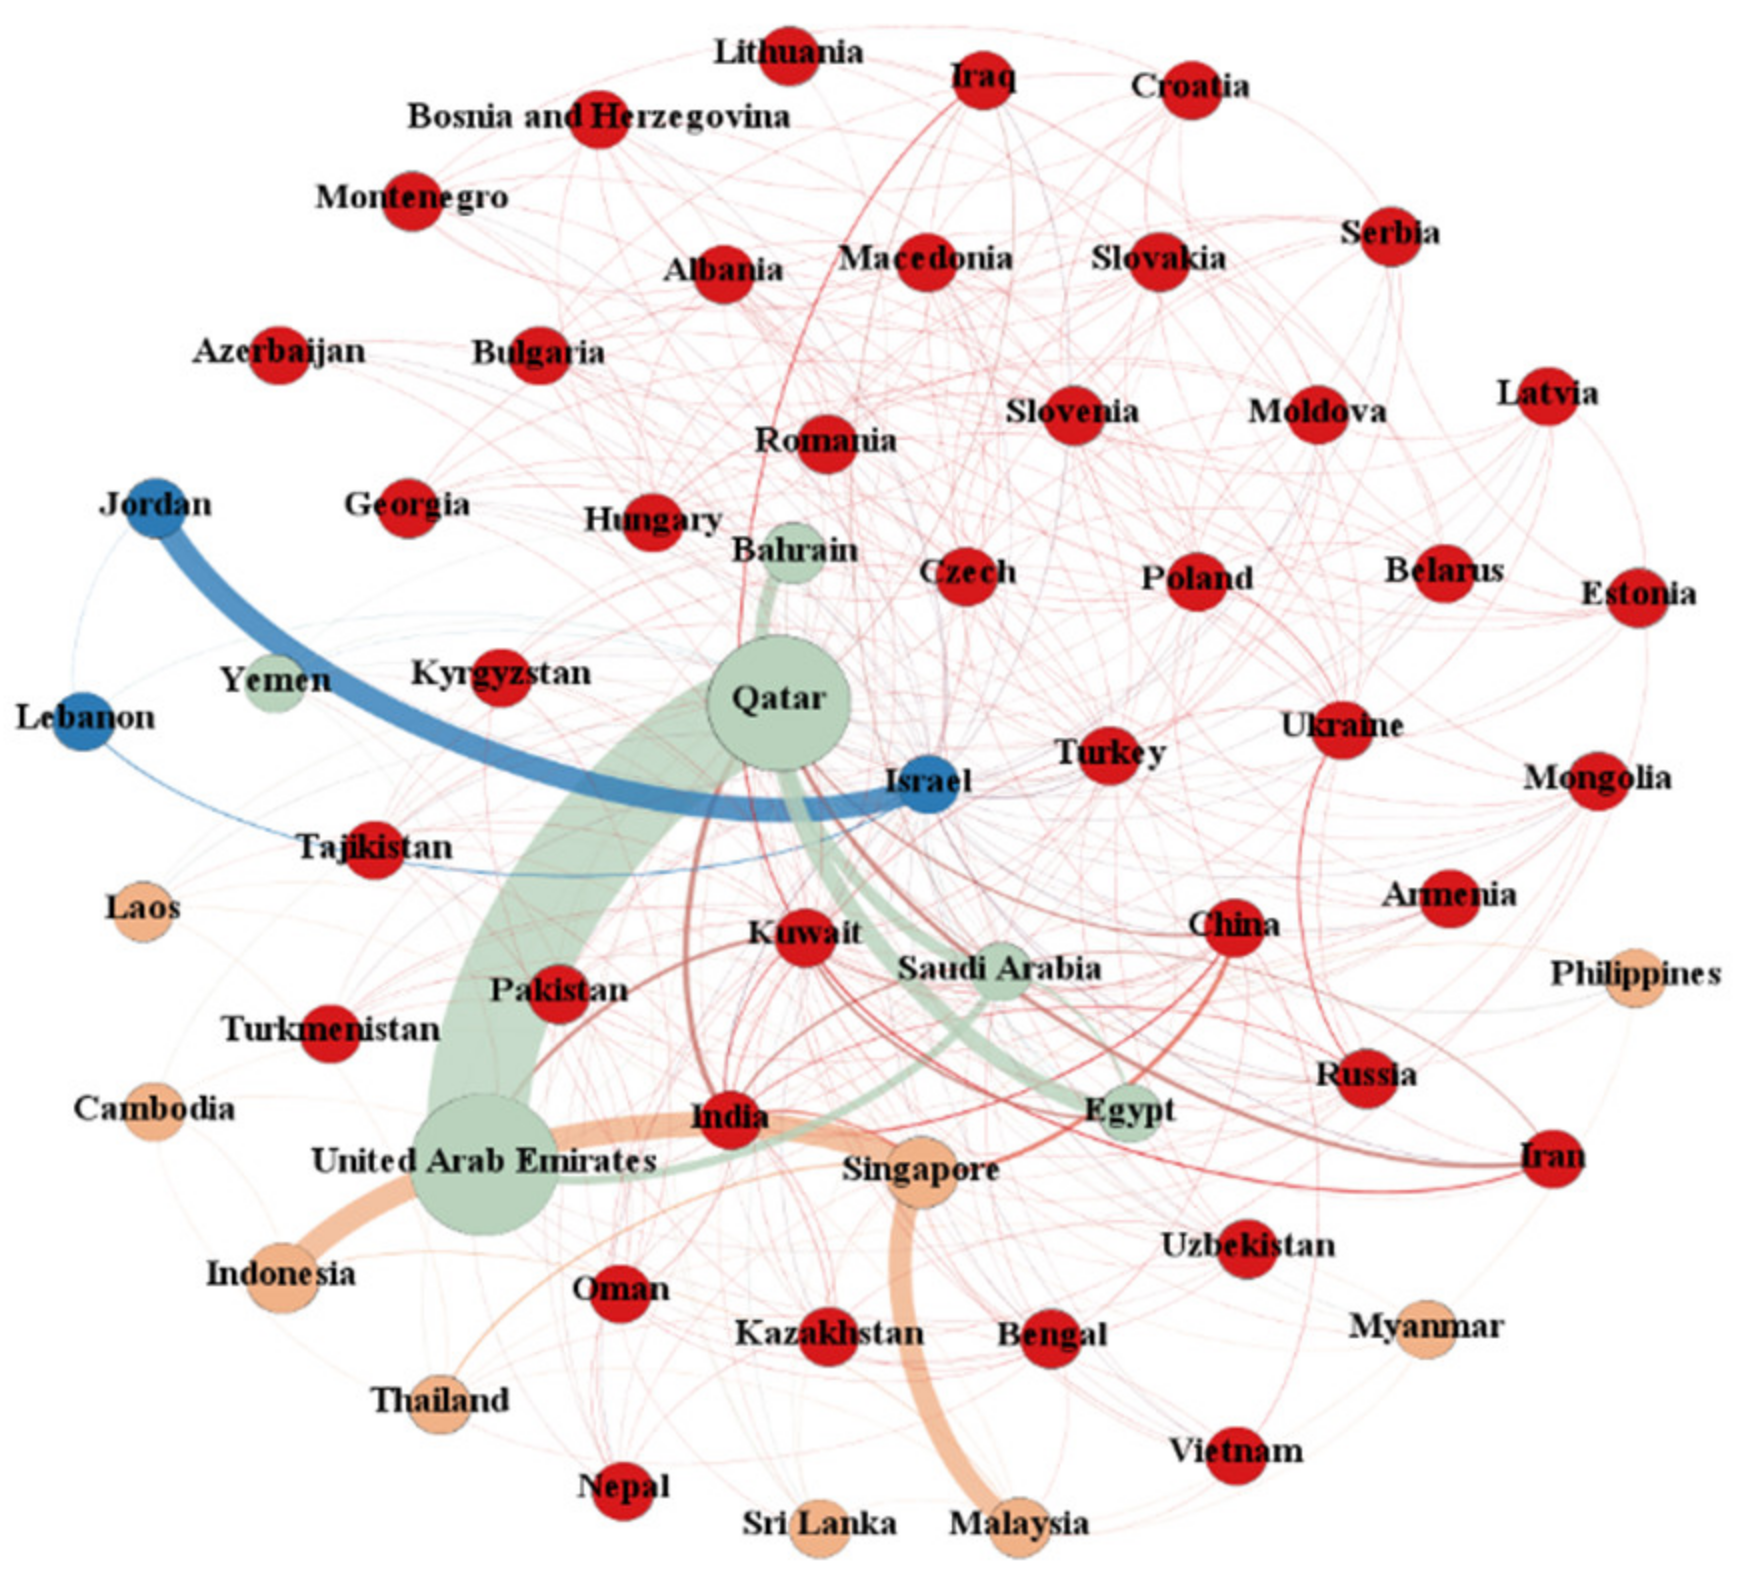
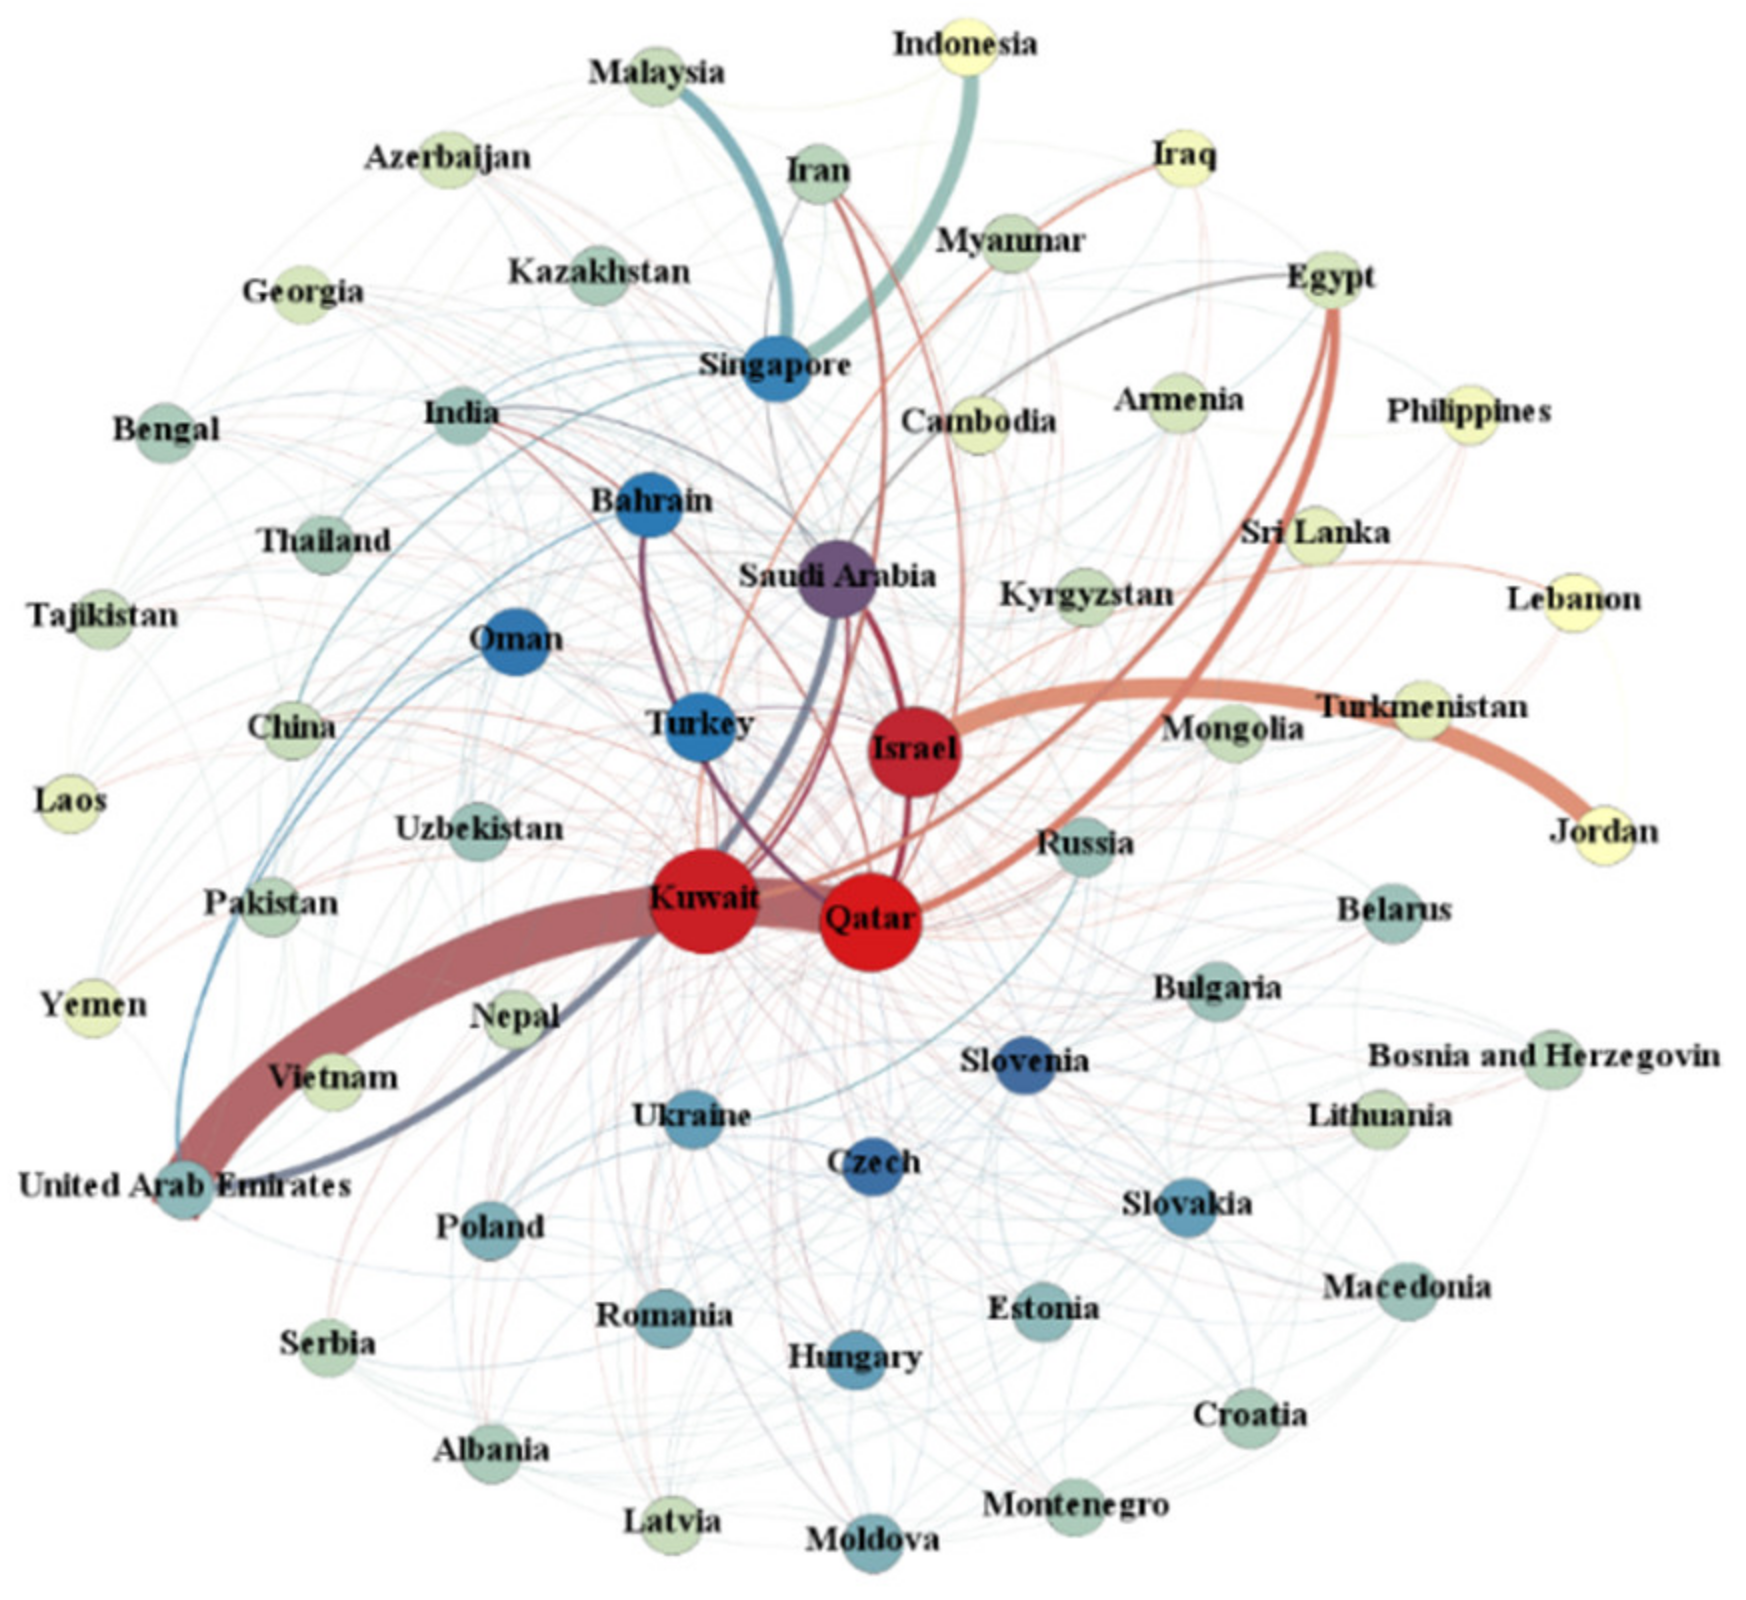
4.3. Characteristics of the Spatial Network of Energy Consumption in the Belt and Road Countries
4.4. The Impact of the Reverse Technology Spillover of China’s OFDI on Energy Efficiency
4.4.1. Model Specification
4.4.2. Empirical Analysis
5. Conclusions and Policy Implications
5.1. Conclusions
- As far as the Belt and Road Initiative’s effects are concerned, the current effect on host country energy consumption is not very significant. The possible reasons are (1) political instability in some countries or regions; (2) long lead times for resolving major cooperation projects; and (3) inadequate preparation in multiple areas, including lagging international talent development and inadequate overseas investment protection and insurance mechanisms.
- The energy consumption network density of the Belt and Road countries is only 0.16, and there is much room for improvement. Although a strict hierarchical structure exists in the entire energy consumption space network, some countries’ subordination and marginal status in the space network changed after 2014 [69]. The significant increase in intermediary centrality shows that China’s Belt and Road initiative promotes a connected energy cooperation model. Under the construction of bilateral and multilateral energy cooperation, some developing countries have increased their voice and pricing power.
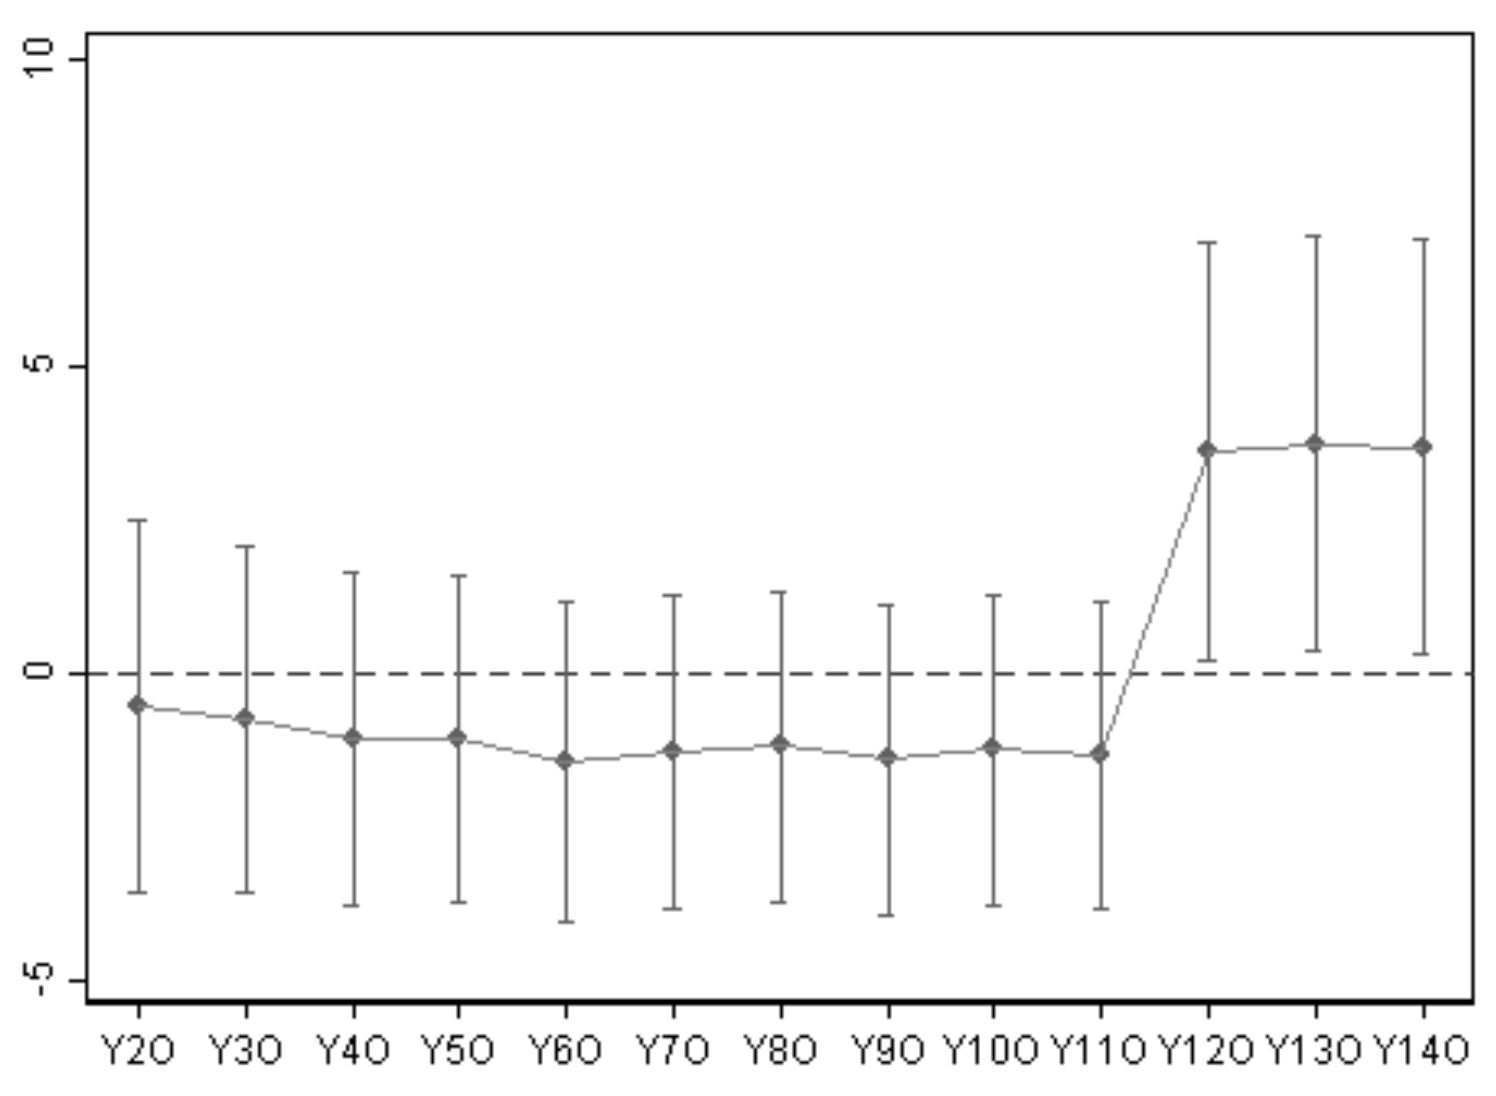
- Due to the reverse technological spillover effect of OFDI, China’s energy efficiency improved significantly after 2014, but the regional differences were not significant. Regarding the interactive terms, the reverse technology spillover effects of FDI, OFDI, domestic R&D absorptive capacity, human capital, and financial development levels have contributed to China’s energy efficiency.
5.2. Policy Implications
5.2.1. The Macro-Level
5.2.2. The Micro-Level
Author Contributions
Funding
Institutional Review Board Statement
Informed Consent Statement
Data Availability Statement
Conflicts of Interest
References
- Wang, Y.Q.; Zhu, Z.W.; Zhu, Z.G.; Liu, Z.B. Analysis of China’s energy consumption changing using the Mean Rate of Change Index and logarithmic mean divisia index. Energy 2019, 167, 275–282. [Google Scholar] [CrossRef]
- Hao, Y.; Guo, Y.T.; Wu, H.T.; Ren, S.Y. Does outward foreign direct investment (OFDI) affect the home country’s environmental quality? The case of China. Struct. Chang. Econ. Dyn. 2020, 52, 109–119. [Google Scholar] [CrossRef]
- Wang, C.; Wang, F. China can lead on climate change. Science 2017, 357, 64. [Google Scholar] [CrossRef]
- Chen, J.Z.; Qian, X.W. Measuring on-going changes in China’s capital controls: A De Jure and a hybrid index data set. China Econ. Rev. 2016, 38, 167–182. [Google Scholar] [CrossRef]
- Ministry Commerce of the People’s Republic of China. Statistical Bulletin of China’s Outward Foreign Direct Investment; Ministry Commerce of the People’s Republic of China: Beijing, China, 2017.
- Xu, W.X.; Sun, J.Q.; Liu, Y.X.; Xiao, Y.; Tian, Y.Z.; Zhao, B.X.; Zhang, X.Q. Spatiotemporal variation and socio-economic drivers of air pollution in China during 2005–2016. J. Environ. Manag. 2019, 245, 66–75. [Google Scholar] [CrossRef] [PubMed]
- Buckley, P.J.; Clegg, L.J.; Cross, A.R.; Liu, X.; Voss, H.; Zheng, P. The determinants of Chinese outward foreign direct investment. J. Int. Bus. Stud. 2007, 38, 499–518. [Google Scholar] [CrossRef]
- Zhang, X.; Daly, K. The determinants of China’s outward foreign direct investment. Emerg. Mark. Rev. 2011, 12, 389–398. [Google Scholar] [CrossRef]
- Deng, P. Chinese outward direct investment research: Theoretical integration and recommendations. Manag. Organ. Rev. 2013, 9, 513–539. [Google Scholar] [CrossRef] [Green Version]
- Robins, F. The uniqueness of Chinese outward foreign direct investment. Asian Bus. Manag. 2013, 12, 525–537. [Google Scholar] [CrossRef]
- Wang, Y.L.; Shao, Y.M. Motivations of Chinese outward direct investment: The sector perspective. J. Syst. Sci. Complex. 2016, 29, 688–721. [Google Scholar] [CrossRef]
- Chen, J.; Zhou, W.; Yang, H.; Wu, Z. “Grouping” or “Ride One’s Coattails”?—How Developing Countries along the Belt and Road Satisfy Themselves. Energies 2021, 14, 3498. [Google Scholar]
- Yang, J.H.; Wang, W.; Wang, K.L.; Yeh, C.Y. Capital intensity, natural resources, and institutional risk preferences in Chinese Outward Foreign Direct Investment. Int. Rev. Econ. Financ. 2018, 55, 259–272. [Google Scholar] [CrossRef]
- Kang, Y.F. Regulatory institutions, natural resource endowment and location choice of emerging-market FDI: A dynamic panel data analysis. J. Multinatl. Financ. Manag. 2018, 45, 1–14. [Google Scholar] [CrossRef]
- Dunning, J.H. Trade, Location of Economic Activity and the Multinational Enterprise: A Search for an Eclectic Approach. In Theories and Paradigms of International Business Activity—The Selected Essays of John H. Dunning; Dunning, J.H., Ed.; Edward Elgar Publishing Limited: Cheltenham, UK, 2002; pp. 52–76. [Google Scholar]
- Li, X.J.; Huang, S.S.; Song, C.Y. China’s outward foreign direct investment in tourism. Tourism Manag. 2017, 59, 1–6. [Google Scholar] [CrossRef]
- Zhang, X. The socio-economic geography of Chinese outward foreign direct investment in Latin America. J. Int. Bus. Studies 2019, 38, 499–518. [Google Scholar]
- Zhang, Y.M.; Zhan, W.; Xu, Y.K.; Kumar, V. International friendship cities, regional government leaders, and outward foreign direct investment from China. J. Bus. Res. 2020, 108, 105–118. [Google Scholar] [CrossRef]
- Liu, Y.L.; Ge, Y.J.; Hu, Z.D.; Wang, S.F. Culture and capital flows—Exploring the spatial differentiation of China’s OFDI in the energy sector. Energy Policy 2017, 145, 111709. [Google Scholar] [CrossRef]
- Xin, D.L.; Zhang, Y.Y. Threshold effect of OFDI on China’s provincial environmental pollution. J. Clean. Prod. 2020, 258, 120608. [Google Scholar] [CrossRef]
- Liu, L.Y.; Zhao, Z.Z.; Zhang, M.M.; Zhou, C.X.; Zhou, D.Q. The effects of environmental regulation on outward foreign direct investment’s reverse green technology spillover: Crowding out or facilitation? J. Clean. Prod. 2021, 284, 124689. [Google Scholar] [CrossRef]
- Nugent, J.B.; Lu, J.X. China’s outward foreign direct investment in the belt and road initiative: What are the motives for Chinese firms to invest? China Econ. Rev. 2021, 68, 101628. [Google Scholar] [CrossRef]
- Jiao, Y.Q.; Ji, C.W.; Yang, S.Y.; Yang, G.G.; Su, M.R.; Fan, H.B. Home governments facilitate cleaner operations of outward foreign direct investment: A case study of a cleaner production partnership programme. J. Clean. Prod. 2020, 265, 121914. [Google Scholar] [CrossRef]
- Liao, H.W.; Yang, L.Q.; Dai, S.Q.; Assche, A.V. Outward FDI, industrial structure upgrading and domestic employment: Empirical evidence from the Chinese economy and the belt and road initiative. J. Asian Econ. 2021, 74, 101303. [Google Scholar] [CrossRef]
- Andreff, W.; Andreff, M. Multinational companies from transition economies and their outward foreign direct investment. Russ. J. Econ. 2017, 3, 445–474. [Google Scholar] [CrossRef]
- Kong, Q.X.; Tong, X.; Peng, D.; Wong, Z.; Chen, H. How factor market distortions affect OFDI: An explanation based on investment propensity and productivity effects. Int. Rev. Econ. Financ. 2021, 73, 459–472. [Google Scholar] [CrossRef]
- Lv, P.; Spigarelli, F. The integration of Chinese and European renewable energy markets: The role of Chinese foreign direct investments. Energy Policy 2015, 81, 14–26. [Google Scholar] [CrossRef]
- Reins, L. The European Union’s framework for FDI screening: Towards an ever more growing competence over energy policy? Energy Policy 2017, 128, 665–672. [Google Scholar] [CrossRef]
- Elheddad, M. Foreign direct investment and domestic investment: Do oil sectors matter? Evidence from oil-exporting Gulf Cooperation Council economies. J. Econ. Bus. 2019, 103, 1–12. [Google Scholar] [CrossRef]
- Wang, S.J. Impact of FDI on energy efficiency: An analysis of the regional discrepancies in China. Nat. Hazards 2017, 85, 1209–1222. [Google Scholar] [CrossRef]
- Adom, P.K.; Opoku, E.E.O.; Yan, I.K.M. Energy demand—FDI nexus in Africa: Do FDIs induce dichotomous paths? Energy Econ. 2019, 81, 928–941. [Google Scholar] [CrossRef]
- Zhao, Y.; Shi, X.P.; Song, F. Has Chinese outward foreign direct investment in energy enhanced China’s energy security? Energy Policy 2020, 146, 111803. [Google Scholar] [CrossRef]
- Liu, H.Y.; Wang, Y.L.; Jiang JWu, P. How green is the “Belt and Road Initiative”?—Evidence from Chinese OFDI in the energy sector. Energy Policy 2020, 145, 111709. [Google Scholar] [CrossRef]
- Wang, Y.L.; Zhang, Q.; Liu, J.S.; He, D.M. Determinants of Chinese Outward FDI in Energy Sector. In Proceedings of the Fourteenth International Conference on Management Science and Engineering Management; Springer: Cham, Switzerland, 2020; Volume 1190, pp. 157–170. [Google Scholar]
- Akbar, U.; Popp, J.; Khan, H.; Khan, M.A.; Oláh, J. Energy efficiency in transportation along with the belt and road countries. Energies 2020, 13, 2607. [Google Scholar] [CrossRef]
- Sun, H.; Edziah, B.K.; Song, X.; Kporsu, A.K.; Taghizadeh-Hesary, F. Estimating persistent and transient energy efficiency in belt and road countries: A stochastic frontier analysis. Energies 2020, 13, 3837. [Google Scholar] [CrossRef]
- Qi, S.Z.; Peng, H.R.; Zhang, X.L.; Tan, X.J. Is energy efficiency of Belt and Road Initiative countries catching up or falling behind? Evidence from a panel quantile regression approach. Appl. Energy 2019, 253, 113581. [Google Scholar] [CrossRef]
- Pan, X.F.; Li, M.N.; Wang, M.Y.; Chu, J.H.; Bo, H.G. The effects of outward foreign direct investment and reverse technology spillover on China’s carbon productivity. Energy Policy 2020, 145, 111730. [Google Scholar] [CrossRef]
- Li, X.X.; Liu, C.X.; Wang, F.; Ge, Q.S.; Hao, Z.X. The effect of Chinese investment on reducing CO2 emission for the Belt and Road countries. J. Clean. Prod. 2021, 288, 125125. [Google Scholar] [CrossRef]
- Mahadevan, R.; Sun, Y.Y. Effects of foreign direct investment on carbon emissions: Evidence from China and its Belt and Road countries. J. Environ. Manag. 2020, 276, 111321. [Google Scholar] [CrossRef]
- Razzaq, H.A.A.; Haseeb, M.; Mihardjo, L.W.W. The role of technology innovation and people’s connectivity in testing environmental Kuznets curve and pollution heaven hypotheses across the Belt and Road host countries: New evidence from Method of Moments Quantile Regression. Environ. Sci. Pollut. Res. 2021, 28, 5254–5270. [Google Scholar]
- Yu, S.; Qian, X.W.; Liu, T.X. Belt and road initiative and Chinese firms’ outward foreign direct investment. Emerg. Mark. Rev. 2019, 41, 100629. [Google Scholar] [CrossRef]
- Huang, Y.Y. Environmental risks and opportunities for countries along the Belt and Road: Location choice of China’s investment. J. Clean. Prod. 2019, 211, 14–26. [Google Scholar] [CrossRef]
- Yu, P.; Cai, Z.F.; Sun, Y.Q. Does the emissions trading system in developing countries accelerate carbon leakage through OFDI? Evidence from China. Energy Econ. 2021, 101, 105397. [Google Scholar] [CrossRef]
- Huang, M.X.; Li, S.Y. The analysis of the impact of the Belt and Road initiative on the green development of participating countries. Sci. Total Environ. 2020, 722, 137869. [Google Scholar] [CrossRef] [PubMed]
- Xie, F.M.; Zhang, B. Impact of China’s outward foreign direct investment on green total factor productivity in “Belt and Road” participating countries: A perspective of institutional distance. Environ. Sci. Pollut. Res. 2021, 28, 4704–4715. [Google Scholar] [CrossRef] [PubMed]
- Razzaq, A.; An, H.; Delpachitra, S. Does technology gap increase FDI spillovers on productivity growth? Evidence from Chinese outward FDI in Belt and Road host countries. Technol. Forecast. Soc. Chang. 2021, 172, 12050. [Google Scholar] [CrossRef]
- Ashenfelter, O.; Card, D. Using the Longitudinal Structure of Earnings to Estimate the Effect of Training Programs. Rev. Econ. Stat. 1985, 67, 648–660. [Google Scholar] [CrossRef]
- Villa, J. Diff: Simplifying the estimation of difference-in-differences treatment effects. Stata J. 2016, 16, 52–71. [Google Scholar] [CrossRef] [Green Version]
- Blundell, R.; Dias, M.C. Alternative approaches to evaluation in empirical microeconomics. Port. Econ. J. 2008, 44, 565–640. [Google Scholar]
- Dong, Z.X.; Miao, Z.; Zhang, Y. The impact of China’s outward foreign direct investment on domestic innovation. J. Asian Econ. 2021, 101307. [Google Scholar] [CrossRef]
- Ruzol, C.; Cabanilla, D.B.; Ancog, R.; Peralta, E. Understanding water pollution management: Evidence and insights from incorporating cultural theory in social network analysis. Glob. Environ. Chang. 2017, 45, 183–193. [Google Scholar] [CrossRef]
- Ciarapica, P.; Bevilacqua, M.; Antomarioni, S. An approach based on association rules and social network analysis for managing environmental risk: A case study from a process industry. Process Saf. Environ. Prot. 2019, 128, 50–64. [Google Scholar] [CrossRef]
- Arellano, M.; Bond, S. Some tests of specification for panel data: Monte Carlo evidence and an application to employment equations. Rev. Econ. Stud. 1991, 58, 277–297. [Google Scholar] [CrossRef] [Green Version]
- Blundell, R.; Bond, S. Initial conditions and moment restrictions in dynamic panel-data models. J. Econometr. 1998, 87, 115–143. [Google Scholar] [CrossRef] [Green Version]
- Sarafidis, V.; Robertson, D. On the impact of error cross-sectional dependence in short dynamic panel estimation. Econometr. J. 2009, 12, 62–81. [Google Scholar] [CrossRef]
- He, R.F.; Zhong, M.R.; Huang, J.B. The dynamic effects of renewable-energy and fossil-fuel technological progress on metal consumption in the electric power industry. Resour. Policy 2021, 71, 101985. [Google Scholar] [CrossRef]
- Li, J.Y.; Li, S.S. Energy investment, economic growth and carbon emissions in China—Empirical analysis based on spatial Durbin model. Energy Policy 2020, 140, 111425. [Google Scholar] [CrossRef]
- Li, L.; Hong, X.F.; Wang, J. Evaluating the impact of clean energy consumption and factor allocation on China’s air pollution: A spatial econometric approach. Energy 2020, 195, 116842. [Google Scholar] [CrossRef]
- Chang, S.C. The determinants and motivations of China’s outward foreign direct investment: A spatial gravity model approach. Glob. Econ. Rev. 2014, 43, 244–268. [Google Scholar] [CrossRef]
- Liu, H.Y.; Deseatnicov, I. Exchange rate and Chinese outward FDI. Appl. Econ. 2016, 48, 4961–4976. [Google Scholar] [CrossRef]
- Elhorst, P.; Piras, Q.; Arbia, G. Growth and convergence in a multiregional model with space-time dynamics. Geogr. Anal. 2010, 42, 338–355. [Google Scholar] [CrossRef]
- Huang, Y.P. Understanding China’s Belt & Road Initiative: Motivation, framework and assessment. China Econ. Rev. 2016, 40, 314–321. [Google Scholar]
- Shao, X. Chinese OFDI responses to the B & R initiative: Evidence from a quasi-natural experiment. China Econ. Rev. 2020, 61, 101435. [Google Scholar]
- Lv, Y.; Lu, Y.; Wu, S.B.; Wang, Y. The effect of the Belt and Road Initiative on Firms’ OFDI: Evidence from China’s Greenfield Investment. Econ. Res. J. 2019, 54, 187–202. [Google Scholar]
- Hafeez, M.; Yuan, C.; Khelfaoui, I.; Sultan Musaad, O.A.; Waqas Akbar, M.; Jie, L. Evaluating the energy consumption inequalities in the one belt and one road region: Implications for the environment. Energies 2019, 12, 1358. [Google Scholar] [CrossRef] [Green Version]
- Azman-Saini, W.N.W.; Law, S.H.; Ahmad, A.H. FDI and economic growth: New evidence on the role of financial markets. Econ. Lett. 2010, 107, 211–213. [Google Scholar] [CrossRef]
- Jiang, M.R.; Luo, S.M.; Zhou, G.Y. Financial development, OFDI spillovers and upgrading of industrial structure. Technol. Forecast Soc. Change 2020, 155, 119974. [Google Scholar] [CrossRef]
- Liu, Z.M.; Han, W.P.; Zhang, Y. Energy consumption and risk prevention along the “Belt and Road”. Coal Econ. Res. 2020, 40, 10–22. [Google Scholar]


| Category | Research Objective | Main Conclusion | Main Method | Literature Source |
|---|---|---|---|---|
| Location choice | Host country | Chinese OFDI is related to energy efficiency, political environment, and resource endowment | PSM-DID | Liu et al. (2020) |
| Host country | Chinese OFDI is related to energy efficiency and industrial structure | Generalised Least Squares | Wang et al. (2020) | |
| Host country | Chinese OFDI correlates with the host country willingness to participate | OLS Regression Model | Yu et al. (2019) [42] | |
| Host country | Chinese OFDI impacts on the environment of host countries | TOPSIS Model | Huang (2019) [43] | |
| Energy, carbon emission and environment | Host country | The Belt and Road Initiative promotes carbon leakage through investment. | PSM-DID | Yu et al. (2021) [44] |
| Home country, Home country | Pollution caused by Chinese OFDI is influenced by the level of development of the host country. | SYS-GMM | Mahadevan and Sun (2020) | |
| Home country | Chinese OFDI helps reduce carbon emissions in host countries | Quantitative Model, Scenario Simulation | Li et al. (2021) | |
| Home country | Chinese OFDI helps improve energy security | Logit Model | Zhao et al. (2020) | |
| Home country | Fossil energy trade cooperation has a negative impact on the green development capacity of host countries | Spatial Dubin Model | Huang and Li (2020) [45] | |
| Technology spillover | Host country | Chinese OFDI is green, and there is no pollution transfer | Threshold Regression Model | Xie and Zhang (2021) [46] |
| GDP and capacity | Home country | Chinese OFDI technology spillovers can have an impact on total factor productivity in host countries | Empirical Model | Razzaq (2021) [47] |
| Year | Moran I | p |
|---|---|---|
| 2003 | 0.215 | 0.009 |
| 2004 | 0.294 | 0.001 |
| 2005 | 0.389 | 0.000 |
| 2006 | 0.347 | 0.000 |
| 2007 | 0.293 | 0.000 |
| 2008 | 0.258 | 0.000 |
| 2009 | 0.243 | 0.004 |
| 2010 | 0.271 | 0.002 |
| 2011 | 0.294 | 0.001 |
| 2012 | 0.312 | 0.000 |
| 2013 | 0.329 | 0.000 |
| 2014 | 0.324 | 0.000 |
| 2015 | 0.301 | 0.001 |
| 2016 | 0.307 | 0.002 |
| Test Variable | Statistics | p |
|---|---|---|
| LM (lag) test | 1247.496 | 0.0000 |
| Robust LM (lag) test | 215.2227 | 0.0000 |
| LM (err) test | 1135.8967 | 0.0000 |
| Robust LM (err) test | 103.6225 | 0.0000 |
| LR test for spatial lag | 47.743 | 0.0000 |
| Wald test for spatial lag | 48.5135 | 0.0000 |
| LR test for spatial error | 116.1236 | 0.0000 |
| Wald test for spatial error | 108.6035 | 0.0000 |
| Variable | Geographic Distance | Economic Distance |
|---|---|---|
| e | 0.2314 *** (5.3953) | 0.1719 *** (3.9836) |
| gdpp | 0.2018 * (1.9153) | 1.1719 *** (7.3217) |
| lab | 0.7230 *** (11.0104) | 0.0902 *** (15.0935) |
| tra | 0.5114 *** (4.1126) | 0.6148 *** (4.7155) |
| ope | 0.0534 *** (5.0141) | 0.0640 *** (5.5749) |
| ef | −0.7543 * (−1.5999) | −0.0869(−0.1697) |
| gov | 0.3267 * (1.7799) | −0.10369 (−0.5535) |
| W *e | 0.0406 (0.2207) | −0.05344 * (−0.2833) |
| W *gdp | −0.0822 (−0.1649) | −1.8692 *** (−0.3789) |
| W *lab | 2.7236 *** (7.9224) | −0.2005 (−0.7245) |
| W *tra | 0.4265 (0.6507) | −1.8939 *** (−4.4963) |
| W *ope | 0.0736 (1.1747) | −0.1415 *** (−3.9363) |
| W *ef | 8.4509 ** (2.2175) | 2.1970 ** (2.1184) |
| W *gov | −2.6759 ** (−3.0845) | −0.45655 (−0.7228) |
| W *dep.var | −0.5959 *** (−4.8055) | −0.07879 * (−1.1083) |
| R2 | 0.9354 | 0.8895 |
| Logl | −1491.9676 | −1544.7915 |
| Variable | Geographic Distance | ||
|---|---|---|---|
| Direct Effect | Indirect Effect | Total Effect | |
| e | 0.2328 *** (5.2080) | −0.0543 * (−0.1454) | 0.1784 * (0.4783) |
| gdpp | 0.2033 ** (1.9046) | −0.1231 * (−0.3752) | 0.080 * (0.2660) |
| lab | 0.6742 *** (8.5685) | 1.5666 (0.6581) | 2.2409 (0.9271) |
| tra | 0.5101 *** (4.0592) | 0.0883 ** (4.7155) | 0.5985 * (0.5341) |
| ope | 0.5214 *** (4.6137) | 0.0312 *** (0.3073) | 0.0833 * (0.8123) |
| ef | −0.9533 ** (−1.9311) | 6.0250 * (0.8574) | −0.7543 (−1.5999) |
| gov | 0.3943 ** (2.1772) | −1.9279 (−1.1649) | 0.3267 (1.7799) |
| Variable | Economic Distance | ||
| Direct Effect | Indirect Effect | Total Effect | |
| e | 0.1725 *** (3.9912) | −0.0580 * (−0.3476) | 0.1145 * (0.6232) |
| gdpp | 1.1920 *** (7.205) | −1.8343 *** (−3.9937) | −0.6423 * (−1.5340) |
| lab | 0.9721 *** (15.1894) | −0.2616 (−1.0939) | 0.7105 *** (2.7277) |
| tra | 0.6336 *** (4.8908) | −1.8255 *** (−4.4485) | −1.1918 ** (−2.6361) |
| ope | 0.0652 *** (5.7355) | −0.1363 *** (−3.8994) | −0.0711 * (−1.9662) |
| ef | −0.1289 (−0.2702) | 2.1410 ** (2.0990) | 2.0221 * (1.8615) |
| gov | −0.0889 (−0.4784) | −0.4652 (−0.7855) | −0.5541 (−0.9150) |
| Variable | Model 1 | Model 2 | Model 3 | Model 4 |
|---|---|---|---|---|
| region | 0.0526 *** (1.9280) | 0.0575 ** (2.00) | 0.1354 *** (3.60) | |
| time | −0.0204 *** (−1.08) | −0.0187 (−0.50) | −0.2848 *** (−3.79) | |
| region × time | −0.0078 (−0.19) | 0.0451 (1.02) | ||
| ofdi × region | −0.0225 * (−1.77) | |||
| ofdi × time | 0.0514 *** (3.59) | |||
| ofdi | 0.0206 *** (3.09) | 0.0223 *** (3.07) | 0.0238 *** (3.31) | 0.0361 *** (3.15) |
| gdpp | 0.4401 *** (16.44) | 0.4123 *** (20.17) | 0.4411 *** (16.51) | 0.4397 *** (16.81) |
| urb | 1.1187 *** (14.99) | 1.1468 *** (15.23) | 1.1215 *** (14.97) | 1.1174 *** (15.02) |
| trade | 0.0769 *** (3.51) | 0.0863 *** (4.08) | 0.0766 *** (3.44) | 0.0787 *** (3.67) |
| pop | 0.882 *** (46.57) | 0.8745 *** (46.54) | 0.8786 *** (45.80) | 0.8741 *** (45.75) |
| ind | 0.4356 *** (10.87) | 0.4623 *** (12.16) | 0.4269 *** (10.42) | 0.4288 *** (10.31) |
| Cons | −8.1990 *** (−40.27) | −8.1232 *** (−39.88) | −8.1830 *** (−39.74) | −8.1935 *** (−40.11) |
| R2 | 0.8800 | 0.8796 | 0.8802 | 0.8816 |
| F | 740.86 | 727.53 | 579.61 | 499.94 |
| Variable | Model 5 | Model 6 | Model 7 |
|---|---|---|---|
| region | 0.1403 *** (3.71) | 0.4253 *** (4.01) | 0.8051 *** (6.26) |
| time | −0.3134 *** (−3.78) | −0.1077 *** (−5.74) | −0.1655 *** (−6.88) |
| region × time | 0.3824 (0.87) | 0.0073 (0.71) | −0.0038 (−0.37) |
| ofdi × region | −0.0212 * (−1.67) | 0.0156 ** (2.38) | 0.0087 (1.51) |
| ofdi × time | 0.0443 *** (3.00) | 0.0177 *** (5.21) | 0.0109 *** (3.05) |
| ofdi | 0.4636 *** (3.69) | −0.1703 *** (−0.37) | 0.0066 * (1.18) |
| gdpp | 0.4437 *** (17.04) | 0.4150 *** (8.22) | 0.5481 *** (9.39) |
| urb | 1.1173 *** (14.86) | 1.5176 *** (8.75) | 0.1775 *** (10.53) |
| trade | 0.7826 *** (3.64) | 0.0397 *** (2.77) | 0.0396 *** (2.68) |
| pop | 0.8646 *** (43.60) | 1.0713 *** (15.20) | 1.2085 *** (14.52) |
| ind | 0.4145 *** (9.83) | 0.0130 (0.47) | −0.0064 (−0.23) |
| Cons | −8.0985 (−38.41) | −9.3045 *** (−16.54) | −11.0774 *** (−16.17) |
| R2 | 0.8823 | 0.9936 | 0.994 |
| F | 243.25 | 9923.30 | 7610.20 |
| Individual fixed effects? | NO | YES | YES |
| Year fixed effects? | YES | NO | YES |
| Variable | Variable | ||
|---|---|---|---|
| region | 0.0574 ** (2.0) | ofdi × Y2013 | −0.0135 (−0.89) |
| time | −0.2512 *** (3.47) | ofdi × Y2014 | 0.0360 * (1.74) |
| region × time | 0.01862 (0.46) | ofdi × Y2015 | 0.0372 * (1.81) |
| ofdi × Y2004 | −0.0054 (−0.30) | ofdi × Y2016 | 0.0366 * (1.79) |
| ofdi × Y2005 | −0.0076 (−0.44) | ofdi | 0.0327 *** (1.97) |
| ofdi × Y2006 | −0.0106 (−0.64) | ind | 0.4402 *** (16.58) |
| ofdi × Y2007 | −0.0107 (−0.66) | gdpp | 1.1284 *** (15.00) |
| ofdi × Y2008 | −0.0144 (−0.91) | urb | 0.0762 *** (3.54) |
| ofdi × Y2009 | −0.0130 (−0.84) | trade | 0.8704 *** (44.33) |
| ofdi × Y2010 | −0.0121 (−0.79) | pop | 0.4167 *** (10.05) |
| ofdi × Y2011 | −0.0140 (−0.91) | Cons | −8.1124 *** (−39.03) |
| ofdi × Y2012 | −0.0126 (−0.82) |
| Time | M | WD | WR | WH | WE |
|---|---|---|---|---|---|
| 2003 | 534 | 0.1615 | 1 | 0.3235 | 0.7581 |
| 2004 | 519 | 0.1570 | 1 | 0.3235 | 0.8033 |
| 2005 | 522 | 0.1579 | 1 | 0.3235 | 0.8033 |
| 2006 | 523 | 0.1582 | 1 | 0.3235 | 0.8033 |
| 2007 | 519 | 0.1570 | 1 | 0.3235 | 0.8058 |
| 2008 | 523 | 0.1582 | 1 | 0.3235 | 0.8064 |
| 2009 | 519 | 0.1570 | 1 | 0.3240 | 0.8064 |
| 2010 | 515 | 0.1558 | 1 | 0.3240 | 0.8058 |
| 2011 | 498 | 0.1506 | 1 | 0.3478 | 0.8158 |
| 2012 | 512 | 0.1549 | 1 | 0.3235 | 0.8089 |
| 2013 | 512 | 0.1549 | 1 | 0.3478 | 0.8095 |
| 2014 | 518 | 0.1567 | 1 | 0.3478 | 0.8087 |
| 2015 | 527 | 0.1594 | 1 | 0.3235 | 0.8045 |
| 2016 | 529 | 0.1600 | 1 | 0.2985 | 0.8039 |
| Country | 2003 | 2014 | 2016 | |||||||||||||||
|---|---|---|---|---|---|---|---|---|---|---|---|---|---|---|---|---|---|---|
| Closeness Centrality | Betweenness Centrality | Degree Centrality | Ranking | In-Degree | Out-Degree | Closeness Centrality | Betweenness Centrality | Degree Centrality | Ranking | In-Degree | Out-Degree | Closeness Centrality | Betweenness Centrality | Degree Centrality | Ranking | In-Degree | Out-Degree | |
| China | 0.4694 | 19.7466 | 10 | 42 | 1 | 9 | 0.4423 | 0.0000 | 9 | 43 | 0 | 9 | 0.4476 | 182.6269 | 13 | 34 | 3 | 10 |
| Mongolia | 0.4796 | 0.0000 | 9 | 45 | 0 | 9 | 0.5055 | 0.0000 | 10 | 39 | 0 | 10 | 0.5275 | 0.0000 | 12 | 37 | 0 | 12 |
| Indonesia | 0.2150 | 0.0000 | 5 | 57 | 3 | 2 | 0.1731 | 0.0000 | 5 | 57 | 3 | 2 | 0.1950 | 0.0000 | 5 | 56 | 3 | 2 |
| Thailand | 0.3358 | 94.8143 | 14 | 30 | 6 | 8 | 0.2446 | 161.3333 | 11 | 35 | 6 | 5 | 0.2883 | 224.8377 | 12 | 36 | 6 | 6 |
| Malaysia | 0.2150 | 3.0000 | 11 | 38 | 9 | 2 | 0.1731 | 3.0000 | 11 | 34 | 9 | 2 | 0.1950 | 3.3333 | 12 | 35 | 10 | 2 |
| Vietnam | 0.3485 | 60.9659 | 10 | 41 | 2 | 8 | 0.3000 | 41.1667 | 9 | 42 | 2 | 7 | 0.3643 | 117.6192 | 10 | 41 | 2 | 8 |
| Singapore | 0.2706 | 390.8444 | 24 | 12 | 19 | 5 | 0.2074 | 381.9167 | 25 | 11 | 21 | 4 | 0.2398 | 396.1375 | 25 | 12 | 21 | 4 |
| Philippines | 0.3151 | 32.4143 | 7 | 55 | 1 | 6 | 0.2473 | 69.4167 | 6 | 54 | 1 | 5 | 0.2670 | 48.5505 | 6 | 55 | 1 | 5 |
| Myanmar | 0.3511 | 5.4500 | 10 | 40 | 1 | 9 | 0.2514 | 3.4167 | 7 | 50 | 1 | 6 | 0.2765 | 3.6111 | 7 | 51 | 1 | 6 |
| Cambodia | 0.3154 | 0.0000 | 7 | 54 | 0 | 7 | 0.2421 | 0.0000 | 5 | 56 | 0 | 5 | 0.2474 | 0.3333 | 6 | 54 | 1 | 5 |
| Laos | 0.3481 | 0.0000 | 7 | 53 | 0 | 7 | 0.2541 | 0.0000 | 6 | 53 | 0 | 6 | 0.2791 | 0.0000 | 6 | 53 | 0 | 6 |
| India | 0.4381 | 366.7906 | 16 | 25 | 5 | 11 | 0.4545 | 938.6546 | 17 | 23 | 7 | 10 | 0.4653 | 646.7229 | 18 | 22 | 7 | 11 |
| Pakistan | 0.3680 | 250.9241 | 12 | 35 | 3 | 9 | 0.4128 | 90.8597 | 14 | 30 | 4 | 10 | 0.4052 | 105.1311 | 15 | 28 | 6 | 9 |
| Bengal | 0.3594 | 2.0095 | 11 | 37 | 1 | 10 | 0.3285 | 5.8429 | 12 | 33 | 2 | 10 | 0.4234 | 11.0987 | 13 | 33 | 2 | 11 |
| Sri Lanka | 0.3456 | 0.0000 | 7 | 52 | 0 | 7 | 0.3046 | 0.0000 | 7 | 49 | 0 | 7 | 0.3097 | 0.0000 | 8 | 46 | 0 | 8 |
| Nepal | 0.4393 | 0.0000 | 9 | 44 | 0 | 9 | 0.3239 | 0.0000 | 9 | 41 | 0 | 9 | 0.3582 | 0.0000 | 9 | 44 | 0 | 9 |
| Saudi Arabia | 0.3239 | 231.1935 | 38 | 4 | 31 | 7 | 0.3383 | 724.4516 | 31 | 6 | 24 | 7 | 0.3431 | 478.8762 | 31 | 6 | 24 | 7 |
| United Arab Emirates | 0.2987 | 95.2185 | 18 | 18 | 13 | 5 | 0.2586 | 15.0333 | 19 | 20 | 16 | 3 | 0.2611 | 17.6195 | 19 | 20 | 16 | 3 |
| Oman | 0.3433 | 212.9054 | 24 | 11 | 18 | 6 | 0.3383 | 62.1782 | 15 | 27 | 9 | 6 | 0.3431 | 44.3638 | 15 | 27 | 9 | 6 |
| Iran | 0.2893 | 3.1401 | 12 | 34 | 6 | 6 | 0.2695 | 2.5333 | 9 | 40 | 4 | 5 | 0.3333 | 136.5660 | 9 | 43 | 3 | 6 |
| Turkey | 0.4381 | 597.2394 | 24 | 10 | 14 | 10 | 0.4592 | 429.1606 | 27 | 8 | 15 | 12 | 0.4563 | 430.3180 | 30 | 7 | 18 | 12 |
| Israel | 0.2140 | 155.0000 | 47 | 3 | 45 | 2 | 0.1829 | 142.8083 | 43 | 3 | 41 | 2 | 0.1808 | 142.4164 | 42 | 2 | 40 | 2 |
| Egypt | 0.2875 | 27.8803 | 12 | 33 | 7 | 5 | 0.2695 | 26.9778 | 13 | 31 | 8 | 5 | 0.2717 | 29.8303 | 14 | 29 | 9 | 5 |
| Kuwait | 0.3382 | 600.5419 | 53 | 2 | 47 | 6 | 0.2679 | 208.7239 | 45 | 2 | 39 | 6 | 0.2901 | 166.0291 | 40 | 3 | 34 | 6 |
| Iraq | 0.2875 | 2.7949 | 8 | 49 | 3 | 5 | 0.2679 | 2.5333 | 7 | 48 | 3 | 4 | 0.2701 | 2.3763 | 7 | 50 | 3 | 4 |
| Qatar | 0.2644 | 105.2250 | 53 | 1 | 49 | 4 | 0.2647 | 292.7432 | 54 | 1 | 50 | 4 | 0.2670 | 281.4095 | 54 | 1 | 50 | 4 |
| Jordan | 0.1769 | 0.0000 | 3 | 58 | 2 | 1 | 0.1552 | 0.0000 | 4 | 58 | 3 | 1 | 0.1536 | 0.0000 | 4 | 58 | 3 | 1 |
| Lebanon | 0.2690 | 88.0000 | 5 | 56 | 1 | 4 | 0.2217 | 86.0000 | 5 | 55 | 1 | 4 | 0.2186 | 90.0000 | 4 | 57 | 1 | 3 |
| Bahrain | 0.2421 | 8.8260 | 23 | 13 | 20 | 3 | 0.2163 | 3.8333 | 16 | 26 | 13 | 3 | 0.2176 | 3.1929 | 15 | 26 | 12 | 3 |
| Yemen | 0.3154 | 0.0000 | 7 | 51 | 0 | 7 | 0.2805 | 0.0000 | 7 | 47 | 0 | 7 | 0.2824 | 0.0000 | 7 | 49 | 0 | 7 |
| Georgia | 0.3983 | 0.0000 | 8 | 48 | 0 | 8 | 0.4107 | 0.0000 | 8 | 44 | 0 | 8 | 0.4103 | 0.0000 | 9 | 42 | 0 | 9 |
| Azerbaijan | 0.3643 | 0.0000 | 8 | 47 | 0 | 8 | 0.3382 | 0.0000 | 6 | 52 | 0 | 6 | 0.3357 | 0.0000 | 6 | 52 | 0 | 6 |
| Armenia | 0.3983 | 0.0000 | 8 | 46 | 0 | 8 | 0.3866 | 0.0000 | 7 | 46 | 0 | 7 | 0.4068 | 0.0000 | 8 | 45 | 0 | 8 |
| Russia | 0.5000 | 295.3491 | 17 | 19 | 6 | 11 | 0.5357 | 473.1060 | 17 | 22 | 4 | 13 | 0.5281 | 445.8616 | 19 | 19 | 6 | 13 |
| Poland | 0.3898 | 21.2588 | 22 | 14 | 11 | 11 | 0.5000 | 101.4327 | 24 | 12 | 11 | 13 | 0.4796 | 125.4089 | 25 | 11 | 13 | 12 |
| Romania | 0.4220 | 14.4214 | 20 | 17 | 7 | 13 | 0.4455 | 162.1185 | 26 | 10 | 13 | 13 | 0.4352 | 151.7289 | 25 | 10 | 12 | 13 |
| Czech | 0.4554 | 372.2629 | 35 | 5 | 20 | 15 | 0.4327 | 254.4116 | 32 | 4 | 18 | 14 | 0.4608 | 313.4402 | 37 | 4 | 22 | 15 |
| Slovakia | 0.4035 | 36.3220 | 27 | 8 | 13 | 14 | 0.4369 | 70.9214 | 31 | 5 | 16 | 15 | 0.4273 | 64.2363 | 31 | 5 | 16 | 15 |
| Bulgaria | 0.4071 | 9.4107 | 16 | 24 | 5 | 11 | 0.4286 | 14.8274 | 19 | 19 | 7 | 12 | 0.4234 | 14.5863 | 19 | 18 | 7 | 12 |
| Hungary | 0.4071 | 43.0313 | 28 | 7 | 13 | 15 | 0.4128 | 38.0238 | 26 | 9 | 13 | 13 | 0.4017 | 42.5756 | 27 | 9 | 13 | 14 |
| Latvia | 0.3833 | 0.3790 | 11 | 36 | 2 | 9 | 0.3947 | 1.2986 | 12 | 32 | 3 | 9 | 0.3790 | 1.0731 | 11 | 40 | 3 | 8 |
| Lithuania | 0.3802 | 1.3373 | 12 | 32 | 4 | 8 | 0.3543 | 1.9835 | 7 | 45 | 3 | 4 | 0.3456 | 1.5852 | 7 | 48 | 3 | 4 |
| Slovenia | 0.3382 | 298.6170 | 34 | 6 | 24 | 10 | 0.3462 | 55.8261 | 27 | 7 | 18 | 9 | 0.3643 | 50.3766 | 27 | 8 | 18 | 9 |
| Estonia | 0.4554 | 11.4176 | 16 | 23 | 3 | 13 | 0.4054 | 6.9851 | 14 | 29 | 3 | 11 | 0.4393 | 11.0311 | 13 | 32 | 3 | 10 |
| Croatia | 0.3087 | 6.0092 | 15 | 27 | 11 | 4 | 0.3409 | 3.6318 | 16 | 25 | 10 | 6 | 0.3534 | 3.7924 | 16 | 25 | 10 | 6 |
| Albania | 0.4071 | 39.7420 | 16 | 22 | 6 | 10 | 0.4327 | 47.8730 | 20 | 16 | 7 | 13 | 0.4273 | 45.5574 | 20 | 15 | 7 | 13 |
| Serbia | 0.3740 | 12.7755 | 16 | 21 | 7 | 9 | 0.4206 | 24.0899 | 20 | 15 | 9 | 11 | 0.4123 | 15.3942 | 18 | 21 | 8 | 10 |
| Ukraine | 0.4466 | 128.7834 | 24 | 9 | 10 | 14 | 0.4688 | 195.2176 | 23 | 13 | 10 | 13 | 0.4563 | 168.7201 | 24 | 13 | 11 | 13 |
| Belarus | 0.4466 | 116.6673 | 20 | 16 | 8 | 12 | 0.4688 | 155.7777 | 19 | 18 | 7 | 12 | 0.4434 | 120.1162 | 19 | 17 | 8 | 11 |
| Moldova | 0.4259 | 35.7197 | 21 | 15 | 8 | 13 | 0.4455 | 60.8953 | 22 | 14 | 8 | 14 | 0.4393 | 67.4001 | 22 | 14 | 8 | 14 |
| Macedonia | 0.4144 | 17.7680 | 15 | 26 | 3 | 12 | 0.4327 | 21.4212 | 19 | 17 | 6 | 13 | 0.4273 | 21.1117 | 19 | 16 | 6 | 13 |
| Bosnia and Herzegovina | 0.3770 | 38.6167 | 16 | 20 | 7 | 9 | 0.3982 | 31.8028 | 16 | 24 | 7 | 9 | 0.3950 | 30.5076 | 16 | 24 | 7 | 9 |
| Montenegro | 0.3833 | 1.4000 | 14 | 29 | 3 | 11 | 0.3750 | 2.3876 | 14 | 28 | 3 | 11 | 0.3790 | 1.2310 | 13 | 31 | 3 | 10 |
| Kazakhstan | 0.4381 | 188.2981 | 14 | 28 | 4 | 10 | 0.3782 | 198.1370 | 17 | 21 | 8 | 9 | 0.4273 | 171.8638 | 17 | 23 | 8 | 9 |
| Uzbekistan | 0.5227 | 17.1219 | 13 | 31 | 1 | 12 | 0.4091 | 5.5402 | 10 | 38 | 1 | 9 | 0.5165 | 25.1090 | 13 | 30 | 1 | 12 |
| Turkmenistan | 0.3154 | 0.0000 | 7 | 50 | 0 | 7 | 0.2968 | 0.0000 | 6 | 51 | 0 | 6 | 0.3404 | 0.0000 | 7 | 47 | 0 | 7 |
| Kyrgyzstan | 0.4694 | 15.3667 | 10 | 39 | 1 | 9 | 0.4091 | 5.7069 | 10 | 37 | 1 | 9 | 0.5000 | 15.2924 | 11 | 39 | 1 | 10 |
| Tajikistan | 0.3701 | 0.0000 | 9 | 43 | 0 | 9 | 0.4144 | 0.0000 | 10 | 36 | 0 | 10 | 0.5053 | 0.0000 | 11 | 38 | 0 | 11 |
| Variable | Model 1 | Model 2 | Model 3 | Model 4 | Model 5 | Model 6 |
|---|---|---|---|---|---|---|
| LnEI(-1) | 0.2724 ***(7.23) | 0.2587 *** (8.96) | 0.2864 *** (6.97) | 0.3142 *** (10.19) | 0.2441 *** (8.32) | 0.24449 *** (8.41) |
| time | −0.2079 *** (−2.21) | |||||
| region | 0.0419 (0.25) | |||||
| Lnofdi × time | 0.1954 * (1.17) | |||||
| Lnofdi × region | −0.0105 (−1.21) | |||||
| Lngdp | 0.1909 *** (4.17) | 0.2105 *** (3.42) | 0.2534 *** (9.52) | 0.1849 *** (5.01) | 0.1737 *** (5.15) | 0.1814 *** (2.60) |
| Lnes | 0.2273 ** (2.42) | 0.2389 *** (6.68) | 0.3212 ** (3.83) | 0.2586 *** (6.82) | 0.2566 *** (4.30) | 0.2744 *** (5.57) |
| Lnis | 0.1999 *** (4.19) | 0.1576 *** (3.99) | 0.1710 *** (5.36) | 0.1237 *** (3.72) | 0.1864 *** (2.58) | 0.1497 *** (3.72) |
| Lnurb | 0.3892 * (1.85) | 0.6679 ** (2.17) | 0.3630 *** (2.79) | 0.6010 *** (4.54) | 0.6300 *** (3.11) | 0.5735 * (1.86) |
| Lnofdi | 0.0536 *** (4.54) | |||||
| Lnofdi × fdi | 0.0033 *** (3.28) | |||||
| Lnofdi × ds | −0.0034 *** (−3.79) | |||||
| Lnofdi × rd | 0.0031 *** (3.96) | |||||
| Lnofdi × hc | 0.0167 *** (5.82) | |||||
| Lnofdi × fin | 0.0038 *** (4.54) | |||||
| Cons | −5.0587 *** (−4.63) | −6.2043 *** (−7.82) | −5.1924 *** (−8.41) | −5.5226 *** (−10.34) | −5.7440 *** (−7.55) | −5.5599 *** (−6.47) |
| sargen p | 1 | 1 | 1 | 1 | 1 | 1 |
| AR(1) | 0.0124 | 0.0086 | 0.0091 | 0.012 | 0.0118 | 0.0121 |
| AR(2) | 0.1796 | 0.1249 | 0.1330 | 0.1279 | 0.1719 | 0.1488 |
Publisher’s Note: MDPI stays neutral with regard to jurisdictional claims in published maps and institutional affiliations. |
© 2021 by the authors. Licensee MDPI, Basel, Switzerland. This article is an open access article distributed under the terms and conditions of the Creative Commons Attribution (CC BY) license (https://creativecommons.org/licenses/by/4.0/).
Share and Cite
Zhou, X.; Guo, Q.; Zhang, M. Impacts of OFDI on Host Country Energy Consumption and Home Country Energy Efficiency Based on a Belt and Road Perspective. Energies 2021, 14, 7343. https://doi.org/10.3390/en14217343
Zhou X, Guo Q, Zhang M. Impacts of OFDI on Host Country Energy Consumption and Home Country Energy Efficiency Based on a Belt and Road Perspective. Energies. 2021; 14(21):7343. https://doi.org/10.3390/en14217343
Chicago/Turabian StyleZhou, Xing, Quan Guo, and Ming Zhang. 2021. "Impacts of OFDI on Host Country Energy Consumption and Home Country Energy Efficiency Based on a Belt and Road Perspective" Energies 14, no. 21: 7343. https://doi.org/10.3390/en14217343
APA StyleZhou, X., Guo, Q., & Zhang, M. (2021). Impacts of OFDI on Host Country Energy Consumption and Home Country Energy Efficiency Based on a Belt and Road Perspective. Energies, 14(21), 7343. https://doi.org/10.3390/en14217343