Article

MPG Illusion and Vehicle Choice: An Empirical Study of the Japanese Household Survey

1
Faculty of Economics, Musashi University, Tokyo 176-8534, Japan
2
Faculty of Economics, Matsuyama University, Ehime 790-8578, Japan
3
Urban Institute and Department of Civil Engineering, Kyushu University, Fukuoka 819-0395, Japan
*
Author to whom correspondence should be addressed.
Energies 2021, 14(21), 7294; https://doi.org/10.3390/en14217294
Submission received: 1 May 2021 / Revised: 2 September 2021 / Accepted: 20 October 2021 / Published: 4 November 2021
(This article belongs to the Special Issue Economic Analysis on Energy and Environmental Issues and Policy)

Abstract

:
Previous studies have shown that people understand the future ancillary cost of durable goods such as an automotive vehicle. However, consumers tend to misunderstand the future benefits and costs of these goods. One of the most interesting discussions about consumer cognitive ability for future energy cost is the miles per gallon (MPG) illusion. In this study, we analyze people’s misunderstanding of the relationship between kilometers per liter (KPL) and the actual amount of fuel saved using vehicle owner survey data. We developed some questions to measure how much each person is involved with the MPG (or KPL) illusion. Additionally, our survey includes questions capturing some preferences affecting future fuel costs, such as time. Controlling for the most important respondent characteristics, such as income or gender, our empirical model analyzes the extent of the misunderstanding of how much actual KPL selections of personal auto vehicles are affected. We found that many Japanese consumers tend to misunderstand the relationship between KPL and actual fuel costs. Our results demonstrate that people who misunderstand the relationship tend to choose a higher 4.324 km per liter car than those who understand. This finding implies that the KPL illusion affects the KPL selection of consumers’ cars.

1. Introduction

Previous studies have shown that people understand the future ancillary cost of durable goods [1,2]. However, consumers tend to misunderstand the future benefits and costs of goods [3]. Even when consumers can gain future benefits by purchasing new energy-efficient durable goods, they tend to avoid upgrading to such goods. This phenomenon is known as the “energy paradox” for several years [4].
One of the typical examples is consumers’ choice of new automotive vehicles. Suppose that a person replaces a car with one having high fuel efficiency. The cost is generally more than that of nonfuel-efficient cars. Therefore, whether they buy the car depends on the magnitude relation between the fuel cost reduction estimated for the future and their price. In theory, the additional expenditure for the new eco-friendly car price that a consumer is willing to pay will equal the total future savings on fuel cost if consumers are rational. However, consumer misperception has been found in many studies [5].
In particular, two mechanisms could cause consumers to misperceive fuel costs when replacing an older car with a newer one [5]. First, consumers might mistakenly categorize two vehicles as the same in a simple version of “coarse thinking” [6]. Second, given the belief that two vehicles have different MPGs (miles per gallon), consumers might underestimate or overestimate the resulting fuel cost differences. This phenomenon is called MPG illusion. Actually, previous findings highlighted that consumers misunderstand future fuel costs by MPG displays [7]. They mentioned that people falsely believe that the amount of gasoline consumed by an automotive vehicle decreases as a linear function of a vehicle’s MPG. The actual relationship between the MPG and the amount of gasoline consumed is curvilinear. Such a misunderstanding may cause consumers to irrationally select automotive vehicles.
One previous study classified the two factors and estimated the extent of the MPG illusion using the USA’s government survey about vehicle ownership [5]. The study revealed that the MPG illusion affects the consumer’s car choice and consumer surplus. Additionally, other study demonstrated that only 33 percent of people correctly understand the fuel cost change when replacing a new vehicle in the US by online surveys [8]. Previous studies also mentioned that consumers tend to make large errors estimating gasoline costs and savings over time [9,10]. If the consumer cannot accurately estimate the amount of future savings on fuel by the MPG illusion, they may misevaluate the actual future savings in fuel cost by the replacement. Therefore, the MPG illusion makes it impossible for people to purchase desirable cars, that is, it leads to consumer welfare loss.
However, consumers in each country may have a different cognitive capacity for the information because education and car use situations vary across countries. Additionally, the information provided differs in each country. US consumers do not pay enough attention to MPG when they purchase an automotive vehicle [11]. In contrast, Japanese consumers tend to be more interested in kilometer per liter (KPL) when buying a car. Generally, a unit of liquid measurement is liter (L) in Japan. Moreover, the distance unit used in Japan is the kilometer (km). Thus, we use KPL instead of the MPG when we mention our study and the Japanese situation. Some studies have focused on Japanese consumer behavior, revealing that KPL is an important factor when purchasing an automotive vehicle [12]. The Japan Automobile Manufacturers Association reports that 60% of respondents place importance on KPL [13]. This evidence implies that purchasing behavior in Japan may be more affected by the KPL information than in the US. Previous studies do not clearly show how much the MPG illusion affects the actual purchasing behavior of vehicles in Japan.
In this study, we analyze people’s misunderstanding of the relationship between KPL and the actual amount of gasoline saved using questionnaire survey data. Previous studies have already found that misperception of fuel costs is caused by MPG displays [5,11]. The study used questionnaire survey results to show the unconsciousness of future fuel costs when people use an automotive vehicle [11]. Another study established a microeconomic framework to reveal whether the MPG illusion occurs [5]. However, these studies do not use direct measurements to capture each person’s extent of misunderstanding the relationship between MPG and future fuel costs. We conduct questions to measure how much each person is involved with the MPG (or KPL) illusion. Our study aims to reveal how much KPL illusion occurs by the statistical confirmation of the robust relationship between the answer to the questions and the KPL of automotive vehicle owners. Additionally, our survey includes questions capturing preferences affecting future fuel costs, such as time preference. These questions enable us to analyze the extent of the misunderstanding of how much effect the actual KPL selection is of the owner’s automotive vehicle after controlling for the most important respondents’ characteristics.

2. Questionnaire Survey and Analysis

In this section, we introduce how to set up an online survey and analyze the data. To reveal the relationship between a person’s misunderstanding of future fuel cost by KPL display and actual KPL selection of their own car, we needed to combine the car type answered by the questionnaire survey with car catalog data. First, we explain the questionnaire survey that we implemented in Section 2.1. Second, we explain how to combine the survey and catalog data in Section 2.2.

2.1. Questionnaire Survey

In this study, we implemented an online questionnaire survey on the KPL illusion, characteristics of the owners’ auto vehicles, and other characteristics affecting the purchasing behavior of consumers for auto vehicles. We recommend preparing the vehicle inspection certificate or certificate of car insurance before starting the questionnaire survey, since details of the car type were available here. This survey included samples from all regions in Japan. This survey covers the respondents between 18 and 69 years old. Additionally, the survey only focuses on the respondents who have auto vehicles. The sampling of this survey is based on the population distribution of each age class and prefecture in Japan. Additionally, the samples were randomly chosen based on the distribution of the population in each region. This survey was conducted in March 2013 by Nikkei Research Inc. The total samples obtained was 4403. Our survey was implemented only once. Therefore, our dataset is cross sectional.
The questionnaire survey first asked about automotive vehicle characteristics, including type, purchase year, method of acquisition, and model year. Some households owned multiple auto vehicles. We cannot judge which auto vehicle is most suitable for analysis if we ask for all of the auto vehicles. Therefore, the questionnaire survey focused on the respondent’s main automotive vehicle, the car used the most. Second, we asked about their household characteristics, including gender (since gender significantly affects car type choices). We also asked about the general characteristics of the household, including the number of family members and annual income. The survey also included household characteristics related to car use (running distance per year).
Third, we set up questions to measure the extent of misunderstanding the KPL and each respondent’s time preference. Table 1 shows the questions used to measure the extent of the KPL illusion. In this question, respondents assumed a situation wherein they purchased a new automotive vehicle. In each option, “now” shows the KPL of the car before purchasing a new car. “After upgrade” shows the KPL of a new auto vehicle. In summary, each question shows the actual reduction amount of fuel per kilometer between pre- and post-upgrade automotive vehicles. We asked the respondents which option (P or Q) can reduce the fuel cost after purchasing a new fuel-efficient automotive vehicle. For example, question No. 1 shows that both options can improve 10 km/L before and after an upgrade. However, the actual fuel savings were different. The actual fuel saving amount of each question between pre- and post-upgrades can be confirmed in Figure 1. If the respondent only considers the gap in KPL, the respondent chooses option Q in questions 3 and 4. Additionally, this respondent chooses option P in questions 5 and 6. In questions 1 and 2, no difference in KPL between option P and Q. We hypothesize that the percentage of questions answered correctly is 50 percent for each question. However, if the respondent recognizes the actual saving amount of fuel between options P and Q, the respondent will choose option Q in questions 1, 3, and 5. Additionally, such a respondent will choose option P in questions 2, 4, and 6. We can capture the extent to which each respondent understands the relationship between KPL and actual fuel costs from these answers.
In this study, we also formulated questions for measuring time preference. Time preference is an important factor when consumers purchase durable goods, such as an automotive vehicle. Many previous studies estimate the time discount rate (time preference) using data related to durable goods with energy consumption [14]. Table 2 shows the questions used to measure time preference.
Our dataset covers all of the regions in Japan, and the sample size was large. Additionally, we set up a questionnaire to capture the preferences of respondents. In particular, our survey captures how well each respondent understands KPL and actual fuel costs. These questions help us to better understand the KPL illusion effect for automotive vehicle choice. Of course, our survey has some limitations. For example, this survey does not give the economic incentive when the respondent answers the question related to preferences. Hypothetical questions may cause bias in estimating the time preference of each respondent. However, the results of a hypothetical question can capture a rough trend of the preference. In fact, some previous studies used the results of hypothetical questions for analysis [14]. Second, some respondents may submit false information about their own cars. This problem is discussed in a later section.

2.2. Matching Auto Vehicle Data

In this study, we aimed to analyze how the KPL illusion affects the actual KPL of respondents’ automotive vehicles. The data must be matched to the respondent’s car type and questionnaire results that measure the extent of the KPL illusion to reveal the relationship between the misunderstanding of KPL and actual car purchase behavior. Our questionnaire survey requires respondents to answer details about the car model. We combine the answers of each respondent and the KPL data of the car model from the Society of Automobile Engineers of Japan [15].
However, we excluded some samples in the analysis because we could not combine proper KPL and respondents’ answers. One such example is one where the car name or related information to identify their car model is unknown. Another is cars purchased before 2005. In general, automakers implement minor model changes from year to year. Although the car name is the same, the performance and detail setting of the car changes due to these minor changes. We omitted the responses where the purchase was before 2005 (1432 samples) to avoid mismatching KPL and the respondent’s answer. Additionally, we excluded samples in which respondents did not respond to questions on household income. Finally, our regression analysis included 1298 complete valid responses.

2.3. Regression Analysis

Based on the matching data between the questionnaire survey and catalog data of each automotive vehicle, we attempted to show the extent to which KPL affected actual vehicle ownership. The estimation model is as follows:
K P L i = β 1 I n c o m e i + β 2 M a l e i + β 3 F a m i l y i + β 4 R u n n i n g i + β 5 I l l u s i o n i + β 6 T i m e i + c + ε i
where i is the respondent, β is a set of estimated parameters (from β1 to β6), c is the constant term, and β is the disturbance term. In this estimation, we apply ordinary least squares (OLS). The dependent variable is the actual KPL of the respondent’s automotive vehicle (KPL). In this study, KPL mean fuel economy of the 10·15 mode is defined by the Ministry of Land, Infrastructure, Transport and Tourism. Income is the representative value of each income class. Male shows the gender dummy (Male = 1, Female = 0) of respondents. Classes of income are set in ranges of 2 million JPY (1 = below 2 million JPY, 2 = between 2 million and 4 million JPY, 10 = between 18 million and 20 million, 11 = above 20 million). In this study, we hypothesize the income effect for KPL selection as a linear relationship. However, the relationship between income and KPL selection is complex. The purchasing behaviors of eco-vehicles are different between rich and poor people [10]. Additionally, previous study found rich and poor people have different types of income elasticity for gasoline use [16]. To consider these problems, we confirm the more complex effect of income for KPL selection by additional regression analysis. The regression results are shown in Appendix A. When a man decides the automotive vehicle type, he prefers other characteristics (horsepower, car body type, etc.) compared to the KPL. Family shows the number of family members. A household with a larger number of members is likely to purchase a larger car. The KPL of such a household car tends to decline because the car’s weight becomes heavier than that of a small car. Running is the running distance per year. High-use automotive vehicle users need to pay more for gasoline. Such respondents have more incentives to purchase an automotive vehicle with a higher KPL. Thus, the estimation coefficient of Running is expected to be positive.
Illusion is the variable used to capture the respondent’s cognitive ability in terms of actual fuel cost. As mentioned, each respondent answered six questions related to KPL. We defined Illusion as the number of questions answered correctly in the six questions. In summary, the maximum value of Illusion was 6. Additionally, the minimum value of Illusion was 0. Time is the variable used to capture the time preference of each respondent. This variable construct is based on the answers given in Table 2. If the respondent chooses option P until question 8, we can assume that the respondent is not patient (time discount rate is the highest). In contrast, if the respondent only chooses option P in question 1, we can judge that such a respondent is most patient (time discount rate is smallest). We define Time as the number of respondents choosing option P. The summary statistics of each variable are shown in Table 3.

3. Results

In this section, we show the questionnaire survey results. Section 3.1 summarizes the questioner survey results related to KPL selection and time preference. In Section 3.2 and Section 3.3, we reveal how much the KPL illusion affects the KPL selection of respondents’ cars by regression estimations.

3.1. Relationship between KPL Selection, KPL Illusion and Time Preference

We confirm the relationship between the KPL selection of respondents’ cars, the survey results of questions about the KPL illusion, and time preference. Table 4 shows the number of respondents based on the number of correct answers to the questions on the KPL illusion. In this table, the second column shows the number of respondents in each class of correct answers. The third column shows the average KPL of the respondent’s car in each class of the number of correct answers. If the respondent perfectly understands the relationship between KPL and the actual fuel cost, the number of correct answers is six. In contrast, if the respondent does not understand the relationship or only considers the difference of the KPLs, their correct answer is below 3.
The results demonstrate that the number of correct answers increases with a decrease in the actual KPL of the respondent’s car. This result implies that people who have misunderstood the relationship between KPL and actual fuel cost are likely to choose automotive vehicles with higher KPL. Additionally, Table 4 shows that only 25 percent of respondents responded with over four correct answers. The results imply that almost all Japanese consumers tend to misunderstand the relationship between actual fuel costs and KPL.
Second, we confirmed the relationship between time preference and KPL selection of respondents’ cars. Table 5 shows the number of respondents who chose option P in the survey question of time preference. Previous studies use the switching point option P to option Q as the measurement of time preference [17]. In our survey result, all respondents of our sample can switch from P to Q (All respondents chose option Q after switching from option P). If the respondent has a lower time discount rate, the respondent continues to choose option Q. Theoretically, a person who has a lower discount rate considers the importance of the future fuel cost. In contrast, a person with a higher discount rate does not think that it is essential for future costs. Therefore, we can assume that respondents who choose option Q tend to choose a higher KPL car.
However, Table 5 does not show a relationship between the respondents’ choice of questions on time preference and the KPL of the respondent’s car. Table 5 shows the number of respondents and the number who chose option P to the questions on the KPL illusion. This result implies that the respondents will face complex future costs of their automotive vehicles. The future cost of car ownership of the household is the future fuel and tax cost, such as tax for ownership. Previous studies have found that tax rebate-related car ownership affects automotive vehicles’ purchasing behavior in Japan [12,18]. Additionally, carmakers launch new cars considering the automotive vehicle’s tax system in Japan [19]. Therefore, respondents’ time preferences cannot show an apparent relationship with the KPL of the respondents’ cars.

3.2. Factor Analysis of KPL Selection of Respondents’ Automotive Vehicles

As mentioned, the summary results of the questionnaire survey imply that the KPL illusion affects the actual KPL selection of the car. Additionally, time preference may not affect KPL selection. Clearly, such a result does not control for other factors affecting the KPL selection of respondents. To confirm whether such factors affect the actual KPL selection, we employed a regression analysis. Table 6 shows the estimation results of Equation (1). In this estimation, we also evaluated the double logarithmic model to consider the distribution of the residuals.
First, we explain the result of the normal regression model (base model). The estimation results show that Income and Running are positively correlated with KPL. Normally, a household with sufficient income does not pay attention to the KPL of its own automotive vehicle. However, the coefficient of Income is positive. This result implies a market situation. In 2009, the Japanese government implemented an eco-car subsidy for diffusing energy-efficient automotive vehicles. Many respondents in our survey purchased a new car at this time. The subsidy for hybrid cars is higher than that for other fuel-efficient vehicles. However, the price of the hybrid car was still high at that time. Households with lower incomes could not choose a hybrid vehicle, as the price was too expensive even with subsidies. In contrast, high-income households could afford to buy hybrid cars in the eco-car subsidy period. Naturally, the KPL of a hybrid car is better than that of a conventional fuel vehicle. Therefore, Income shows a positive correlation with KPL.
The coefficients of Male and Family are significant and negative, implying that both factors decrease the actual KPL of the respondent’s auto vehicle. In contrast, the coefficient of Running is positive. In summary, high-auto vehicle users are likely to choose more fuel-efficient cars to save their money. Running cost is an important factor in choosing the car type for such users. In particular, some people usually use an automotive vehicle for their own business or for commuting to work. Therefore, such characteristics of a person or household tend to choose a higher KPL automotive vehicle.
Illusion was the most important variable in this study. The estimation result of the Illusion shows a negative coefficient with KPL selection. This result means that a person who misunderstands the relationship between KPL and actual fuel cost tends to choose a higher KPL car. The person who perfectly understands the relationship can answer all six questions correctly. The average number of questions answered correctly was 2.729 in this study; therefore, misunderstanding the KPL tends to result in a higher 4.324 km per L car than for people who understand. This result shows that many consumers may lose consumer surplus by the KPL display. While the MPG illusion may have a noticeable effect on market share, the welfare costs are less than four dollars per new vehicle sold in US [5]. In our sample, the share of people who perfectly answered questions of the KPL illusion was only approximately 1 percent. Almost no Japanese person could understand the relationship between KPL and actual fuel costs. Therefore, our results imply that the KPL display effect on consumer surplus in Japan is not small.
We find Time has no significant correlation with the dependent variable, although we control for other factors that affect an automotive vehicle’s KPL selection and purchasing behavior. Theoretically, time preference critically affects the purchasing behavior of durable goods that require energy consumption. As mentioned, the future cost of car ownership is complex. Thus, we cannot obtain a significant correlation between the answer condition of question capturing simple time preference and actual KPL selection. Another reason is our sample problem. Table 5 shows that 61 percent of respondents did not choose option P. In summary, many respondents had a low time preference. Other previous studies also show that Japanese people have a lower time preference than other countries. The distribution of time preference may be one reason why our regression results do not show a significant correlation between Time and KPL selection.
Second, we explain the result of the double logarithmic model. The estimation result shows that Income and Running have no significant correlation with KPL selection. One of the reasons that Income does not show a significant correlation with the dependent variable is the complex effect of income on KPL and car selections. In fact, Appendix A shows that Income may not have a linear relationship with KPL selection. The result of the double logarithmic model suggests the complexity of the income effect. In addition, the estimation result implies that Running has a complex effect on KPL selection. Generally, a person who uses their vehicle more in daily life wants to choose a more fuel-efficient vehicle. However, a person who likes to drive tends to choose a more powerful or sophisticated car, such as a sports car. These types of cars require lower KPL than other car types. Both types of people cars’ running lengths become longer than those of other people. Therefore, Running does not have a simple linear correlation with KPL selection. The most important finding is that Illusion shows a negative correlation with KPL selection. This result is in line with the estimation result of the normal regression model. Therefore, we can judge Illusion to have a robust negative correlation with KPL selection.

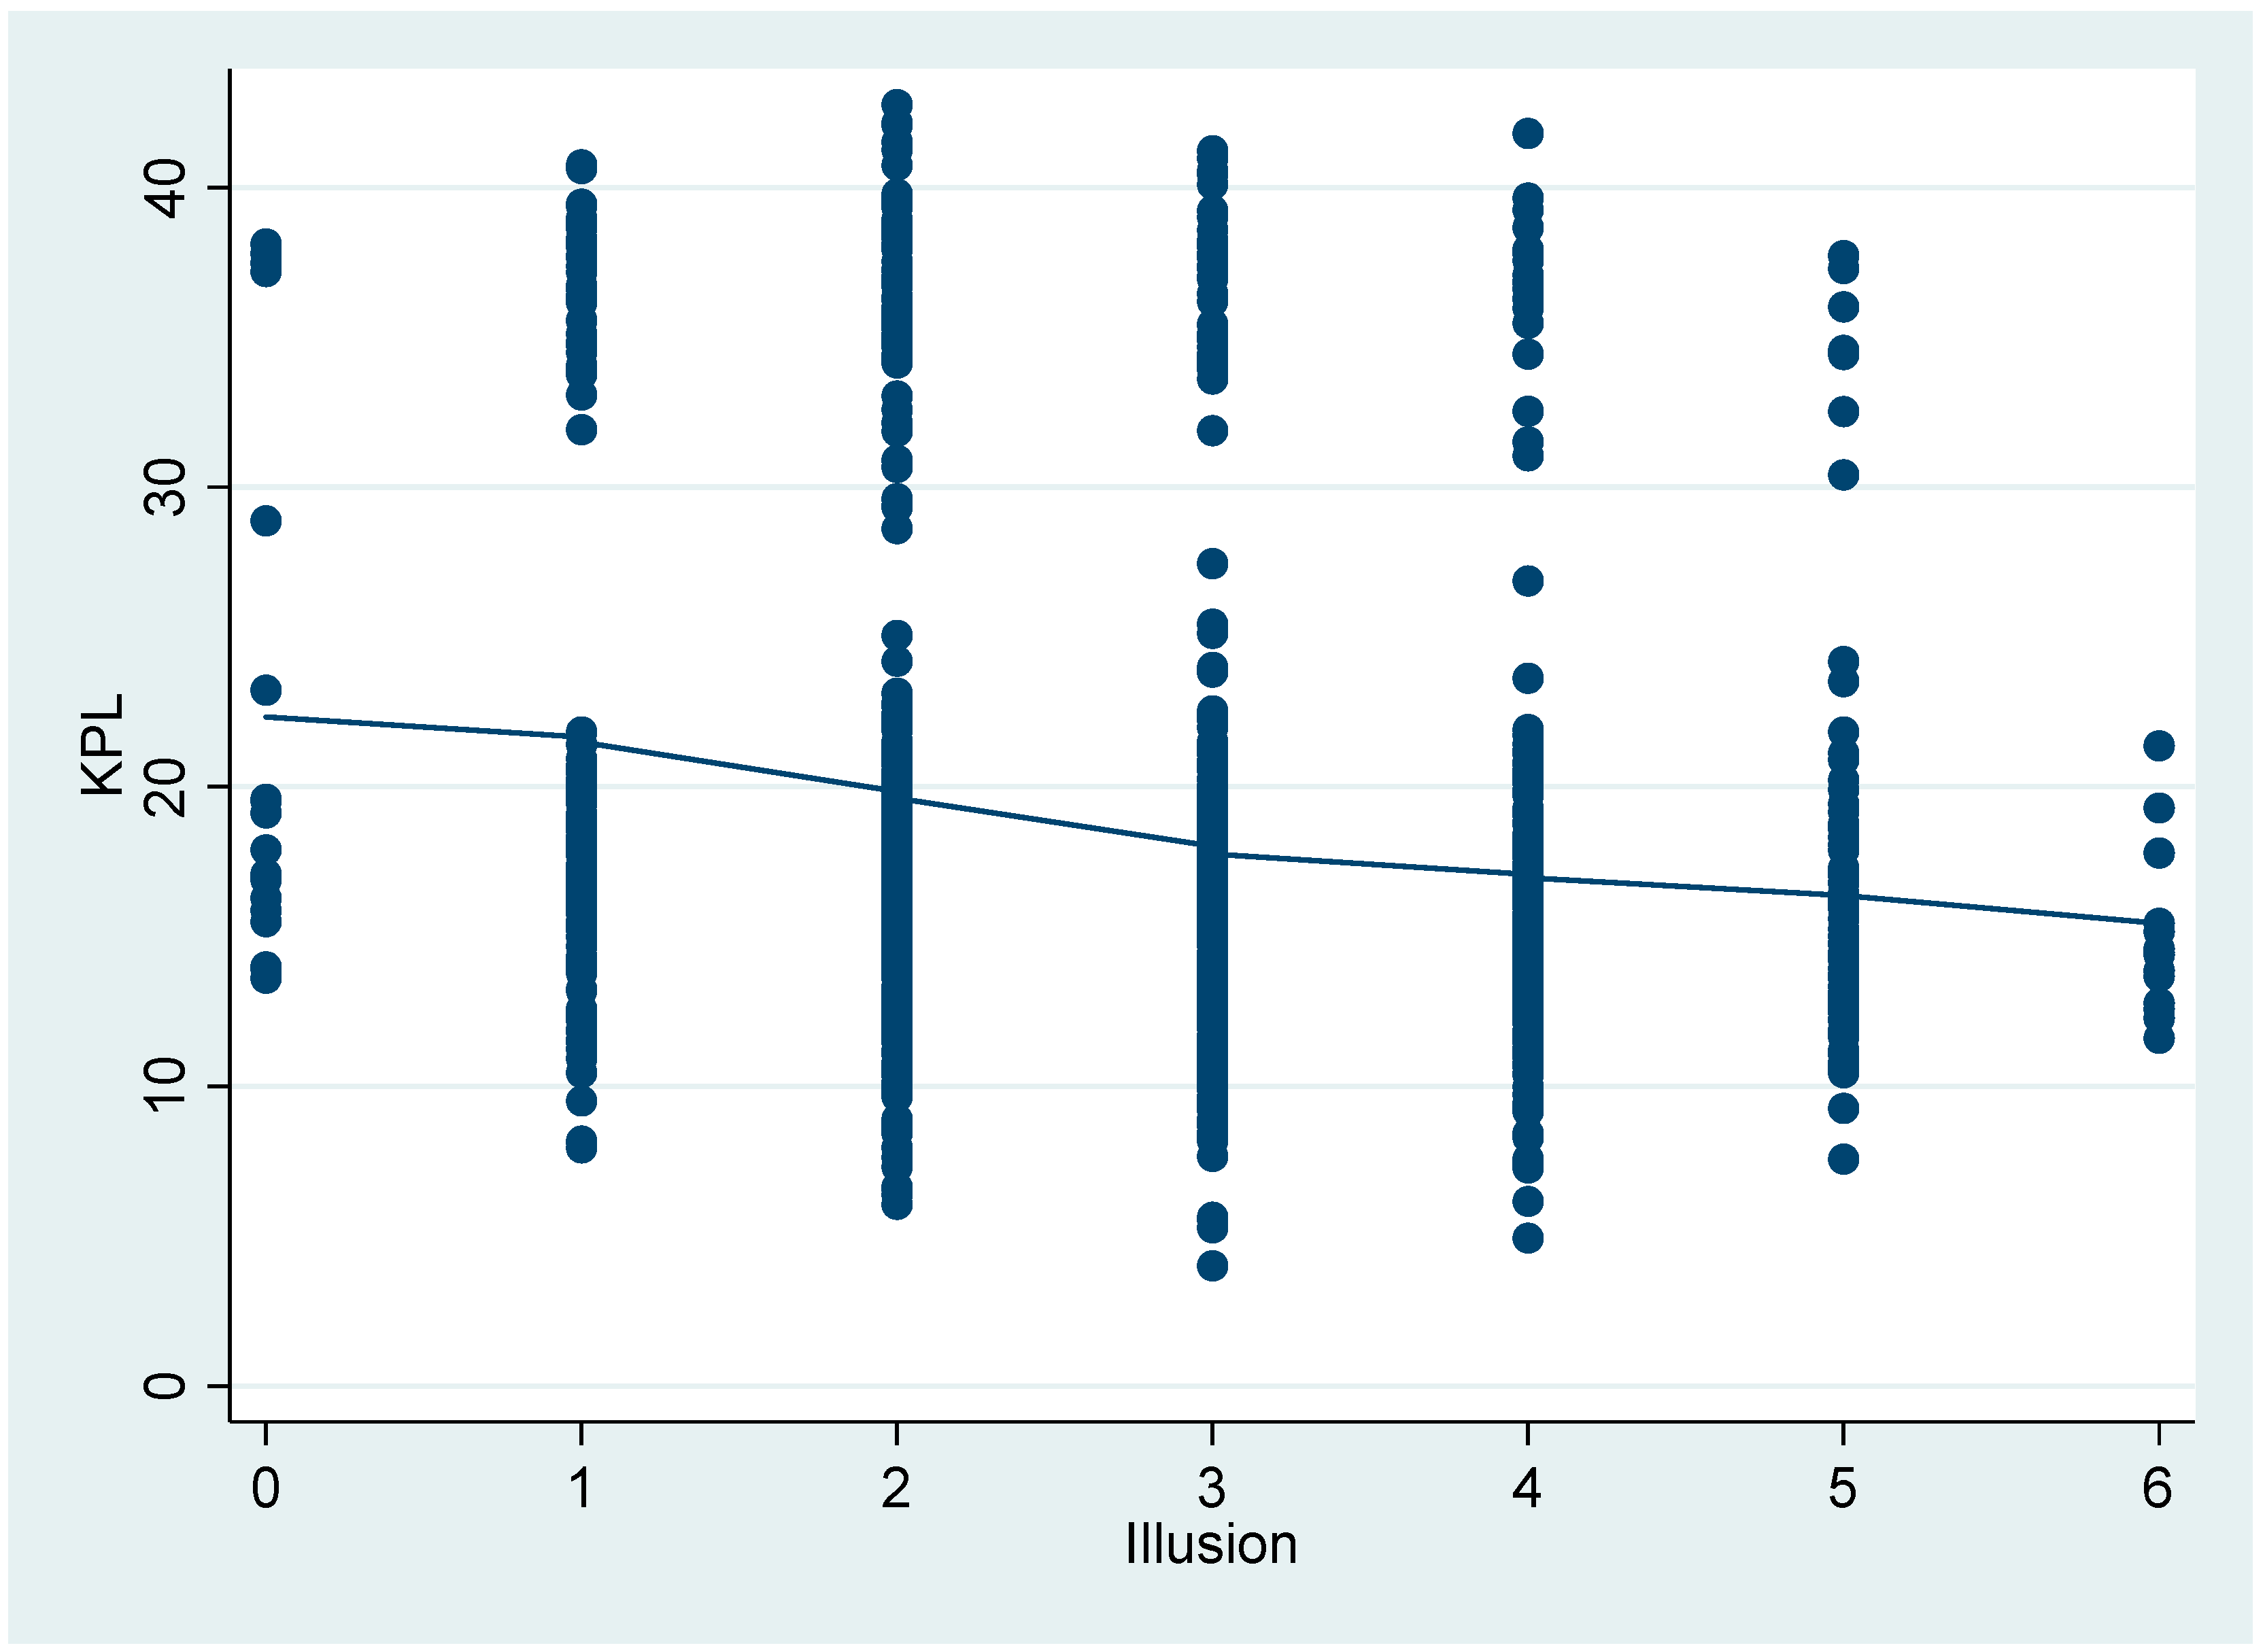
3.3. Robustness Check by Semiparametric Estimation

The factor analysis reveals the negative coefficient of Illusion on KPL. In the analysis of the previous section, our estimation model assumes that Illusion has a linear correlation with KPL. However, the relationship may be more complex. If the respondent only considers the gap in KPL as an index of future saving fuel cost, the respondent chooses at least two corrected answers in the survey. Therefore, Illusion may have a nonlinear correlation with KPL. To take this possibility into consideration, we conducted additional analysis with the assumption that the relationship between KPL and Illusion is nonlinear. For the analysis, we employed a partial linear regression model. The estimation model is defined as the following formulation (2). As shown in the formulation, the partial regression model consists of both linear and nonlinear parts.
K P L i = X β + f 1 I l l u s i o n i + ε i
X is a vector of explanatory variables (Income, Male, Running, and Time). β is a vector of parameter of explanation variables. This corresponds to linear component in the equation. f1(∙) is the nonparametric smooth function term of Illusion. In this estimation, the independent variables described as X are the same as those of the linear regression model.
Figure 2 graphically depicts the estimated results, where the nonlinear line represents the estimated relationship between KPL and Illusion by partial linear regression. This result shows that Illusion constantly negatively correlates with the dependent variable, although the effect is weak until the value of Illusion becomes 1. This result implies that our results of the linear regression model only has a small bias.

4. Discussion and Conclusions

This study examined how the MPG (KPL) illusion affected the actual MPG (KPL) of a car. First, we found that many Japanese consumers tend to misunderstand the relationship between KPL and actual fuel costs. Although Japanese consumers are more sensitive to KPL and fuel costs than US consumers, they do not understand the true relationship between KPL and fuel cost. These results imply that the KPL and MPG illusions are not US phenomena but may be global.
Second, the KPL illusion effect is not small in the Japanese automotive vehicle market. Our results show that those misunderstanding the KPL tended to choose a higher 4.324 km per L car than people who perfectly understood, on average. This finding means that the KPL illusion critically affects the KPL selection of consumers’ cars. Additionally, this finding implies that KPL illusions affect consumer surplus. The car market is large in many countries; certainly, in Japan, it is the same. Newly registered automotive vehicles in Japan totaled approximately 3.3 million in 2019 [20]. Therefore, it is necessary to discuss the actual future fuel costs of automotive vehicles and how they should be displayed.
In particular, automotive vehicles are one of the most important goods for the economy and energy use. In Japan, as much as 8.1% of the population worked in the automotive sector in 2018. The sector accounts for 15.8% of the 2018 total CO2 emissions. Many countries, including Japan, have implemented policies for diffusing eco-friendly vehicles. For example, tax rebates and subsidies for efficient fuel cars and hybrid vehicles are major policy tools for mitigating air pollution and CO2 emissions. Additionally, in Japan, a large-scale subsidy and tax rebate program was implemented in April 2009. Therefore, if the MPG illusion critically causes the irrational purchasing behavior of an automotive vehicle, the illusion may cause a large loss of consumer surplus and the environment. In fact, [5] shows that MPG illusions reduced consumer welfare by less than 4 US dollars per new automotive vehicle. Japan sold approximately 5.19 million new vehicles in 2019. If Japanese consumers suffer from the same amount of welfare loss by the KPL illusion as US consumers, their consumer loss could be approximately 20.78 million USD per year. In addition, irrational car choice can cause irrational energy use by driving. Although our results cannot reveal a direct loss of consumer surplus, the results also imply that the KPL illusion may affect consumer surplus in the Japanese car market. Additionally, the impact is not small. The KPL effect for car selection is an important issue for Japanese energy and economic policy.
However, we have some discussion points to analyze the social welfare change caused by the KPL illusion. Our results show that the KPL illusion encourages diffusion of more fuel-efficient vehicles and hybrid cars. Naturally, many consumers misunderstand future fuel costs. This situation may decrease consumer surplus. More rapid diffusion of fuel-efficient vehicles decreases CO2 and other air pollution emissions. Discussions on how to encourage rapid diffusion of low-carbon technology are important policy issues [21]. Environmental effects can be calculated as social benefits. Therefore, the effect must be analyzed further to discuss the social benefits and costs of the KPL and MPG illusions. The KPL and MPG illusion problems are simple information problems because we can easily change the display of KPL and MPG to LPK (L per kilometer) and GPM (gallon per mile). However, previous studies revealed that consumers do not change the purchasing behavior of automotive vehicles if they can receive appealing information about fuel economy standards [8]. We need to further investigate why people tend to misinterpret the future fuel costs of cars.
This study had some limitations. One of the limitations is sample bias. In this study, we had to omit the responses wherein respondents could not answer the car type. Normally, consumers can understand their automotive vehicle’s name, although they do not know the detailed car type. Therefore, our sample may include more respondents with detailed knowledge of an automotive vehicle (car lover) than the average population. However, our study’s important contribution is to establish the variable (illusion) to capture the extent of each respondent’s misperception of the relationship between KPL and actual fuel cost. Our results demonstrate that the variable has a significant correlation with the KPL selection of the respondent’s car. Normally, people who are quite knowledgeable about automotive vehicles can understand the relationship between the KPL and actual fuel cost. Our results imply that KPL illusions occur in such experts. This estimation result indicates that the effect of the KPL illusion may be more serious for the Japanese car market.
In the near future, the automotive vehicle market will dynamically change owing to the diffusion of electric and fuel cell vehicles. If this occurs, recognizing the cost and benefit of purchasing a new car becomes more difficult for the consumer. We thus need to prioritize the information problems affecting consumers and social surplus when choosing new energy-related durable goods.

Author Contributions

Conceptualization, K.T. and K.I.; methodology, K.T. and K.I.; software, K.T.; validation, K.T.; formal analysis, K.T.; investigation, K.T.; resources, S.M.; data curation, K.T.; writing—original draft preparation, K.T.; writing—review and editing, K.T. and K.I.; visualization, K.T.; supervision, K.T. and S.M.; project administration, K.T. and S.M.; funding acquisition, K.T., K.I. and S.M. All authors have read and agreed to the published version of the manuscript.

Funding

This research was funded by JSPS KAKENHI grant numbers JP18H03433, JP20H01504 and JP20H00648.

Institutional Review Board Statement

Not applicable.

Informed Consent Statement

Not applicable.

Data Availability Statement

The data presented in this study are available on request from the corresponding author. The data are not publicly available due to the agreement with respondents.

Conflicts of Interest

The authors declare no conflict of interest.

Appendix A. Confirmation of the Functional Form of the Income Effect

The relationship between income and dependent variable is more complex. If we capture the more complex effect of income, we need to add the regression model square term and cubic term of income. We confirm the fitting of other models that include square term and cubic term of Income to consider which the better functional form of income is. Our estimation results are shown in Table A1. The appendix is an optional section that can contain details and data supplemental to the main text—for example, explanations of experimental details that would disrupt the flow of the main text but nonetheless remain crucial to understanding and reproducing the research shown; figures of replicates for experiments of which representative data is shown in the main text can be added here if brief, or as Supplementary data. Mathematical proofs of results not central to the paper can be added as an appendix.
When we add the square term and cubic term of Income in our model, the fitting seemed to improve. However, the trends of all estimation results (coefficients of other independent variables and their significance) were almost the same.
Table A1. Additional factor analysis of automotive vehicle’s KPL.
Independent VariableModel 1
(Base Model)
Model 2Model 3
Income0.001 *−0.004 *−0.017 ***
(0.001)(0.001)(0.005)
Income2 2.35 × 10⁻⁶ **0.0001 ***
(9.47 × 10⁻⁷)(5.53 × 10⁻⁶)
Income3 −4.89 × 10⁻⁹ ***
(1.74 × 10⁻⁹)
Male−1.409 ***−1.335 ***−1.344 ***
(0.468)(0.468)(0.466)
Family−0.785 ***−0.731 ***−0.691 ***
(0.174)(0.175)(0.175)
Running0.166 *0.168 *0.175 *
(0.092)(0.092)(0.091)
Illusion−1.322 ***−1.326 ***−1.345 ***
(0.188)(0.188)(0.131)
Time0.1240.1180.119
(0.131)(0.131)(1.512))
c23.994 ***25.517 ***28.437 ***
(0.919)(1.104)(1.512)
R20.0590.0670.067
observation129812981298
Note: The values in parentheses are standard divisions. The superscripts ***, ** and * indicate statistical significance at the 1, 5 and 10 percent levels.

Appendix B. The Semiparametric Estimation Results (Linear Parametric Variables)

We show the estimated relationship between Illusion and KPL by semiparametric estimation in Figure 2. Figure 2 does not include the estimation result of other parametric independent variables. In this appendix, we show the estimation results of the other linear parametric variables in Table A2.
Table A2. Coefficient of linear parametric independent variables.
Independent VariableCoefficient
Income0.0030
(0.003)
Male−2.539 *
(1.349)
Family−0.573 *
(0.325)
Running0.253 *
(0.129)
Time0.301 *
(0.165)
R20.014
observation1297
Note: The values in parentheses are standard divisions. The superscript * indicate statistical significance at the 10 percent levels.

References

  1. Hausman, J.A. Individual discount rates and the purchase and utilization of energy-using durables. Bell J. Econ. 1979, 10, 33–54. [Google Scholar] [CrossRef]
  2. Dreyfus, M.K.; Viscusi, W.K. Rates of Time Preference and Consumer Valuations of Automobile Safety and Fuel Efficiency. J. Law Econ. 1995, 38, 79–105. [Google Scholar] [CrossRef]
  3. Gabaix, X. Behavioral inattention. In Handbook of Behavioral Economics: Applications and Foundations 2, 1st ed.; North-Holland: Amsterdam, The Netherlands, 2019. [Google Scholar]
  4. Jaffe, A.B.; Stavins, R.N. The energy paradox and the diffusion of conservation technology. Resour. Energy Econ. 1994, 16, 91–122. [Google Scholar] [CrossRef]
  5. Allcott, H. The Welfare Effects of Misperceived Product Costs: Data and Calibrations from the Automobile Market. Am. Econ. J. Econ. Policy 2013, 5, 30–66. [Google Scholar] [CrossRef]
  6. Mullainathan, S.; Schwartzstein, J.; Shleifer, A. Coarse thinking and persuasion. Q. J. Econ. 2008, 123, 577–619. [Google Scholar] [CrossRef] [Green Version]
  7. Larrick, R.P.; Soll, J.B. Economics. The MPG illusion. Science 2008, 320, 1593–1594. [Google Scholar] [CrossRef] [PubMed]
  8. Allcott, H.; Knittel, C. Are Consumers Poorly Informed about Fuel Economy? Evidence from Two Experiments. Am. Econ. J. Econ. Policy 2019, 11, 1–37. [Google Scholar] [CrossRef] [Green Version]
  9. Turrentine, T.S.; Kurani, K.S. Car buyers and fuel economy? Energy Policy 2007, 35, 1213–1223. [Google Scholar] [CrossRef] [Green Version]
  10. Levinson, A.; Sager, L. Who Values Future Energy Savings? Evidence from American Drivers; No. w28219; National Bureau of Economic Research: Cambridge, MA, USA, 2020. [Google Scholar]
  11. Allcott, H. Consumers’ perceptions and misperceptions of energy costs. Am. Econ. Rev. 2011, 101, 98–104. [Google Scholar] [CrossRef] [Green Version]
  12. Tanaka, K.; Managi, S. Ecological Friendly Transportation: Cost of Subsidy and Tax Reduction Scheme. In The Economics of Green Growth; Managi, S., Ed.; Routledge: New York, NY, USA, 2015. [Google Scholar]
  13. Japan Automobile Manufacturers Association. Passenger Car Market Trends. 2019. Available online: https://www.jama.or.jp/lib/invest_analysis/pdf/2019PassengerCars.pdf (accessed on 9 April 2021).
  14. Frederick, S.; Loewenstein, G.; O’Donoghue, T. Time discounting and time preference: A critical review. J. Econ. Lit. 2002, 40, 351–401. [Google Scholar] [CrossRef]
  15. Society of Automobile Engineers of Japan. Specification Sheet of Automobile; Publication division of Society of automobile engineers of Japan: Tokyo, Japan, 2010. [Google Scholar]
  16. Schmalensee, R.; Stoker, T.M. Household gasoline demand in the United States. Econometrica 1999, 67, 645–662. [Google Scholar] [CrossRef] [Green Version]
  17. Tanaka, T.; Camerer, C.F.; Nguyen, Q. Risk and time preferences: Linking experimental and household survey data from Vietnam. Am. Econ. Rev. 2010, 100, 557–571. [Google Scholar] [CrossRef] [Green Version]
  18. Konishi, Y.; Zhao, M. Can green car taxes restore efficiency? Evidence from the Japanese new car market. J. Assoc. Environ. Resour. Econ. 2017, 4, 51–87. [Google Scholar] [CrossRef] [Green Version]
  19. Ito, K.; Sallee, J.M. The economics of attribute-based regulation: Theory and evidence from fuel economy standards. Rev. Econ. Stat. 2018, 100, 319–336. [Google Scholar] [CrossRef] [Green Version]
  20. Japan Automobile Dealers Association. Statistics Data. 2020. Available online: http://www.jada.or.jp/data/ (accessed on 23 October 2020).
  21. Tanaka, K.; Sekito, M.; Managi, S.; Kaneko, S.; Rai, V. Decision-making governance for purchases of solar photovoltaic systems in Japan. Energy Policy 2017, 111, 75–84. [Google Scholar] [CrossRef]
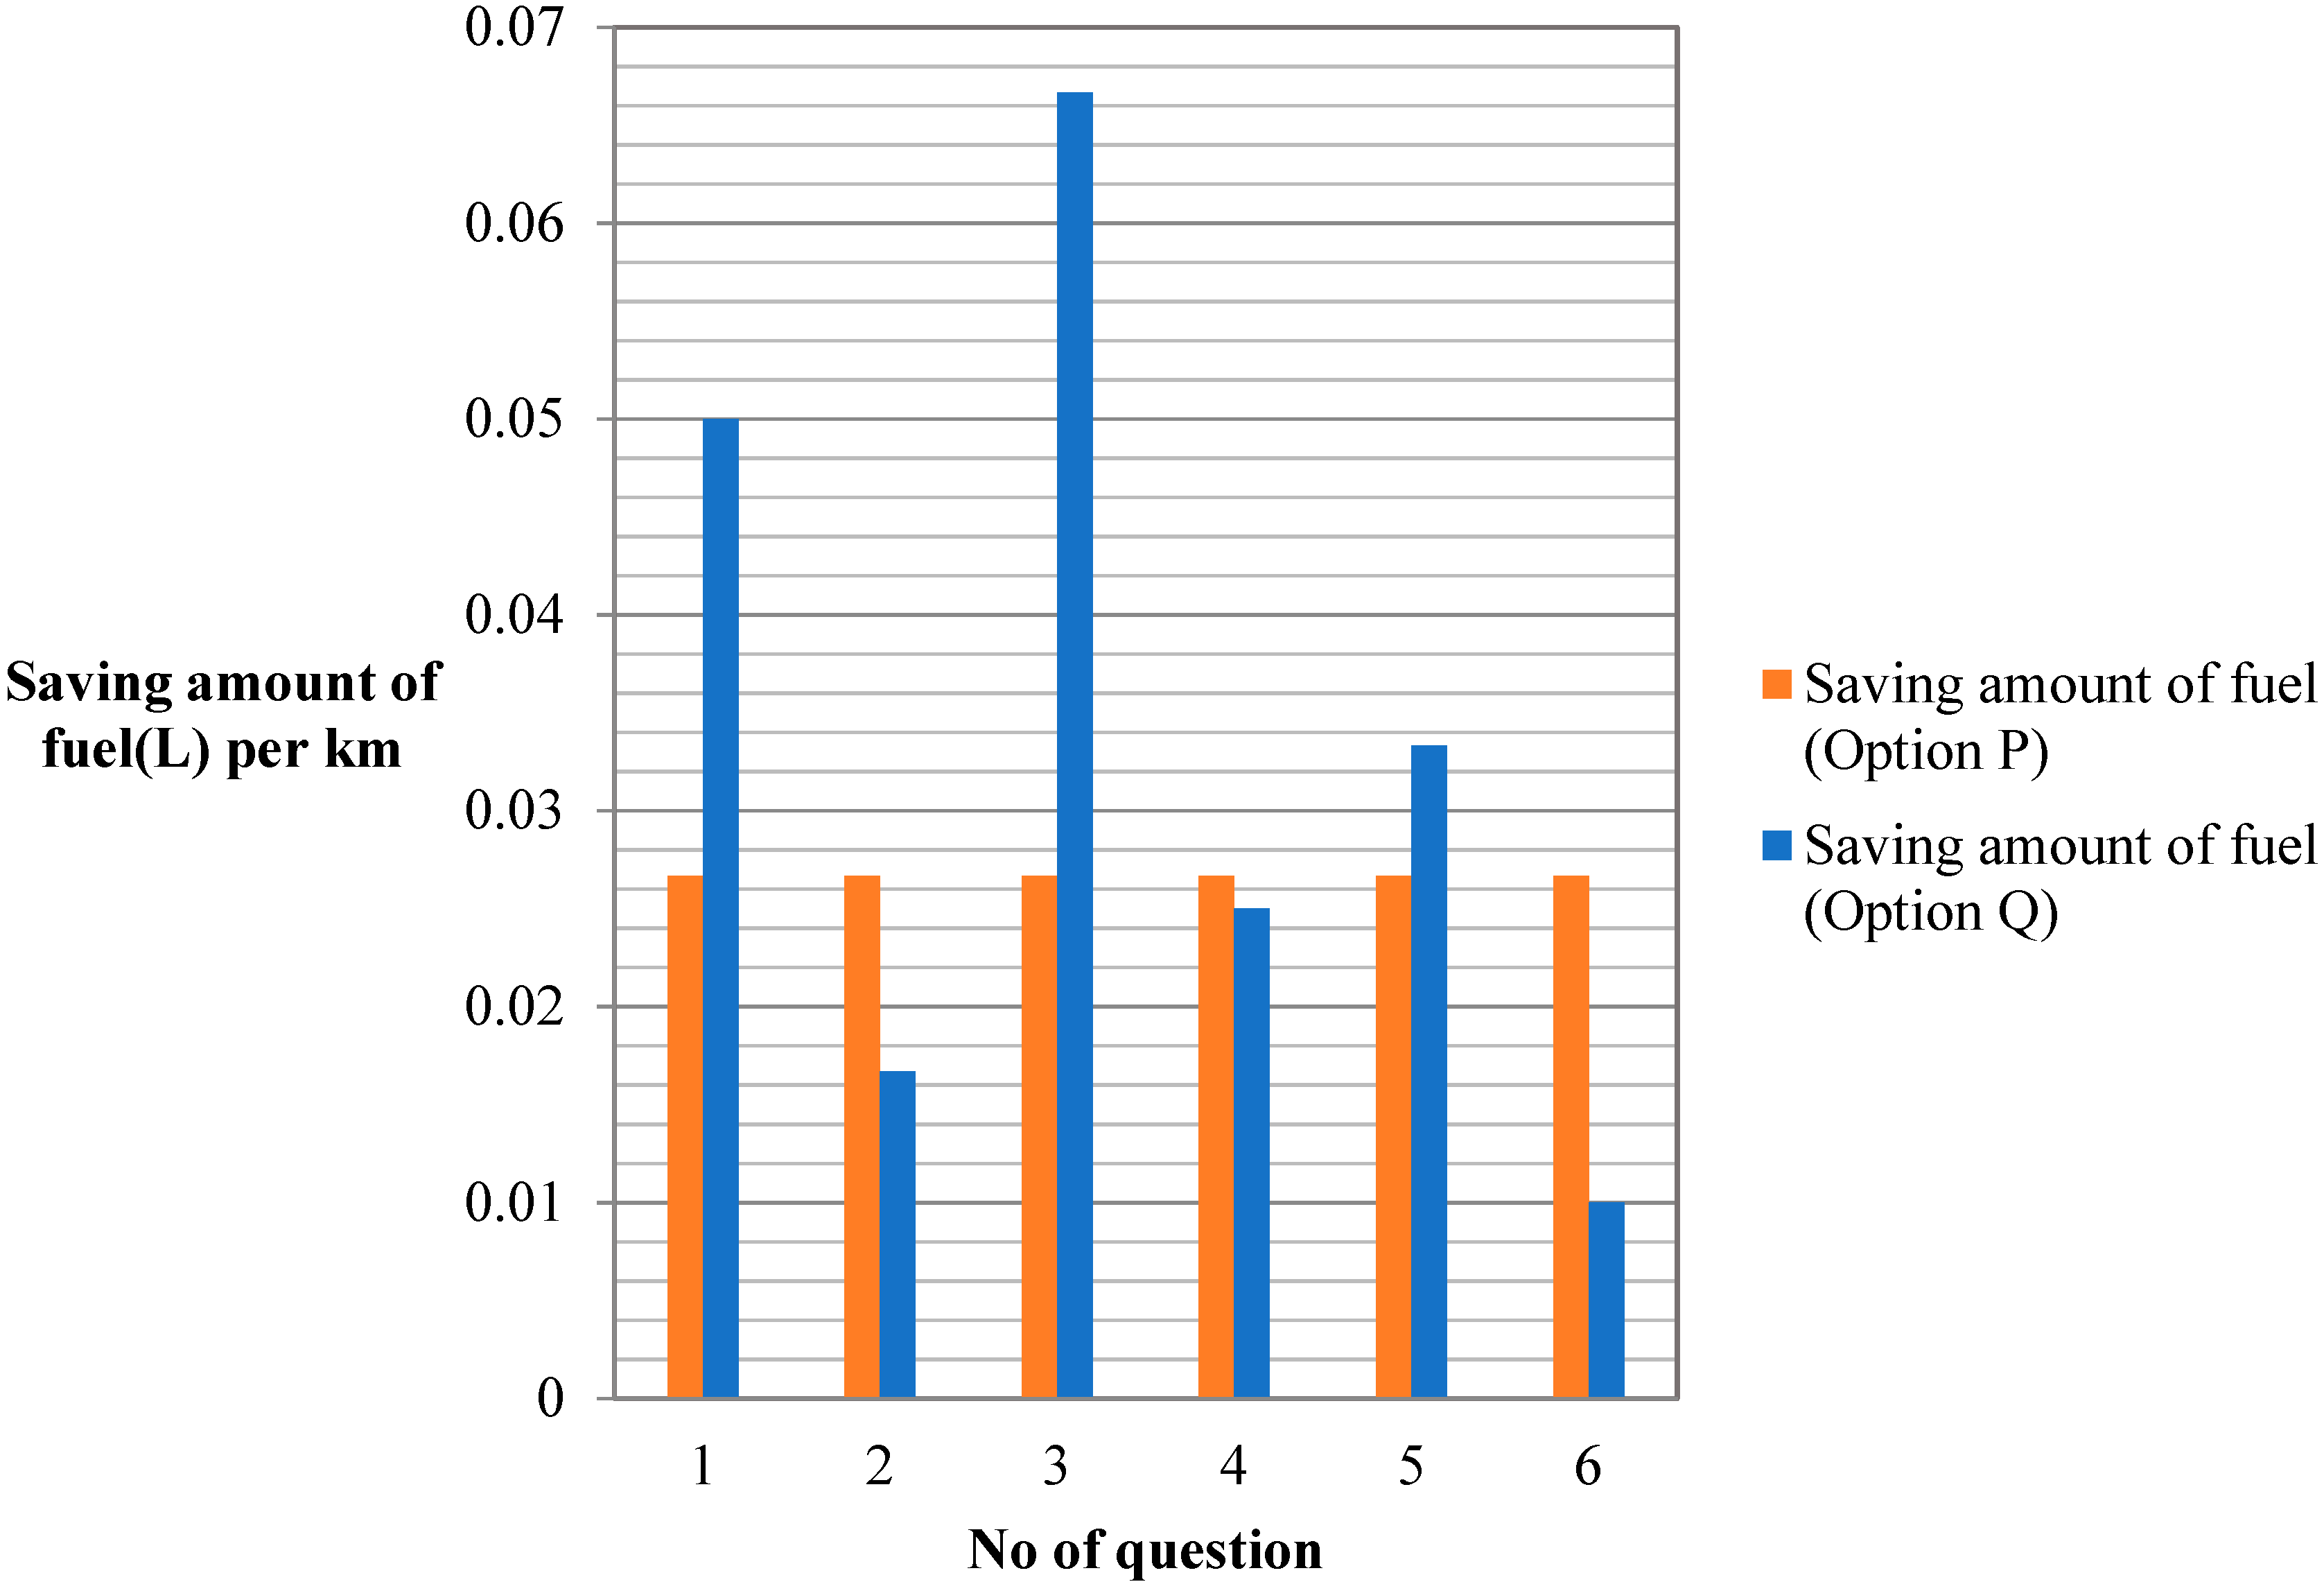
Figure 1. Saving amount of fuel (L) per km in each question and option.
Energies 14 07294 g001
Figure 2. Semiparametric estimation result. Note: A model fit test, which compares the deviation between the full model and the model without smooth term, shows significant value. (significant at 0.5% level). For the sake of saving space, the estimation results of the other linear parametric variables are shown in Appendix B.
Energies 14 07294 g002
Table 1. Questions to measure the MPG (KPL) illusion.
OptionPQ
No of QuestionNowAfter UpgradeNowAfter Upgrade
115 km/L25 km/L10 km/L20 km/L
215 km/L25 km/L20 km/L30 km/L
315 km/L25 km/L10 km/L30 km/L
415 km/L25 km/L20 km/L40 km/L
515 km/L25 km/L10 km/L15 km/L
615 km/L25 km/L20 km/L25 km/L
Table 2. Questions to measure the time preference.
No of QuestionP (Tomorrow)Q (15 Days after)
1100,000 JP yen100,000 JP yen
2100,000 JP yen101,000 JP yen
3100,000 JP yen102,000 JP yen
4100,000 JP yen105,000 JP yen
5100,000 JP yen110,000 JP yen
6100,000 JP yen140,000 JP yen
7100,000 JP yen170,000 JP yen
8100,000 JP yen200,000 JP yen
Table 3. Summary statistics of each variable.
VariableMeanStd. Dev.MinMax
KPL18.5978.1187.140
Male0.65490.475601
Income711.248387.7421002100
Family3.1291.31118
Running4.4072.400111
Illusion2.7291.17006
Time1.0701.68107
Table 4. The survey result of questions about KPL illusion.
The Number of Correct AnswersThe Number of RespondentsAverage KPL of Respondent’s Car
02322.176
116321.779
249319.730
339517.664
425417.009
58916.360
61514.637
Average KPL of all respondents18.687
Note: Total observation is 1432.
Table 5. The survey results for questions about time preference.
The Number of Choice Option PThe Number of RespondentsAverage KPL of Respondent’s Car
187618.629
210319.140
318918.881
411617.900
57318.909
62720.265
71714.283
83121.103
Average KPL of all respondents18.687
Note: Total observation is 1432.
Table 6. Factor analysis of auto vehicle’s KPL.
Independent VariableBase ModelLogarithmic Model
Income0.001 *−0.014
(0.001)(−0.019)
Male−1.409 ***−0.087 ***
(0.468)(0.021)
Family−0.785 ***−0.084 ***
(0.174)(0.023)
Running0.166 *0.012
(0.092)(0.017)
Illusion−1.322 ***−0.164 ***
(0.188)(0.022)
Time0.124-
(0.131)
c23.994 ***3.217 ***
(0.919)(0.117)
R20.0590.066
observation12981279
Note: The values in parentheses are standard divisions. The superscripts *** and * indicate statistical significance at the 1 and 10 percent levels.
Publisher’s Note: MDPI stays neutral with regard to jurisdictional claims in published maps and institutional affiliations.

