Abstract
Energy efficiency (EE) is of great concern in cognitive radio networks since the throughput and energy consumption of secondary users (SUs) vary with the sensing time. However, the conditions of the detection probability and false alarm probability should be respected to better protect primary users (PUs) and to improve the sensing performance of SUs. Additionally, the PUs’ minimum averaged power provision should also be regarded as a key problem of interactive linking to SUs. Therefore, an integrated design between the PU and SUs is desired for the coordination of the whole cognitive radio system, especially regarding the satisfaction of EE and performance metrics. This study formulates sensing constraints in a unified way and calculates the minimum SNR of SUs, based on which the essential PU power provision is computed. Furthermore, EE is proved as a decreasing function with the PU’s active ratio, where the maximum EE is obtained corresponding to the minimum QoS requirements of the sensing process. Hence, a bisection-based method is proposed to maximize EE, which is considered as a concave function of SUs’ sensing time and has only one unique optimum. EE’s optimization was analyzed under different fusion rules for diverse SNR conditions. The optimum was also studied with sensing performance targets for various cases of PU power provision.
1. Introduction
The rapid increase in the diversity of communication applications and services has brought great challenges for efficient spectrum exploitation. As the core technique of cognitive radio, spectrum sensing is proposed to improve the spectrum efficiency using spectrum band sharing. In a cognitive radio network, secondary users (SUs) periodically detect the presence of a primary user (PU) and transmit data during the spectrum hole of the PU. The sensing technique, however, requires high detection performance [1,2,3] and good coordination between the PU and SUs [3,4]. Besides, the energy efficiency (EE) of cognitive radio networks (CRNs) has attracted a great deal of research attention recently, especially in the context of the tradeoff of sensing and the transmission time ratio [5,6,7,8,9,10,11,12,13,14,15,16]. Since the PU and SUs share the same spectrum band, the analysis of their transmission powers becomes a critical issue in CRNs. The transmission powers of the PU and SUs have a significant influence not only on EE but also on the sensing performance. In addition, EE and sensing performance are also interconnected, and the sensing metrics and thresholds must be strictly respected while designing the CRN system with the aim of achieving a higher EE. Regarding this complex optimization problem, more detailed analyses of a PU’s transmission power and its influences on SUs’ sensing and transmission phases are presented in Section 1 by referring to some recently proposed methods [17,18,19,20,21,22,23,24,25,26,27,28,29,30,31,32,33,34,35]. Table 1 lists some common abbreviations that are used in this paper.

Table 1.
Explanations for the abbreviations used in this paper.
Although these studies have made contributions to the active/sleep symptoms of a PU, to the best of our knowledge, only a few studies have investigated the activities of a PU aiming at the maximization of the global EE (i.e., for both the PU and SUs) in CRNs, not to mention modeling PU’s transmission power as EE constraints on the provision sensing performance of SUs. In addition, the probability of reawakening PU traffic is not the only aspect of the activities of a PU that should be considered in the performance metrics and throughput of CRNs. More importantly, the distribution of a PU’s idle/active states contributes to very different sensing results.
Figure 1 presents an example of the sensing process under different conditions of PU presence probabilities. In this figure, the blue blocks of the PU denote the presence of the PU, while white blocks denote its absences; for SUs, the blue and white blocks denote the related sensing results of “0” and “1”, respectively. When there is a sparse presence, as in PU1, the spectrum band is more available, which makes the transmission of SUs easier to access. Otherwise, when the PU presents frequently as PU2, the received SNR at SUs’ side becomes easier to detect. Therefore, the false alarm probability (i.e., the letter “F” in Figure 1) can be better controlled than in the sparse presence case under the same target detection probability condition. Although the access of transmission (i.e., the letter “T” in Figure 1) is limited, the spectrum sensing is more efficient; thus, the EE is also improved. These two situations should be considered in parallel, and the activities of the PU should be adapted to an optimum where sensing performance and opportunistic access are both guaranteed.
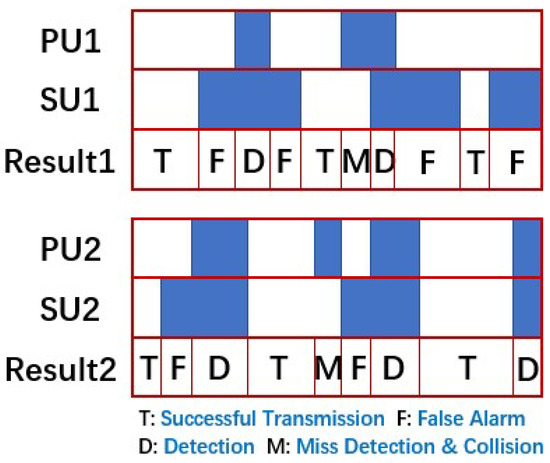
Figure 1.
Impacts of different PU activities on sensing results.
In this context, the PU’s activity is designed towards an interactive behavior of SU access. On the one hand, given a fixed probability of PU’s presence, SUs are able to optimize EE by finding their most suitable sensing ratio. On the other hand, the PU’s activity has critical impacts on EE. In our study, the overall EE of both the PU and SUs is studied, and the relation between EE and the PU’s presence is especially analyzed. We prove that a maximized EE is subject to a sparse presence of a PU, similar to the PU1 case in Figure 1, where the assumption of free access is admitted as a principal impact, rather than the advantage of the false alarm probabilities of PU2. Nevertheless, the design of the PU is subject to certain constraints in order to obtain sufficient sensing performance at all times. According to these key challenges, a PU-related EE optimization model is proposed.
We assume a scenario in which several PUs with different QoS (i.e., quality of service) requirements are present in an alternate way with different sleep/reactivate ratios. Since the spectrum band is shared among the PU and SUs, the reuse of the spectrum is strongly related to the PU’s presence characteristics, which determine whether sufficient networks resources are left for other SUs in the same CR network. The SUs’ QoS and EE targets both require SUs to make the most of their opportunistic accesses and to avoid occupying the band when PUs are present. In our study, the multidimensional relation between PU presence, SU performance metrics, and EE are jointly analyzed and demonstrated mathematically, based on which we apply the optimization methods to achieve the appropriate range of PU presence ratios where SUs can achieve opportunistic access without interfering with each other. This method is aimed at optimizing the EE of a target CR network without losing detection accuracy.
The main contributions of this study are as follows:
- (1)
- It analyzes the required lower boundary of PU presence probability to achieve adequate sensing performance by solving a quadratic equation at the minimum condition of SNR received at the SUs;
- (2)
- It formulates the EE as a constrained three-dimensional optimization problem and adopts the bisection search algorithm to find the optimized solutions at the lower bound of the PU’s periodical presence ratio range, defined by the PU’s reactivation ratio.
The rest of this study is organized as follows. In Section 2, the recent contributions in this domain are presented. In Section 3, the system model of PU–SU spectrum sensing is analyzed by investigating multiple situations. Section 4 provides detailed proofs to testify the feasibility of achieving an optimized solution of EE under boundary conditions, based on which we present our bisection search algorithm. Finally, simulation results are presented in Section 5, and Section 6 presents our conclusion.
2. Literature Analysis
In the literature, recent works have mainly proposed new spectrum sensing techniques or models and optimized the EE or the sensing performances adaptively. O. H. Toma et al. [17] proposed a comprehensive spectrum sensing model in which a PU’s channel statistics under imperfect spectrum sensing are notably analyzed and compared with original statistics. By defining closed-form expressions based on realistic spectrum scenarios, the authors proposed a set of estimators to approximate the PU’s activity statistics in the presence of sensing errors. However, although the study provided considerable statistical analysis to overcome the degradation of performance during the sensing period, it mainly focused on sensing performance metrics and channel state changes, and the transmission power was not discussed in detail, not to mention the EE. The authors of [18] provided a CoMAC-based spectrum sensing approach and proposed to solve the non-convex EE optimization problem by minimizing the average energy consumption. The sensing thresholds and the golden decision threshold were jointly analyzed in order to define the boundary conditions of sensing performances. More importantly, the authors pointed out that the sensing time optimization is the key issue for improving the sensing performance. They also mentioned that the SUs’ detection accuracy is subject to the average sustainable transmission power of the PU. In [19], B. Soni et al. adopted a long short-term memory (LTSM)-based spectrum sensing model: a deep learning-based method to extract explicit features by constructing and training the spectrum dataset. Besides, the authors analyzed the PU statistics including active/sleep period duration and duty cycle, based on which the overall sensing performance is further improved.
Several works have contributed to EE formulations in CRN systems. Some classic works [3,4] proposed the allocation of a suitable sensing time for SUs to achieve the optimization of the EE function, whereas other recent studies [18,20] defined EE as throughput per unit of energy consumption (i.e., unity: bit/Hz/Joule). Then, they took the number of SUs into consideration [18] and adapted either the optimal rule threshold of fusion or the optimal energy detector threshold [20] to further improve the performances. The authors of [1,6] studied the sensing–EE tradeoff. The sensing and transmission durations were adjusted to the balanced conditions while ensuring the PU’s detection probability at the same time. These studies aimed to reduce the interference risks between a PU and SUs and to avoid greedy accesses by SUs. The authors of [7] aimed to proportionally deduct the penalty of miss detection and the SUs’ energy cost from the positive throughput gain in order to form a reasonable weighted utility function. Afterwards, they optimized this utility function and found the equilibrium by performing cooperative spectrum sensing. However, the authors did not clarify how to select the weights for the three parts of the unity function, and the definition of utility was purely empirical where persuasive mathematical demonstrations were still lacking. In a recent study [14], O. I. Khalaf et al. employed the look-up table with rapidly updated access as a sensing database for SUs to work in a cooperative way, where the reporting time can be shortened in comparison with traditional techniques. Moreover, the authors proposed a fuzzy selection scheme to switch SUs’ harvested energy states between their main power source and residential energy, depending on the total energy cost during their sensing and transmission periods. Furthermore, the partial derivatives of EE to transmission power and to sensing time were both calculated mathematically, and the corresponding optimal solutions were analyzed. This study also mentioned the PU transmission power constraints and the influence on SE (i.e., spectrum efficiency) and EE. Nevertheless, the main contribution of the study is the look-up table under the energy-harvesting concept; both of these two novelties are related to SUs. The authors only considered the SNR from the PU’s side, instead of defining EE and its boundary conditions according to the PU’s activity statistics and its transmission power. In our study, we reinforce the study of the relation between the PU’s activity and optimization of EE.
A large number of studies have studied the impact of the PU’s and SUs’ transmission power on the optimization of EE. As we know, EE in the CRN system is basically defined as the throughput per unit energy consumption (i.e., on both the PU and SUs), and the transmission power refers to the energy consumption per unit time. The authors of [3] proved that EE is a concave function with respect to the transmission power, that an optimum always exists on the power axis, and that the optimum can be obtained by an iterative bisection search. Other contributions applied a golden section method to select an optimal sensing time ratio [21,22] and also to jointly determine the optimal transmission power allocation [21]. In addition, the authors of [1,23] investigated the PU’s activities, especially towards the probability of the reactivation of the PU during SUs’ transmission period, which might bring about additional collision risks between PU and SUs. A PU’s frequent reactivation should be noticed in practice, as the system throughput and EE might be directly influenced by this issue. More precisely, as the PU signal is usually modeled as a circularly symmetric complex Gaussian (CSCG) signal and the PU’s active/sleep durations are considered as independent and identically distributed random variables [24], the range of the PU’s reawake probability should be approximated in advance by statistical analysis [17] to prevent the network performance and QoS from being degraded. Other existing studies (e.g., [25,26]) have focused on the dynamic optimization of the energy detector threshold to make appropriate decisions regarding the PU’s signal and to lower the overall sensing error rate.
In addition, PU protection and SNR provisioning were recently studied in [2,3,17,27,28,29] by setting a lower bound for the detection probability to ensure the sensing accuracy. Other objective functions such as throughput, EE, SE, etc., are analyzed under the sensing performance constraints. Y. Wang et al. [30] presented opportunistic access schemes to protect a PU during the SUs’ transmission phase without degrading the SUs’ QoS. The authors of a recent article [31] calculated the peak transmission power of SUs and secondary relays given a PU’s interference threshold; they also considered the power allocation strategies according to the secrecy outage constraints. However, this study did not formulate EE or throughput with these constraints. The coordination between the PU and SUs with the detection accuracy targets remains the major concern of CRNs and deserves to be analyzed with the power constraints, instead of only considering the secrecy outage probability as the performance metrics. W. Zhang et al. [32] proposed a CSMA/CA-based method on a MAC layer to dynamically calculate the back-off time by supervising the channel states. Moreover, NSS (normal spectrum sensing) and FSS (fast spectrum sensing) were alternatively applied before and after the channel contention period in order to identify the available idle states on the primary channel and to detect the PU’s return for collision avoidance, respectively. However, the proposed method still needs to consider the additional expenditure of the packets’ headers on the MAC layer. The authors of [33] implemented network coding techniques and determined the average packet delays of the PU and SUs without knowing the channel statistics and packet arrival rates. Then, the authors improved the stable throughput region by the coordination of the PU and SUs. A. Bhowmick et al. [34] proposed a PU prediction framework under collision constraints. The authors applied an estimated noise power (ENP)-based energy detection (ED) scheme to take over the conventional ED schemes in order to improve the throughput. Moreover, they pointed out that the increasing cooperative sensing efforts can compensate the miss predictions of the PU’s transmission power in order to achieve the ideal network performance. Furthermore, some other previous works [35,36] investigated the power allocation schemes in an OFDMA-based CRN system under a PU’s rate loss constraints and tolerable interference constraints, respectively. By assigning an optimal number of unused subcarriers, these methods provided reinforced PU protection during the SUs’ transmission period, without any degradations of network performances (e.g., throughput).
In conclusion, the analysis of the tradeoff between sensing performance and EE has become a major development trend in cognitive radio systems. To guarantee the sensing performance, the boundary conditions of the sensing duration ratio are studied in the literature according to the activity of a PU. To improve EE, the transmission power should be adapted to ensure enough transmission time for SUs and to avoid collisions between the PU and SUs. In this study, we consider both ends of this tradeoff, especially with the impact of a PU’s dynamic activity. Unlike the classic studies [3,4] which modeled the EE according to the optimal sensing time and the number of SUs, our study proposes to model the global EE of CRNs with the transmission power constraints for both the PU and SUs. In this way, EE can be modeled precisely in an integrated CRNs system, without ignoring the PU’s transmission power analysis, which can be very decisive for the sensing performance.
3. System Model
We consider a CRN with one PU and N SUs. SUs are assumed to be homogeneous users that have a similar distance to the PU, and a similar averaged SNR (denoted by γ) is assumed to be received at the SU side during the PU’s active state. The signals of the PU and SUs are both considered as independent white Gaussian signals, and the interference of the PU’s circuit power is ignorable (i.e., compared with white Gaussian noise) by an SU during the PU’s idle state. In order to provide sufficient sensing performance, the received SNR γ is particularly defined to guarantee the detection of a PU’s presence and to prevent SUs from collisions caused by miss detection. Apart from γ, which is transmitted by the PU and received at the SU side, it should also be noted that the data rate is calculated based on the SUs’ SNR during data transmission, which is relevant to the transmitted power of an SU.
During the sensing process, SUs take turns to perform sensing by listening to the PU’s signal. Let us denote by that the PU is available, which means that SUs are accessible, and indicates that the PU is present, meaning the band is too busy to be reutilized by SUs. The relative probabilities of the PU staying at and states are denoted as ,, respectively. An SU can only access the channel for its own transmission when the PU is detected to be in the state. Each SU takes an individual decision by comparing the received signal power to an energy detector threshold ξ, as presented in Section 3.2.
We denote = 1, 2, …, as the number of sensing samples. The main error risks in CRN are expressed in two aspects: (1) a false alarm describes that SU receives 1 and falls into sleep while the channel is actually available (state 0), which leads to spectrum waste; (2) miss detection indicates that SU receives 0 and starts transmission while the channel is occupied by PU, which increases the probability of a collision between the PU and SUs. Given the sensing time ratio and sampling rate , according to [37,38], the individual false alarm and miss detection probabilities are approximated in (1) and (2) when the number of samples is approaching infinity:
where Q(x) is the complementary distributed Gaussian standard function defined by . The individual sensing results are generalized by the fusion center (FC) which stores the fusion rules and makes a conclusive decision for all SUs. In this study, the k-out-of-N rule is applied: the FC requires at least k positive decisions to be received from N SUs to make a final decision that the PU is present. Then, the general probabilities [22] of false alarm and miss detection under the k-out-of-N rule are computed as in (3) and (4):
3.1. Energy Efficiency Analysis
To study the energy efficiency of CRN, the cooperative sensing model is divided into four cases where and are jointly considered:
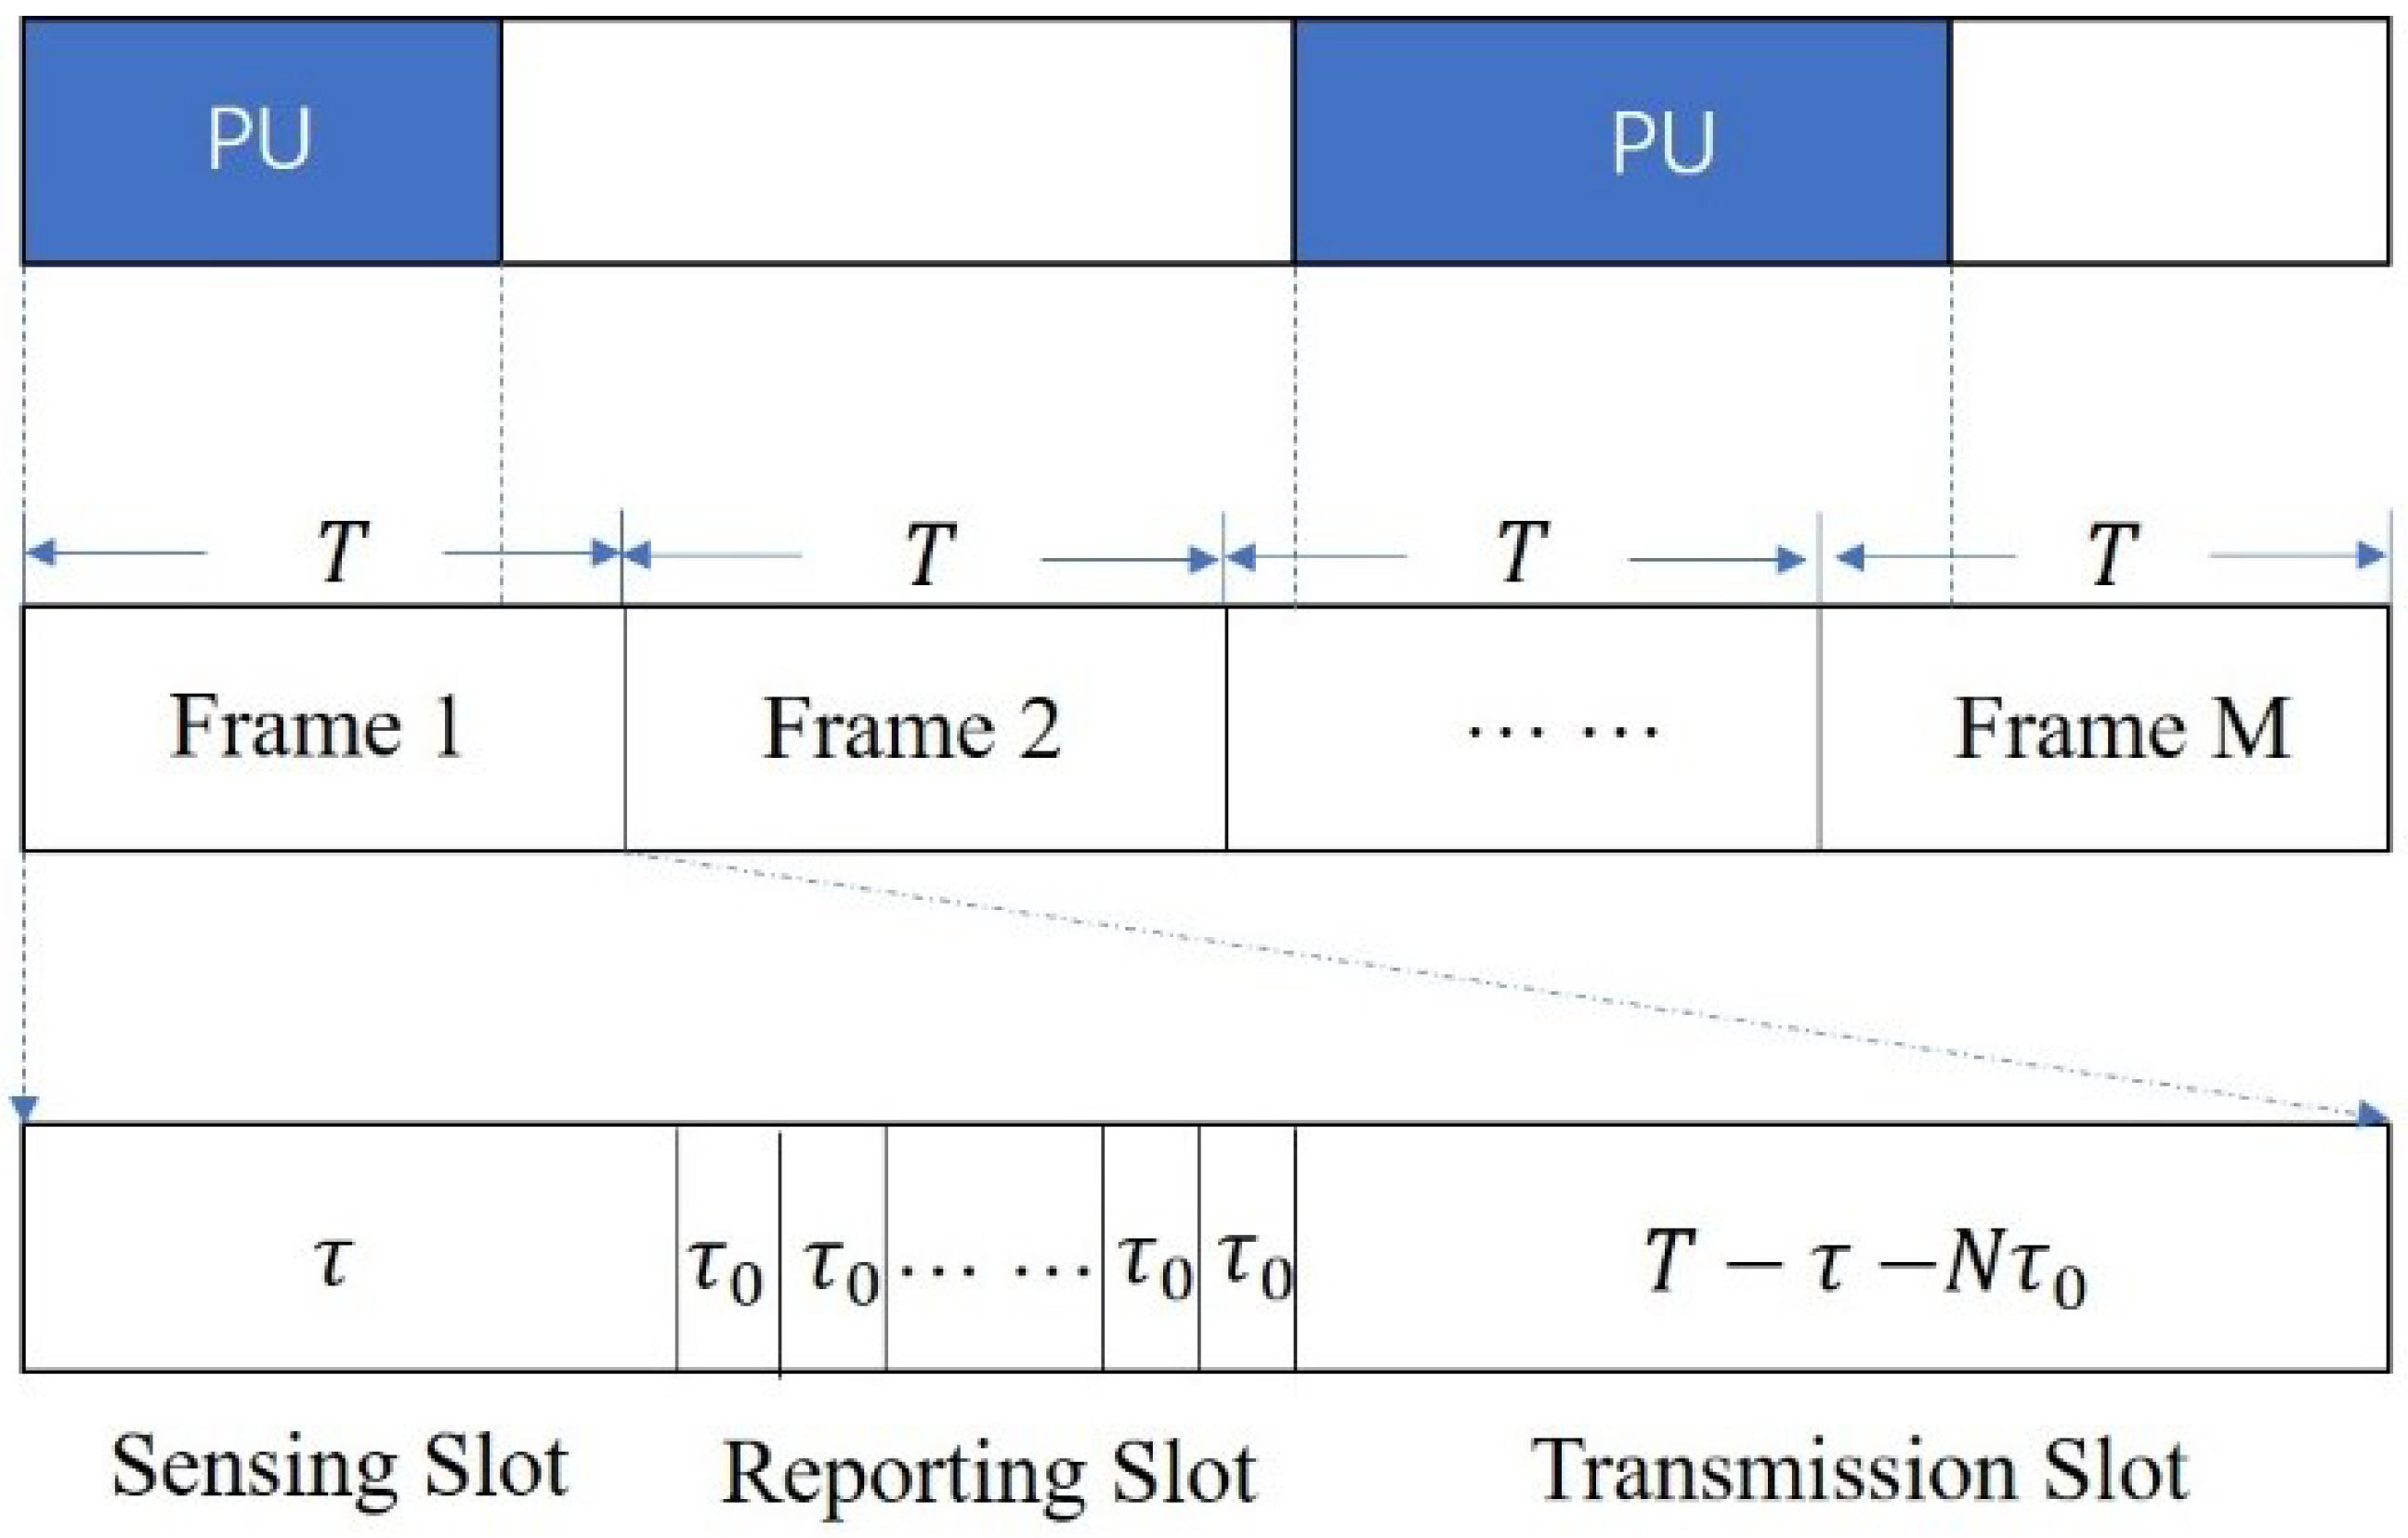
Case 1. The PU is occupied and the SU detects it correctly. SUs transfer the spectrum band to the PU as they have a lower priority. SUs only spend power on sensing and reporting phases denoted by (τ and are defined as the sensing and reporting interval in a frame structure as shown in Figure 2), where the transmission powers of SUs for reporting and transmission slots are the same and denoted by , and the sensing power is denoted as . SUs make a contribution to sensing but receive zero throughput in return in this case.
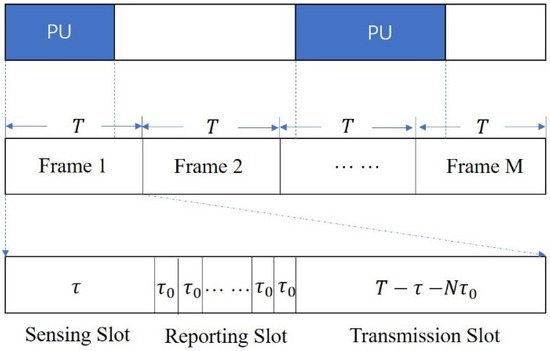
Figure 2.
Architecture of a frame in CRNs.
Case 2. The PU is occupied but the SU detects it to be available (i.e., miss detection). SUs make efforts to achieve both sensing and transmission, but they still suffer serious collisions with the PU during the transmission as they share the same band; then, the total energy cost is calculated as (5):
The data rate of the SU is denoted as , and we assume in case (2), that the probability of this case is . The expected throughput of the SU under miss detection is defined as (6):
Case 3. Under the circumstance of a false alarm, SUs receive an “occupied” state and cease the transmission. However, spectrum waste is caused in this case, as the spectrum band is actually available. The energy cost equals . In return, SUs earn zero throughput as they refuse to transmit data. At the receiving part, the SU exhibits a similar action as in case (1); case (3) is considered as an irregular case as it only results in spectrum waste. In this regard, should be minimized to improve the throughput.
Case 4. A successful transmission is represented by the scenario in which SUs transmit data when the PU is truly available. The energy cost in this case is . The SUs’ data rate is denoted as . The interference introduced by the presence of the PU is evident in case (2), while SUs enjoy successful transmissions when no in-band interference happens. Similar to (5), the throughput is calculated as (7):
3.2. Energy Detector
The test statistics defines the average energy detected in samples received at each SU during its sensing period, which is defined as (8):
Then, the test statistics of each SU are compared individually to a detection threshold . The probability of detection is defined as the integration of the probability density functions (PDFs) in the range , which is shown as (9):
As shown in (3) and (4), the FC collects all test statistics and makes the global decisions with a selected fusion rule (e.g., k-out-of-N, OR, AND, majority, etc.); then, the FC broadcasts the results to the whole CRN. The probability of detection should be determined according to the lower bound of detection, which is , to avoid the potential in-band collisions caused by miss detection. According to approximated equations of detection performance (1) and (2), when the number of samples approaches infinity, the complementary Gaussian function is a monotone decreasing function of . This implies that the decrease in the detection threshold can improve the chance for a PU’s presence to be detected. However, this action does not only increase but also increases because and change in the same direction with . Thus, the throughput also tends to decrease. For instance, from (1), it is indicated that should always exist in order to keep below 0.5; from (2), we can deduce that should be kept beneath a threshold to satisfy the detection requirement. In this regard, it is difficult for to thoroughly optimize the energy efficiency while meeting the detection requirement at the same time.
4. Problem Formulation
4.1. Minimum Transmit Power of the PU
We assume that the transmit power of the PU is determined as and the gain of the fading channel is given as for both primary and secondary users. The system bandwidth is . The data rate of the SU in case (2) and case (4) are defined as follows based on Shannon’s equation:
From (10) and (11), we observe that . Intuitively, the data rate of a successful transmission is larger than the miss detection because of the unavoidable interference caused by the PU’s transmission, i.e., . The corresponding system throughput of these miss detection and transmission are defined as < , respectively. According to (6) and (7), the overall system throughput can be expressed as a function related to and , which is calculated as (12):
It is noticed that in order to guarantee the detection accuracy, << should always be true. Besides, << (i.e., the PU is not dominant in the spectrum band) is a basic hypothesis of spectrum sensing to reallocate the spectrum resource; otherwise, the presence of an SU interferes with the dominant PU. In this situation, it is not worthwhile to sense the band. Hence, it can be found in (12) that is always the case.
Furthermore, as and are considered to be the conditions of detection performance, γ should be large enough to guarantee the difference of and if a fixed threshold is applied for . According to (3) and (4), the k-out-of-N rule can be understood as an extensive logic of the OR rule; that is, k positive samples should be collected to support the decision. Thus, the probability of a general decision is referred logically to the individual probabilities. To achieve the detection performance, and have to meet the following requirement:
where the expected SNR threshold of PU’s signal received at SU is given as (14) based on (1) and (2), with a couple of thresholds :
For simplicity, we denote the following values with the function: , . is subject to a quadratic equation as (15):
As , , the delta of quadratic Equation (15) is calculated as follows:
These conditions indicate that (15) has two positive roots for denoted as . To follow the conditions of (13), (15) must be transformed into a positive inequation where the solution can be found inside the range (0,] and [, +∞). Obviously, the received SNR should follow the latter range to guarantee the sensing performance. Besides, it should be noticed that is an averaged conception during a sampling period. SUs might experience different detection results of the PU states in the sampling period as the PU applies random access, but the receiver of SUs reports only one specific answer to the FC which depends on the averaged detection value during this sampling process. For this reason, in order to achieve the averaged SNR requirement, the instantaneous transmission power and the presence of the PU should be mutually adapted. Thus, the lower bound of the PU’s power provision is subject to (17):
where denotes the actual active probability of the PU during the sensing period, and is the instantaneous transmit power. According to [23], with more details given as (22)–(24) in Section 4.2, can be calculated as (18):
where is the active probability represented by:
In (20), is defined as the threshold of active probability according to the basic hypothesis of spectrum sensing: the PU’s presence is not dominant in the band, and there are some opportunities to reuse the band. Then, the first lower-bound condition of is implied as (20):
Substituting (19) and (20) into (18), the upper bound of is indicated as (21):
Equation (21) defines the maximal idle duration ratio, as a protection of the PU’s presence. As is basically a small ratio (e.g., equals only 0.352 s [3]), the upper bound is a monotonically increasing function for under certain fusion rules. For the purpose of satisfying an SU’s sensing performance, the maximal idle ratio that the PU can tolerate is obtained at the worst sensing case of the SU, where reaches its minimum . If the PU is present more frequently than the threshold in a better sensing case of SUs, the sensing performance (e.g., detection and false alarm) can be further improved. However, regarding the PU’s design, the idle period always corresponds to the presence of the PU by meeting the maximum requirement of the SNR at the minimal sensing ratio .
In addition, although decreasing the PU’s power brings less interference and improves the data rate , it has very limited influence on the system throughput. On the contrary, the average transmission power should be increased to a threshold of denoted by to reduce the false alarm probabilities and therefore to improve the throughput. Thus, the active time of the PU should surpass the minimal value defined in (17) to guarantee the sensing performance; otherwise, SUs are not able to recognize the presence of the PU well and might therefore yield more sensing errors.
4.2. PU’s Reactivation Impact on System EE
For a PU who uses multiple channels at the same time, the access to each channel is assumed to be individual and identical. Due to the random behavior of the PU based on its PDFs, the probability of the PU’s presence has randomness during a frame duration, and the idle/active states changes are subject to an exponential distribution, with the average durations of idle and active states denoted as , and , respectively. Thus, the probabilities of the PU switching between OFF and ON states, ,, are computed as integrations of related PDFs during the transmission period, as (22) and (23), respectively:
The second lower-bound condition of is denoted as in (24) to set the constraint of the state switch during a transmission period:
where β denotes the maximum reactivation probability of the PU that SUs can tolerate.
The principal influence on switches of states is the reawakening of the PU, which can interfere with SUs and reduce their data rate from to a much lower level of . Therefore, the reawakening of the PU also decreases the average data rate. This reawakening is unpredictable and can happen at any time of the transmission period. Besides, in the miss detection case, the probability even exists for the PU to transit from ON to OFF, which makes the band become available again; in this case, the probability of miss detection is already very small, and the transmission can hardly recover to the normal data rate if a collision happens immediately before the state switch. Thus, this PU’s action brings no real gain in the context of the system throughput. Since it is indicated that the collision between the PU and SU is rather important to consider, hereafter, is assumed as an ignorable factor compared with . Taking into account the state switches on PU, the total throughput is formulated as (25):
The global energy consumption with a PU’s state switch is considered from two aspects: from the SUs’ view, the energy consumption only depends on the state reported from the FC after the sensing period. As the samples are collected at the beginning of each sub-frame, the PU’s state change exerts no impacts on the reporting message, which is already sent to the SUs before the transmission. Thus, the total energy consumption in an entire frame T is calculated as shown in (26):
In addition, energy consumption is determined by the PU’s fluctuated activation time. The average duration of the PU being in an active state in an entire timeframe T is estimated as (27):
The circuit power is assumed to be small enough compared with the power spent on operations of sensing and data transmission. Hence, the overall energy consumption in a timeframe for CRN (both PU and N SUs) is computed as (28):
Eventually, the global energy efficiency target and related conditions in the optimization problem are formulated as (29):
Under the hypothesis that the PU is designable for an idle/active duration, the objective is to allocate the suitable probabilities to the PU at a particular sensing time, where the energy efficiency of the whole CRN is maximized. To find a feasible solution for this optimization problem, the first step is to study the relation with the PU’s idle/active duration ratio (i.e., defined as ). For simplicity, the following sub-functions of the sensing time are defined in Table 2.
Table 2.
Useful sub-functions of EE with as a variable.
The target function of EE can then be rewritten in (30) as a function of , based on which Theorem 1 is given.
Theorem 1.
Let us consideras a monotone increasing function to the idle/active duration ratio. The optimized value of EE is obtained at the upper bounddetermined by the PU’s minimum power constraint as in (21).
Proof of Theorem 2.
Details are presented in Appendix B.
According to Theorem 2, to further calculate the optimized sensing timeframe of the SUs under the PU’s power provision, a bisection search is applied. The bisection search is a fast and efficient method that allows the optimum to be estimated within limited iterations. Based on the proposed theorems, the bisection method is applied for the EE maximization to fix a feasible location of the optimum with a couple of variables {,}. In Algorithm 1, under k-out-of-N serial fusion rules, the recursive algorithm is repeated until the difference of two boundaries is smaller than the range of tolerable error.
| Algorithm 1. Bisection Search Algorithm for EE |
| 1. Initialize ,,,,; 2. For 3. Calculate (); 4. If ; 5. = 6. While 7. Calculate ; 8. If ; 9. ; 10. Else 11. ; 12. End 13. End 14. Output ; 15. End 16. End |
5. Simulation Results
Our simulations are implemented using MATLAB. The initial parameters of the simulations are presented in Table 3. For the fusion rule, k is tested from 1 to N. The SNR at the transmit end of SUs is considered as 20 dB, based on which C_00 is calculated as 6.65 bps/Hz.
Table 3.
Units for cognitive properties.
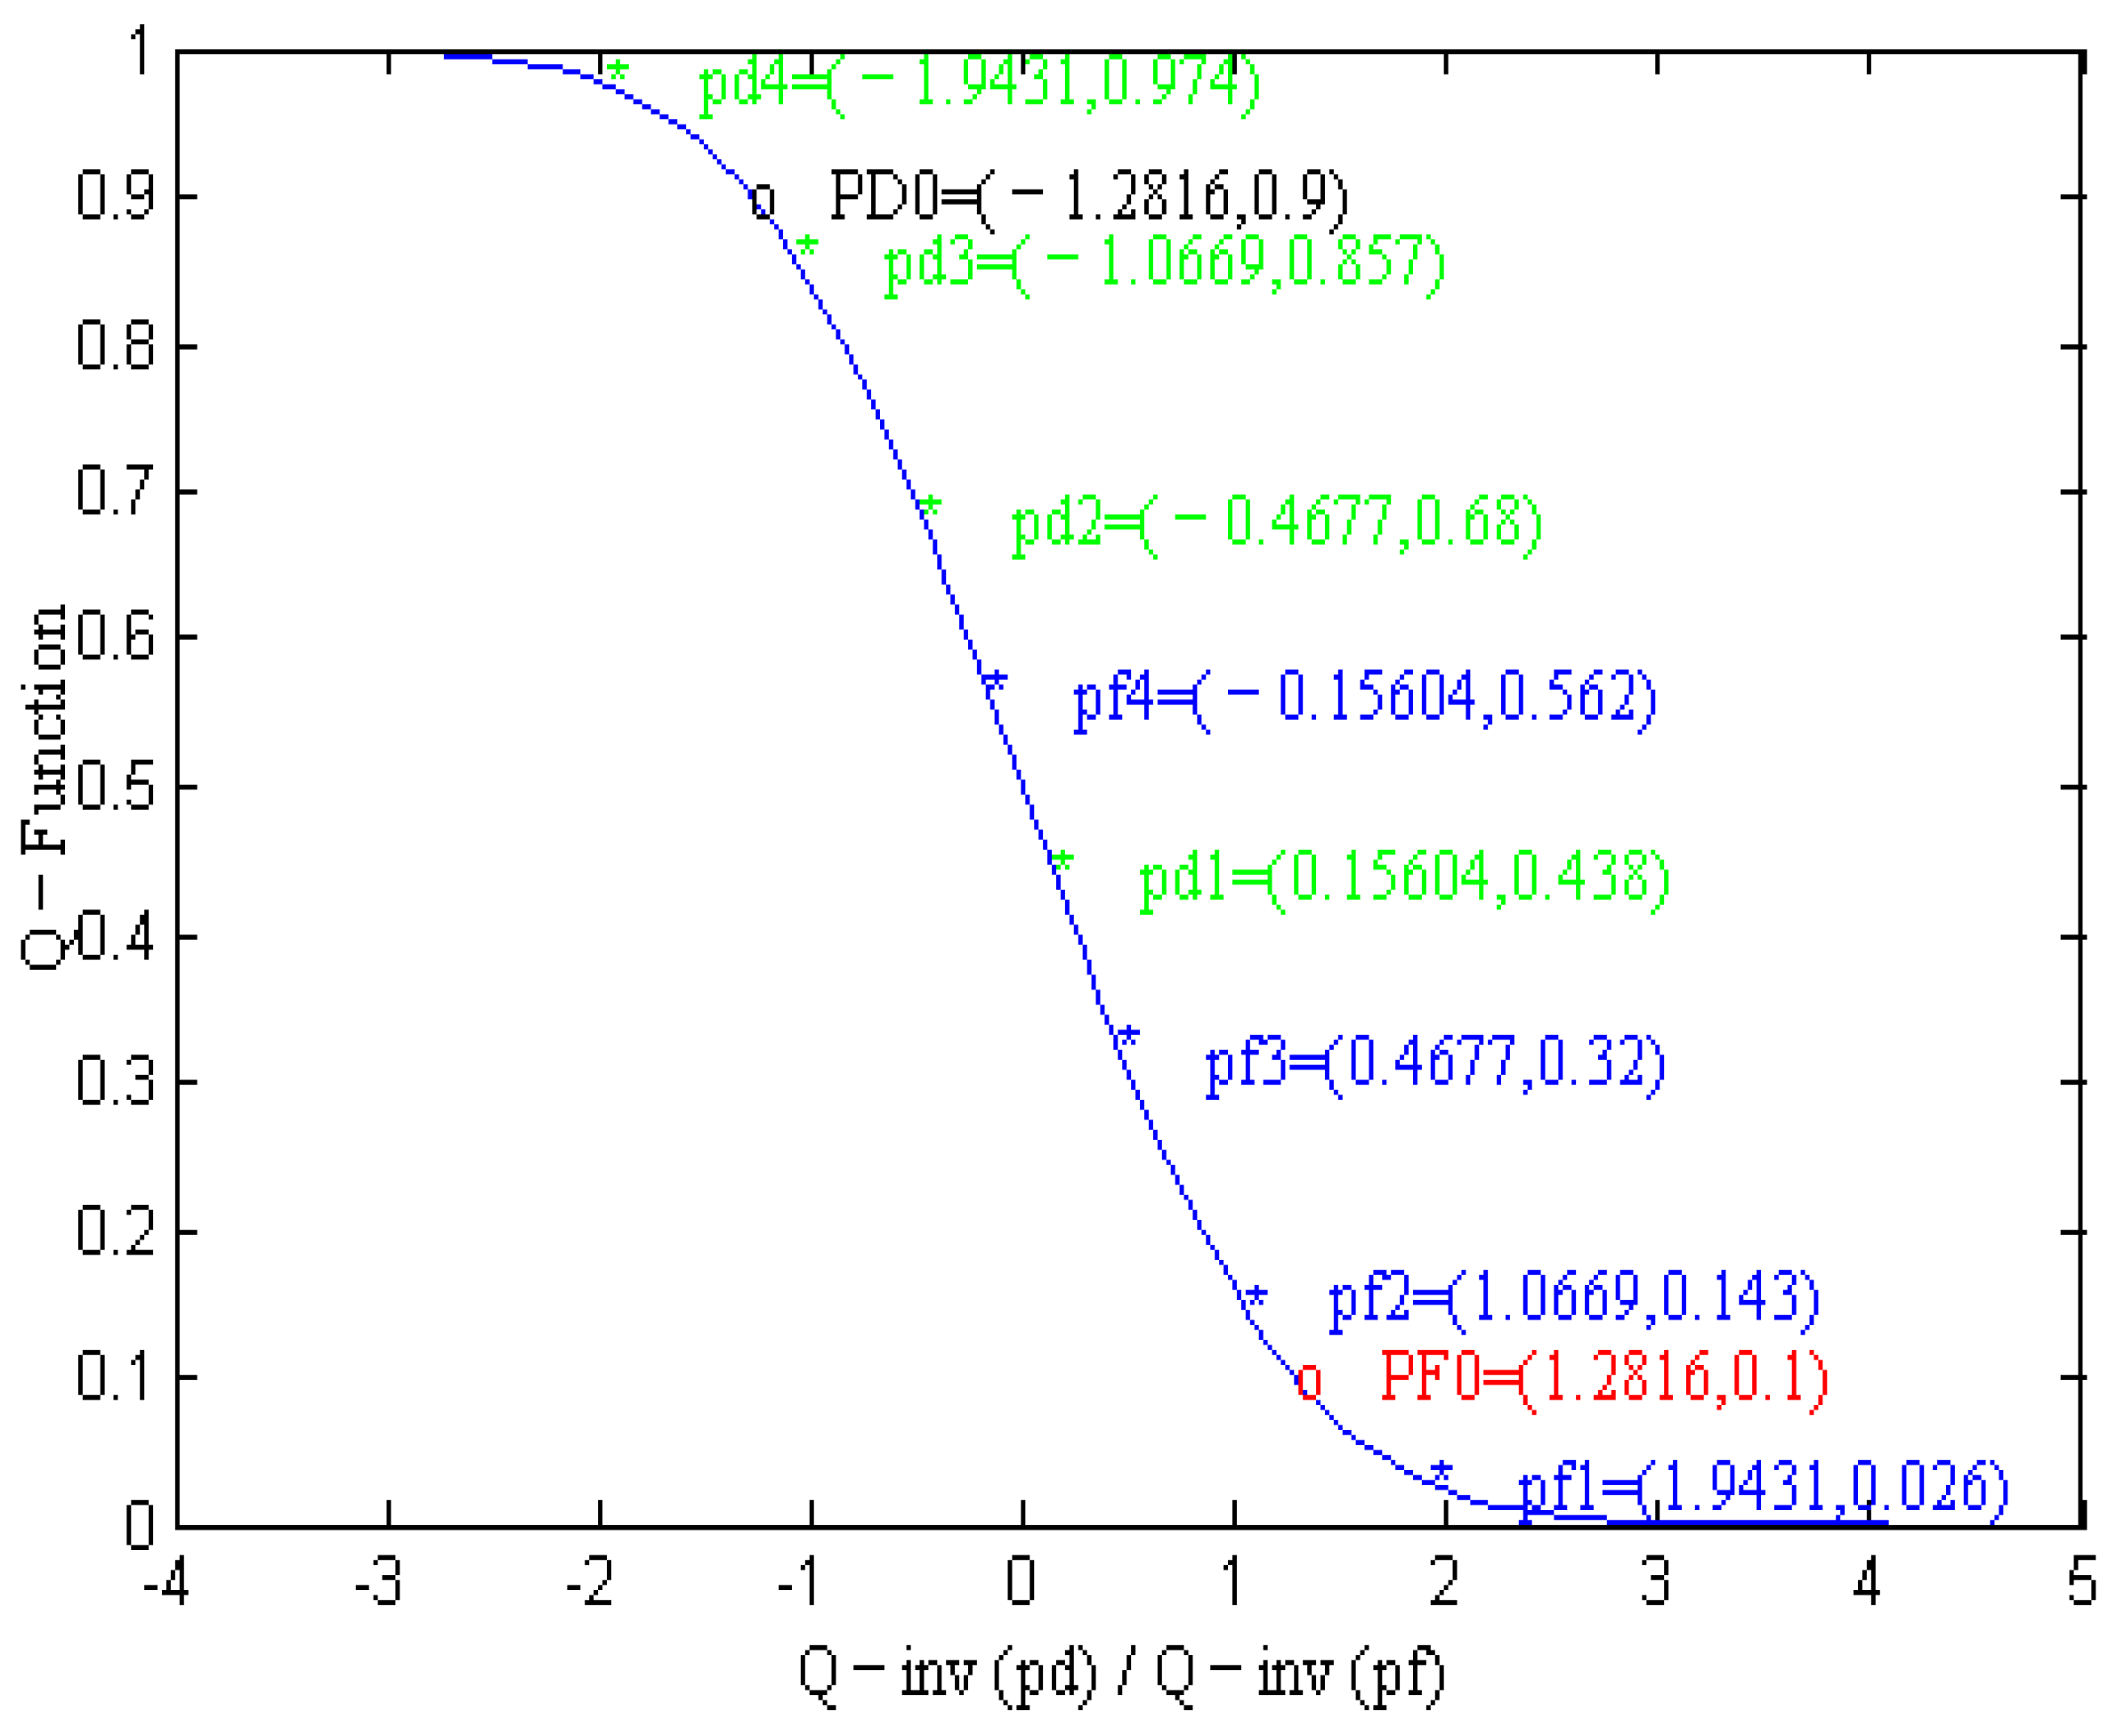
In Figure 3, we take an example of N = 4, with different k values applied for the fusion rule. The individual probabilities of detection and false alarms depend on the values of k. In this figure, = 0.9 and are defined as the threshold of detection/false alarm probabilities; since the fusion rule is more difficult to be satisfied for a larger k, the threshold of an SU’s individual probability is also increased. For example, the AND rule (k = N = 4) requires a detection probability of 0.974 to be reached, while the OR rule (k = 1) only requires a value of 0.438. This implies that the minimum SNR in (18) which follows the requirement of sensing performance is also a function of k. More details of the impact of fusion rules are shown in the following figures.
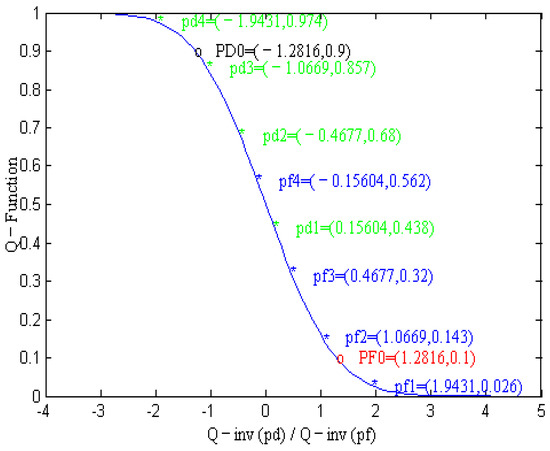
Figure 3.
Detection performance with different values of k.
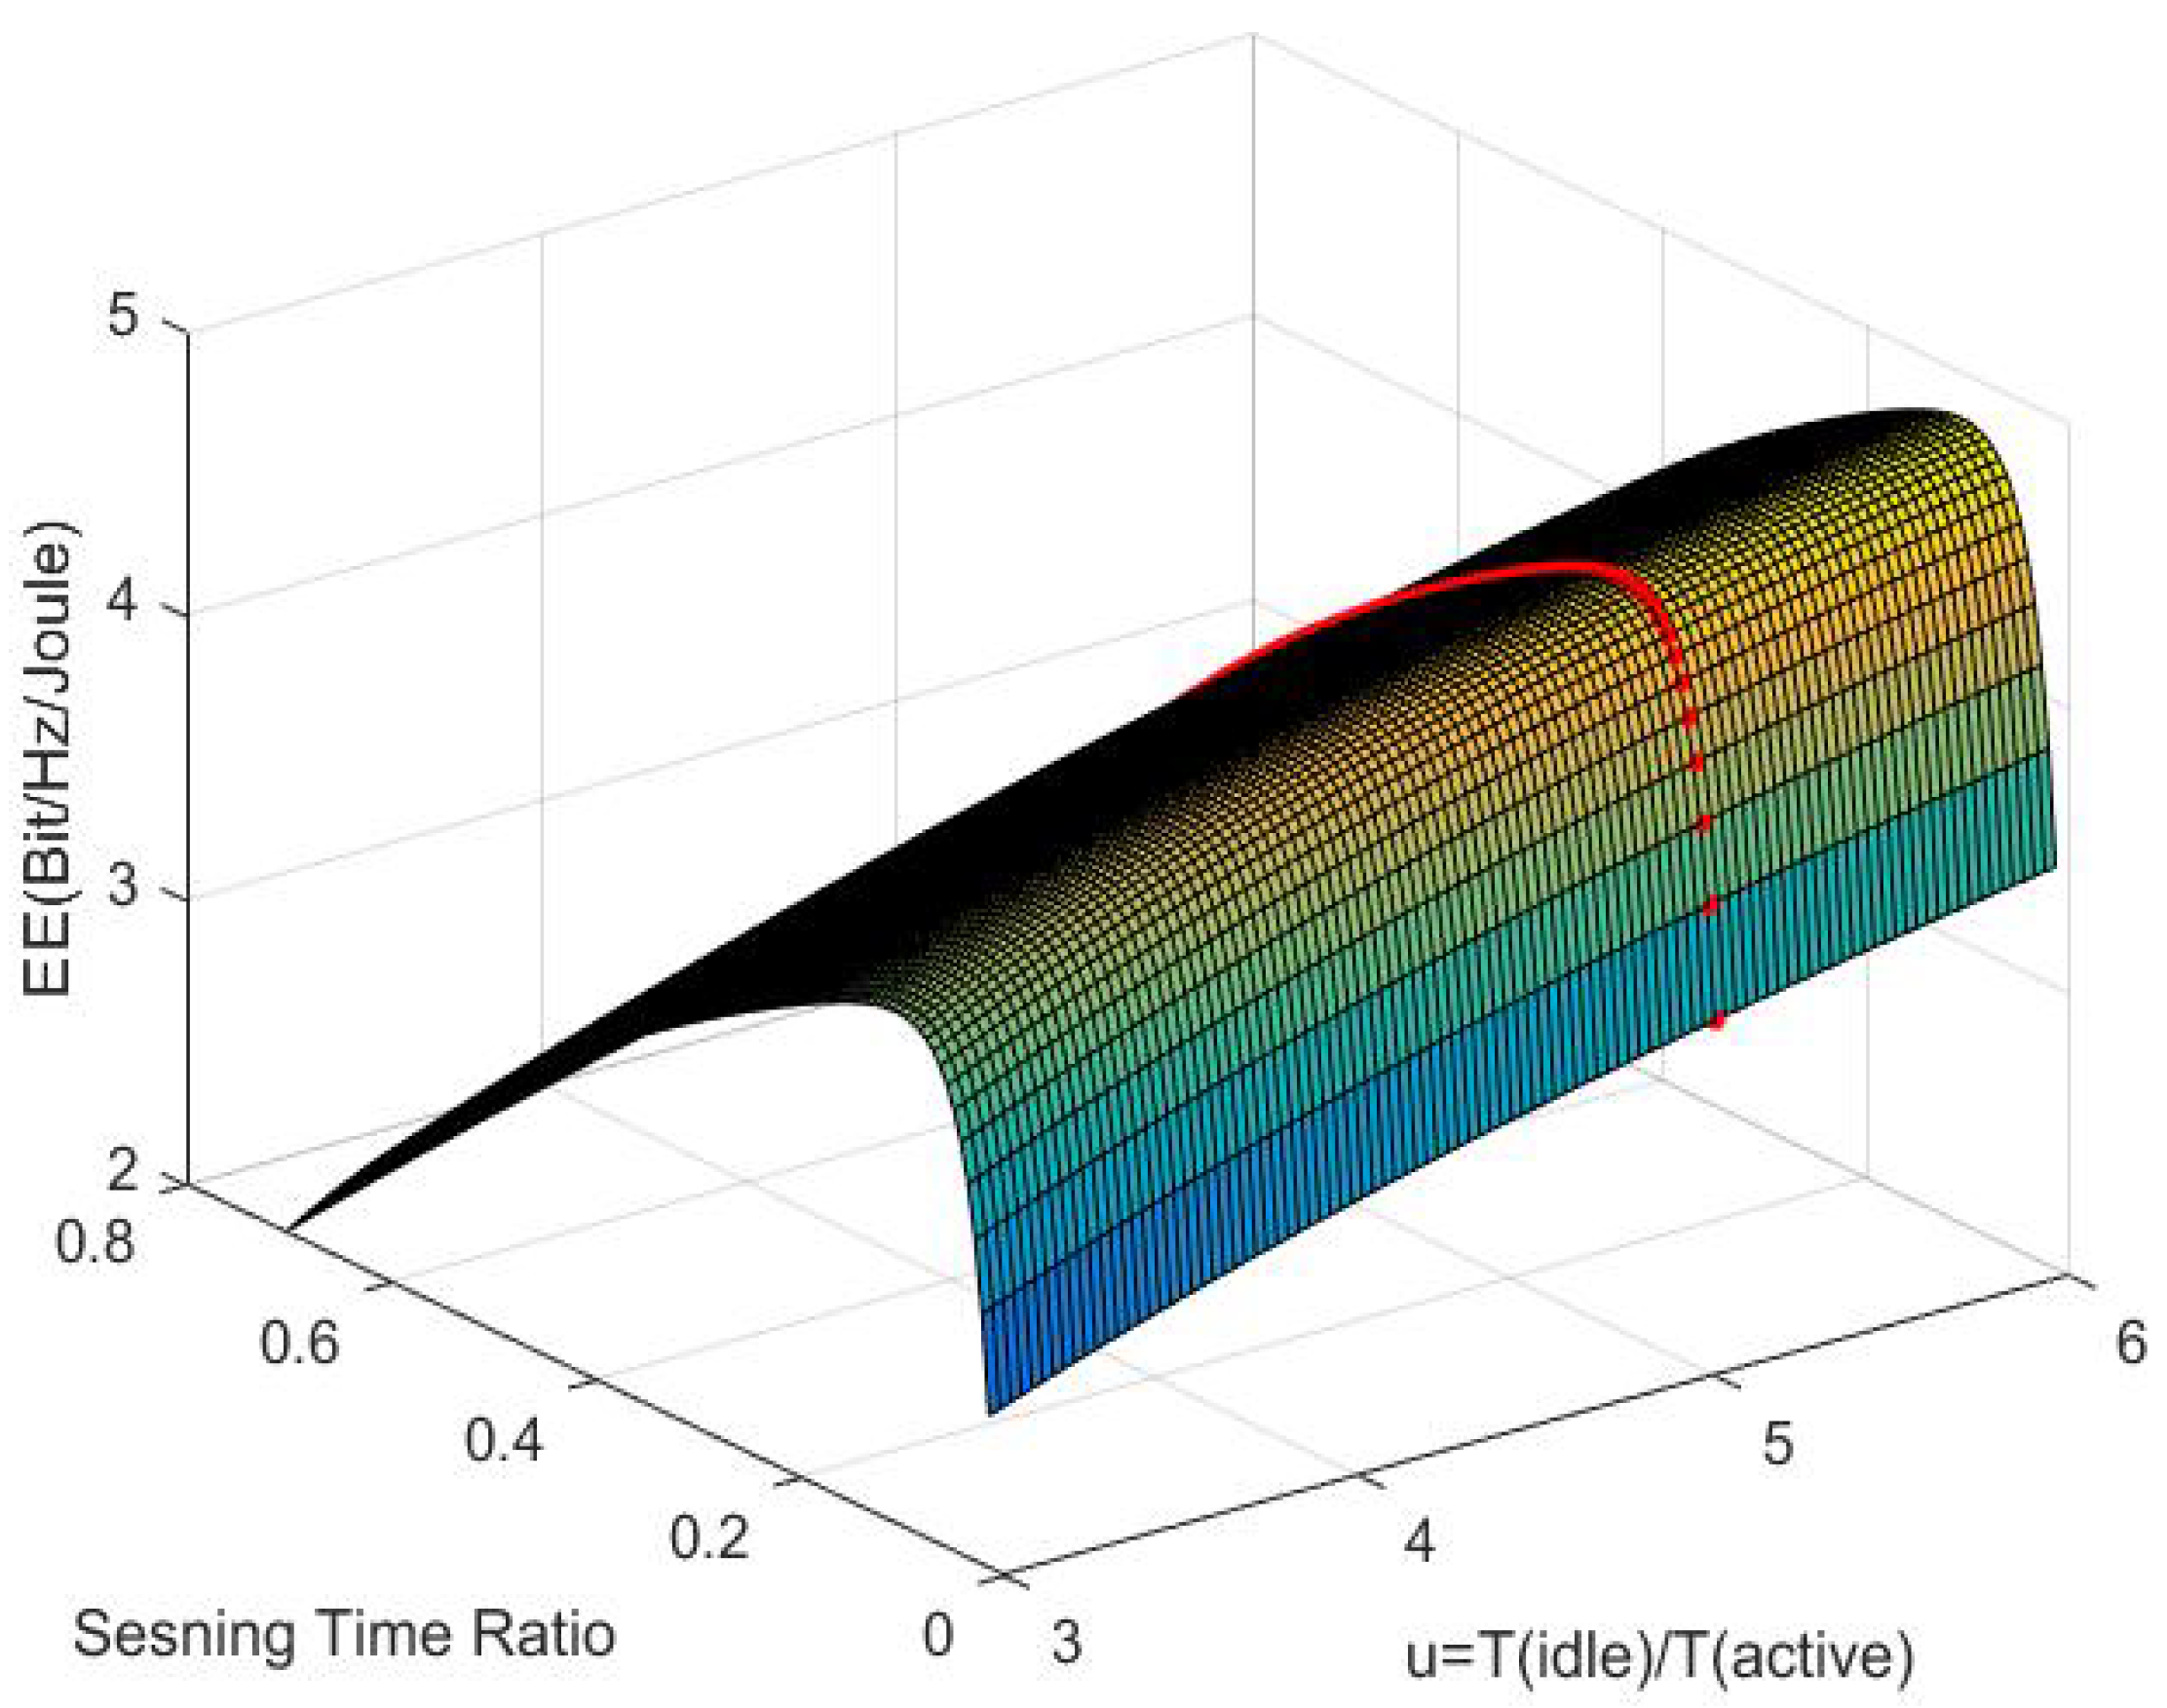
Figure 4 and Figure 5 indicate the impact of the idle and active ratio on the optimization, respectively. Figure 4 draws the contour lines of different thresholds, which reflect the target sensing performance. It is observed that at the same value, if the target detection probability increases, then the target false alarm probability can be relaxed (i.e., increased). In this figure, when reaches 7.7884 where a low presence of the PU occurs, performs no better than 0.812, whereas exceeds 0.454. In return, a higher also contributes to a larger EE. Figure 5 shows an example of the three-dimensional curve of EE. We observe that EE increases with until the threshold = 5.044 (the red line Figure 5) is reached at = 0.9, = 0.5, k = 3. For a specified , a unique peak of EE can be found by implementing the bisection search on the sensing ratio axis.
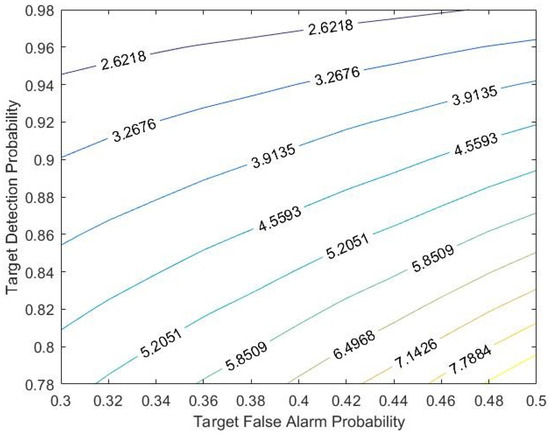
Figure 4.
Contour lines of maximum idle/active ratio under sensing performances constraints.

Figure 5.
Example of three−dimensional EE optimization with PU’s idle/active ratio and sensing ratio. (, ).
The complexity of our algorithm is calculated as , based on the bisectional division of the searching interval to the error rate. Given the probability of the PU’s presence, it takes less than 10 iterations to achieve the optimized EE at . For instance, it takes an execution time of 0.3248 s to reach the optimum using an iterative bisection search, which is estimated using a MATLAB tool function for the running time.
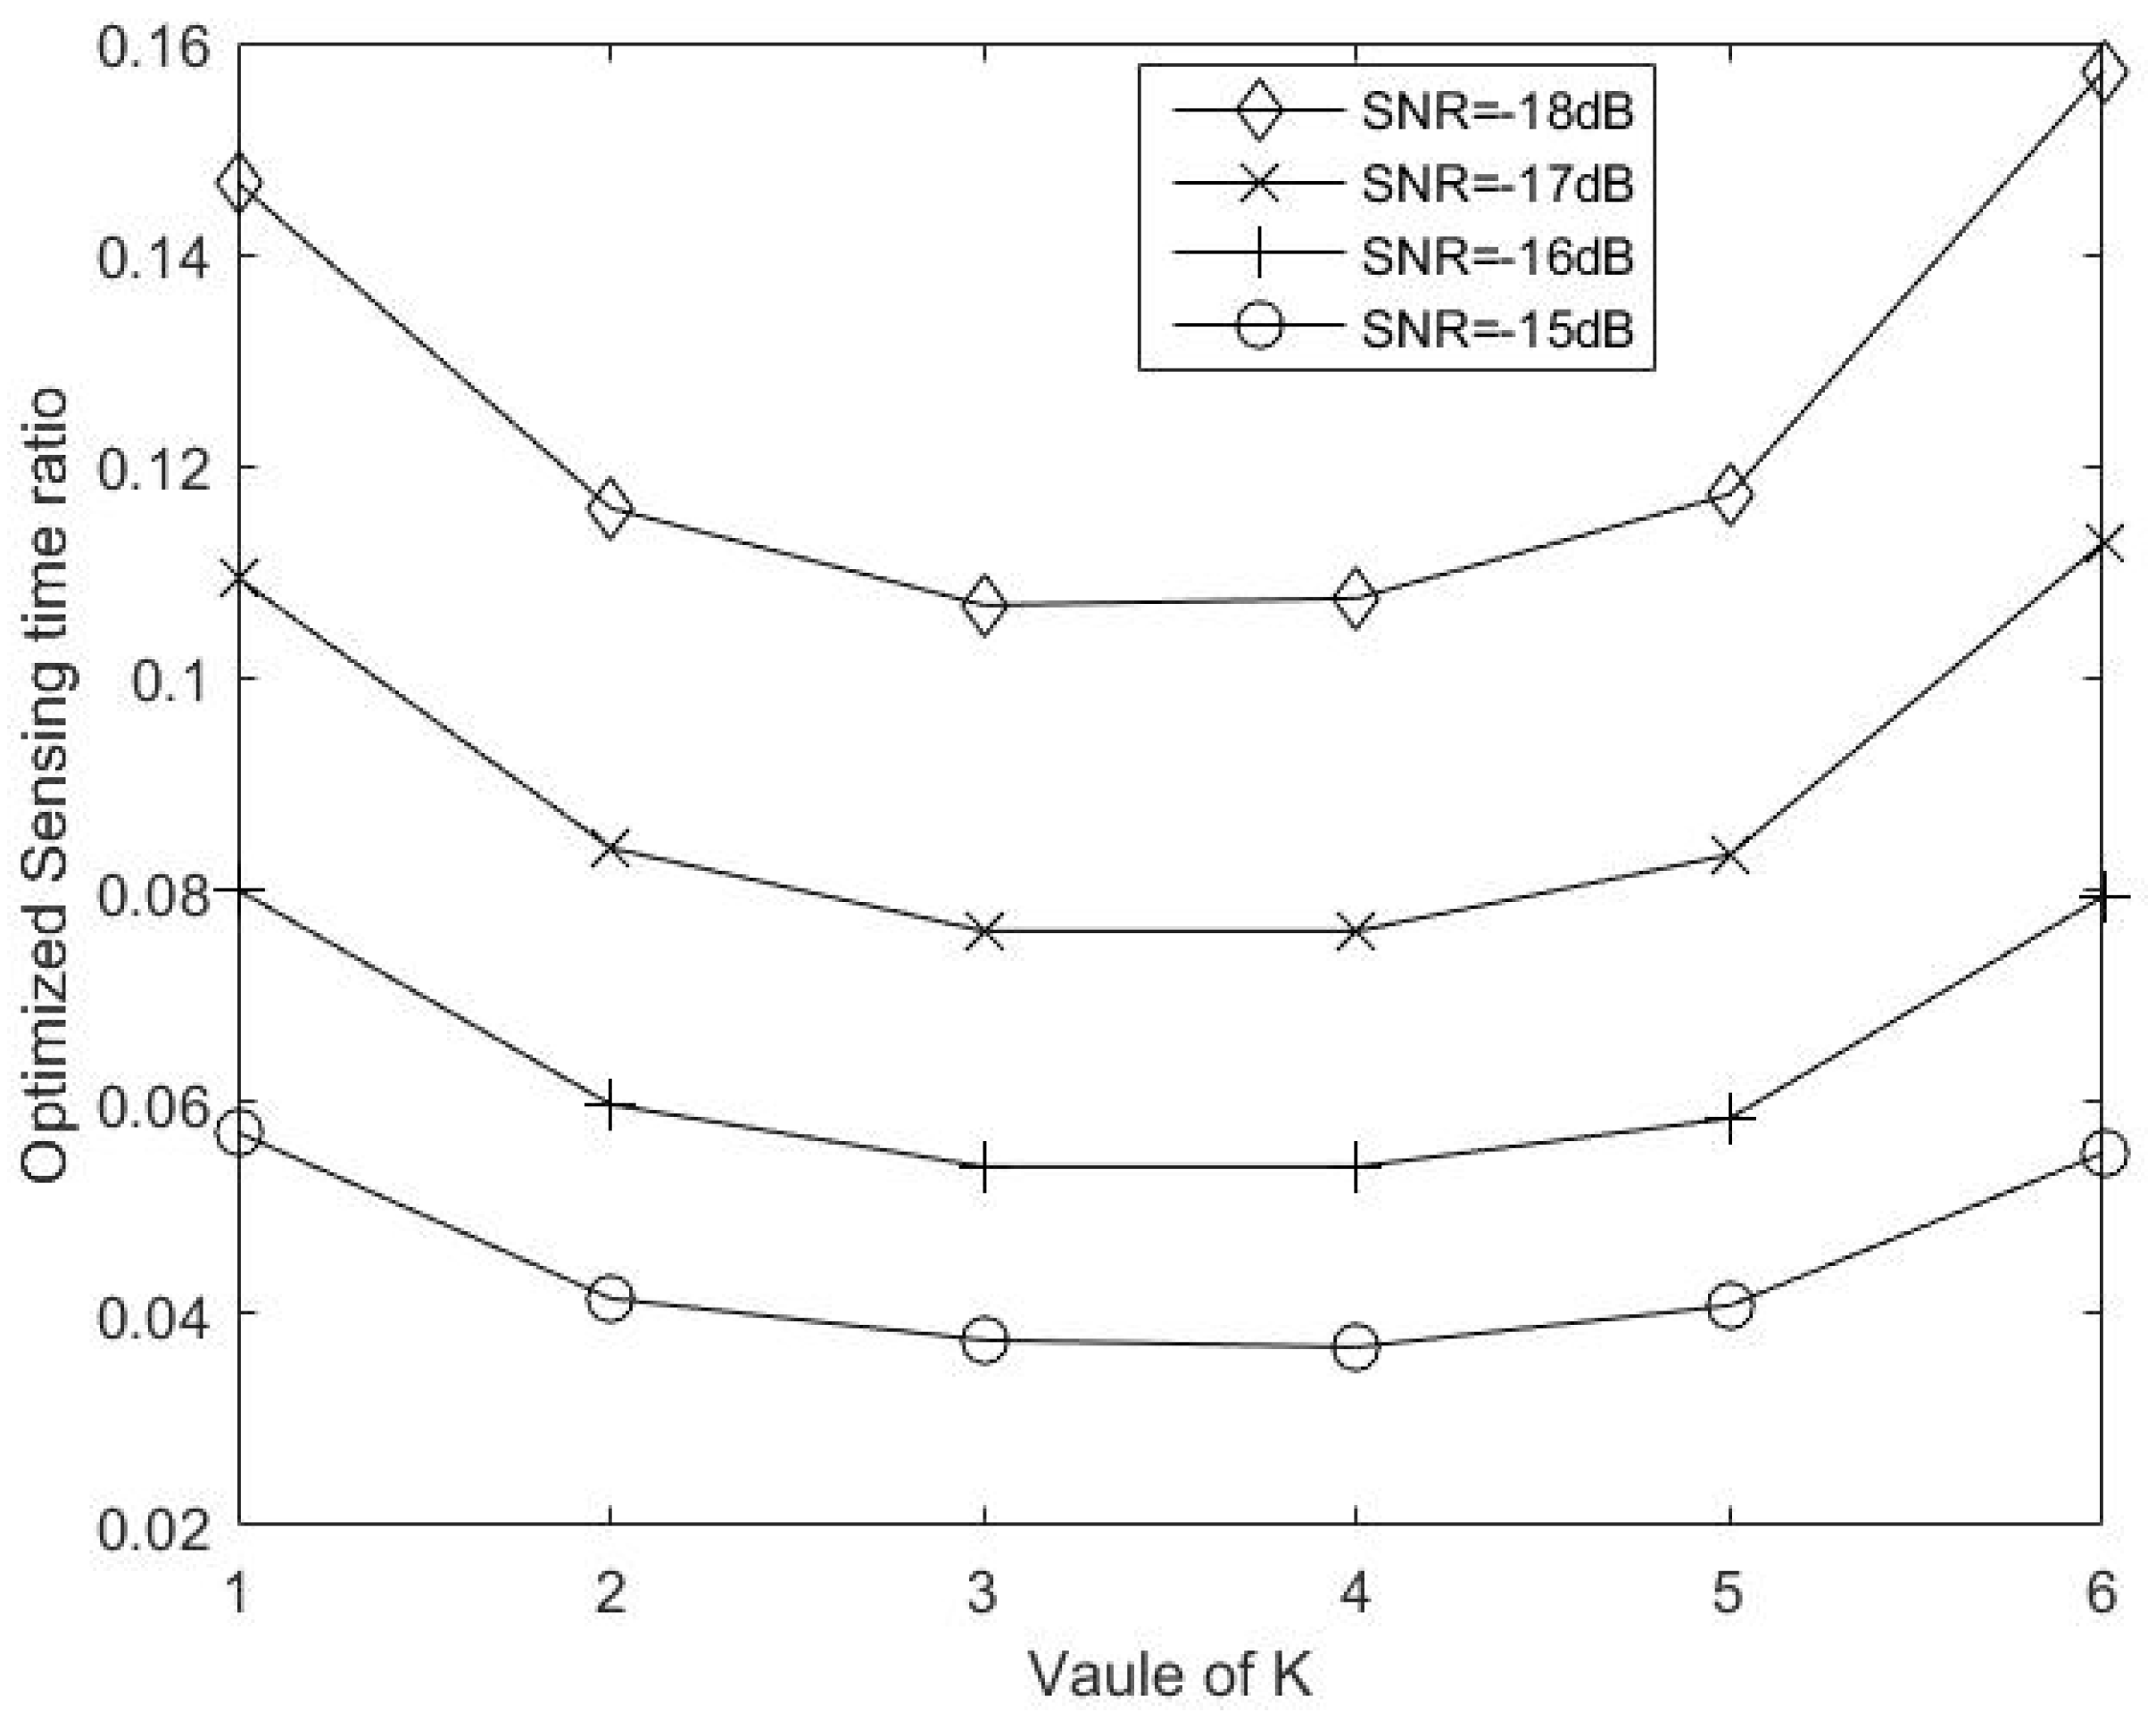
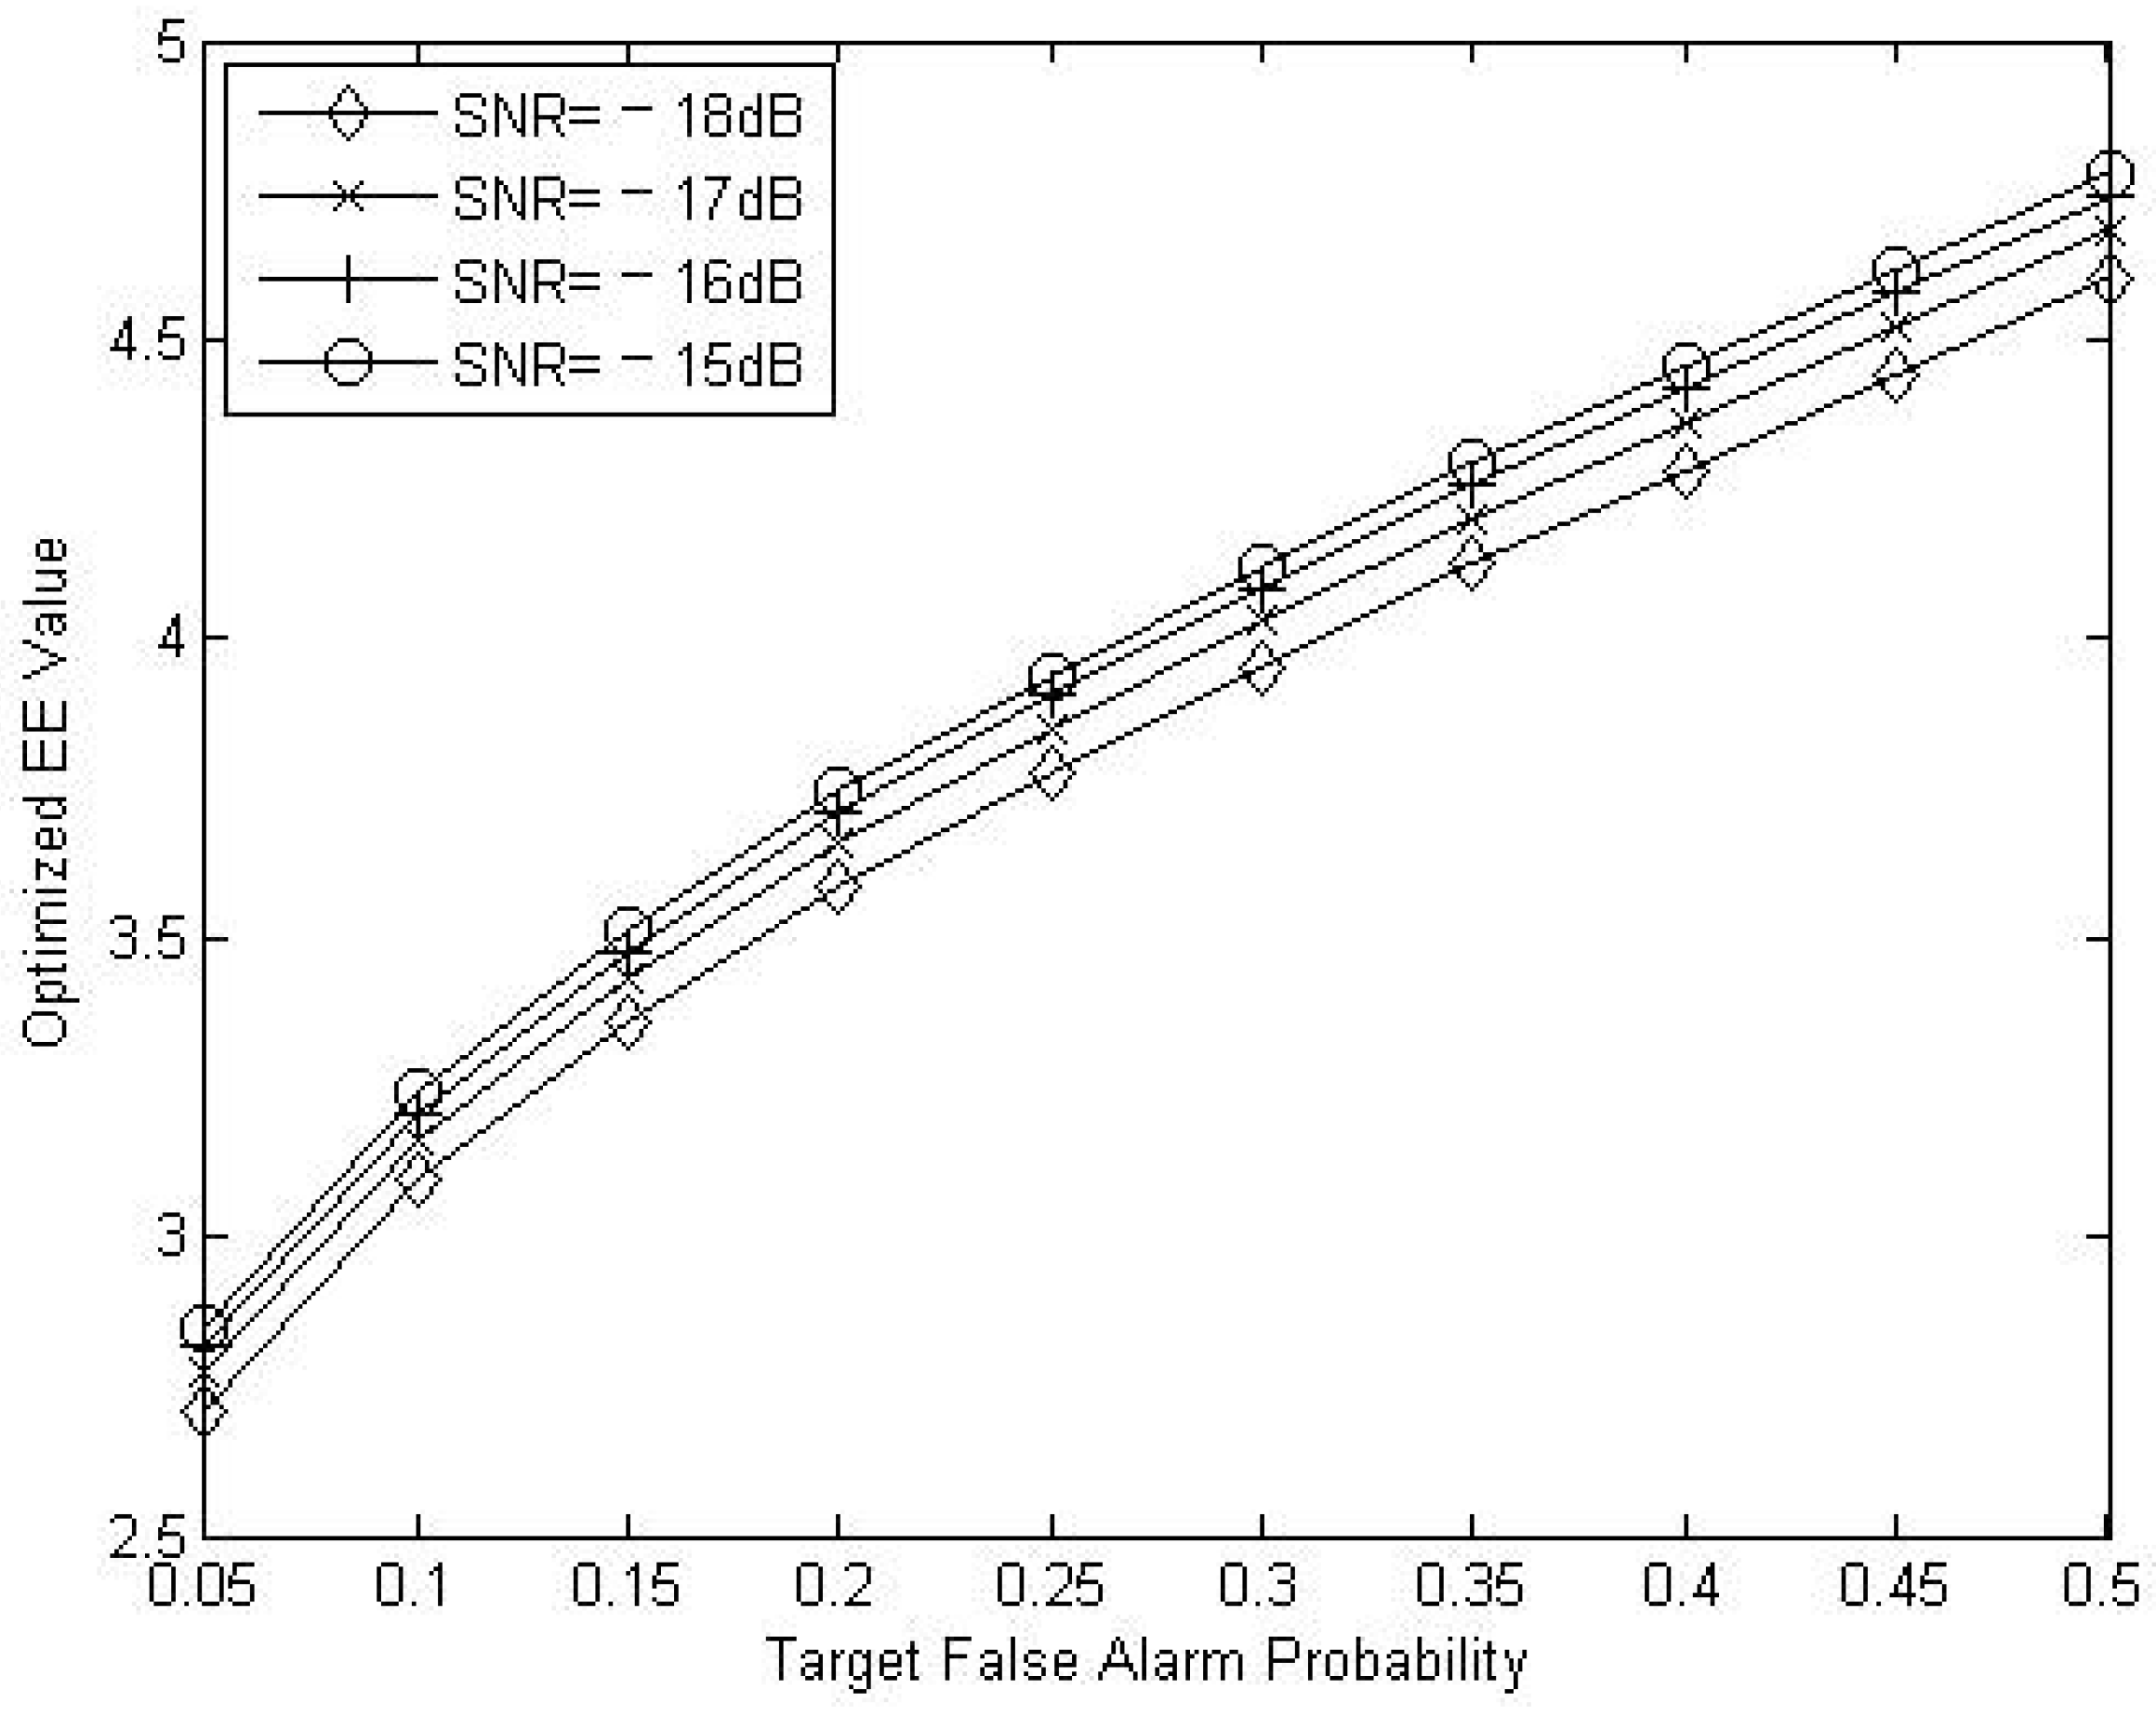
Figure 6 and Figure 7 present the optimized EE under different fusion rules and network environments. For N = 6 SUs, the best case of EE approaches 4.8 when k = 3 at the cost of only a 4% sensing ratio in an SU’s frame. The EE of k around (N/2) performs better than other values of k, especially when compared with OR (k = 1) and AND (k = N = 6) rules. Therefore, in our following simulations, the “majority” rule is applied in order to obtain the optimum. As the “majority” rule is considered to be the most common and stable fusion rule, it is applied for our simulations to test the optimum.
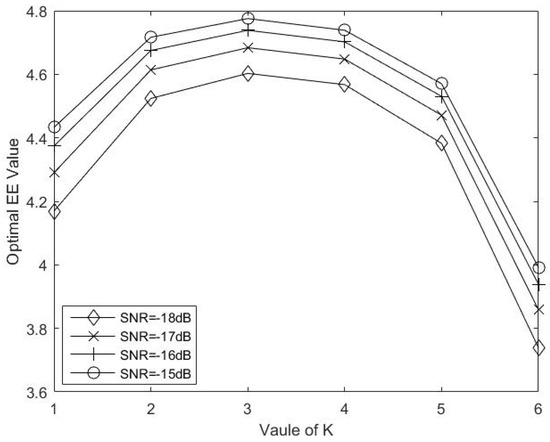
Figure 6.
Optimal EE under different fusion rules.
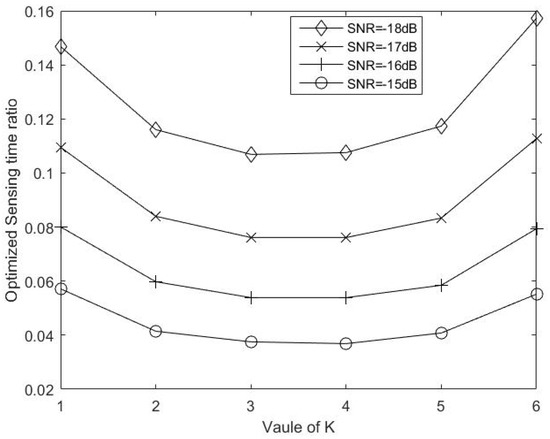
Figure 7.
Optimized sensing ratio under different fusion rules.
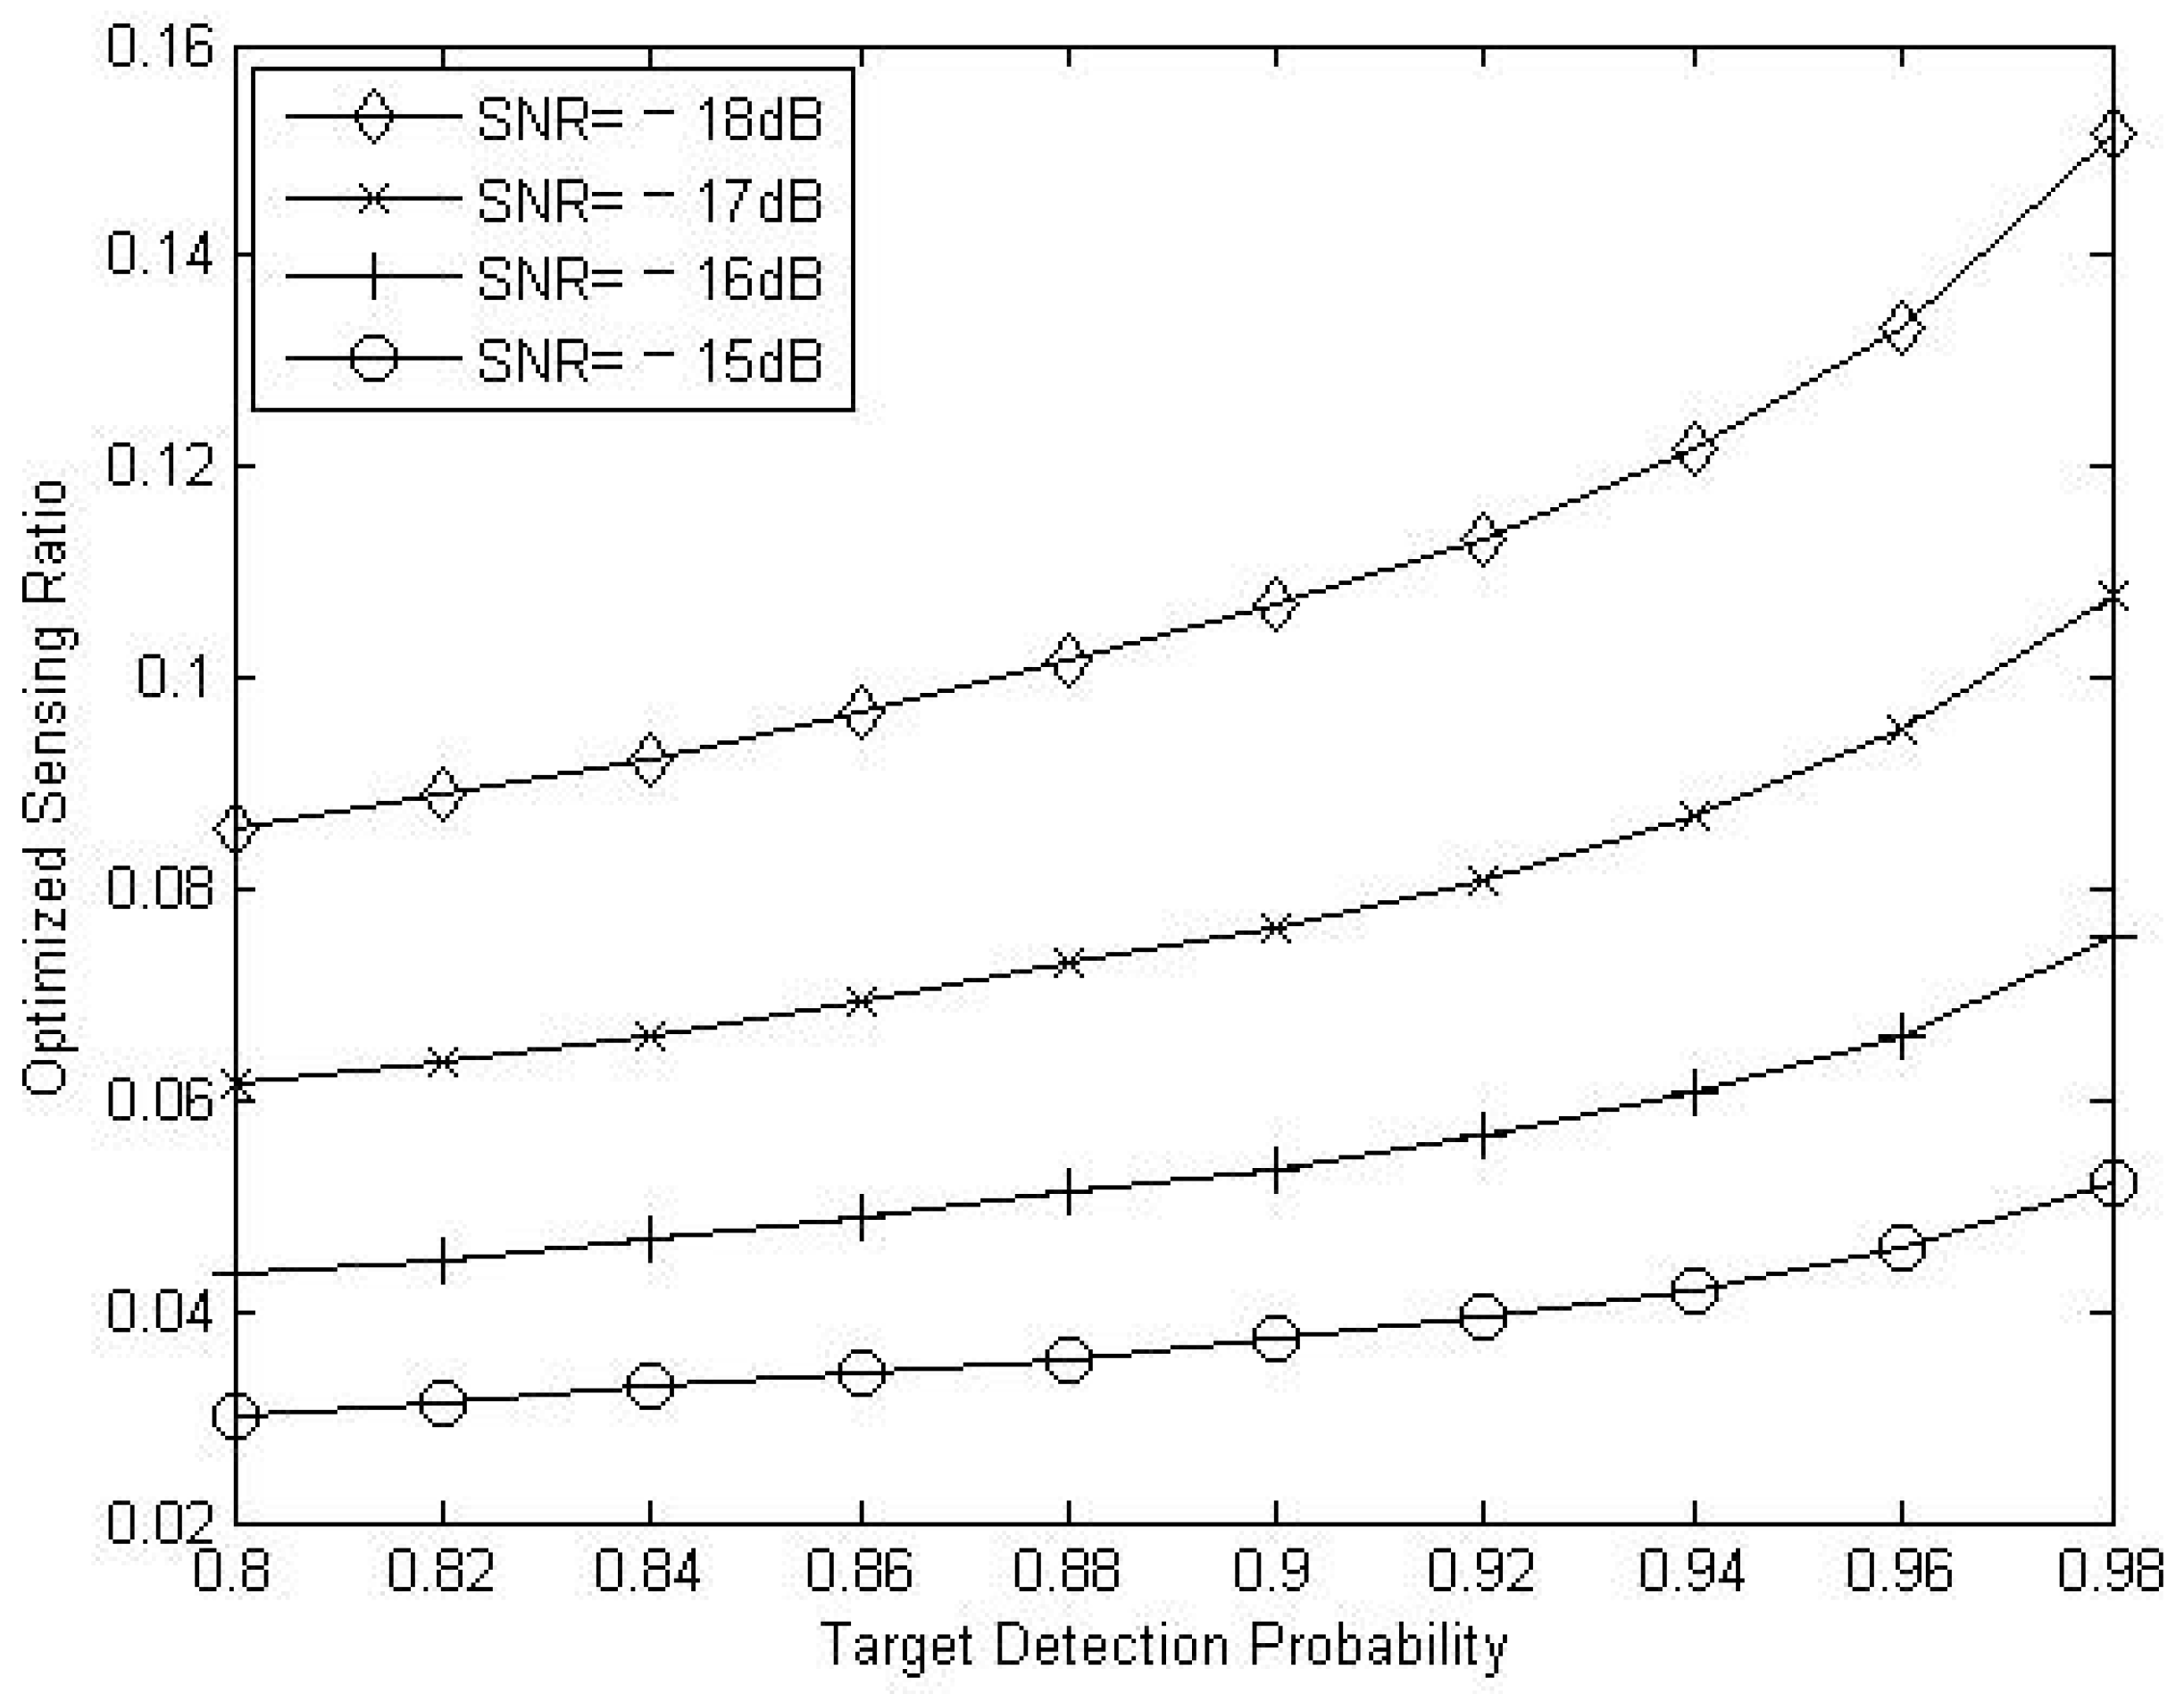
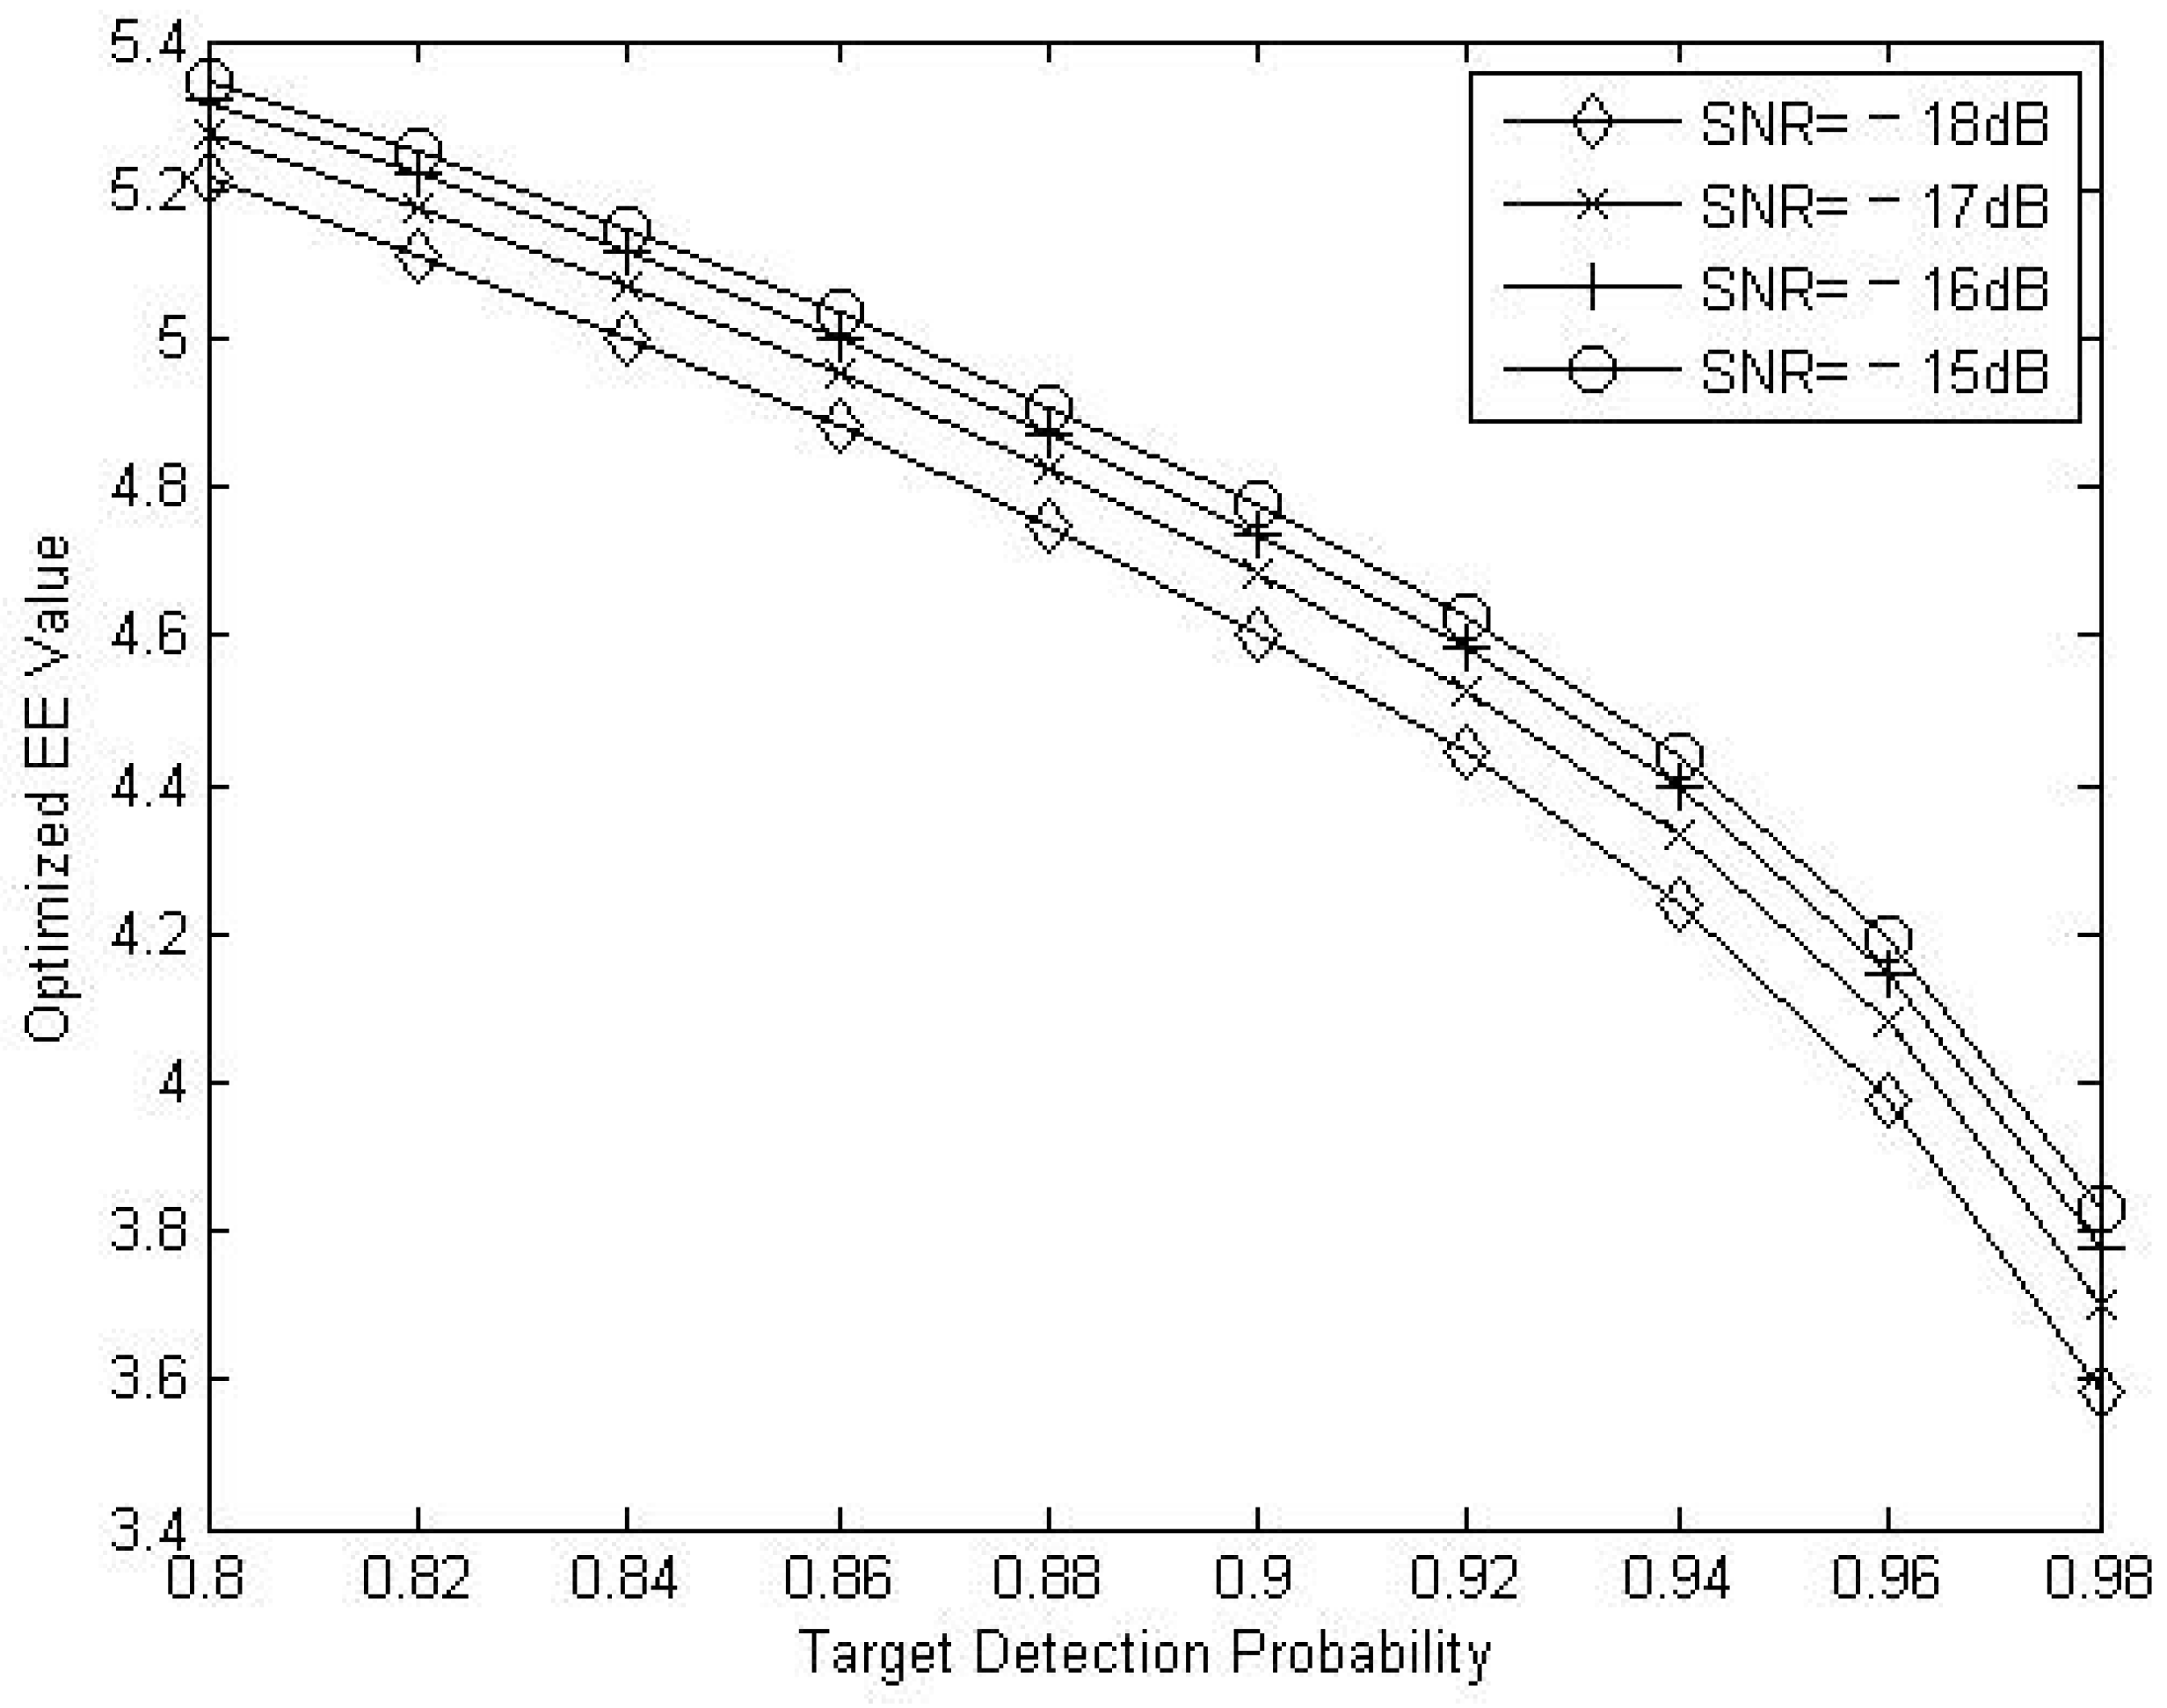
Figure 8, Figure 9 and Figure 10 present a set of figures of the maximum EE and related optimized sensing ratio by a bisection search. By analyzing Figure 8, we can infer that SUs need more time for sensing when a larger is required. On the contrary, as an upper limit of , is used to estimate the minimum presence of the PU; however, it has no impacts on the optimized sensing ratio. Although has an impact on , and thus it influences the maximum EE, the optimized sensing ratio is only dependent on and irrelevant to . However, influences both the optimized sensing ratio and the optimum EE, as it contributes to both and . For example, with increasing from 0.9 to 0.95, the sensing time increases up to about 20% and the optimum EE value decreases by around 10%. This is because a higher requires a higher sensing effort from SUs in order to achieve the sensing performance target, but in return, the EE is lower because the opportunistic access of SUs is limited.
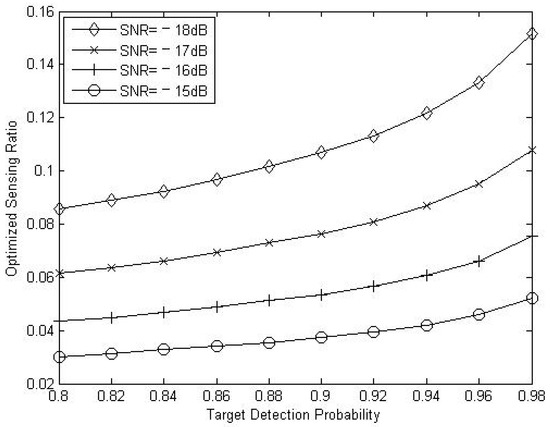
Figure 8.
Optimized sensing ratio under target detection.
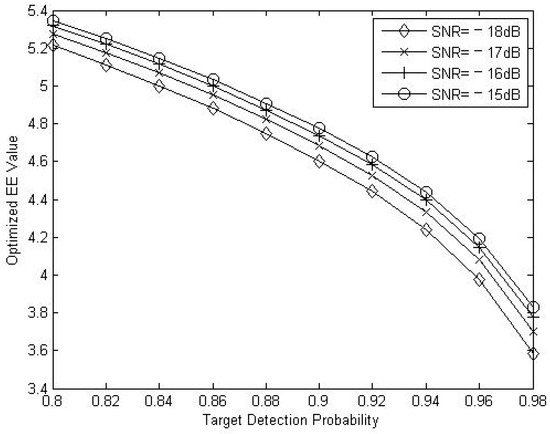
Figure 9.
Optimal sensing ratio under target detection probability.

Figure 10.
Optimal EE under target detection probability.
Figure 9 and Figure 10 show that when the sensing performance requirements become stricter (i.e., a higher or lower ), the minimum presence of the PU increases and EE becomes smaller, as argued in our first theorem. It should be pointed out that cannot be too greedy, although a larger contributes to a higher EE. In practice, should be designed based on the conditions of SNR and the minimal sensing ratio . For example, at = 3 ms, should be no smaller than 0.1752 at an SNR of −16 dB and 0.4290 at an SNR of −18 dB. The decrease in to approach these values can improve the intensity of sensing performance metrics and increase the throughput of data transmission during the PU’s “OFF” state.
Figure 11 shows the impact of random PU activities compared with the EE-oriented optimal PU activities in a practical view. Given the value of , the optimal sleeping probability of the PU equals 0.835, according to the output result of MATLAB. Other access activities of the PU are tested under the same SNR requirement. When the presence of the PU is sufficient for the performance metrics, the optimal EE increases slightly with the SNR requirement, and the portion of the difference of EE with optimal almost stays the same for any received SNR. However, the PU’s redundant presence interferes with EE by occupying the access opportunities of SUs; thus, the curve of = 0.8 lies beneath the optimal . In addition, it is observed that EE is reduced when the energy provisioning from the PU is not sufficient (e.g., = 0.85, 0.9). The more the PU is absent, the less the EE is present due to the increased false alarm risks, and the disadvantage becomes even more evident if a better SNR condition is required. As a result, Figure 11 indicates that the optimally designed PU activities can result in a higher EE for the whole CRN network, and this better resolves the tradeoff between the sensing performance and access opportunities of SUs.
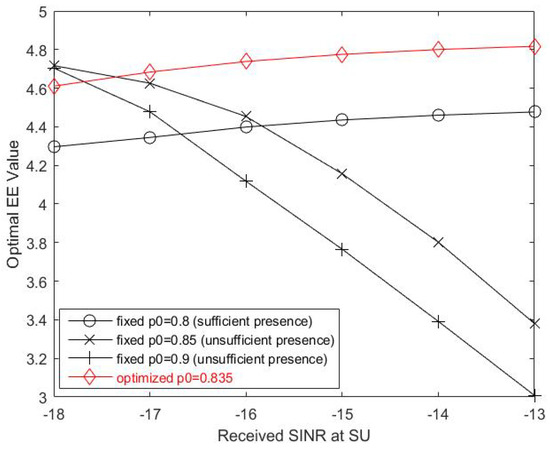
Figure 11.
Comparison of EE with different PU activities.
6. Conclusions
In this study, the design of the activities of a PU is jointly considered with SUs’ sensing efforts to achieve the maximization of the global EE target in CRNs. The state transition (sleep/active) of the PU during the transmission period influences the throughput received by the SUs. In addition, a greater available duration of the PU’s idle state is expected to contribute to a higher EE for the SUs. However, the increase in the absence ratio should be opportunistic instead of being greedy and should be controlled below a threshold so that the sensing performance of an SU can be guaranteed and the PU’s QoS can be protected. We prove that EE is a concave function of sensing time given a fixed probability of the PU’s presence. To optimize EE in the interactive scenario of PU–SUs, a bisection search algorithm is proposed to dynamically locate the optimum. Simulation results show that the SUs’ sensing performance metrics define the lower bound of the PU’s presence and therefore affect the optimal EE; the optimums of SUs’ sensing ratios are analyzed according to the PU’s activity. These optimized solutions are compared for both the PU and SUs under various network environments, and the final results show that our method can better guarantee EE without leading to the risks of collisions and sensing errors. In the future, our research will be extended to further improve the QoS requirements of both the PU and SUs in parallel without any interference on both sides, where the EE of the whole cognitive radio system is strictly controlled inside a target range.
Author Contributions
Data curation, T.Y.; Conception, T.Y.; Supervision, M.E. and L.K.; Methodology, T.Y. and L.K.; Validation, T.Y. and S.P.; Writing—original draft, T.Y.; Writing—review & editing, T.Y. and S.P. All authors have read and agreed to the published version of the manuscript.
Funding
This research received no external funding.
Institutional Review Board Statement
Not applicable.
Informed Consent Statement
Not applicable.
Data Availability Statement
Data sharing not applicable.
Conflicts of Interest
The authors declare no conflict of interest.
Appendix A. Proof of Theorem 1
In addition to the sub-functions defined in Table 2, to further simplify the target function of EE, we define ; .
In (A1), it is observed that each of the aforementioned sub-functions is positive and . Therefore, .
Appendix B. Proof of Theorem 2
For convenience, we name the sub-terms of τ ; (i.e., is also correlated to τ);
Firstly, we calculate the derivation of throughput and energy consumption with the sensing time , respectively, as (A2) and (A3):
Secondly, we calculate the derivation function of EE as (A4)
In (A4), obviously decreases with τ, and is a function monotonously increasing with τ. Then, we analyze the limit of derivation at two edges of sensing time as (A6)–(A9):
As the sensing time arrives at the maximum in (A8), ignoring the slight effect on the false alarm probability caused by the reporting time constraint, we consider ≈ 1. Thus, (A8) approaches to 0. Substituting (A5)–(A8) into (A4), we obtain:
Obviously, as < 0, we have , < 0. From (A4), it is implied that EE has one unique local optimum on . With extensive derivations, we define this point as the global maximum τ* where is positive on the range , ) and negative on .
References
- Shi, Z.; Teh, K.C.; Li, K.H. Energy-efficient joint design of sensing and transmission durations for protection of primary user in cognitive radio systems. IEEE Commun. Lett. 2013, 17, 565–568. [Google Scholar] [CrossRef]
- Wang, N.; Gao, W.; Zhang, X. Adaptive spectrum sensing algorithm under different primary user utilizations. IEEE Commun. Lett. 2009, 17, 1838–1841. [Google Scholar] [CrossRef]
- Awin, F.; Abdel-Raheem, E.; Ahmadi, M. Joint optimal transmission power and sensing time for energy efficient spectrum sensing in cognitive radio system. IEEE Sens. J. 2017, 17, 369–376. [Google Scholar] [CrossRef]
- Peh, E.C.; Liang, Y.C.; Guan, Y.L.; Pei, Y. Energy-efficient cooperative spectrum sensing in cognitive radio networks. In Proceedings of the 2011 IEEE global telecommunications conference-GLOBECOM 2011, Houston, TX, USA, 5–9 December 2011; pp. 1–5. [Google Scholar] [CrossRef]
- Song, Y.; Zhang, F.; Shao, Y.B. Energy efficiency and throughput optimization of cognitive relay networks. J. Comput. Inf. Technol. 2014, 22, 151–158. [Google Scholar] [CrossRef] [Green Version]
- Zhang, J.; Zheng, F.C.; Gao, X.Q.; Zhu, H.B. Sensing-energy efficiency tradeoff for cognitive radio networks. IET Commun. 2014, 8, 3414–3423. [Google Scholar] [CrossRef]
- Hu, H.; Zhang, H.; Yu, H.; Chen, Y. Spectrum-energy-efficient sensing with novel frame structure in cognitive radio networks. AEU-Int. J. Electron. Commun. 2014, 68, 1065–1072. [Google Scholar] [CrossRef]
- Kishore, R.; Ramesha, C.K.; Gurugopinath, S.; Sangodkar, E. Energy efficiency optimization for superior selective reporting-based spectrum sensing. In Proceedings of the 2017 IEEE 28th Annual International Symposium on Personal, Indoor, and Mobile Radio Communications (PIMRC), Montreal, QC, Canada, 8–13 October 2017; pp. 1–8. [Google Scholar] [CrossRef]
- Tian, Y.; Xu, W.; Li, S.; Guo, L.; Lin, J. Energy-efficient power and sensing/transmission duration optimization with cooperative sensing in cognitive radio networks. In Proceedings of the 2014 IEEE Wireless Communications and Networking Conference (WCNC), Istanbul, Turkey, 6–9 April 2014; pp. 695–700. [Google Scholar] [CrossRef]
- Huang, S.; Chen, H.; Zhang, Y.; Chen, H.H. Sensing-energy tradeoff in cognitive radio networks with relays. IEEE Syst. J. 2013, 7, 68–76. [Google Scholar] [CrossRef]
- Wang, Y.; Xu, W.; Yang, K.; Lin, J. Optimal energy-efficient power allocation for ofdm-based cognitive radio networks. IEEE Commun. Lett. 2012, 16, 1420–1423. [Google Scholar] [CrossRef]
- Sasikumar, S.; Jayakumari, J. A novel method for the optimization of Spectral-Energy efficiency tradeoff in 5 G heterogeneous Cognitive Radio Network. Comput. Netw. 2020, 180, 107389. [Google Scholar] [CrossRef]
- Santhoshkumar, M.; Premkumar, K. Energy-throughput tradeoff with optimal sensing order in cognitive radio networks. In Proceedings of the 2020 International Conference on COMmunication Systems & NETworkS (COMSNETS), Bengaluru, India, 7–11 January 2020; pp. 602–605. [Google Scholar] [CrossRef]
- Khalaf, O.I.; Ogudo, K.A.; Singh, M. A Fuzzy-Based Optimization Technique for the Energy and Spectrum Efficiencies Trade-Off in Cognitive Radio-Enabled 5G Network. Symmetry 2021, 13, 47. [Google Scholar] [CrossRef]
- Moorth, Y.K.; Pillai, S.S. Novel design of sensing and transmission duration in cognitive radios for energy efficiency. In Proceedings of the 2017 IEEE Wireless Communications, Signal. Processing and Networking (WiSPNET), Chennai, India, 22–24 March 2017; pp. 112–116. [Google Scholar] [CrossRef]
- Sheng, X.; Wang, S. Sensing-Transmission Tradeoff for Multimedia Transmission in Cognitive Radio Networks. In Proceedings of the GLOBECOM 2020–2020 IEEE Global Communications Conference, Taipei, Taiwan, 7–11 December 2020; pp. 1–6. [Google Scholar] [CrossRef]
- Toma, O.H.; Lopez-Benitez, M.; Patel, D.K.; Umebayashi, K. Estimation of primary channel activity statistics in cognitive radio based on imperfect spectrum sensing. IEEE Trans. Commun. 2020, 68, 2016–2031. [Google Scholar] [CrossRef]
- Ostovar, A.; Zikria, Y.B.; Kim, H.S.; Ali, R. Optimization of Resource Allocation Model with Energy-Efficient Cooperative Sensing in Green Cognitive Radio Networks. IEEE Access 2020, 8, 141594–141610. [Google Scholar] [CrossRef]
- Soni, B.; Patel, D.K.; Lopez-Benitez, M. Long short-term memory based spectrum sensing scheme for cognitive radio using primary activity statistics. IEEE Access 2020, 8, 97437–97451. [Google Scholar] [CrossRef]
- Hu, J.; Li, G.; Bian, D.; Shi, S.; Ge, R.; Gou, L. Energy-efficient cooperative spectrum sensing in cognitive satellite terrestrial networks. IEEE Access 2020, 8, 161396–161405. [Google Scholar] [CrossRef]
- Gao, Y.; Xu, W.; Yang, K.; Niu, K.; Lin, J. Energy-efficient transmission with cooperative spectrum sensing in cognitive radio networks. In Proceedings of the 2013 IEEE wireless communications and networking conference (WCNC), Shanghai, China, 7–10 April 2013; pp. 7–12. [Google Scholar] [CrossRef]
- Peh, E.C.; Liang, Y.C.; Guan, Y.L.; Zeng, Y. Optimization of cooperative sensing in cognitive radio networks: A sensing-throughput tradeoff view. IEEE Trans. Veh. Technol. 2009, 58, 5294–5299. [Google Scholar] [CrossRef]
- MacDonald, S.L.; Popescu, D.C. Impact of primary user activity on the performance of energy-based spectrum sensing in cognitive radio systems. In Proceedings of the 2013 IEEE Global Communications Conference (GLOBECOM), Atlanta, GA, USA, 9–13 December 2013; pp. 3224–3228. [Google Scholar] [CrossRef]
- Ssajjabbi Muwonge, B.; Pei, T.; Sansa Otim, J.; Mayambala, F. A Joint Power, Delay and Rate Optimization Model for Secondary Users in Cognitive Radio Sensor Networks. Sensors 2020, 20, 4907. [Google Scholar] [CrossRef] [PubMed]
- Macdonald, S.; Popescu, D.C.; Popescu, O. Analyzing the performance of spectrum sensing in cognitive radio systems with dynamic primary user activity. IEEE Commun. Lett. 2017, 21, 2037–2040. [Google Scholar] [CrossRef]
- Zheng, M.; Chen, L.; Liang, W.; Yu, H.; Wu, J. Energy-efficiency maximization for cooperative spectrum sensing in cognitive sensor networks. IEEE Trans. Green Commun. Netw. 2016, 1, 29–39. [Google Scholar] [CrossRef]
- Liang, Y.C.; Zeng, Y.; Peh, E.C.; Hoang, A.T. Sensing-throughput tradeoff for cognitive radio networks. IEEE Trans. Wirel. Commun. 2008, 7, 1326–1337. [Google Scholar]
- Saleem, Y.; Rehmani, M.H. Primary radio user activity models for cognitive radio networks: A survey. J. Netw. Comput. Appl. 2014, 43, 1–16. [Google Scholar] [CrossRef]
- Liang, J.; Dai, J.; Liu, Y.; Zhou, X.; Xu, M. Energy-efficient analysis of cooperative spectrum sensing in CRN. In Proceedings of the 11th International Conference on Wireless Communications, Networking and Mobile Computing (WiCOM 2015), Shanghai, China, 21–23 September 2015; pp. 1–5. [Google Scholar] [CrossRef]
- Wang, Y.; Ren, P.; Du, Q.; Sun, L. Power allocation for cognitive radio networks with statistical QoS provisioning of primary users. In Proceedings of the 2015 IEEE International Conference on Communications (ICC), London, UK, 8–12 June 2015; pp. 7719–7724. [Google Scholar] [CrossRef]
- Quach, T.X.; Tran, H.; Uhlemann, E.; Truc, M.T. Secrecy performance of cooperative cognitive radio networks under joint secrecy outage and primary user interference constraints. IEEE Access 2020, 8, 18442–18455. [Google Scholar] [CrossRef]
- Zhang, W.; Yeo, C.K.; Li, Y. A MAC sensing protocol design for data transmission with more protection to primary users. IEEE Trans. Mob. Comput. 2012, 12, 621–632. [Google Scholar] [CrossRef]
- Papadopoulos, A.; Chatzidiamantis, N.D.; Georgiadis, L. Network coding techniques for primary-secondary user cooperation in cognitive radio networks. IEEE Trans. Wirel. Commun. 2020, 19, 4195–4208. [Google Scholar] [CrossRef]
- Bhowmick, A.; Yadav, K.; Roy, S.D.; Kundu, S. Throughput of an energy harvesting cognitive radio network based on prediction of primary user. IEEE Trans. Veh. Technol. 2017, 66, 8119–8128. [Google Scholar] [CrossRef]
- Kang, X.; Garg, H.; Liang, Y.; Zhang, R. Optimal power allocation for ofdm-based cognitive radio with new primary transmission protection criteria. IEEE Trans. Wirel. Commun. 2010, 9, 2066–2075. [Google Scholar] [CrossRef]
- Ngo, D.T.; Tellambura, C.; Nguyen, H.H. Resource allocation for ofdma-based cognitive radio multicast networks with primary user activity consideration. IEEE Trans. Veh. Technol. 2010, 59, 1668–1679. [Google Scholar] [CrossRef]
- Wang, B.; Liu, K.R.; Clancy, T.C. Evolutionary game framework for behavior dynamics in cooperative spectrum sensing. In Proceedings of the IEEE GLOBECOM 2008–2008 IEEE Global Telecommunications Conference, New Orleans, LA, USA, 30 November–4 December 2008; pp. 1–5. [Google Scholar] [CrossRef]
- Yang, T.; Esseghir, M.; Khoukhi, L. An Evolutionary Game Approach towards Energy-Activated Cooperative Spectrum Sensing. In Proceedings of the 2018 IEEE 88th Vehicular Technology Conference (VTC-Fall), Chicago, IL, USA, 27–30 August 2018; pp. 1–5. [Google Scholar] [CrossRef]


Publisher’s Note: MDPI stays neutral with regard to jurisdictional claims in published maps and institutional affiliations. |
© 2021 by the authors. Licensee MDPI, Basel, Switzerland. This article is an open access article distributed under the terms and conditions of the Creative Commons Attribution (CC BY) license (https://creativecommons.org/licenses/by/4.0/).