Abstract
In this paper, the energy performance of a university campus in a tropical climate is assessed, and four mixed classroom buildings are compared using benchmarking methods based on simple normalization: the classic Energy Use Intensity (EUI), end-used based EUI, and people-based EUI. To estimate the energy consumption of the case studies, building energy simulations were carried out in EnergyPlus using custom inputs. The analysis found that buildings with more classroom spaces presented higher energy consumption for cooling and lighting than others. In comparison, buildings with a greater percentage of laboratories and offices exhibited higher energy consumption for plug loads. Nevertheless, differences were identified when using the people-based EUI since buildings with larger floor areas showed the highest values, highlighting the impact of occupant behavior on energy consumption. Given the fact that little is known about a benchmark range for university campuses and academic buildings in hot and humid climates, this paper also provides a comparison against the EUIs reported in the literature for both cases. In this sense, the identified range for campuses was 49–367 kWh/m/year, while for academic buildings, the range was 47–628 kWh/m/year. Overall, the findings of this study could contribute to identifying better-targeted energy efficiency strategies for the studied buildings in the future by assessing their performance under different indicators and drawing a benchmark to compare similar buildings in hot and humid climates.
1. Introduction
The assessment of the energy performance of existing and new buildings is of paramount importance for minimizing the energy consumption of this sector. This is due to the fact that buildings and their related sectors consume about 35% of the global energy and are responsible for about 38% of global greenhouse gas (GHG) emissions [1]. The latter makes this sector the largest source of carbon dioxide emissions [2]. The energy use in a building is directly influenced by its physical characteristics such as geometry, envelope, and systems [3]. Several studies have shown that about 70% of energy consumption in buildings comes from HVAC systems (around 50%) and artificial lighting (around 20%) [4,5,6,7,8]. In hot and humid cities, the use of air conditioners considerably increases the energy consumption of buildings, and this can also be exacerbated by the urban heat island effect [3,9].
Within the building sector, educational buildings worldwide have evidenced high energy consumption. For instance, university buildings in the USA account for about 13% of the total building energy consumption, with teaching buildings being key drivers of this due to their schedules and occupancy densities [10]. Similarly, in China, Liu and Ren reported that colleges and universities use 8% of the total energy consumed by Chinese society [11]. They also mentioned that university students consume four times more energy than the average Chinese citizen. To overcome this issue, higher education institutes are investing in improving the energy efficiency (EE) of their campuses through implementing sustainability programs, pursuing a low carbon economy [12], and enhancing their prestige in the national and international context [13].
Among the strategies that higher education institutes are implementing to improve the sustainability of their campuses are those related to EE and those for energy conservation [14]. Nevertheless, measures should not only involve technical improvements such as those mentioned above but should also focus on scheduling and occupancy, which vary from campus to campus. In this sense, changing the academic calendar from semester to trimester resulted in a reduction in annual energy consumption of about 5%, as observed at Griffith University [15]. However, regardless of the selected strategies to improve energy use in buildings, indicators are required to measure building performance against a reference.
Energy Use Intensity (EUI) is one of the most used indicators to evaluate the energy performance of buildings [16,17]. It results from the ratio between the annual energy consumption of the building and its total floor area [18]. Using the EUI, it is possible to perform benchmarking analysis, which refers to comparing buildings from the same uses and located in similar climate zones [19]. In this sense, building energy benchmarking is a reference point for how efficient the buildings are, enabling the possibility of proposing energy efficiency strategies. In the context of educational buildings, there are several references worldwide. In the USA, the mean EUI for educational buildings from climates 1A (very hot and humid) and 2A (hot and humid) is about 420 kWh/m/year [20]. If only electricity use is considered, they account for a mean index of about 130 kWh/m/year [20]. In Europe, the EUI of these buildings ranges between 150 and 250 kWh/m/year [21]. In the Ecuadorian Coast, a study carried out in 123 primary schools determined a median EUI of about 14 kWh/m/year [19].
Several methodologies on building energy benchmarking have been proposed in the pursuit of finding better alternatives for comparison among buildings [17,22]. For instance, Li and Chen investigated the correlation between the EUI of 24 higher education buildings and the percentages of the areas destined for different uses [23]. Through a regression model, the authors found that laboratory spaces were major contributors to energy consumption compared to public and school spaces. A similar approach was performed by Khoshbakht et al. [13], where the authors compared 80 higher education buildings using an EUI based on their different academic activities. Their findings indicated that research buildings were more energy-consuming than others, presenting a maximum EUI of more than 200 kWh/m/year. Furthermore, other benchmarking methods have focused on comparing buildings by the disaggregation of their EUIs [2] or normalizing the annual energy consumption by people instead of floor area [24,25].
In this study, the energy performance of the ESPOL campus located in the tropical climate of Guayaquil, Ecuador was evaluated, and the results from the energy modeling of four existing classroom buildings were introduced. The research aims to compare these buildings using different Energy Use Intensity (EUI)-based indicators. The conclusions of this paper are relevant to establishing a benchmark for university buildings since, in general, little is known about this topic in hot and humid climates, particularly for the case of the Ecuadorian Coast. Hence, better-targeted energy efficiency measures could be proposed for these buildings in the future, considering the results that emerge from the evaluation with the different indicators.
This paper is structured as follows. In Section 2, the case study and the analyzed buildings are described, the procedure to perform the building energy models in EnergyPlus is explained, and the benchmarking methods to compare the buildings under study are introduced. In Section 3, the obtained results are presented, including the assessment of the energy performance of the case study, the estimation of the annual energy consumption, and the benchmarking analysis. In Section 4, the results are briefly discussed. Finally, in Section 5, some conclusions about this work are drawn.
2. Methodology
In this section, the case study is described, and the inputs for assessing the energy performance of the selected buildings are reported in more detail. Furthermore, the three methods used for the building energy benchmarking analysis are presented.
2.1. Case Study
ESPOL is an Ecuadorian Public University located on the south coast of Ecuador [26], in the city of Guayaquil (2°851.08 S, 79°5752.21 W). Guayaquil has a very hot and humid climate, presenting more than 5000 cooling degree days (CDD 10 °C) [27]. This climate is also included within the group Aw of the Köppen–Geiger classification [28].The latter corresponds to a tropical savannah climate characterized by having two seasons: wet (January–April) and dry (May–December). The typical meteorological conditions in the surroundings of the case study are depicted in Figure 1. The monthly minimum temperatures are greater than 18 °C, the monthly average oscillates between 23.4 °C and 26.5 °C, and the monthly maximum is above 30 °C. Monthly average humidity values range from 63% to 76%. The monthly average solar radiation values are over 3.4 kWh/m and below 5.4 kWh/m.
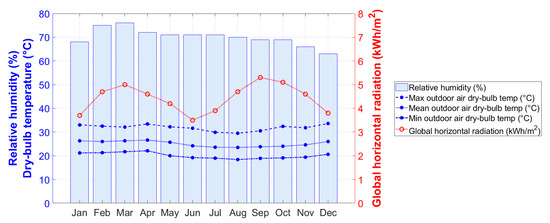
Figure 1.
Climate conditions in Guayaquil, Ecuador for the typical meteorological year (TMY, source: Meteonorm 7.3.4).
The ESPOL campus spreads over an area of about 703 ha (see Figure 2). It consists of 106 buildings of different types, including classrooms, laboratories, restaurants, and other spaces, as listed in Table 1, accounting for a total building area of about 154,564 m. The primary energy source used on campus is electricity. On this basis, the monthly electricity consumption of the last four years is summarized in Table 2 and includes the energy for street lighting (around 2% of the total) and buildings. In 2020, the total campus electricity consumption decreased by about 40% due to the COVID-19 pandemic; therefore, this year was not considered for the analysis.
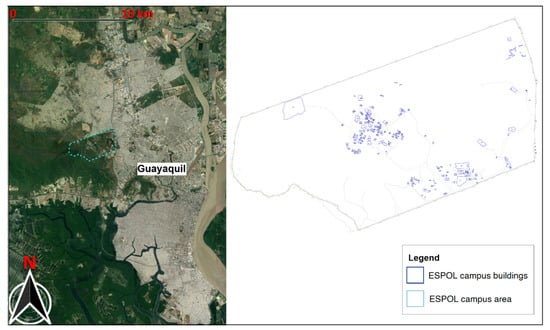
Figure 2.
ESPOL campus area in Guayaquil and its buildings.

Table 1.
Number of buildings in ESPOL campus according to their type and total built-up area.
Table 2.
Monthly electricity consumption of ESPOL campus from 2017 to 2020.
To assess the energy performance of the ESPOL campus, available data from 2017 to 2020 were collected. In this sense, Table 3 lists the total number of occupants, the electricity consumed by buildings, and the CDD per year. The annual CDD was calculated using Equation (1). The plus symbol (+) indicates that only positive values are considered for the calculations of the CDD. In this case, was defined as 18.3 °C, which agrees with the base temperature recommended for different hot climates [29] and by IEA [30].
where T is the daily mean temperature; is the reference or base temperature, which indicates that cooling is required when outdoor temperatures are above it; and N is the number of days in a year.
Table 3.
Annual cooling needs, building electricity consumption, and number of occupants of ESPOL campus from 2017 to 2020.
ESPOL started its sustainability program in 2018, intending to contribute to the UN’s Sustainable Development Goals (SDGs) [31]. The action plan is focused on reducing the carbon footprint of the campus through the implementation of diverse initiatives such as the construction of a bike lane, the replacement of fluorescent lighting with LED systems, and the use of renewable energies [32]. According to Criollo et al. [33], 66% of the GHG emissions source in the ESPOL campus comes from electricity, which is mostly used to supply air conditioners in buildings. Currently, the ESPOL administration has started the installation of energy meters in every building since before there was only a general meter for the whole campus; therefore, the consumption of each building is unknown yet. In this regard, the development of energy models of the most energy-intensive buildings on campus is key to determining rapid actions to improve their energy efficiency.
2.2. Energy Models: Classroom Buildings
In order to evaluate the performance of the campus buildings in more detail, four mixed classroom buildings were selected on the basis that these are among the most energy-consuming buildings that include teaching areas. Figure 3 shows the four classrooms that were modeled and compared in this study. Building 1 (Figure 3a) has an area of about 983 m, with 70% being classrooms and the remaining area corresponding to public spaces such as corridors and bathrooms. Building 2 (Figure 3b) has an area about 1912 m, of which 40% is classrooms, 15% is laboratories, 8% is offices, 31% is public spaces, and 6% is others (storage rooms). Building 3 (Figure 3c) has an area of about 5800 m, of which 23% is offices, 13% is laboratories, 10% is classrooms, 38% is public spaces, and the remaining is included within other spaces. Building 4 (Figure 3d) has an area about 7086 m, of which 46% is classrooms, 5% is laboratories, 7% is offices, 36% is public spaces, and the rest corresponds to other spaces. Besides, the buildings under study presented similar building materials based on masonry construction. In this regard, the external walls are formed by 10 cm thick concrete blocks. Exterior windows are composed of single-pane glasses and metal frames, with a typical U-value of 5.8 W/m-K. Roofs are from reinforced concrete in all cases. Building 1 has a window-to-wall ratio (WWR) of 17%, Building 2 has a ratio of 5%, Building 3 has a ratio of 5%, and Building 4 has a ratio of 11%.
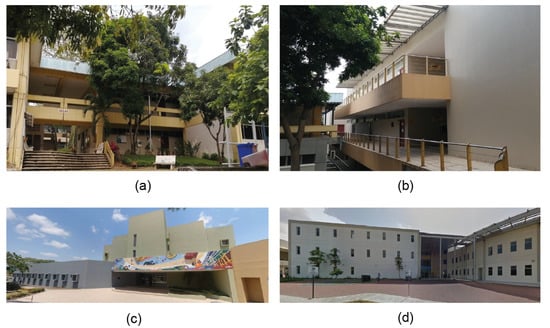
Figure 3.
Classrooms under study (a) Building 1, (b) Building 2, (c) Building 3, and (d) Building 4.
Internal heat gains of the buildings—i.e., lighting, plug loads, and people—were defined based on observations made during on-site inspections. Figure 4 summarizes the total installed power by story of each building. As observed, the lighting load is composed of LED and fluorescent technologies in all cases. Similarly, plug loads result from the sum of the office equipment, appliances, and miscellaneous loads. Office equipment refers to computers, printing machines, and other related devices. Appliances encompass devices such as microwaves, coffee makers, or similar. Miscellaneous loads include Wi-Fi devices, audio equipment, and others. All loads in Figure 4 were collected during on-site inspections. Table 4 summarizes the total installed power in terms of lighting and plug loads in each building. Moreover, the maximum occupancy for each case is also included in the table and was estimated assuming that classrooms and laboratories are 80% occupied. Regarding office spaces, the number of people is fixed and corresponds to the workers that occupy these spaces.
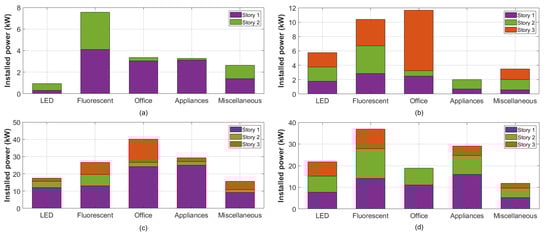
Figure 4.
Lighting and plug loads. Installed power in (a) Building 1, (b) Building 2, (c) Building 3, and (d) Building 4.
Table 4.
Building internal heat gains: total installed power and people.
Different schedules were set considering the space types and their activities. For instance, schedules in office spaces were fixed from 8:00 to 16:30 during the weekdays. On the other hand, schedules in classrooms and laboratories varied between 7:30 and 20:30 during the weekdays. Spaces classified as others did not present uniform schedules due to the fact that they are usually storage or mechanical/electrical rooms with low occupancy and use. Overall, lighting, plug loads, and occupancy schedules were built according to the indications of the users.
Due to its high temperatures and humidity, Guayaquil has a cooling-dominated climate. Therefore, HVAC systems for cooling are required during the whole year of operation of the buildings. The air-conditioners installed in the case studies are from the direct expansion (DX) technology, divided between splits and central units. During the inspections, it was observed that air-conditioners, both centralized and decentralized, are usually set by their users at 21 or 22 °C in all buildings. The air-conditioners’ operating hours in office spaces extend to 8 h. In classrooms and laboratories, this depends on the lecture schedules, as mentioned above. Table 5 lists the total installed capacity in each building.
Table 5.
Conditioned loads: total installed capacity by building.
Considering the above, simulations were carried out in OpenStudio v. 2.7 and EnergyPlus v. 9.1 software using a TMY weather file. Spaces and schedules were created using custom inputs, depending on each area. The thermal properties of building materials were established based on OpenStudio libraries and following previous works [34,35]. Lighting and plug loads were defined according to Figure 4 and Table 4. The thermostat set-points were set between 21 and 22 °C, and the coefficient of performance (COP) of the air-conditioners was set to 3. The air infiltration rate was assumed to be 0.54 ACH as in previous works [34,35]. Since all users are assumed to be performing light office activities while remaining seated, their activity level was set to 100 W/person. The accuracy of the EnergyPlus software has been previously validated through the BESTEST procedure [36]. The expected results should be consistent with the energy consumption estimated in previous studies conducted on the Ecuadorian coast [19,34,35].
2.3. Benchmarking
This study proposes three methods for building energy benchmarking: the classic Energy Use Intensity (EUI), an EUI based on the final end-uses, and an EUI based on the number of people in each building. All of these approaches correspond to a simple normalization method [17]. To calculate the EUI, Equation (2) is used.
where is the monthly total energy consumption, and is the total building floor area.
Similarly, the end-use-based EUIs are estimated via Equations (3) and (4) [2], while the people-based EUI is calculated via Equation (5).
For cooling,
where is the monthly total energy consumption for cooling.
For base loads,
where is the monthly total energy consumption for lighting and plug loads.
For people,
where is the total number of people in the building.
3. Results
In this section, the energy performance evaluation of the ESPOL campus and the results of the building simulation models are presented. Then, the building energy benchmarking analysis is conducted based on the three criteria proposed in the previous section.
3.1. Energy Performance of ESPOL Campus
The relationship between the annual energy consumption of the ESPOL campus buildings, the cooling requirements, and the number of occupants is shown in Figure 5 and expressed in Equation (6). As observed, the energy consumption is strongly dependent on these two parameters, similar to the results found in [37], which implies that every change in the number of occupants and climate can impact this. In this sense, the highest electricity consumption was reached in 2017 (13,143,660 kWh), when both parameters presented high values, and the sustainability program had not been launched. On the other hand, in 2018, energy consumption was lower, and savings of 5.4% were achieved (in reference to 2017), mainly due to the lower cooling requirements associated with a lower CDD. Based on the available data, the average EUI calculated for the ESPOL campus is 83 kWh/m/year. In terms of the normalized consumption per user, the average EUI is about 1073 kWh/student, while the EUI of an average Ecuadorian citizen was estimated as 1517 kWh per capita in 2019 according to the National Energy Balance [38].
where Y is the annual energy consumption in kWh, is the CDD (18.3 °C), and is the number of occupants.
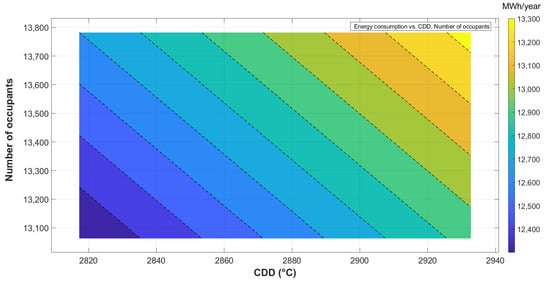
Figure 5.
Contour plot of the relationship between the energy consumption, CDD, and number of occupants.
3.2. Estimated Annual Energy Consumption of Modeled Buildings
The estimated annual energy consumption of the four case studies was obtained after running the building energy models in EnergyPlus. Table 6 summarizes the results obtained in each case. In this sense, Building 4 presented the highest energy consumption compared to the other buildings, accounting for about 752,994 kWh per year. On the other hand, Building 1 exhibited the lowest energy consumption, with 86,114 kWh per year. The obtained results from these models are within the expected energy consumption range determined for different building types located on the Ecuadorian coast; that is, on average, from 14 to 340 kWh/m/year [19]. Similarly, these results agree with what was previously estimated for other buildings from the ESPOL campus, which is around 90 kWh/m/year [34,35].
Table 6.
Annual energy consumption of each building.
Figure 6 shows the results of the estimated annual energy consumption by end-use of each building. As can be observed from Figure 6a, air-conditioners were responsible for 72% of the total energy consumption in Building 1. Lighting and plug loads occupied 16% and 12% of the total, respectively. Likewise, in Building 2 (Figure 6b) more than 60% of its total energy was used to power air-conditioners, while plug loads consumed 20% and lighting 15%. The results for Building 3 can be observed in Figure 6c. In this case, 63% of the total energy consumption was used for cooling, 30% for plug loads, and the remaining for lighting. Finally, in Building 4, 62% of the energy was used for cooling, 23% for lighting, and 15% for plug loads, as depicted in Figure 6d. Overall, the energy consumption for air-conditioners corresponded to a share of more than 60% in all buildings. In contrast, the energy consumption for plug loads increased in buildings with a lower proportion of classrooms as observed in Buildings 2 to 4.
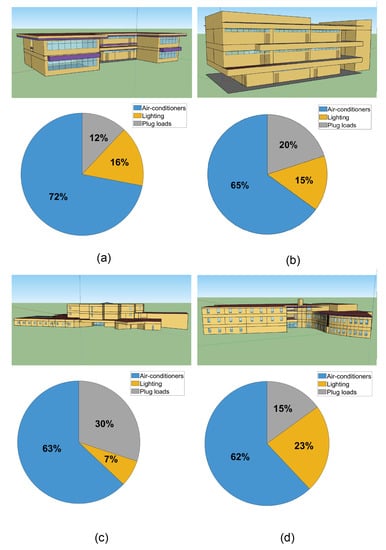
Figure 6.
Energy models and estimated annual share of energy by end-use: (a) Building 1, (b) Building 2, (c) Building 3, and (d) Building 4.
3.3. Energy Performance Indicators and Benchmarking
Figure 7 shows the EUI disaggregated by end-use for each analyzed building. As observed, the cooling EUI presented higher values during the months with higher temperatures in all cases. Additionally, Buildings 1 and 4 had similar cooling EUIs, and in both cases, lighting systems were more energy-consuming than plug loads. These buildings have in common the fact that the classroom area accounts for the largest floor area. On the other hand, Buildings 2 and 3 showed higher energy consumption for plug loads, which can be attributed to their larger office and laboratory spaces. Lighting and plug loads are considered to be base loads since they are almost constant throughout the year. In contrast, cooling loads vary according to the climate and exhibit higher values when the outside temperature and humidity are higher.
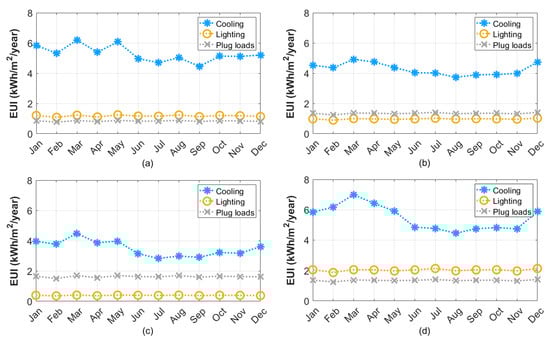
Figure 7.
EUI disaggregated by end-use: (a) Building 1, (b) Building 2, (c) Building 3, and (d) Building 4.
Table 7 shows the results from the three proposed energy performance indicators. From the point of view of the classic approach, Buildings 1 and 4 exhibited higher values for the EUI. This could indicate that these buildings are the most energy-consuming. However, this indicator does not consider the building loads, use, or occupancy, and therefore it is not easy to draw a general conclusion. Thus, introducing other indicators would be relevant to the development of better-targeted energy efficiency strategies since it has been observed that lighting and plug loads consume 12–50% of the energy in buildings [39] while air-conditioners consume 40–60% [40,41]. On the other hand, the building defines the activities and needs of the building and its occupants, playing a critical factor in total energy consumption [42]. Considering the above, end-use-based and people-based indicators were estimated to examine the energy performance of the studied buildings in more detail. In the case of the cooling-based EUI, Buildings 1 and 4 presented the highest values. Regarding the base load, EUI values indicated that Buildings 2 and 4 were the most consuming in terms of lighting and plug loads. Finally, the people-based EUI showed a different pattern since, in this case, Buildings 3 and 4 were the most energy-consuming.
Table 7.
Results from the three proposed indicators.
4. Discussion
Building energy benchmarking methods are widely used to evaluate the energy performance of related buildings from similar contexts. To be effective, the comparison must be between buildings of the same type due to their use and occupancy. Nevertheless, it is quite common to find mixed-use buildings in practice. If this is the case, those spaces could be analyzed independently according to their operation. An example of this is shown by Li and Chen [23]. Using regression analysis, the authors formulated an equation that allows the inclusion of the contribution of each space to the final EUI of the building. In this study, data limitations prevented a similar analysis. However, it was inferred that the space uses of the four buildings could explain the differences between their EUIs. The context in which the case study is located is also relevant and should be considered in the analysis. In fact, it has been observed that regional tariffs can influence the EUI, as reported by Chung and Yeung [43]. However, as stated by the authors, the results require careful analysis using more robust methods than simple normalization to draw final conclusions on this.
The potential of using EnergyPlus models for benchmarking has also been proved in the literature. As stated by Shabunko et al., these models have the advantage of generating time-series outputs of energy consumption, which are in agreement with observed data [44]. This could serve as an alternative when lacking actual disaggregated load data, and there is a need to start a pilot energy efficiency plan, as shown in this study. The resulting EUIs provide valuable information for the rapid identification of energy efficiency strategies that could be addressed in future retrofit projects or the modification of current operating settings in buildings. For instance, it is essential to change the temperature set-point of the air-conditioners in Buildings 1 and 4, since these presented higher cooling EUI values (see Table 7). Studies on this are available and should be taken into account to avoid compromising the thermal comfort of users when applying this measure [45]. Similarly, more efforts should be devoted to improving the occupants’ behavior in buildings with larger floor areas (Buildings 3 and 4) by implementing energy policies. In general, the estimated EUIs reported in this work set an upper limit for new buildings on the ESPOL campus, as these indexes can be expressed within the terms of reference of new projects.
As observed in Figure 5, energy consumption in buildings depends on several parameters related to their design and systems, but also on the number of occupants and their behavior [46,47]. In this sense, universities account for a large number of users, mainly students, which vary from one year to another. The latter not only increases the latent loads of the buildings and therefore the energy for cooling, but also makes it difficult to predict and control the possible actions executed by the users that directly affect the energy consumption (i.e., opening windows, turning on/off lights or fans, and others). Particularly in classrooms, there may exist a hierarchical environment in which the teacher influences the general energy consumption of the space. This topic requires further exploration, as significant energy savings could be obtained by improving occupant behavior. Overall, it has been estimated that improving occupant behavior can result in energy savings of up to 20% [48].
Furthermore, this study supports evidence from earlier observations in hot and humid climates. When comparing these results with other studies, they were found to be in agreement. As observed in Table 8, most of the studies reported EUIs for different academic buildings and campuses. In general, we can note that the resulting ranges from our study are within the range of their studies: 49–637 kWh/m/year for university campuses and 47–628 kWh/m/year for academic buildings. Although the obtained results for ESPOL are close to the minimum in both ranges, this does not imply that this campus is more energy-efficient than the others, as each higher education institution differs in its administration and planning. Besides, studies in Table 8 rely only on the classic EUI, which complicated the comparison between indicators based on the number of people or energy end-uses.
Table 8.
Summary of some EUIs reported in the literature for university campuses and academic buildings.
5. Conclusions
In this study, the energy performance of a university campus and four existing university classrooms was evaluated. For this purpose, the available data of the campus electricity consumption were analyzed, and four classrooms were modeled in EnergyPlus, considering custom inputs. Subsequently, buildings were compared using three simple benchmarking approaches: the classic EUI, end-use based EUI, and people-based EUI. Through this comparison, a substantial difference was found in the energy performance of the studied buildings when considering different aspects.
Regarding the classic EUI, buildings with predominant classroom spaces (1 and 4) were found to be the most energy-consuming. Likewise, these buildings presented higher cooling and lighting EUIs than others, which can be attributed to their operating schedules. On the other hand, buildings with more extensive laboratory and office spaces (2 and 3) exhibited higher EUIs from plug loads compared to the others. The latter finding is due to the more extended use of equipment with higher loads in these areas. Finally, if we consider the people-based EUI results, Buildings 3 and 4 appeared less energy-efficient, having the characteristic in common that both have larger total floor areas than others. Overall, the results of this paper demonstrate that the energy efficiency of a building can be evaluated from different perspectives.
Identifying the most consuming space types within buildings could allow better-targeted energy efficiency measures to be proposed on a case-by-case basis and the elaboration of energy policies for buildings on campus. Similarly, the estimated EUIs can be set as an upper limit for new buildings, as these values can be expressed within the terms of reference of new projects. Moreover, when actual measurements are not available, these methods could be used as benchmarks to compare with related buildings located in similar contexts.
Author Contributions
Conceptualization, J.L.; methodology, J.L.; software, J.L.; validation, G.S.; formal analysis, J.L.; investigation, J.L. and R.H.-L.; resources, J.L., R.H.-L. and G.S.; writing—original draft preparation, J.L.; writing—review and editing, R.H.-L. and G.S.; visualization, J.L.; supervision, G.S. All authors have read and agreed to the published version of the manuscript.
Institutional Review Board Statement
Not applicable.
Informed Consent Statement
Not applicable.
Data Availability Statement
Data sharing not applicable.
Acknowledgments
The authors wish to thank ESPOL for providing the data to conduct this study.
Conflicts of Interest
The authors declare no conflict of interest.
Abbreviations
The following abbreviations are used in this manuscript:
| CDD | Cooling degree days |
| COP | Coefficient of performance |
| DX | Direct expansion |
| EE | Energy efficiency |
| EUI | Energy Use Intensity |
| GHG | Global greenhouse gas |
| HVAC | Heating, Ventilation, and Air-Conditioning |
| IEA | International Energy Agency |
| LED | Light-emitting diode |
| SDG | Sustainable Development Goal |
| UN | United Nations |
| WWR | Window-to-wall ratio |
| Nomenclature | |
| Total building floor area, m | |
| Monthly total energy consumption for cooling, kWh | |
| Monthly total energy consumption, kWh | |
| Monthly energy consumption for lighting, kWh | |
| Monthly energy consumption for plug loads, kWh | |
| N | Number of days in a year |
| Total number of people in the building | |
| Reference or base temperature, °C | |
| Daily mean temperature, °C | |
| Annual CDD ( = 18.3 °C) | |
| Number of occupants | |
| Y | Annual energy consumption, kWh |
References
- United Nations Environment Programme. 2020 Global Status Report for Buildings and Construction: Towards a Zero-emission, Efficient and Resilient Buildings and Construction Sector; Technical Report; United Nations Environment Programme: Nairobi, Kenya, 2020. [Google Scholar]
- Kim, D.W.; Kim, Y.M.; Lee, S.E. Development of an energy benchmarking database based on cost-effective energy performance indicators: Case study on public buildings in South Korea. Energy Build. 2019, 191, 104–116. [Google Scholar] [CrossRef]
- Ahn, Y.; Sohn, D.W. The effect of neighbourhood-level urban form on residential building energy use: A GIS-based model using building energy benchmarking data in Seattle. Energy Build. 2019, 196, 124–133. [Google Scholar] [CrossRef]
- Tian, Z.; Si, B.; Shi, X.; Fang, Z. An application of Bayesian Network approach for selecting energy efficient HVAC systems. J. Build. Eng. 2019, 25, 100796. [Google Scholar] [CrossRef]
- Jouhara, H.; Yang, J. Energy efficient HVAC systems. Energy Build. 2018, 179, 83–85. [Google Scholar] [CrossRef]
- Baloch, A.A.; Shaikh, P.H.; Shaikh, F.; Leghari, Z.H.; Mirjat, N.H.; Uqaili, M.A. Simulation tools application for artificial lighting in buildings. Renew. Sustain. Energy Rev. 2018, 82, 3007–3026. [Google Scholar] [CrossRef]
- Doulos, L.; Kontadakis, A.; Madias, E.; Sinou, M.; Tsangrassoulis, A. Minimizing energy consumption for artificial lighting in a typical classroom of a Hellenic public school aiming for near Zero Energy Building using LED DC luminaires and daylight harvesting systems. Energy Build. 2019, 194, 201–217. [Google Scholar] [CrossRef]
- Han, H.J.; Mehmood, M.U.; Ahmed, R.; Kim, Y.; Dutton, S.; Lim, S.H.; Chun, W. An advanced lighting system combining solar and an artificial light source for constant illumination and energy saving in buildings. Energy Build. 2019, 203, 109404. [Google Scholar] [CrossRef]
- Litardo, J.; Palme, M.; Borbor-Córdova, M.; Caiza, R.; Macías, J.; Hidalgo-León, R.; Soriano, G. Urban Heat Island intensity and buildings’ energy needs in Duran, Ecuador: Simulation studies and proposal of mitigation strategies. Sustain. Cities Soc. 2020, 62, 102387. [Google Scholar] [CrossRef]
- Sun, Y.; Luo, X.; Liu, X. Optimization of a university timetable considering building energy efficiency: An approach based on the building controls virtual test bed platform using a genetic algorithm. J. Build. Eng. 2021, 35, 102095. [Google Scholar] [CrossRef]
- Liu, Q.; Ren, J. Research on the building energy efficiency design strategy of Chinese universities based on green performance analysis. Energy Build. 2020, 224, 110242. [Google Scholar] [CrossRef]
- Yeo, J.; Wang, Y.; An, A.K.; Zhang, L. Estimation of energy efficiency for educational buildings in Hong Kong. J. Clean. Prod. 2019, 235, 453–460. [Google Scholar] [CrossRef]
- Khoshbakht, M.; Gou, Z.; Dupre, K. Energy use characteristics and benchmarking for higher education buildings. Energy Build. 2018, 164, 61–76. [Google Scholar] [CrossRef] [Green Version]
- Faghihi, V.; Hessami, A.R.; Ford, D.N. Sustainable campus improvement program design using energy efficiency and conservation. J. Clean. Prod. 2015, 107, 400–409. [Google Scholar] [CrossRef]
- Gui, X.; Gou, Z.; Lu, Y. Reducing university energy use beyond energy retrofitting: The academic calendar impacts. Energy Build. 2021, 231, 110647. [Google Scholar] [CrossRef]
- Arjunan, P.; Poolla, K.; Miller, C. EnergyStar++: Towards more accurate and explanatory building energy benchmarking. Appl. Energy 2020, 276, 115413. [Google Scholar] [CrossRef]
- Chung, W. Review of building energy-use performance benchmarking methodologies. Appl. Energy 2011, 88, 1470–1479. [Google Scholar] [CrossRef]
- Kim, S.C.; Shin, H.I.; Ahn, J. Energy performance analysis of airport terminal buildings by use of architectural, operational information and benchmark metrics. J. Air Transp. Manag. 2020, 83, 101762. [Google Scholar] [CrossRef]
- Vallejo, C.; Villacreses, G.; Vásquez, F.; Godoy, F. Evaluación Comparativa de los Consumos Energéticos de Edificaciones Públicas en la Región Costa y Galápagos; Instituto Nacional de Eficiencia Energértica y Energías Renovables (INER): Quito, Ecuador, 2018. [Google Scholar]
- U.S. Department of Energy. Building Performance Database 2021. 2021. Available online: https://bpd.lbl.gov/ (accessed on 5 September 2021).
- Economidou, M.; Atanasiu, B.; Despret, C.; Maio, J.; Nolte, I.; Rapf, O.; Laustsen, J.; Ruyssevelt, P.; Staniaszek, D.; Strong, D.; et al. Europe’s Buildings under the Microscope. A Country-by-Country Review of the Energy Performance of Buildings. 2011. Available online: http://dl.dropbox.com/u/4399528/BPIE/LR_%20CbC_study.pdforfromhttp://www.bpie.eu/eu_buildings_under_microscope.html (accessed on 5 September 2021).
- Borgstein, E.H.; Lamberts, R. Developing energy consumption benchmarks for buildings: Bank branches in Brazil. Energy Build. 2014, 82, 82–91. [Google Scholar] [CrossRef]
- Li, S.; Chen, Y. Internal benchmarking of higher education buildings using the floor-area percentages of different space usages. Energy Build. 2021, 231, 110574. [Google Scholar] [CrossRef]
- Wang, J.C. A study on the energy performance of school buildings in Taiwan. Energy Build. 2016, 133, 810–822. [Google Scholar] [CrossRef]
- Wang, J.C. Analysis of Energy Use Intensity and greenhouse gas emissions for universities in Taiwan. J. Clean. Prod. 2019, 241, 118363. [Google Scholar] [CrossRef]
- ESPOL. Escuela Superior Politecnica del Litoral. Available online: https://www.espol.edu.ec/ (accessed on 5 September 2021).
- Ministerio de Desarrollo Urbano y Vivienda, NEC-HS-EE: Eficiencia Energetica; Available online: https://www.habitatyvivienda.gob.ec/ (accessed on 5 September 2021).
- Peel, M.C.; Finlayson, B.L.; McMahon, T.A. Updated world map of the Köppen-Geiger climate classification. Hydrol. Earth Syst. Sci. 2007, 11, 1633–1644. [Google Scholar] [CrossRef] [Green Version]
- Bhatnagar, M.; Mathur, J.; Garg, V. Determining base temperature for heating and cooling degree-days for India. J. Build. Eng. 2018, 18, 270–280. [Google Scholar] [CrossRef]
- Slade, M. The Future of Cooling: Opportunities for Energy-Efficient Air Conditioning. In Report of the International Energy Agency; International Energy Agency: Paris, France, 2018. [Google Scholar]
- United Nations. THE 17 GOALS. Available online: https://sdgs.un.org/es/goals (accessed on 25 June 2021).
- ESPOL. Sostenibilidad ESPOL. Available online: https://www.espol.edu.ec/es/la-espol/sostenibilidad/areas-de-trabajo/operacional (accessed on 5 September 2021).
- Criollo, N.P.; Ramirez, A.D.; Salas, D.A.; Andrade, R. The Role of Higher Education Institutions Regarding Climate Change: The Case of Escuela Superior Politécnica del Litoral and its Carbon Footprint in Ecuador. In ASME International Mechanical Engineering Congress and Exposition; American Society of Mechanical Engineers: New York, NY, USA, 2019; Volume 59421, p. V005T07A025. [Google Scholar]
- Litardo, J.; Hidalgo-León, R.; Macías, J.; Delgado, K.; Soriano, G. Estimating energy consumption and conservation measures for ESPOL Campus main building model using EnergyPlus. In Proceedings of the 2019 IEEE 39th Central America and Panama Convention (CONCAPAN XXXIX), Guatemala City, GT, USA, 20–22 November 2019; pp. 1–6. [Google Scholar]
- Litardo, J.; Palme, M.; Hidalgo-León, R.; Amoroso, F.; Soriano, G. Energy Saving Strategies and On-Site Power Generation in a University Building from a Tropical Climate. Appl. Sci. 2021, 11, 542. [Google Scholar] [CrossRef]
- ASHRAE. Energy estimating and modeling methods. In ASHRAE Handbook-Fundamentals; ASHRAE: Atlanta, GA, USA, 2017; Chapter 19. [Google Scholar]
- Chihib, M.; Salmerón-Manzano, E.; Manzano-Agugliaro, F. Benchmarking energy use at University of Almeria (Spain). Sustainability 2020, 12, 1336. [Google Scholar] [CrossRef] [Green Version]
- Ministerio de Energia y Recursos Naturales No Renovables. Balance Energetico Nacional 2020. Available online: www.recursosyenergia.gob.ec (accessed on 5 September 2021).
- Anand, P.; Deb, C.; Ke, Y.; Yang, J.; Cheong, D.; Sekhar, C. Occupancy-based energy consumption modelling using machine learning algorithms for institutional buildings. Energy Build. 2021, 252, 111478. [Google Scholar] [CrossRef]
- Shi, H.; Chen, Q. Building energy management decision-making in the real world: A comparative study of HVAC cooling strategies. J. Build. Eng. 2021, 33, 101869. [Google Scholar] [CrossRef]
- Hidalgo-León, R.; Litardo, J.; Urquizo, J.; Moreira, D.; Singh, P.; Soriano, G. Some factors involved in the improvement of building energy consumption: A brief review. In Proceedings of the 2019 IEEE Fourth Ecuador Technical Chapters Meeting (ETCM), Guayaquil, Ecuador, 13–15 November 2019; pp. 1–6. [Google Scholar] [CrossRef]
- Delzendeh, E.; Wu, S.; Lee, A.; Zhou, Y. The impact of occupants’ behaviours on building energy analysis: A research review. Renew. Sustain. Energy Rev. 2017, 80, 1061–1071. [Google Scholar] [CrossRef]
- Chung, W.; Yeung, I.M. A two-stage regression-based benchmarking approach to evaluate school’s energy efficiency in different tariff regions. Energy Sustain. Dev. 2021, 61, 15–27. [Google Scholar] [CrossRef]
- Shabunko, V.; Lim, C.; Mathew, S. EnergyPlus models for the benchmarking of residential buildings in Brunei Darussalam. Energy Build. 2018, 169, 507–516. [Google Scholar] [CrossRef]
- Guevara, G.; Soriano, G.; Mino-Rodriguez, I. Thermal comfort in university classrooms: An experimental study in the tropics. Build. Environ. 2021, 187, 107430. [Google Scholar] [CrossRef]
- Zhang, Y.; Bai, X.; Mills, F.P.; Pezzey, J.C. Rethinking the role of occupant behavior in building energy performance: A review. Energy Build. 2018, 172, 279–294. [Google Scholar] [CrossRef]
- Laaroussi, Y.; Bahrar, M.; El Mankibi, M.; Draoui, A.; Si-Larbi, A. Occupant presence and behavior: A major issue for building energy performance simulation and assessment. Sustain. Cities Soc. 2020, 63, 102420. [Google Scholar] [CrossRef]
- He, Z.; Hong, T.; Chou, S. A framework for estimating the energy-saving potential of occupant behaviour improvement. Appl. Energy 2021, 287, 116591. [Google Scholar] [CrossRef]
- University of Central Florida. Open Energy Information System. 2021. Available online: https://oeis.ucf.edu/ (accessed on 5 September 2021).
- National University of Singapore. NUS Sustainability Highlights 2019. Available online: https://uci.nus.edu.sg/oes/wp-content/uploads/sites/11/2020/10/NUS-Sustainability-Highlights-2019.pdf (accessed on 5 September 2021).
- Salvia, A.L.; Reginatto, G.; Brandli, L.L.; da Rocha, V.T.; Daneli, R.C.; Frandoloso, M.A. Analysis of energy consumption and efficiency at University of Passo Fundo—Brazil. In Towards Green Campus Operations; Springer: Cham, Swizterland, 2018; pp. 519–533. [Google Scholar]
- Building Construction Authority (BCA). BCA Building Energy Benchmarking Report 2020; 2020. Available online: https://www1.bca.gov.sg/docs/default-source/docs-corp-buildsg/sustainability/bca_bebr_abridged_fa_2020.pdf?sfvrsn=ea0f8\a99_8 (accessed on 5 September 2021).
- Chang, C.C.; Shi, W.; Mehta, P.; Dauwels, J. Life cycle energy assessment of university buildings in tropical climate. J. Clean. Prod. 2019, 239, 117930. [Google Scholar] [CrossRef]
Publisher’s Note: MDPI stays neutral with regard to jurisdictional claims in published maps and institutional affiliations. |
© 2021 by the authors. Licensee MDPI, Basel, Switzerland. This article is an open access article distributed under the terms and conditions of the Creative Commons Attribution (CC BY) license (https://creativecommons.org/licenses/by/4.0/).