Article

A Greater Share of Organic Agriculture in Relation to Food Security Resulting from the Energy Demand Obtained from Food—Scenarios for Poland until 2030

1
Department of Thermal Engineering and Industrial Facilities, Faculty of Mechanical Engineering, Opole University of Technology, Prószkowska 76, 45-758 Opole, Poland
2
Department of Economics, Finance, Regional and International Research, Faculty of Economics and Management, Opole University of Technology, Prószkowska 76, 45-758 Opole, Poland
*
Author to whom correspondence should be addressed.
Energies 2021, 14(21), 6959; https://doi.org/10.3390/en14216959
Submission received: 12 September 2021 / Revised: 15 October 2021 / Accepted: 15 October 2021 / Published: 22 October 2021
(This article belongs to the Topic Sustainable Development and Food Insecurity)

Abstract

:
In line with the assumptions of the European Green Deal, it is planned to allocate 25% of agricultural land to organic farming by 2030. However, the question arises: what share of organic farming and under what additional conditions is it able to feed the population of a given country? The aim of the article is to try to answer the above question for the example of Poland. In particular, the authors analyze: the problem of satisfying people’s nutritional needs, reducing food wastage, and finally the relationship between sustainable consumption and increasing the share of organic farming in Poland. Attention was also paid to possible potential changes in the agricultural land area with the growing share of organic farming. The proposed scenarios for the transition to organic farming concern the year 2030. We propose to increase the share in 20%, 40% and 60%, imposing them on changes in sustainable consumption of +/−25%, +/−50% and +/−75%. The available FAOSTAT (Statistic Data of the Food and Agriculture Organization of the United Nations) and Statistics Poland data from 2008–2018 were used for the analysis. The model scenario analysis showed that the total food demand will be met in most of the scenarios. It has also been shown that with a higher level of transition to organic farming, it becomes necessary to reduce food wastage. Changing the consumption style not only creates opportunities for a wider development of organic farming in Poland but can also generate free areas on arable land (e.g., even more than 26% of free area in the +/−75% scenario). This may create potential opportunities for their use in the production of consumer crops, but also in the protection of the natural and agricultural environment.

1. Introduction

Agriculture is part of the primary sector of the economy, i.e., one of the greatest importance. Its key function is to provide food, including high-quality food produced with respect for the environment. However, the surging human population poses challenges both to agricultural sustainability and food security [1]. Food security is defined as a situation: “when all people, at all times, have physical and economic access to sufficient, safe and nutritious food that meets their dietary needs and food preferences for an active and healthy life” [2]. Maintaining it can be a big challenge, while striving to significantly respect the environment in the field of agriculture. Two issues clash here: (1) the required increase in agricultural production resulting from population forecasts, an increase in the consumption of agricultural chemicals and the use of the environment; (2) the need to protect the environment and its resources, the health of consumers, and ensure their access to food of the highest quality.
Various studies emphasize that organic farming is capable of providing food of better quality than conventional agriculture [3,4,5,6,7]. Admittedly, some claim that organic agriculture on a larger scale may pose environmental threats (such as deforestation, due to the need to obtain new space for crops) [8,9]. However, organic farming practices are generally considered more beneficial to the environment and promote animal welfare. These aspects are important, but not the only ones. The availability of sufficient quantities of food of appropriate quality and access to adequate resources for acquiring appropriate foods for a nutritious diet is necessary [10]. They are a derivative of the production capacity of organic farms, the production efficiency of organic farming, but also the prices of organic food. An interesting analysis of the approach to the problem of food security in the context of organic farming is presented by Schreer and Padmanabhan [11]. They point to the important issue in Indonesia that there is a strong need to relax the regulatory control over the organic sector; all this to create space for products without a certificate of organic production but manufactured with respect for the environment. This may be beneficial for small, local agricultural producers, producing food that is safe for the environment and consumer health, but also to broaden an overall market of the so-called natural. In another study [12] also highlighted that organic farming can reduce global food insecurity. However, there is a threshold above which the combination of organic and conventional farming methods is most effective and organic farming alone cannot sustain production that will feed the human population.
Therefore, many of the concerns related to the provision of food security by organic farming are largely due to the possible insufficient supply of organic food. Hence, other important factors should be taken into account that may favor the wider development of organic farming and its importance in providing high-quality food and reducing waste, but also changing the style of consumption.
Thus, a key question in the debate on organic agriculture’s share in the future of the entire agricultural sector is whether it is capable, both globally and locally, of feeding a growing the human population, which is expected to reach 8.5 billion by 2030 [13].
There is a general tendency for utilised agricultural area and agricultural output to grow. From 2008 to 2018, total acreage increased globally by over 2% for cereals, nearly 19% for vegetables, 30.5% for leguminous plants, and 9% for oil crops (for oil crops: data for years 2008 to 2014). Global increase in output and yield per 1 hectare were as follows: cereals—output by 17.5%, yield by 15%; vegetables—output by 24%, yield by almost 18%; leguminous plants—output by 46%, yield by 12%; oil plants—output by 27.5%, yield by 9% [14]. Similar relationships are observed in animal production. Milk output for the aforementioned period rose by over 20%, total meat output by over 21%, and table egg output by more than 24% [14].
The role of agriculture is obviously far more substantial, since it supplies products for other sectors of economy, provides workplaces for many people [15,16,17], and generates environmental pollution [18,19,20], but may also improve its quality [21,22,23] or the health of its consumers [24,25,26].
An increase in global food production is surely a step forward to end world hunger. In the years 1995 to 2018 the supply of food has grown from 2663 to 2929 kcal/cap/day [27]. Those data may indicate an overall improvement in food security, or even suggest that the quantities of food consumed are excessive in proportion to the needs of the human body. Still, food is provided mainly by dominant conventional agriculture, the product quality of which often raises concerns. The fact is emphasised by Pretty [28], who points out that many people worldwide continue to starve. Many million people live on poor diets, i.e., either overeating or consuming poor-quality food. This affects both people and the natural environment.
Is contemporary conventional agriculture therefore sustainable in terms of quantity of food being produced and is the alternative system (organic agriculture in our analysis) capable of feeding the population (e.g., the population of Poland)?
A transition to green farming, including organic agriculture, may potentially contribute to an improvement in the food system. It is generally considered superior to conventional agriculture in terms of environmental, production, and economic sustainability, as well as farmers’ welfare [29]. Some researchers claim that organic agriculture is also capable of feeding a substantial part of human population [30,31]. However, on a global scale, this may entail using more space to grow consumer crops, a radical change in consumption styles (e.g., reducing meat intake), reduction in food wastage [9,32] or an implementation of proper cultivation techniques [33,34]. Studies demonstrate the possibility of increasing the share of ecological agriculture globally by maximum 40–60%, due to nitrogen deficiencies affecting organic agriculture [26].
EU environmental policy goals prove the importance of organic agriculture to feeding the population. The implementation of the European Green Deal (EGD) involves allocating 25% agricultural land to organic agriculture by 2030. Emphasis is put on the significant contribution of organic agriculture to environmental equivalence, stimulating demand for ecological food and increasing consumer confidence in this type of production and food [35].
The purpose of this publication is to analyse four problems, attempting to answer the following questions:
(1)
is organic agriculture (green farming) capable of feeding the population of Poland (i.e., supply the required amounts of kilocalories and protein), and what share of organic agriculture can guarantee this?
(2)
what possibilities for enhanced development of organic food production are created by the potential reduction of food wastage?
(3)
what effect can a change in the style of consumption (reduced intake of certain animal and plant products regarded as less healthy) have on a broader growth of organic farming?
(4)
what changes in utilized agricultural area may arise from the increasing share of organic agriculture?
For the purpose of analyzing the issues discussed in this article, we defined the so-called base year (mean statistical data for agricultural production in Poland from 2008 to 2018) and outlined possible food production change scenarios for 2030. Main sources of information in the present analyses include statistical data from FAOSTAT, Statistics Poland and previous analysis performed by the authors.
Our analysis refers exclusively to the realities of Polish agriculture. For the purpose of this study, we treat the country as a closed circuit. We assume that the entirety of native agricultural production must serve as potential food supply for the country’s residents and satisfy livestock feed requirements.
The present study does not analyze or assess any possible price variations, market effects of the conversion of agriculture to organic production or decisions made by farmers themselves. Such factors constitute a potential new research topic. Nevertheless, we emphasize that both EU and national support is immensely important to a broader development of organic agriculture in Poland.
Reasons why this particular subject has been chosen include:
(a)
absence of similar studies for Poland,
(b)
noticeable and ongoing changes in consumption patterns among Polish consumers, who increasingly look for organic farming products or products without certificates but naturally grown and sourced directly at the farm gate,
(c)
possible use of the results by decision-makers for the purpose of creating a healthier and more environmentally friendly agricultural production policy.
The few available studies on the subject focus mostly on the global scale [9,26,30,31,32,36,37], alternatively comparing the output of analyzed organic and conventional productions. However, it is worth taking a closer look at a given country’s capability to feed its population using food from its own organic production. This aspect is also discussed by Muller et al. [32], who stressed that local and regional statistics are required to gain a full picture of the problem.

2. Organic Farming in Polish Agriculture—General Information, Production, Selected Market Aspects

The history of organic agriculture in Poland goes back to 1930, when count Stanisław Karłowski implemented biodynamic farming on its land in Szalejewo near Gostynin. More recently, a substantial growth of organic farms and the area of their agricultural land (AL) began with Poland’s accession to the EU in 2004 and the associated financial support for ecological production. According to data available from Poland’s Agricultural and Food Quality Inspection (AFQI), the years 2004–2020 saw nearly a five-fold increase in the number of organic farms in Poland (total: certified and in the process of conversion) (from 3760 to 18,575) and over a six-fold increase in their AL (total: certified and in the process of conversion) (form 82,729.5 to 509,291.27 ha) (Figure 1). In the context of Poland’s agriculture, both the number of organic farms and their AL still constitute a small percentage. According to latest data from 2020, the area of land used for organic agriculture [38] corresponds to 3.47% of Poland’s total AL. Similar trends are observed worldwide.
In Poland, the proportion of AL for organic agriculture has evolved and has never been significant. It largely reflected Polish farmers’ environmental awareness, food market situation and the impact of the funding system. Since 2014 the area and number of organic farms in Poland have dropped noticeably. A number of them have naturally closed down, since many farmers did not intend to deliver products to the market but rather collect subsidies, and thus they did not meet the criteria of sustaining the production. Other reasons for the decline are stricter regulations applicable to organic agriculture, growing bureaucracy, lack of successors to work on farms and no tangible prospects for the development of a market for organic food grown in Poland. This is a trend of concern in the face of growing interest that Poles take in organic food, particularly in large urban areas [39]. It appears that following a period of fascination with industrially produced food, consumers are increasingly paying attention to the product’s origin [40]. Health and healthy diet concerns, as well as environmental or animal rights issues, are important factors in the purchase of ecological food [41]. Studies on consumers’ interest in organic food in Poland also suggest a relationship between ecological food consumption and care for health and safety. Of importance to consumers are also sensory aspects and the price of food [42,43,44].
Organic farms make up over 1.3% of all farms in Poland (as of 2019) [45]). The vast majority of them are small farms, often scattered and situated away from larger urban areas. Data available from AFQI show that in 2018 the share of smallest organic farms (up to 5 ha) in the total number of organic farms was relatively high (21%). Overall, organic farms of area from 1 to 20 ha constituted as much as 64.8%, whereas the largest ones (50 ha and more) only 12.6% of all organic farms in Poland [46]. These proportions are not beneficial in terms of the ability to produce organic food on a larger scale. According to the same body, in the years 2001–2018, agricultural plants (consumer and livestock feed crops) had on average the largest share in organic cultivation, followed by fruits and berries, and vegetables (Figure 2).
The relatively small percentage of vegetables grown (notwithstanding high subsidies and consumers’ interest in organic vegetables) is largely explained by the fact that they are labour-intensive. Higher mean percentage of orchards is a result of high EU subsidies per 1 ha and consumer demand for fruits. Agricultural crops on arable land (ArL) include mainly cereals, legumes, industrial crops, vegetables and a small proportion of herbs. A substantial part of cereals is used as animal feed. Agricultural crops also include animal feed production (green forage, hay).
According to the latest information available from AFQI for years 2017–2018, the structure of all AL was dominated by animal feed on ArL (27.2%), followed by cereals (25.55%), meadows and pastures (22.05%). These proportions clearly indicate the predominance of animal-feed crops in Polish organic agriculture (Figure 3).
Currently, the quantity of organic farming products in Poland rules out the possibility of feeding the majority of its population. Data available from AFQI for years 2017–2018 show output of selected organic products (Table 1) [46].
Polish organic output is a subject of many analyses [54,55,56,57,58], and the data presented here suggest output a few to several dozen per cent lower than in the case of conventional production.
De Ponti et al. found organic yields to be 21% lower in developed countries and 20% lower globally [59]. The present study also assumes the 25% difference and intends to demonstrate that the gap may be less significant if we consider a significant reduction in food wastage and the proposed change in Poland’s population dietary habits.
A measure of the position and significance or organic farms and organic agriculture is a well-developed organic food market. The global value of organic retail was over EUR 106 billion in 2019, and almost EUR 41.5 billion in EU alone. Taking into account the underdeveloped market, the value of organic food grown in Poland was EUR 314 million in 2019. Unfortunately, in Poland only 8 euros are spent each year per person on organic farming products, in comparison to EU average (84.4 EUR/cap) and global average (14 EUR/cap) [60].
About 32% Polish consumers are regular purchasers of organic food (at least once a month or once a week). 20% eat organic food occasionally and as many as 48% never buy this kind of food [61].
Subsidies play an important role in setting up new organic farms. Financial support promotes farms which supply food to the market. In line with Polish law [62], a subsidy may be obtained if 30% of consumer products is used for processing, for other farms or directly to the market.
Obviously, the above information, albeit providing an overview of the state and condition of Polish organic agriculture, does not offer an answer to the question whether the present system of agriculture is capable of feeding the population of Poland, and what share of organic farms is required.

3. Material and Methods

The analysis and results presented in this study follow up on the author’s research on Poles’ attempts to work towards a more sustainable production and food consumption. Sustainability is defined here both as use of domestic agricultural output for consumption and attempts to achieve lower food wastage levels and a change in consumption patterns (less meat and plant products of selected types). Sustainable consumption also involves purchasing local, organic products directly from a tried and trusted food supplier.
For the purpose of our analysis, we refer to the results of, and calculation methods and statistical data, applied in Kuczuk and Widera [63]. In that study it was shown, among other things, the method of creating the base year using statistical data, changes for the year adjusted 2030 for the forecast population, but also the type of data used in the calculations. Thus, the following assumptions were made in the aforementioned study:
the basis for all calculations included data from the so-called “base year” as mean data from the years 2008–2018,
the extrapolation of data for 2030, referred to as adjusted (or “corrected”) data, was performed with the assumption that the changes in the years used to construct the base year were stable; the adjective “adjusted” means that per capita data were adjusted according to the Statistics Poland’s population forecast for 2030,
the scenarios of transition to a more sustainable consumption entailed a reduction in the supply (and production), and consequently consumption, of selected types of meat (pork, beef and chicken poultry), cow’s milk, wheat flour and sugar by (−)25%, (−)50% and (−)75%, accompanied by an increase of supply and consumption of duck, goose, turkey, rabbit and sheep meat, as well as honey, by (+)25%, (+)50% and (+)75%, considered healthier for consumers,
possible change scenarios for agricultural product supply (production) were developed, referred to respectively as α   ϵ   { 25 % ,   50 % , 75 % } converted to g per capita/year, kcal per capita/year and g protein per capita/year, which may be supplied to consumers in Poland in 2030,
food wastage was assumed at the level of 40% of food supply [9,64].
Proposed consumption style change scenarios were maintained in the analysis of current research problems. Our previous analysis has been additionally expanded by an attempt to determine the possible extent of the transition of Polish agriculture to organic farming as well as various food wastage reduction levels. We continue to emphasize the number of kilocalories and protein required by the human body We constantly rely on the volume of agricultural production as well as the number of calories and protein estimated Kuczuk and Widera [63]. For the purpose of the current analysis, we add the following assumptions:
(a)
aside from the transition to sustainable consumption, we developed scenarios of a β   ϵ   { 20 % , 40 % ,   60 % } transition to organic production; due to the fact that conventional farming prevails in Poland, we treat Polish agriculture as a conventional system in its entirety, hence the departure point assuming 0% share of organic farming as a reference,
(b)
scenarios of transition to organic production were built allowing for its lower production efficiency, i.e., a 10% drop for animal products [32], and a 25% drop for plant products,
(c)
at the same time, we proposed various food wastage reduction scenarios ϵ   { 10 % , 20 % ,   30 % , 40 % } , with the initial level of 40% [63] brought down to 30%, 20% and 10%; we assumed that food wastage cannot be completely eliminated,
(d)
we simulated changes in the use of utilised agricultural area in 2030, allowing for an increased proportion of area for organic farming scenarios β   ϵ   { 20 % , 40 % ,   60 % } and for scenarios α   ϵ   { 25 % ,   50 % , 75 % } ; area changes result from changes in plant and animal output as the supply side in order to feed the country’s population, but also from changes of area required for growing animal-feed crops.
In the analysis of the current problem, we assume that total food supply (TFS) (kcal/cap/day) is given by Equation (1). This equation only applies to the sustainable consumption part of the analysis:
T F S k c a l / c a p / d a y α = ( 1 + α ) ·   S S A P + ( 1 α ) · [ S U N S A P + S U N S C P ] + S S C P
where: α ϵ { 25 % ,   50 % , 75 % } —percentage of change assumed in scenarios of sustainable consumption, SSAP—sum of sustainable animal products, the supply of which is to be increased, SSCP—sum of sustainable plant products, the supply of which remains unchanged, SUNSAP—sum of unsustainable animal products, the supply of which is to be reduced, SUNSCP—sum of unsustainable plant products, the supply of which is to be reduced.
Then we use Equation (2) for both sustainable and ecological product consumption:
T F S α ( β ) k c a l / c a p / d a y = ( 1 β ) · T F S α + β · T F S α · e
where: β   ϵ   { 20 % , 40 % ,   60 % } are proposed transitions to organic agriculture and the consumption of its products, e = {   0.90   f o r   a n i m a l   o u t p u t 0.75   f o r   p l a n t   o u t p u t are indicators of the decline in production efficiency as a result of the transition to organic agriculture.
Assuming the expected food wastage level, the borderline inequality to satisfy total food demand (TFD) is expressed by Formula (3):
T F D α ( β ) k c a l / c a p / d a y ( 1 w ) · T F S α ( β ) k c a l / c a p / d a y
where: w   ϵ   { 10 % , 20 % ,   30 % , 40 % } is the assumed percentage of food wastage.
By adopting such a constructed methodology and its assumptions, we relied on actual statistical data for Poland and feasible assumptions regarding, among others, changes in the efficiency of agricultural production after conversion to organic farming, or food waste. In addition, similar assumptions can be found in the works of Schader et al. [9], Muller et al. [32], but also in Alexandratos and Bruinsma [65], where possible scenarios for 2050 were projected.
We propose several scenarios for 2030 taking into account different levels of change for sustainable consumption, waste and the transition to organic farming. The amounts forecasted by us are estimates resulting from the realistic assumptions we have adopted.

4. Results and Discussion

4.1. Base Year vs. 2030—Changes in Population, Utilised Agricultural Area, Availability of Protein and Energy from Domestic Agricultural Products

According to global analyses, expected world population growth will make it necessary to increase cultivation area on arable land by 6% by 2050, even without the transition to a more sustainable agriculture. A potential increment in the share of green farming may necessitate utilising even larger areas of land, usually at the cost of forests [8]. For Poland, an inverse demographic trend is at work, which, coupled with a change in consumption styles and food wastage reduction, may create opportunities for the transition to organic farming.
In our calculations for the base year the population of Poland was 38.42 million [53]. We expect this number to drop to approximately 37.62 million by 2030 [66]. This population change trend, combined with a rise in awareness of the need to change consumption patterns, is likely to enable a substantial proportion of Poland’s population to be fed with domestic green farming products.
Poland’s utilised agricultural area amounts to nearly 150 million hectares (mean value for the base year). This makes for 47% of the country’s surface area. Arable land constitutes definitely the largest portion of AL. It accounts for as much as 75% of Poland’s agricultural land. Meadows and pastures form 21% of AL area.
According to calculations in [63] for the base year, utilised agricultural area and its related production significantly exceed Poland’s population food demand. If we omit w = 40 % food wastage, the country’s population would potentially be able to use more than 6000 kcal/cap/day and substantial amounts of available protein while maintaining appropriate proportions of animal as well as plant products. In the year 2030, when the transition to more sustainable food consumption is expected, with a change α = 75 % in the consumption of selected animal and plant products, we anticipate an excess of available kcal/cap (4141) as well as protein (148 g/cap/day). We consider these data as still potentially large quantities supplied by domestic farm production (Table 2).

4.2. Kilocalories and Protein Supply Change Scenarios Taking into Account the Transition to a Organic Farming System, Food Wastage Reduction and Sustainable Consumption

Statistics for the base year provide valuable information for consumers and food policymakers alike. Polish agriculture was capable of supplying 3670 kcal/cap/day and 131 g protein/cap/day even allowing for food wastage at the level w = 40 % (Table 3). This is a rather high amount of energy considering human body requirements, as reported in Kuczuk and Widera [63] for the base year (2572 kcal/cap/day). Therefore, the data reveal a margin that can be used for enhancing the growth of green farming in Poland and greater consumption of organic products. Lower efficiency associated with organic agriculture may limit current overproduction of food in Poland.
The results reveal the effect of a combination of three factors: food wastage reduction, lower consumption of selected products (which are considered non-sustainable in terms of consumption), together with an increased share of organic agriculture and its products, on energy and protein supply for consumers.
The scenarios we developed indicate the point in which the human body’s optimum demand for energy and protein may be met. For 2030, it was determined as 2608 kcal/cap/day (TFD) [63]. Our present calculations suggest an optimum scenario, which includes the highest share of organic farming products β = 60% and α = 75% transition to sustainable consumption, as well as food wastage reduction down to w = 20 % . The scenario anticipates 2863 kcal/cap/day and 106 g protein/cap/day (Table 3 and Figure 4), which approximates TFD: 2608 kcal/cap/day. A slight energy shortage is expected at the w = 30 % food wastage scenario: 2505 kcal/cap/day (albeit this quantity may also prove optimal for the human body if functioning in specific conditions). The amount of protein supplied is also within normal limits. If we assume greatest progress in food wastage reduction w = 10%, β = 60% organic share, and α = 75% changes in consumption style, we may even expect a surplus in the supply of energy and protein (3221 kcal/cap/day and 119 g protein/cap/day) in reference to human body’s requirement. Obviously, the last scenario creates further potential for increasing the share of organic farming. However, we should approach this scenario with extreme caution. Muller et al. suggested various degrees (0–100%) of transition to the organic agriculture [32]. Their global analysis takes into account three variants of food wastage reduction (0%/25%/50%), shrinking the food-competitive animal-feed crop area, but also the effect of climate change on crop yield. However, the authors emphasize that a global 100% transition to organic agriculture by 2050 would lead to a substantial rise in the area of utilised agricultural land due to the growing population. In addition, climate change may make it necessary to use more land for organic farming.
Our analyses should also consider a boost in the share of organic farming products by β   ϵ   { 20 % ,   40 % } with w = 30 % wastage and the α = 75 % scenario. The amount of energy delivered would be 2767 kcal/cap/day, with a protein supply of 100 g/cap/day and 2636 kcal/cap/day, respectively, with a protein supply of 96 g/cap/day. These scenarios seem feasible, considering European Commission’s commitment to achieve 25% organic farming in EU member states by 2030 [35].
Both changing consumption patterns and raising awareness of food wastage reduction have a deeply significant role in the process of increasing the share of organic farming and its products. If we wish to obtain β = 60% rise in the share of organic farming in the process of supplying food and the α = 75% scenario, it is likely that the 2147 kcal/cap/day would not satisfy food standard requirements according to Formula (3). Besides, curbing the w = 40% wastage level is a priority.
Thus, it seems that the commitment to curbing food wastage is an important step towards a higher proportion of organic farming products in consumption. This, however, requires high consumer awareness, so efforts must be made to raise it. According to Food and Agriculture Organization (FAO) [67], about 1/3 (1.3 billion tons per year) of food made for consumption is wasted. In the EU, around 88 million tons of food waste are generated annually, with costs estimated at 143 billion euros [68]. In Poland, 9 million tons of food are wasted each year, with households being responsible for the majority of food wastage [69]. A change in nutrition patterns is another step in ensuring the supply of high-quality food in optimum quantities.
Table 4 lists selected information on the share of protein supplied and changes in its amount due to the proposed scenarios. The results show that the quantity of protein supplied remain normal in almost all scenarios. Polish standards [70] require that the proportion of energy from protein remains within 10–20%. Nevertheless, certain deficiencies may be observed in the scenario which assumes w = 40% food wastage. If food wastage remains at the same level, in the α = 75% scenario we expect a considerable (29–30%) drop in the proportion of animal protein relative to total amount of protein supplied with farming produce. Still, the percentage is natural in many countries due to a low proportion of meat in diet [71]. Results in Table 4 support the finding that food wastage reduction has a positive effect on both the share of animal protein in diet and the availability of energy from animal products.

4.3. Required Changes in the Use of Agricultural Land. Does Poland Have Enough Land to Increase Organic Production?

Results presented in Table 3 and Table 4 indicate that even the scenario with β = 60 % organic agriculture is possible, but only if combined with the α = 75% scenario and a substantial food wastage reduction. Potential implications of changes in utilised agricultural area due to various degrees of transition to organic agriculture are presented below in (Figure 5 and Figure 6a–d).
If we consider a transition to organic agriculture without concurrent changes in consumption patterns, the area of arable land required for farming will likely have to be increased. Figure 5 shows that regardless of changes in organic share β   ϵ   { 20 % , 40 % , 60 % } in 2030 it would be necessary to raise the area of utilised agricultural land from 4.5% to nearly 14% (from 0.62 million ha to 1.86 million ha). Only changes in consumption patterns offer the possibility of increasing organic share according to the estimates we have proposed.
Calculated area changes are based on the assumption that the output from meadows and pastures as well as green forage production on arable land do not decrease in spite of the transition to organic agriculture. We treat those crops as extensive, generally grown in an environmentally friendly manner. Productivity declines (by 25%) concern only remaining crops grown on arable land, e.g., allocated to consumption and animal feed.
The calculations performed in this subsection are related to two components of the present analysis: the transition to organic agriculture and the transition to a more sustainable consumption.
Figure 6 a presents potential changes in the use of meadows and pastures. Growing sustainable consumption (lower animal production, meat supply and consumption of selected meat types) is accompanied by an increase in the proportion of unused area for animal-feed crops. In 2030, according to the α = 75% scenario, there may be as much as 55.5% (2.2 mln ha) of potentially unused area allocated to animal-feed crops (irrespective of the scale of organic agriculture) relative to adjusted 2030 data (without transition to organic agriculture or changes in consumption patterns).
With regard to ArL (Figure 6b–d), we considered changes both in consumer products and animal feed. Note that each of the proposed organic shares ( β   ϵ   { 20 % , 40 % ,   60 % } ) shows a similar tendency for unoccupied area to grow. We may expect that a 25% decrease in the output of a part of plant production may lead to a shortage of area needed for obtaining the optimum amount of food and animal feed. However, changes in consumption patterns may have a significant impact on this phenomenon. A potential decrease in animal production, and consequently in required feed (mainly concentrate feed), leaves room for other crops. With an organic share of β   ϵ   { 20 % , 40 % } and the α = 75% scenario (with the largest cuts in animal production), there may be even 29.60% or 32.6% (4.0 million and 4.4 million ha) free space for ArL left.
In the most radical α = 75% scenario and with 60% conversion into organic agriculture, there may be as much as approx. 26.5% (3.6 million ha) unoccupied ArL area. Only with β = 60 % organic share and the α = 25% scenario are considered do we see a slight growth in the area of ArL required for farming. Unused space may offer potential capabilities for consumer commodity production (e.g., more vegetables grown) or for the protection of agricultural and natural environment, soil conservation, etc. Considering that Polish arable land soils are poor in organic matter [72,73], it seems that this option may be advisable, particularly in the context of the transition to sustainable production.

5. Conclusions

The results presented here should be treated as a model and, as such, they required making a number of assumptions. Still, they reveal a certain potential in the Polish agriculture as well as the necessity to raise both consumer and supplier awareness. We believe that they can be used in the activities of decision makers, politicians, agricultural advisors and educators.
The findings allowed us to conclude that various extents of transition to organic agriculture are possible. Our analysis allowed us to answer the questions posed (Introduction section):
  • The paper proposes different shares of organic farming production in Poland, which can provide the necessary amount of energy and proteins per person per day in 2030. We performed the analysis for the share of organic production at the levels β   ϵ   { 20 % ,   40 % ,   60 % } . We find that even a 60% share of organic production ( β = 60 % ) is potentially feasible. It is able to provide energy at a level similar to TFD (2608 kcal/cap/day), as much as 2863 kcal/cap/day and 106 g of protein/cap/day. However, it will only be possible for the scenario assuming both α = 75 % change in consumption and w = 20 % food waste. Other, perhaps more realistic situations involve a β   ϵ   { 20 % , 40 % } share of organic agriculture with w = 30 % food wastage and the α = 75 % scenario. This variant may be in line with the European Commission’s commitment to allocate 25% arable land to organic agriculture by 2030. Unfortunately, the 40% level of food waste is typical of many developed countries. If we expect an increase in the share of organic farming production to β = 60%, then such a high level of food wastage may not provide the required TFD.
  • The success of this process (greater share of domestic organic farming products in the consumption of Polish society) will also depends on consumer awareness in terms of the need to curb food wastage and change dietary habits. Both of these issues are important factors that provide space for the development of organic farming. This is shown by the results in Table 3 and Figure 4 A 40% level of food wastage (with zero organic farming and no change in consumption style) gives an effect of 2485 kcal/cap/day in the 2030 adjusted. This is less than TFD. However, when the consumption style α   ϵ   { 25 % ,   50 % } begins to change, then the scenario of the share of organic farming β = 60 % becomes possible. Further gradual reduction of food wastage results in a large surplus of energy per person. Such a situation may provide a basis for considering an even wider development of organic production in Poland. The results of the analysis also demonstrate that the anticipated transition to organic production should not cause protein deficiencies, including animal protein deficiency, in Poles’ everyday diet.
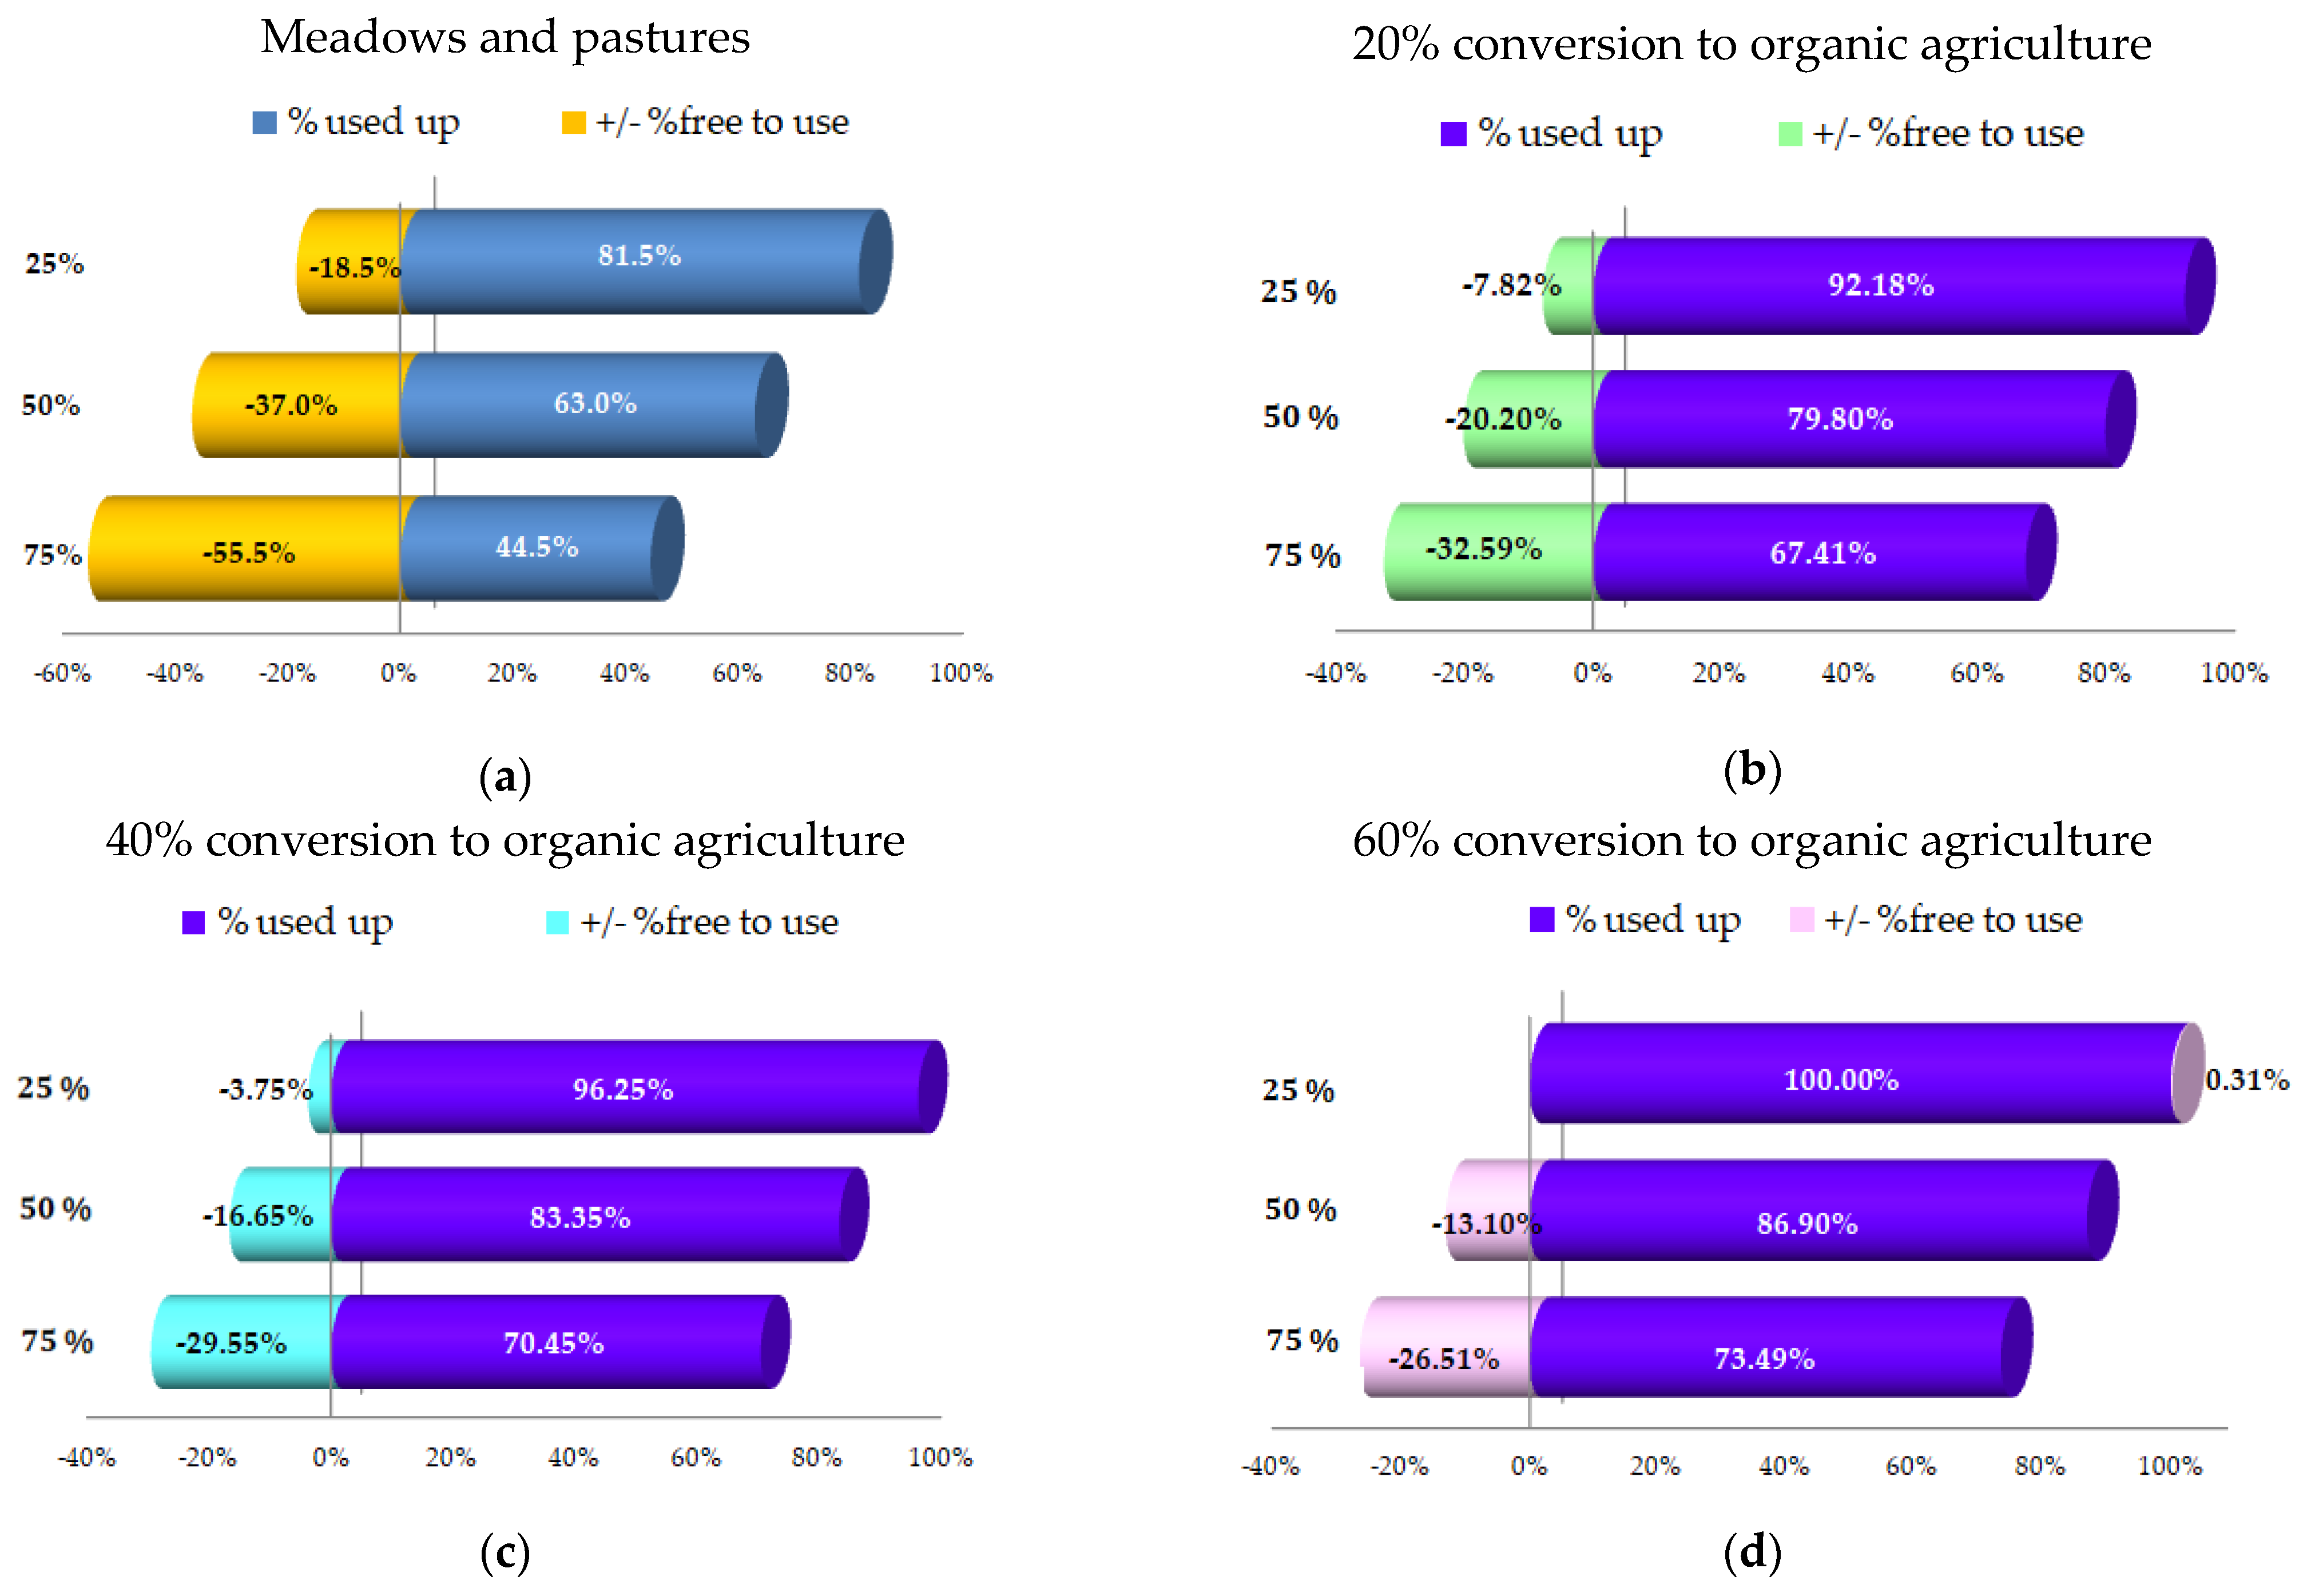
  • Our calculations indicate that a reduction in the consumption of selected meat types and selected plant product generates a decrease in production, thus freeing up space on grassland and arable land alike. A transition to even with β = 60 % organic share and with α   ϵ   { 50 % , 75 % } scenarios is possible without increasing the area required to supply food for the population of Poland in 2030, although failure to make changes in consumption patterns may necessitate the use of a larger area of land for growing food. With radical changes in consumption style (α = 75%) and a 60% share of organic production, more than 26% of the free arable land is unused space.
  • There is also a question of how to use the potentially unoccupied space previously allocated for animal-feed production. We suggest that grassland be kept in accordance with good farming practices, continuing to provide animal feed, but also protecting the soil’s ecosystem and serving as a habitat to many species. As for unused ArL, this would require some concepts with regard to potential use of free space: for commodities, but making it possible to grow more vegetables, or more inclined towards protecting soil ecosystem and accumulating organic matter. Both issues are of interest to the authors of this study.
On a final note, we would like to emphasise that permanent support for organic farmers is necessary, especially those who produce for consumer markets. Current per hectare subsidies, although not insignificant, should be constantly verified in terms of effort related to individual crops, as well as the shifting conditions of the organic products’ market.

Author Contributions

Conceptualization, A.K.; methodology, A.K. and K.W.; validation, A.K. and K.W.; formal analysis, A.K. and K.W.; investigation, A.K. and K.W.; resources, K.W.; data curation, A.K. And K.W.; writing—original draft preparation, A.K. and K.W.; writing—review and editing, A.K. and K.W. visualization, A.K. and K.W.; project administration, A.K. and K.W. All authors have read and agreed to the published version of the manuscript.

Funding

This research received no external funding. The APC was funded by Opole University of Technology, Poland.

Data Availability Statement

The data used in the performed analysis is available online: https://www.fao.org/faostat/en/#home; https://stat.gov.pl/; https://www.gov.pl/web/ijhars/gijhars (accessed on 20 May 2021).

Conflicts of Interest

The authors declare no conflict of interest.

References

  1. Reganold, J.; Dobermann, A. Comparing apples with oranges. Nature 2012, 485, 176–177. [Google Scholar] [CrossRef]
  2. Food and Agriculture Organization of the United Nations (FAO). Rome Declaration on World Food Security. World Food Summit, 13–17 November 1996, Rome, Italy. Available online: http://www.fao.org/3/w3613e/w3613e00.htm (accessed on 4 October 2021).
  3. Rembiałkowska, E. Quality of plant products from organic agriculture. J. Sci. Food Agric. 2007, 87, 2757–2762. [Google Scholar] [CrossRef]
  4. Średnicka-Tober, D.; Golba, J.; Kazimierczak, R.; Hallmann, E.; Stork, T.; Rembiałkowska, E. Evaluation of the nutritional quality of selected fruit and vegetables depending on the time after farm conversion to organic production methods. J. Res. Appl. Agric. Eng. 2016, 61, 197–203. [Google Scholar]
  5. Worthington, V. Nutritional quality of organic versus conventional fruits, vegetables, and grains. J. Altern. Complementary Med. 2004, 7, 161–173. [Google Scholar] [CrossRef]
  6. Kouba, M. Quality of organic animal products. Livest. Prod. Sci. 2003, 80, 33–40. [Google Scholar] [CrossRef]
  7. Popa, M.E.; Mitelut, A.C.; Popa, M.E.; Stan, A.; Popa, V.I. Organic foods contribution to nutritional quality and value. Trend Food Sci. Technol. 2019, 84, 15–18. [Google Scholar] [CrossRef]
  8. Searchinger, T.D.; Wirsenius, S.; Beringer, T.; Dumas, P. Assessing the efficiency of changes in land use for mitigating climate change. Nature 2018, 564, 249–253. [Google Scholar] [CrossRef] [PubMed]
  9. Schader, C.; Muller, A.; El-Hage Scialabba, N.; Hecht, J.; Isensee, A.; Erb, K.-H.; Smith, P.; Makkar, H.P.S.; Klocke, P.; Leiber, F.; et al. Impacts of feeding less food-competing feedstuffs to livestock on global food system Sustainability. J. R. Soc. Interface 2015, 12, 20150891. [Google Scholar] [CrossRef] [PubMed] [Green Version]
  10. Food and Agriculture Organization of the United Nations (FAO). Food Security. Policy Brief. Issue 2. June 2006. FAO Agricultural and Development Economics Division. Rome, Italy. Available online: http://www.fao.org/fileadmin/templates/faoitaly/documents/pdf/pdf_Food_Security_Cocept_Note.pdf (accessed on 4 October 2021).
  11. Schreer, V.; Padmanabhan, M. The many meanings of organic farming: Framing food security and food sovereignty in Indonesia. Org. Agr. 2020, 10, 327–338. [Google Scholar] [CrossRef] [Green Version]
  12. Epule Epule, T. Contribution of organic farming towards global food security: An overview. In Organic Farming-Global Perspectives and Methods; Chandran, S., Unni, M.R., Thomas, S., Eds.; Woodhead Publishing Series in Food Science, Technology and Nutrition: Amsterdam, The Netherlands, 2019; pp. 1–16. [Google Scholar]
  13. United Nations; Department of Economic and Social Affairs. Population Division (2015) Demographic Components of Future Population Growth: 2015 Revision. Table 2: Total Population by Projection Variants (In Thousands) 2010–2100. New York, USA. Available online: https://www.un.org/development/desa/pd/content/demographic-components-future-population-growth-2015-revision (accessed on 25 May 2021).
  14. Food and Agriculture Organization of the United Nations (FAO). Crops and Livestock Products. FAO. Available online: http://www.fao.org/faostat/en/#data/QCL (accessed on 20 June 2020).
  15. Chand, R.; Srivastava, S.K. Changes in the rural labour market and their implications for agriculture. Econ. Polit. Wkly. 2014, 49, 10, 47–54. [Google Scholar]
  16. Fox, L.; Thomas, A.; Haines, C. Structural Transformation in Employment and Productivity: What Can Africa Help for? African Department; International Monetary Fund, Publication Services; International Monetary Found: Washington, US, USA, 2017.
  17. Helming, J.; Tabeau, A. The economic, environmental and agricultural land use effects in the European Union of agricultural labour subsidies under the common agricultural policy. Reg. Environ. Chang. 2018, 18, 763–773. [Google Scholar] [CrossRef] [Green Version]
  18. Skinner, J.A.; Lewis, K.A.; Bardon, K.S.; Tucker, P.; Catt, J.A.; Chambers, B.J. An overview of the environmental impact of agriculture in the U.K. J. Environ. Manage. 1997, 50, 111–128. [Google Scholar] [CrossRef] [Green Version]
  19. Ławniczak, A.E.; Zbierska, J.; Nowak, B.; Achtenberg, K.; Grześkowiak, A.; Kanas, K. Impact of agriculture and land use on nitrate contamination in groundwater and running waters in central-west Poland. Environ. Monit. Assess. 2016, 3, 172. [Google Scholar] [CrossRef] [Green Version]
  20. Duffy, M.D.; Tegtmeier, E.M. External costs of agricultural production in the United States. Int. J. Agric. Sustain. 2004, 2, 1–20. [Google Scholar] [CrossRef]
  21. Bengtsson, J.; Ahnström, J.; Weibull, A.-C. The effects of organic agriculture on biodiversity and abundance: A meta-analysis. J Appl. Ecol. 2005, 42, 261–269. [Google Scholar] [CrossRef]
  22. Tuck, S.L.; Winqvist, C.; Mota, F.; Ahnström, J.; Turnbull, L.A.; Bengtsson, J. Land-use intensity and the effects of organic farming on biodiversity: A hierarchical meta-analysis. J. Appl. Ecol. 2014, 51, 746–755. [Google Scholar] [CrossRef] [PubMed]
  23. Muneret, L.; Mitchell, M.; Seufert, V.; Aviron, S.; Djoudi El, A.; Pétillon, J.; Plantegenest, M.; Thiéry, D.; Rusch, A. Evidence that organic farming promotes pest control. Nat. Sustain. 2018, 1, 361–368. [Google Scholar] [CrossRef]
  24. Costa, C.; García-Lestón, J.; Costa, S.; Coelho, P.; Silva, S.; Pingarilho, M.; Valdiglesias, V.; Mattei, F.; Dall’Armi, V.; Bonassi, S.; et al. Is organic farming safer to farmers’ health? A comparison between organic and traditional farming. Toxicol. Lett. 2014, 230, 166–176. [Google Scholar] [CrossRef] [PubMed] [Green Version]
  25. Johansson, E.; Hussain, A.; Kuktaite, R.; Andersson, S.C.; Olsson, M.E. Contribution of organically grown crops to human health. Int. J. Environ. Res. Public Health 2014, 11, 3870–3893. [Google Scholar] [CrossRef]
  26. Barbieri, P.; Pellerin, S.; Seufert, V.; Smith, L.; Ramankutty, N.; Nesme, T. Global option space for organic agriculture is delimited by nitrogen availability. Nat. Food 2021, 2, 363–372. [Google Scholar] [CrossRef]
  27. Food and Agriculture Organization of the United Nations (FAO). Food Balance. FAO. Food Balance. Available online: http://www.fao.org/faostat/en/#data (accessed on 20 June 2020).
  28. Pretty, J. Agri-Culture: Reconnecting People, Land and Nature; Taylor & Francis: London, UK, 2002; p. 280. [Google Scholar]
  29. Reganold, J.P.; Wachter, J.M. Organic agriculture in the twenty-first century. Nat. Plants 2016, 2, 15221. [Google Scholar] [CrossRef]
  30. Badgley, C.; Moghtader, J.; Quintero, E.; Zakem, E.; Chappell, M.J.; Avilés-Vázquez, K.; Samulon, A.; Perfecto, I. Organic agriculture and the global food supply. Renew. Agric. Food Syst. 2007, 22, 86–108. [Google Scholar] [CrossRef]
  31. Seufert, V.; Ramankutty, N.; Foley, J. Comparing the yields of organic and conventional agriculture. Nature 2012, 485, 229–232. [Google Scholar] [CrossRef]
  32. Muller, A.; Schader, C.; El-Hage Scialabba, N.; Brüggemann, J.; Isensee, A.; Erb, K.-H.; Smith, P.; Klocke, P.; Leiber, F.; Stolze, M.; et al. Strategies for feeding the world more sustainably with organic agriculture. Nat. Commun. 2017, 8, 1290. [Google Scholar] [CrossRef] [Green Version]
  33. Ponisio, L.C.; M’Gonigle, L.K.; Mace, K.C.; Palomino, J.; de Valpine, P.; Kremen, C. Diversification practices reduce organic to conventional yield gap. Proc. R. Soc. B 2015, 282, 20141396. [Google Scholar] [CrossRef] [PubMed] [Green Version]
  34. Pretty, J.N.; Morison, J.I.L.; Hine, R.E. Reducing food poverty by increasing agricultural sustainability in developing countries. Agri. Ecosyst. Environ. 2003, 95, 217–234. [Google Scholar] [CrossRef]
  35. European Commission. Action Plan for Organic Production in the EU. Available online: https://ec.europa.eu/info/food-farming-fisheries/farming/organic-farming/future-organics_pl (accessed on 30 April 2021).
  36. Molenda-Grysa, I. Organic agricultural farms as entities bioeconomy. Stow. Ekon. Rol. Agrobiz. Rocz. Nauk. 2016, 18, 249–254. [Google Scholar]
  37. Zuba-Ciszewska, Z.; Zuba, J. The place of the organic farm output in the polish agriculture. Stow. Ekon. Rol. Agrobiz. Rocz. Nauk. 2016, 18, 411–418. [Google Scholar]
  38. Main Inspectorate of Agricultural and Food Quality Inspection. Dane o Rolnictwie Ekologicznym (Data on Organic Farming). IJHAR-S. Available online: https://www.gov.pl/web/ijhars (accessed on 20 May 2021).
  39. Golik, D.; Żmija, D. Rolnictwo ekologiczne i perspektywy jego rozwoju w Polsce w świetle doświadczeń unijnych (Organic farming and prospects for its development in Poland in the light of EU experience). Zesz. Nauk. UEK 2017, 1, 117–129. [Google Scholar] [CrossRef] [Green Version]
  40. Brągiel, E.; Ślusarczyk, B. Trends on the European Organic Food Market. Zesz. Nauk. SGGW Probl. Rol. Świat. 2017, 32, 29–38. [Google Scholar] [CrossRef]
  41. Honkanen, P.; Verplanken, B.; Olsen, S.O. Ethical values and motives driving organic food choice. J. Consum. Behav. 2006, 5, 420–430. [Google Scholar] [CrossRef]
  42. Hermianiuk, T. Postawy i zachowania konsumentów na rynku ekologicznych produktów żywnościowych (Consumer attitudes and behavior on the organic market food products). Handel Wewnętrzny 2018, 2, 189–199. [Google Scholar]
  43. Żakowska-Biemans, S. Polish consumer food choices and beliefs about organic food. Br. Food J. 2011, 113, 122–137. [Google Scholar] [CrossRef]
  44. Nowogródzka, T. The consumer in the polish organic food market. A Siedlce example. Zesz. Nauk. UPH w Siedlcach Seria Adm. i Zarządzanie 2016, 111, 89–101. [Google Scholar]
  45. Statistical Yearbook of Agriculture, Statistics Poland; Warsaw, Poland, 2020. Available online: https://stat.gov.pl/obszary-tematyczne/roczniki-statystyczne/roczniki-statystyczne/rocznik-statystyczny-rolnictwa-2020,6,14.html (accessed on 20 May 2021).
  46. The Report on Organic Farming in Poland in 2017–2018; Agricultural and Food Quality Inspection: Poland, Warsaw, 2019. Available online: https://www.gov.pl/web/ijhars/dane-o-rolnictwie-ekologicznym (accessed on 20 May 2021).
  47. The Report on Organic Farming in Poland in 2005–2006; Agricultural and Food Quality Inspection: Poland, Warsaw, 2007. Available online: https://www.gov.pl/web/ijhars/dane-o-rolnictwie-ekologicznym (accessed on 20 May 2021).
  48. The Report on Organic Farming in Poland in 2007–2008; Agricultural and Food Quality Inspection: Poland, Warsaw, 2009. Available online: https://www.gov.pl/web/ijhars/dane-o-rolnictwie-ekologicznym (accessed on 20 May 2021).
  49. The Report on Organic Farming in Poland in 2009–2010; Agricultural and Food Quality Inspection: Poland, Warsaw, 2011. Available online: https://www.gov.pl/web/ijhars/dane-o-rolnictwie-ekologicznym (accessed on 20 May 2021).
  50. The Report on Organic Farming in Poland in 2011–2012; Agricultural and Food Quality Inspection: Poland, Warsaw, 2013. Available online: https://www.gov.pl/web/ijhars/dane-o-rolnictwie-ekologicznym (accessed on 20 May 2021).
  51. The Report on Organic Farming in Poland in 2013–2014; Agricultural and Food Quality Inspection: Poland, Warsaw, 2015. Available online: https://www.gov.pl/web/ijhars/dane-o-rolnictwie-ekologicznym (accessed on 20 May 2021).
  52. The Report on Organic Farming in Poland in 2015–2016; Agricultural and Food Quality Inspection: Poland, Warsaw, 2017. Available online: https://www.gov.pl/web/ijhars/dane-o-rolnictwie-ekologicznym (accessed on 20 May 2021).
  53. Population by Sex and Age Group. Statistics Poland. Local Data Bank. Available online: https://bdl.stat.gov.pl/BDL/dane/podgrup/temat (accessed on 30 March 2021).
  54. Kuś, J.; Jończyk Stalenga, J.; Feledyn-Szewczyk, B.; Mróz, A. Yields of the selected winter wheat varieties cultivated in organic and conventional crop production systems. J. Res. Appl. Agric. Eng. 2010, 55, 219–223. [Google Scholar]
  55. Kuczuk, A. Cost-, Cumulative Energy- and Emergy Aspects of Conventional and Organic Winter Wheat (Triticum aestivum L.) Cultivation. J. Agric. Sci. 2016, 8, 140–155. [Google Scholar] [CrossRef]
  56. Kuczuk, A. Cumulative energy intensity and emergy account in cultivation of buckwheat (Fagopyrum Esculentum Moench). J. Res. Appl. Agric. Eng. 2016, 61, 6–14. [Google Scholar]
  57. Brzozowski, P.; Zmarlicki, K. Economics of the 2009-2012 organic apple, strawberry, and sour cherry production in Poland. J. Fruit Ornam. Plant Res. 2012, 20, 63–70. [Google Scholar] [CrossRef] [Green Version]
  58. Feledyn-Szewczyk, B.; Nakielska, M.; Jończyk, K.; Berbeć, A.K.; Kopiński, J. Assessment of the suitability of 10 winter triticale cultivars (x triticosecale wittm. ex A. camus) for organic agriculture: Polish case study. Agronomy 2020, 10, 1144. [Google Scholar] [CrossRef]
  59. de Ponti, T.; Rijk, B.; van Ittersum, M.K. The crop yield gap between organic and conventional agriculture. Agric. Syst. 2012, 108, 1–9. [Google Scholar] [CrossRef]
  60. Research Institute of Organic Agriculture FiBL. The World of Organic Agriculture. Statistics and Emerging Trends 2021. Available online: https://www.fibl.org/fileadmin/documents/shop/1150-organic-world-2021.pdf (accessed on 20 May 2021).
  61. Koalicja na rzecz BIO we współpracy z NielsenIQ. Żywność Ekologiczna w Polsce. 2021. Available online: https://jemyeko.com/wp-content/uploads/2021/07/raport_05-07-2021.pdf (accessed on 20 May 2021).
  62. ROZPORZĄDZENIE MINISTRA ROLNICTWA I ROZWOJU WSI z Dnia 27 Lutego 2019 r. Zmieniające Rozporządzenie w Sprawie Szczegółowych Warunków i Trybu Przyznawania Pomocy Finansowej w Ramach Działania “Rolnictwo Ekologiczne” Objętego Programem Rozwoju Obszarów Wiejskich na Lata 2014–2020. Dz. U. Dz.U.2019.451. Available online: http://isap.sejm.gov.pl/isap.nsf/download.xsp/WDU20190000451/O/D20190451.pdf (accessed on 25 May 2021).
  63. Kuczuk, A.; Widera, K. Proposed changes in polish agricultural products consumption structure for 2030 based on data from 2008–2018. Sustainability 2021, 13, 7536. [Google Scholar] [CrossRef]
  64. Food and Agriculture Organization of the United Nations. The Food Wastage Footprint. Impacts on Natural Resources. Summary Report. 2013, pp. 1–63. Available online: http://www.fao.org/3/i3347e/i3347e.pdf (accessed on 29 March 2021).
  65. Alexandratos, N.; Bruinsma, J. World Agriculture Towards 2030/2050. The 2012 Revision. ESA Working Paper No. 12-03. June 2012. Food and Agriculture Organization of the United Nations, Italy, Rome. Available online: www.fao.org/economic/es (accessed on 25 April 2021).
  66. Główny Urząd Statystyczny [Central Statistical Office]. Prognoza ludności Gmin na Lata 2017–2030 [Municipal Population Forecast for 2017–2030]. 2017. Available online: https://stat.gov.pl/obszary-tematyczne/ludnosc/prognoza-ludnosci/prognoza-ludnosci-gmin-na-lata-2017-2030-opracowanie-eksperymentalne,10,1.html (accessed on 30 March 2021).
  67. Food and Agriculture Organization of the United Nations (FAO). Food Loss and Food Waste. FAO. Available online: http://www.fao.org/food-loss-and-food-waste/flw-data (accessed on 30 June 2021).
  68. Stenmarck, Å.; Jensen, C.; Quested, T.; Moates, G.; Buksti, M.; Cseh, B.; Juul, S.; Parry, A.; Politano, A.; Redlingshofer, B.; et al. Estimates of European food waste levels-FUSIONS Reducing food waste through social innovation. Stockholm, Sweden. 31 March 2016. Available online: http://www.eu-fusions.org/phocadownload/Publications/Estimates%20of%20European%20food%20waste%20levels.pdf; (accessed on 25 May 2021).
  69. Bank Żywności. Raport Federacji Polskich Banków Żywności. Nie marnuję jedzenia. 2018. Available online: https://bankizywnosci.pl/wp-content/uploads/2018/10/Przewodnik-do-Raportu_FPBZ_-Nie-marnuj-jedzenia-2018.pdf (accessed on 25 May 2021).
  70. Jarosz, M.; Charzewska, J.; Wajszczyk, B.; Chwojnowska, Z. Czy wiesz ile potrzebujesz białka? In Do You Know How Much 506 Protein You Need? Instytut Żywności i Żywienia: Warsaw, Poland, 2019; pp. 1–24. [Google Scholar]
  71. Young, V.R.; Pellett, P.L. Plant proteins in relation to human protein and amino acid nutrition. Am. J. Clin. Nutr. 1994, 59, 1203S–12l2S. [Google Scholar] [CrossRef]
  72. Kuczuk, A. Energy value of soil organic matter and costs of its restoration. In ternational Conference Energy, Environment and Material Systems (EEMS 2017). In E3S Web of Conferences; EDP Sciences: Les Ulis, France, 2017. [Google Scholar] [CrossRef] [Green Version]
  73. Kuś, J. Glebowa Materia Organiczna–Znaczenie, Zawartość i Bilansowanie. Studia I Rap. IUNG-PIB 2015, 45, 27–53. [Google Scholar] [CrossRef]
Figure 1. Organic farms number and agricultural land area in Poland in the years 2004–2020. Source: authors’ own work based on: [38].
Energies 14 06959 g001
Figure 2. Structure of the categories of potential consumer plants in the years 2001 to 2018. Source: own work based on data: [46,47,48,49,50,51,52].
Energies 14 06959 g002
Figure 3. Organic agricultural land structure in Poland in the years 2017–2018. Source: authors’ own work based on: [46].
Energies 14 06959 g003
Figure 4. TFD vs. TFS for different variants of organic share β   ϵ   { 20 % , 40 % ,   60 % } , consumption style change scenarios α   ϵ   { 25 % ,   50 % , 75 % } and food wastage reduction w   ϵ   { 10 % , 20 % ,   30 % , 40 % } . Source: authors’ own work.
Energies 14 06959 g004
Figure 5. Potential changes in the use of arable land when switching to organic farming (20%/40%/60%). Source: authors’ own work.
Energies 14 06959 g005
Figure 6. Changes in the use of agricultural land resulting from the transition to organic agriculture and sustainable consumption α   ϵ   { 25 % ,   50 % , 75 % } ; (a) meadows and pastures, (b) β = 20%, (c) β = 40%, (d) β = 60% transition to organic agriculture in 2030. Source: authors’ own work.
Energies 14 06959 g006
Table 1. Mean production output for selected organic farming commodities in Poland from 2017 to 2018 and their supply (cap/year).
Type of Production 1UnitMean Output in 2017–2018Supply/Cap/Year
[kg, 1]
Cerealstonne185,942.324.84
Potatoes17,448.900.45
Total vegetables50,592.221.32
Total fruits84,533.732.20
Cow’s milkhL253,086.760.66
Meat processingtonne2,370.160.06
1 production declared in certificates issued by the certification body. Source: authors’ own work based on: [46,53].
Table 2. Base year vs. 2030: population, land occupation, energy and protein supply.
Population Base Year:38.42 Million
Population Forecast 2030:37.62 Million
Land occupation
base year [ha]:
Energies 14 06959 i001
Energy supply (with no food wastage) [kcal/cap/day] base year Energies 14 06959 i002
Energy supply in 2030 (α = 75% scenario, with no food wastage) [kcal/cap/day] year 2030 Energies 14 06959 i003
Protein supply (with no food wastage) [g/cap/day] base year Energies 14 06959 i004
Protein supply in 2030 (α = 75% scenario with no food wastage) [g/cap/day] Energies 14 06959 i005
Source: authors’ own work based on [53,63].
Table 3. Daily total food supply in the base year, adjusted 2030 and scenarios for 2030 including: transition to organic agriculture, food wastage, and sustainable consumption.
Food Wastage Levels w Daily Total Food Supply (TFS) α Base Year *Adjusted 2030 *Transition To More Sustainable Food Supply And Consumption
+/−25%+/−50%+/−75%
β % Transition To Organic Agriculture
0%20%40%60%0%20%40%60%0%20%40%60%
10%Total [kcal/cap/day] 574154945247500147344526431841113727355833893221
total protein [g]257.45249.23241.01232.79195.41188.93182.46175.98133.37128.64123.89119.16
20%Sum of [kcal/cap/day]510348844664444542084023383936543313316330132863
total protein [g]228.84221.54214.23206.93173.70167.94162.18156.42118.55114.34110.13105.92
30%Sum of [kcal/cap/day]446542734081389036823520335931972898276726362505
total protein [g]200.24193.84187.45181.06151.98146.94141.91136.87103.73100.0596.3692.68
40%Sum of [kcal/cap/day]3670 *2485 *382736633498333431563017287927412484237222602147
Total protein [g]131 *89 *171.63166.15160.67155.20130.27125.95121.64117.3288.9185.7682.6079.44
Data with no food wastageSum of [kcal/cap/day]6116 *4141 *6379 *6104583055575260 *5028479845684141 *395337663579
Total protein [g]218 *148 *286.05 *276.92267.79258.66217.12 *209.92202.73195.53148.19 *142.93137.66132.40
* Source: authors’ own work, taking into account calculations from [63].
Table 4. Additional information on protein and animal protein supply changes.
Transition To More Sustainable Food Supply And Consumption
+/−25%+/−50%+/−75%
% Transition To Organic Agriculture
0%20%40%60%0%20%40%60%0%20%40%60%
Food Wastage Levels10%animal protein/total protein0.540.550.560.560.510.510.520.530.430.440.450.46
protein energy/total kcal0.160.170.170.170.150.150.150.160.130.130.130.14
animal protein [g/cap/day]155.25152.14149.04145.93109.81107.61105.42103.2264.3863.0961.8060.51
20%animal protein/total protein0.480.490.490.500.450.460.460.470.390.390.400.41
protein energy/total kcal0.150.150.150.150.130.140.140.140.120.120.120.12
animal protein [g/cap/day]138.00135.24132.48129.7297.6195.6693.7191.7557.2256.0854.9353.79
30%animal protein/total protein0.420.430.430.440.390.400.400.410.340.340.350.36
protein energy/total kcal0.130.130.130.130.120.120.120.120.100.100.100.11
animal protein [g/cap/day]120.75118.33115.92113.5085.4183.7081.9980.2850.0749.0748.0747.07
40%animal protein/total protein0.360.370.370.380.340.340.350.350.290.290.300.30
protein energy/total energy0.110.110.110.110.100.100.100.100.090.090.090.09
animal protein [g/cap/day]103.50101.4399.3697.2973.2171.7470.2868.8142.9242.0641.2040.34
Data for no Food Wastageanimal protein/total protein0.60 *0.610.620.630.56 *0.570.580.590.48 *0.490.500.51
protein energy/total energy0.18 *0.180.190.190.17 *0.170.170.170.15 *0.150.150.15
animal protein [g/cap/day]172.50 *169.05165.60162.15122.01 *119.57117.13114.6971.53 *70.1068.6767.24
* Source: authors’ own work, taking into account some calculations from [63].
Publisher’s Note: MDPI stays neutral with regard to jurisdictional claims in published maps and institutional affiliations.

