Article

Application of X-ray Diffraction (XRD) and Rock–Eval Analysis for the Evaluation of Middle Eastern Petroleum Source Rock

1
Institute of Drilling and Fluid Mining Engineering, Freiberg University of Technology, 09599 Freiberg, Germany
2
Petroleum and Gas Engineering Department, NFC Institute of Engineering and Technology, Multan 60000, Pakistan
*
Author to whom correspondence should be addressed.
Energies 2021, 14(20), 6672; https://doi.org/10.3390/en14206672
Submission received: 3 August 2021 / Revised: 30 September 2021 / Accepted: 4 October 2021 / Published: 14 October 2021

Abstract

:
In this study, collected samples of nine different wells from the Middle East are used for various geochemical analyses to determine the hydrocarbon generation potential. The determination is carried out following the grain density, specific surface area, XRD, and Rock–Eval pyrolysis analyses. Four different types of kerogen are plotted based on the Rock–Eval analysis result. Kerogen type I usually has high hydrogen index (e.g., HI > 700) and low oxygen index, which is considered oil-bearing. Kerogen Type II has hydrogen index between type I and type II and oxygen index higher than type I (e.g., 350 < HI < 700) and is also considered to have oil-bearing potential. Kerogen type III has a lower hydrogen index (e.g., HI < 350) and is considered to have a primarily gas-generating potential with terrigenous organic matter origination. Kerogen type IV has a very low hydrogen index and higher oxygen index (compared with other types of kerogen), which is considered the inert organic matter. The kerogen quality of the analyzed samples can be considered as very good to fair; the TOC content ranges from 1.64 to 8.37 wt% with most of them containing between 2 and 4 wt%. The grain density of these examined samples is in the range of 2.3–2.63 g/cc. The TOC and density of the samples have an inversely proportional relationship whereas the TOC and the specific surface area (BET) has a positive correlation. The specific surface area (BET) of the examined samples is in the range of 1.97–9.94 m2/g. The examined samples are dominated by clay, primarily kaolinite and muscovite. Additionally, few samples have a higher proportion of quartz and calcite. The examined samples from the Middle East contain kerogen type III and IV. Only two samples (JF2-760 and SQ1-1340) contain type I and type II kerogen. Considering Tmax and Hydrogen Index (HI), all of the samples are considered immature to early mature. Rock–Eval (S2) and TOC plotting indicate that most of the samples have very poor source rock potential only with an exception of one (JF2-760), which has a fair-to-good source rock potential.

1. Introduction

Global interest is growing around shale and conventional gas resource availability and extraction due to energy transitions to low-carbon energy systems to limit global warming to below 2 °C. Different authors investigated different scenarios in the context of the global energy transition. Investigations suggested that global shale gas availability would not make a significant (positive or negative) impact on the cost and feasibility of an energy system transition consistent with the goal, nor does it significantly affect the cost-optimal decarbonization pathway globally [1].
Unconventional (shale) investigation begins with the organic matter components. Organic matter evolves through different geochemical (diagenesis, catagenesis, and metagenesis) processes due to primarily increasing temperature. Organic matter produces biogenic methane at lower temperatures and pressure (shallow burial). Thermogenic hydrocarbon (oil, condensate, and dry and wet gas) generates through the kerogen cracking at higher temperatures and pressure. Geochemists have explained dry gas generation primarily in two ways: direct kerogen yield and trapped oil secondary cracking. To understand and provide geochemical information, geochemists as well as petroleum industry have been using different techniques. The geomechanical model can guide the subsequent drilling and completion operations to be used for operation management as well as in situ stress and pore pressure predictions [2,3]. Rock–Eval (also known as programmed pyrolysis) has become standard practice to acquire very important and useful information [4,5,6,7]. Rock–Eval pyrolysis is also used to analyze bitumen and kerogen transformation to mobile hydrocarbons and immobile char [8]. The authors applied RE pyrolysis and SARA analysis before and after hydrothermal exposure on oil shale samples. The most important information includes organic matter types (also connected with the depositional settings), organic matter thermal maturity, and the remaining hydrocarbon generation potential in the current form. Rock–Eval pyrolysis allows the quantitative and qualitative evaluation of OM generation potential, migration, accumulation, and degree of maturity. Different authors have shown how geochemical trends allow scientists to improve the productivity evaluation of the formation [9]. Integrated lithological and geochemical studies allow scientists to identifying intervals, where organic matter can form in association with the siliceous-carbonate matrix [10,11].
Rock–Eval methods are usually used as quick, inexpensive, and reliable screening options for source rock/reservoir rock characterization. There could only be occasionally available geochemical results due to the limitations and utility. Interpretation of the results is critical and important. Different factors leading to the misinterpretation of the results have been discussed by various authors [12,13,14,15]. Although Rock–Eval pyrolysis is the standard to predict kerogen maturity, S1, S2, and productivity index, Raman spectroscopy is also proposed by scientists for the understanding of the molecular structure of organic matter [16]. The authors performed Rock–Eval (RE) and Raman spectroscopy on four Bakken samples and showed that Raman signals can also provide valuable information on OM thermal properties.
Mineralogy plays a very important integrated role in unconventional resource evaluation because drilling and production operation success depends heavily on it. Important information related to various geological settings can also be correlated with mineralogy [17]. Unconventional resources usually have very low petrophysical properties (porosity, permeability) compared with conventional reserves. Therefore, economical production heavily relies on advanced engineering solutions, such as fracture technology to enhance permeability [18,19]. North American unconventional revolution indicates that successful shale resources have a high quartz fraction (more than 40%) and fewer clay fractions (less than 40 wt%) [20,21,22]. Shales are usually very fine-grain size constituents and therefore a visual estimation of the mineralogy is very inaccurate. XRD analyses were carried out in the available cutting samples to determine the mineralogy composition and distribution of the rock.
Clay, carbonate, and quartz remain very important and common investigative minerals for exploration and production in particular unconventional shale resources. The clay minerals with inter-particle pores contribute most to surface area in the shale lithofacies. The adsorption capacity of shale samples increases when TOC increases and temperature decreases [23,24]. Triangular mineralogy plots are one of the most popular visualization techniques in the industry to have a qualitative understanding of the brittleness index (BI). The brittleness index is the quantitative parameter to represent shale fracability. Higher brittleness can make more induced fractures when the reservoir takes hydraulic fracturing treatment. The more mud the shale has, the heavier plastic the shale shows to be. Plastic deformation will be produced in fracturing, so the fracture network is forming spontaneously. When the content of brittle minerals such as quartz is relatively higher, shale becomes more brittle and the fracture network will be more complex. Therefore, the higher the brittleness, the more complex is the fracture network, and the higher is the fracability. Different authors have concluded a brittleness index formula from the proportion of quartz-carbonate-clays, which leads to the observation that the most brittle section of Barnett shales has abundant quartz, the least brittle section has abundant clays, and those with abundant carbonate are moderate [25,26]. He has compared two brittle indexes, one from the mineralogy and the other one from Poisson’s ratio and static Young’s modulus, and summarized that both indexes are similar. Shale brittleness is also represented by two rock mechanical parameters: Poisson’s ratio and Young modulus. Under pressure, the ability of shale failure is reflected by Poisson’s ratio, and Young’s modulus reflects the ability to keep crack after the fracturing. Higher brittleness is defined as the higher Young’s modulus and lower Poisson’s ratio. Generally, Young’s modulus of shale is 10 to 80 GPa, and Poisson’s ratio is 0.20 to 0.40 [26].
Within the perspective of rock failure mechanism, the main ingredient of quartz is silicon dioxide, which has high brittleness and is easily broken forming fractures under external force. In general, the higher the quartz content of the shale reservoir was, the more natural fractures developed. Therefore, in hydraulic fracturing operations, more induce fractures are produced, and fracturing efficiency is increased. It is generally recognized that minimum quartz content is 25%, and the optimum value is 35%.
Shale reservoirs are globally the most well-known, primarily due to the exploration and production activity in North America. The Middle East has an abundance of conventional reservoirs. Unconventional resources have not yet played a significant role in the case of hydrocarbon production in this region. Therefore, limited research has been conducted on Middle Eastern unconventional resources. This paper provides valuable information on Middle Eastern shale. Furthermore, the study extends the existing knowledge of Hydrocarbon generation, migration, and accumulation in the Middle Eastern shale formation. The geochemical trend will allow us to improve formation evaluation, in particular, productivity index and organic matter maturation. In this paper, we focus on shale analysis by using programmed pyrolysis and XRD analysis. The analysis results are used to interpret petroleum potential in rocks. We presented a state-of-the-art review of Rock–Eval analysis and XRD analysis in relation to the petroleum system evaluation. On this basis, we analyzed and interpreted the Rock–Eval and XRD results of the Middle Eastern shale.

2. Material and Method

The examined 14 shale samples were collected from nine different wells in the Middle East region. Table 1 shows a list of examined samples for TOC, grain density, X-ray diffraction (XRD), specific surface area (BET), and Rock–Eval pyrolysis analysis. The examined samples are from different wells between the depth of approximately 760 to 1900 m.
The sample’s grain size distribution is shown below (Figure 1). The grain density measurement was carried out at the Institute of Drilling Engineering and Fluid Mining in the Technical University of Freiberg by using helium pycnometer (Pycnomatic-ATC). The sample was crushed by using an agate mortar (Figure 1). Grain volume was measured by using the helium pycnometer and Boyle’s law. Grain density was calculated using grain volume divided by grain weight.
The specific surface area (BET) measurements were carried out at the Institute of Electronic and Sensor material in the Technical University of Technology by using Micrometrics ASAP 2000 surface area analyzer. Powder X-ray diffractometry (P-XRD) analysis was performed at the Helmholtz Institute Freiberg by using X-ray diffractometer PANalytical Empyrean (radius 240 mm). Approximately 2 to 3 g samples were grounded to grain size between 2 and 6 µm for the XRD measurement.
The Rock–Eval analysis was performed in the Applied Petroleum Technology laboratory in Norway, with the Rock–Eval 6 standard mode on whole-rock samples, which were ground in an agate mortar. During the basic operation mode, the free hydrocarbon was removed by heating the powdered sample up to 300 °C in an inert atmosphere, without significantly decomposing kerogen. In the next stage, the samples were heated from 300 °C to 650 °C at 25 °C/min to release kerogen-bound hydrocarbons and oxygen-containing compounds. A more detailed explanation of the application and analysis is described in the Rock–Eval Analysis section (below).

2.1. Total Organic Carbon

Total organic carbon is usually measured as the weight percent (wt%) of the rock. TOC measurement includes both insoluble kerogen and soluble bitumen [27]. Different techniques are applied and recognized for the determination of total organic carbon (TOC). One of the latest techniques is the Delta logR techniques applied in Gadvan formation in the south par field [28]. Apart from carbon, organic matter also includes oxygen, hydrogen, nitrogen, and sulfur. The measurement was carried out using a Leco SC-632 instrument in the Applied Petroleum Technology laboratory in Oslo, Norway.Before TOC analysis, decarbonization is a requirement. Diluted HCl is added to the crushed rock sample to remove the carbonate. The sample is rinsed with distilled water to remove any additional HCl acid and dried in the oven at 110 °C. Subsequently, the sample is introduced into the Leco combustion oven, and the amount of carbon in the sample is measured as carbon dioxide by an IR detector.
Usually, information about three types of carbon is included in the TOC measurement: extractable organic matter (EOM), residual carbon, and convertible carbon. Carbon from EOM and residual carbon are two opposite extremes. The thermal cracking of kerogen is the mechanism behind the carbon from EOM. Already generated oil and gas is the source of carbon. The kerogen without any hydrocarbon generating potential is considered residual carbon. This is due to the very little hydrogen and the complex chemical structure. The petroleum-generating potential depends on the fraction of convertible carbon within the kerogen. The chemical composition of the convertible carbon determines the hydrocarbon-generating potential.

2.2. Specific Surface Area (SSA)

The specific surface area of these samples was calculated using Brunauer–Emmette–Teller (BET) models. Adsorption is defined as the adhesion of atoms to any surface. The gas adsorption depends on various factors, e.g., exposed surface, gas pressure, and temperature, and the strength of interaction. Nitrogen is the preferred gas due to its availability with pure form as well as its strong interaction capacity. The interaction between the solid surface and the gaseous phase is weak. Therefore, liquid nitrogen is usually used to cool the surface for adsorption detection.
The low-temperature nitrogen adsorption was performed using a Micrometrics ASAP 2000 surface area analyzer. Powder samples of approximately 3 g each were preheated in a vacuum at over 100 °C for removing all the fluids (hydrocarbon, water, and so on). The nitrogen gas (known quantity) is released step by step into the sample container. The atmospheric pressure (relative pressure) is achieved by creating a partial vacuum condition. As the saturation pressure is achieved, the adsorption process stops. Pressure changes are tracked down by a very precise pressure transducer. In the next steps (after the nitrogen adsorption), the examined samples are removed from the inert gas atmosphere and subsequently heated to release the adsorbed nitrogen/inert gas. The collected data plot the adsorped amount as a function of relative pressure. This is displayed as a BET adsorption.
The BET theory is an extension of Langmuir’s theory, which addresses the limitations of the theory by extending some additional assumptions. However, BET measurements can be applied only to dry powder samples. Additionally, the technique is very time-consuming, with a lot of laboratory preparations.

2.3. Mineralogical Characterization (X-ray Diffraction)

X-ray diffraction (XRD) analysis working principle is based on the diffraction pattern identification. XRD is used extensively across various fields including material science, mineral processing, and petroleum engineering. XRD is also used in combination with image-based mineral liberation analysis (MLA) [29,30].
Samples are usually made of crystalline powder. A monochromatic X-ray source hits the flat surface of samples. The atoms in the crystals are responsible for the X-rays’ scattered behavior. As the X-rays follow the atom’s regular patterns, the extinguished pattern will be similar. The diffractogram follows Bragg’s law for calculating the resulting angle, which is phase-dependant [31]. The quantification of phases is carried out by the Rietveld method. The specific directions appear as spots on the diffraction pattern called reflections. The measured data are compared with the theoretical single-phase diffractogram.

2.4. Rock–Eval Pyrolysis

Rock–Eval pyrolysis analyzer developed by Institute Francais du Petrole has been considered an industry standard for source rock evaluation [32]. The analysis required a small amount of pulverized sample, and the results are computed automatically. A flame ionization detector (FID) detects the organic compounds during the inert atmosphere heating (different stages of heating). Emitted CO and CO2 are measured through sensitive infrared (IR) both during pyrolysis and oxidation. A pyrogram monitors and records the temperature. Program pyrolysis techniques help to interpret the origin and thermal evolution of the pyrolyzed samples. Different authors have explained the recording techniques intensively [32,33].
Powdered samples are heated in different stages. Initially, the samples are heated up to 300 °C under an inert atmosphere and held at a constant temperature for several minutes. The objective is to measure the free oil and gas without decomposing the kerogen. A flame ionization detector (FID) detects the S2 pick, which corresponds to the generated HC in the subsurface and is expelled only during the pyrolysis.
The second pick, S2, was quantified by FID during steady heating from 300 °C to 850 °C. During this stage, the thermal breakdown of kerogen and cracking of heavy hydrocarbon produces the hydrocarbon. This reading is very important for the evaluation of unconventional (e.g., oil shale) as it indicates the hydrocarbon generation potential with the continuation of thermal maturation. Source rock evaluation criteria based on hydrocarbon generation potential are well known and listed by various authors [33].
The Rock–Eval technique measures CO2 during pyrolysis as well as oxidation. S3 peak indicates the CO2 released during the thermal cracking of kerogen under the inert atmosphere. To evaluate the hydrocarbon potential, CO2 released during pyrolysis (S3) is more important than the other CO2 peak (S3 and S5). S4 peak indicates the CO2 released during the oxidation of residual organic carbon. S4 measurement can also be broken down into CO2 and CO. S5 peak records the produced CO2 during the oxidation of the carbonate mineral.
Another important peak Tmax corresponds to the temperature at which maximum hydrocarbon is generated during pyrolysis. During the second stage of pyrolysis, Tmax is recorded as the cracking of kerogen, and heavy hydrocarbon produced the S2 peak. Tmax is important to characterize the thermal evolution of kerogen.

2.5. Important Parameters

Rock–Eval pyrolysis measurements help geochemists to identify organic matter maturity, origin, as well as kerogen type. This interpretation is carried out by analyzing the result of various components. Table 2 shows the individual parameter and formulation of different indices (HI, OI, PI, PP). Kerogen type is also inferred in these indexes (hydrogen and oxygen ratio).
Hydrogen Index (HI) is calculated from the hydrogen ratio in the kerogen. The measurement formula is defined in Table 2. The HI is in proportion to the hydrogen present in the kerogen, and higher HI indicates greater oil generation potential. From the indexes, the kerogen typing can be inferred.
Oxygen index (OI) is calculated from the oxygen ratio in the kerogen. The measurement procedure is defined in (Table 2). The OI is proportional to the oxygen present in the kerogen and is very important in the case of kerogen typing and tracking the maturation process.
Production index (PI) is calculated from the hydrocarbon generation relationship between the first two stages of pyrolysis (Table 2). PI usually increases gradually with depth as well as source rock maturation. A high S1 value is useful to identify hydrocarbon accumulation. As the thermal degradation of kerogen happens, free hydrocarbon is expelled from the source rock.
Petroleum Potential (PP)—also known as genetic potential. It is the measure of maximum hydrocarbon generation potential from a source rock (Table 2). This concept is proposed by Tissot, B.P., and Welte, B.H. [34]. This is the combination of free hydrocarbon, S1 (already generated), and hydrocarbon generation potential if the maturation continues, S2.

2.6. Hydrocarbon Source

Organic matter, which includes lipids and lignin, due to pressure and temperature transformed into kerogen [35]—Kerogen, an insoluble organic matter, literally means “Wax producer”. In the literature, kerogen has been divided into four broad categories based on maceral composition, hydrogen and oxygen content, rock pyrolysis, infrared spectrum, and kerogen δ13C [36,37].
Kerogen type I is associated with a lacustrine environment; in particular cases, marine environment is also indicated. Bacteria and microorganisms from this environment react with algal, planktonic and remaining matters to produce this type of kerogen. A lower amount of oxygen and high hydrogen content is responsible for this kerogen type. High atomic H/C, high HI, and low O/C as well as those dominated by liptinite macerals are defined as oil-prone Kerogen [38,39]. Type I kerogen main produces oil. In case of higher thermal maturity, it can also produce gas. Type I kerogen is limited worldwide; only less than 3% of the world’s hydrocarbon reserves are associated with this Kerogen type [40,41].
Kerogen type II is usually found in a moderately deep marine environment. Low carbon and high hydrogen content, capable of generating both oil and gas depending upon the thermodynamic conditions and maturation are characterized as this type of kerogen. Moderate H/C, HI, and low O/C compared to type III and IV are defined as type II/III kerogen. This type of kerogen can be derived from the remaining plankton due to the reworking of microorganisms and bacteria. North Sea (Kimmeridge clay) and Siberia (Bazhenov Formation) are famous examples of this type of kerogen. Sulfur is associated with the depositional environment either as pyrite or free sulfur. This variation is known as type IIS kerogen. In this type, due to sulfur-induced kinetic reaction, earlier oil generation occurs [15]. California (Monterey Formation) and Venezuela (La Luna Formation) are noticeable for type iiS kerogen.
Kerogen type III is usually found in shallow to deep marine or nonmarine environments. This is primarily derived from the terrigenous plant debris. In Comparison to type I and II, type III has higher oxygen content and lower hydrogen content. Therefore, this kerogen type is generally associated with dry gas generation. Most of the coals are also connected to type III kerogen.
Kerogen type IV is usually connected to the residual organic matter that is redeposited after erosion. The common understanding of this type of kerogen is that the alteration happened by biological oxidation, weathering, and combustion before deposition. High carbon content and no hydrogen imply this type of residual organic matter. Low atomic H/C, HI, and variable O/C are defined as this type of kerogen [41]. This kerogen type usually has no hydrocarbon-generating potential. Therefore, this is also considered “dead carbon”.

2.7. Thermal Maturity

Organic matter maturation happens primarily as a function of temperature increment with a supporting effect of time and pressure due to burial history. In geological measurement, time is measured over millions of years. Maturity has been connected to hydrocarbon generating potential. The process of organic matter conversion can be broadly categorized into three sections: diagenesis, catagenesis, and metagenesis. Different measured indicators are used in the industry to define maturity such as vitrinite reflectance (RO), Rock–Eval Tmax, spore color indices (SCI), and thermal alteration index (TAI). Table 3 shows the commonly used oil and gas generation window in connection with the maturity parameters.
The presented equivalencies are subject to a few caveats [42]:
  • Different kerogens respond differently as a function of temperature and time.
  • Different sampling and analytical methods have an influence.
  • Maturity terms have different interpretations in consideration of different factors.
During Rock–Eval pyrolysis, released organic matter is measured through a flame ionization detector (FID). During the S2 peak, the maximum hydrocarbon release happens; the corresponding temperature is known as Tmax. The thermal maturation is connected to Tmax. Primarily, the onset of oil generation is between 442 and 465 °C. The onset of gas generation is higher, between 465 and 525 °C.
Vitrinite reflectance is the most commonly used maturation measurement technique developed in the 1970s, initially developed for coal studies. Subsequently, it has found application in kerogen maturity detection. Lignin and cellulose from plant cells convert into vitrinite (shiny substance) due to thermal alteration. The reflectance increases, due to irreversible aromatization reactions as a result of temperature increase [39]. Reflectance and temperature have a proportional relationship, which is usually related to hydrocarbon generation. Glass or mineral-reflectance is used to calibrate the vitrinite reflectance. Oil immersion objective lens and photometers are used to measure the percentage of light reflected (RO).
Thermal maturation value varies depending upon the organic matter type. Thus, kerogen type I and type II will show different RO values. Gas usually generates beyond the oil generation window. Therefore, high maturation means higher RO values. Table 3 shows the maturity reflectance (RO) for different stages of oil generation (0.7 < RO < 1.3) and gas generation (1.3 < RO < 3). These can be sometimes misleading; therefore, maturity parameters are usually weighed along with other measurements.
Microscopic examination of spore color known as thermal alteration index (TAI) is also commonly used to measure maturity. A little less common conodont alteration index (CAI) is dependant on tiny fossilized teeth [33]. Table 3 shows the equivalence maturity values for the different indicators.
Most of the indicators are compared and corrected with vitrinite reflectance due to popularity as well as reliability.

3. Results and Discussion

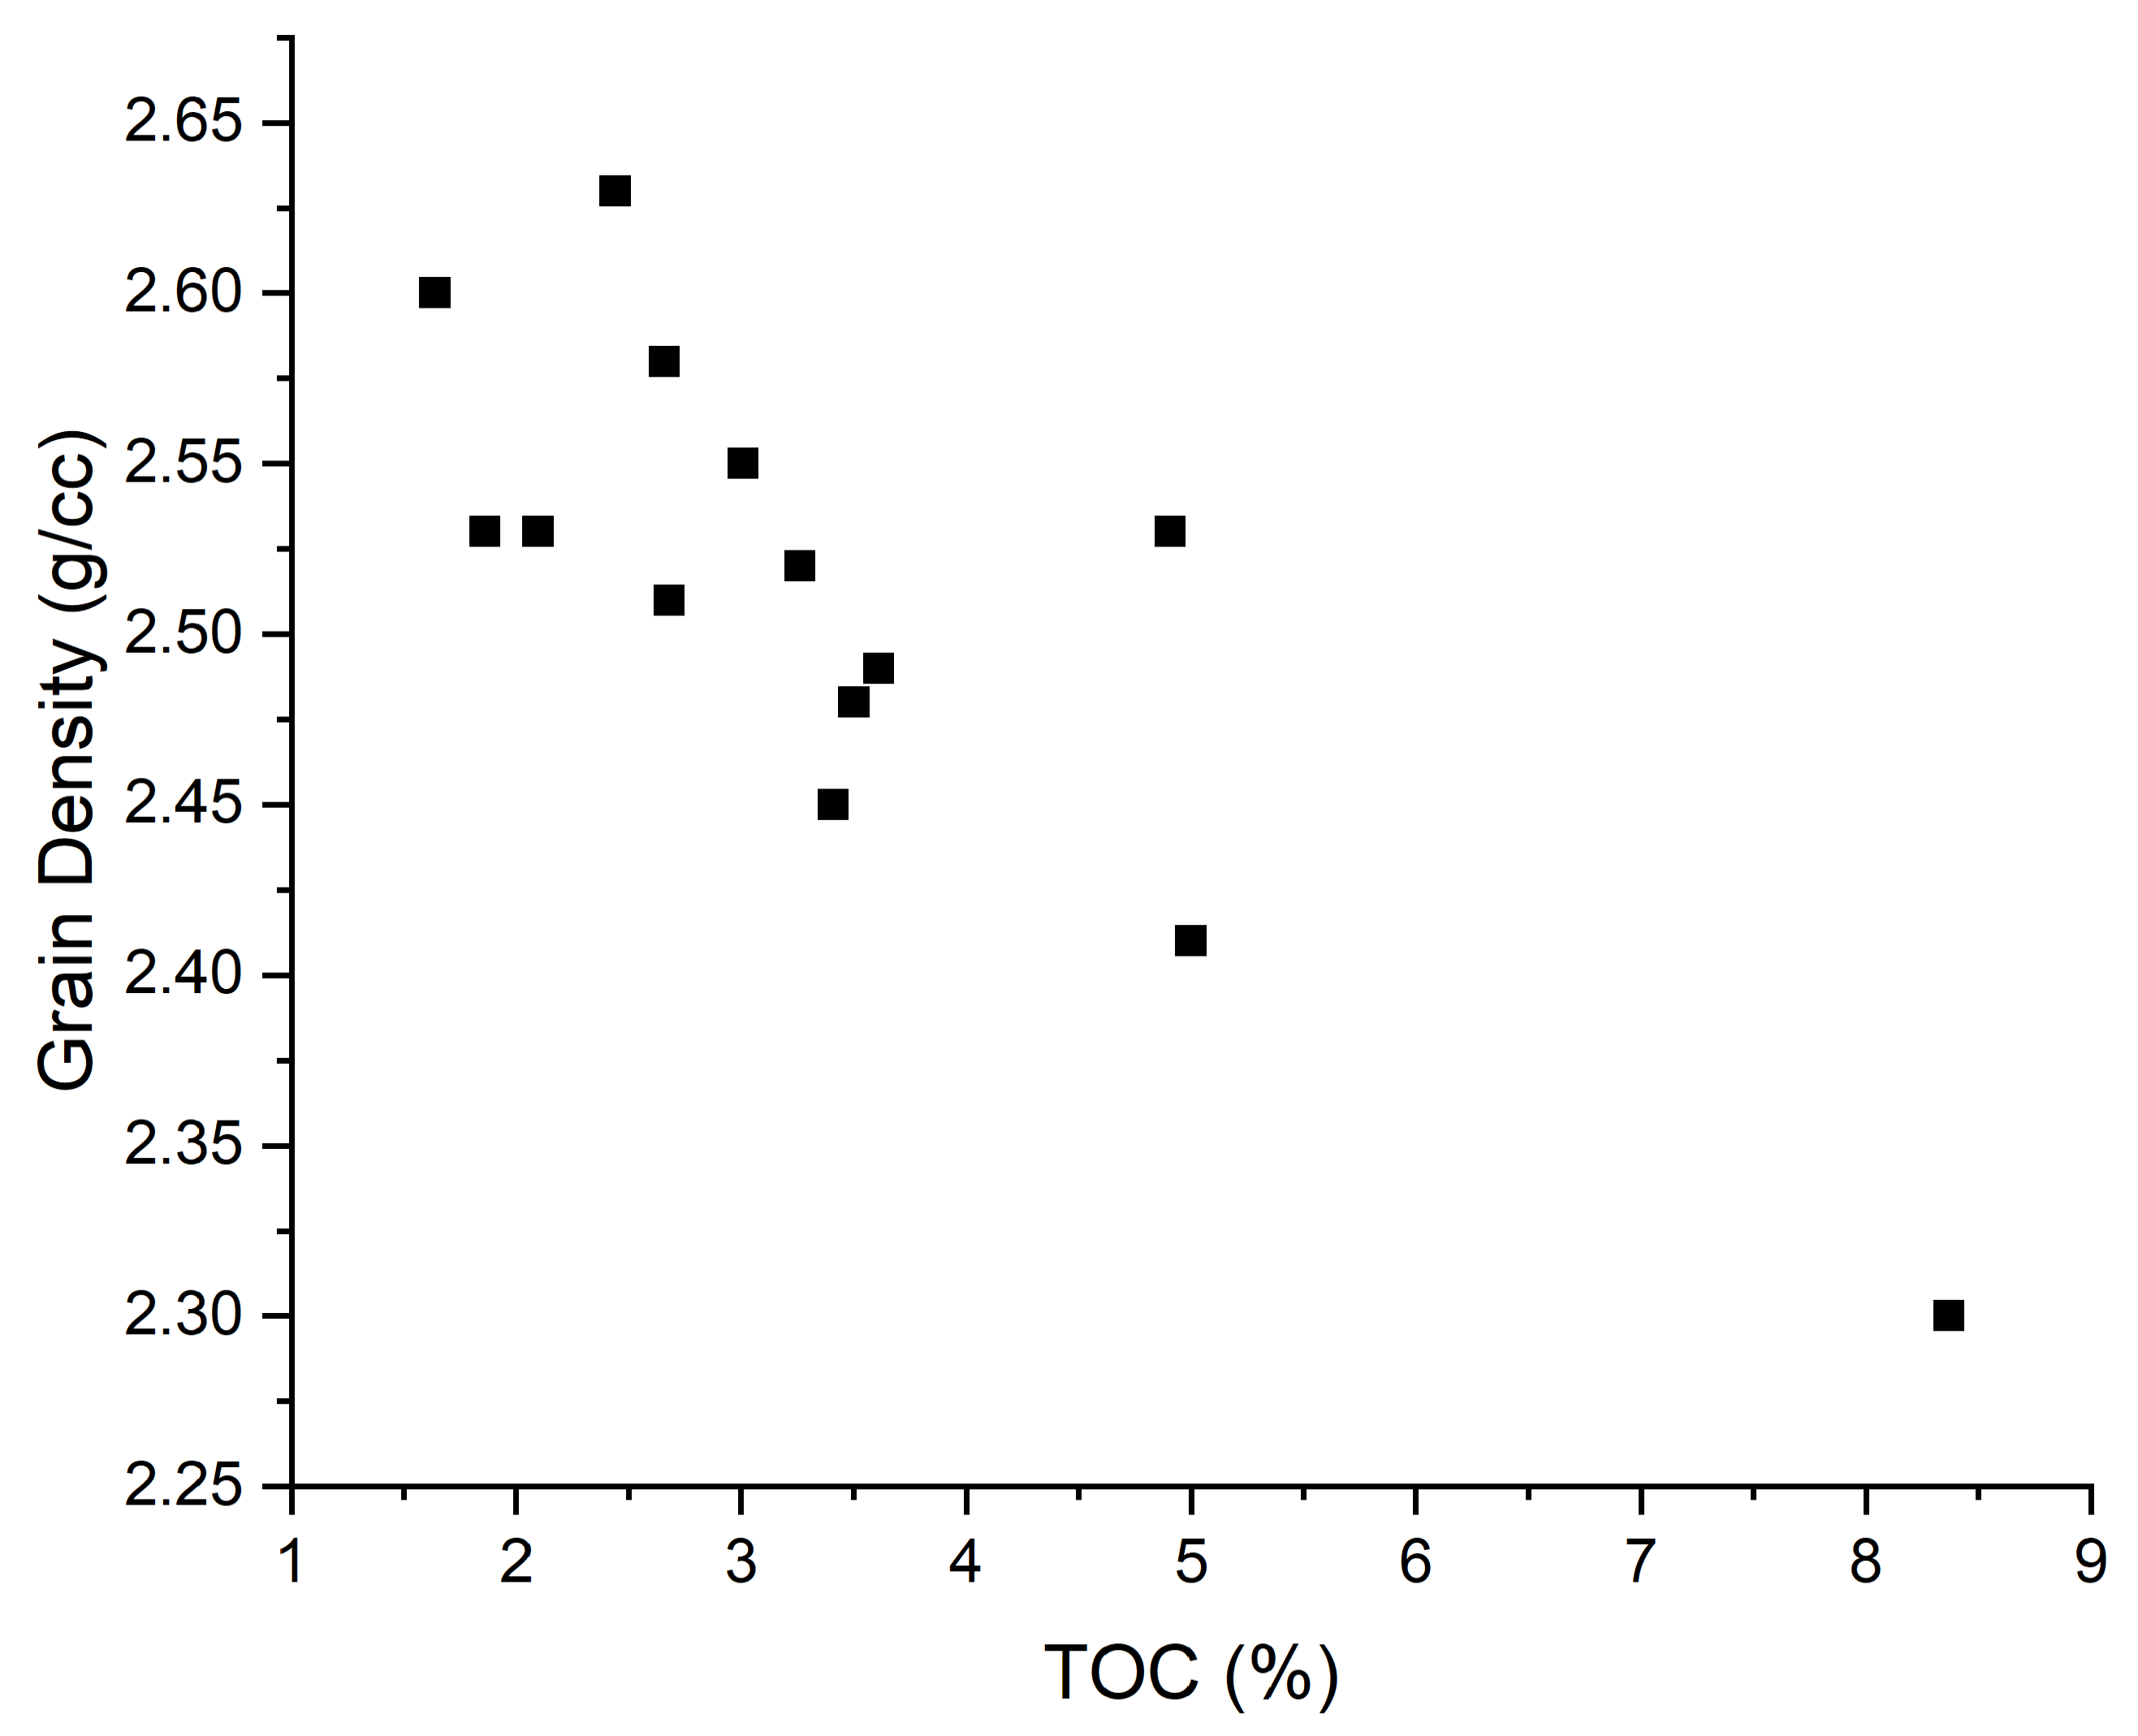
3.1. Petrophysical Characterization (TOC, Grain Density, SSA)

The TOC values of the examined samples range from 1.64% to 8.37% with most of the samples ranging between 1.6% to 3.5% (Table 4). Sample JF2-760 has the highest TOC values (8.37%), whereas sample SQ1-1340 has the lowest TOC values (1.64%). Figure 2 displays the grain density versus the TOC. Kerogen has a lower density compared with others; therefore, the higher the TOC content, the lower is the density. Grain density has a negative correlation with the TOC (Figure 2).
Specific surface area determination represents a very useful method regarding porous media characterization. Gas adsorption is the appropriate and most used method to solve this task. The BET (Brunauer, Emmett, and Teller) theory is commonly used to evaluate the gas adsorption data and generate a specific surface area result. One of the most important BET analyses and assumptions is that adsorption occurs by multilayer formation and that the number of adsorbed layers is infinite at the saturation pressure, i.e., adsorption occurs as if on a free surface. As the TOC increases, the SSA values are expected to increase. The SSA of these samples using the Brunauer Emmette Teller (BET) models is listed in Table 4. The SSA (BET) of these samples is in the range of 1.97–9.94%. The SSA (BET) has a positive correlation with the TOC value (Figure 3).
Figure 4 shows the relationship between different petrophysical properties (TOC, grain density, SSA) of the 15 shale samples across various depths. In the case of TOC, there is no direct relationship between TOC and depth. Sample JF2-760 has the highest TOC value (8.37%), although in the case of depth, this is the lowest (only 760 m). Similar to TOC, there is no obvious relationship between the other two petrophysical properties (grain density and SSA) and depth. Furthermore, there is a direct relationship between the TOC and the other two petrophysical properties (grain density and SSA). As mentioned above, the SSA has a positive correlation with TOC (Figure 3), whereas TOC and grain density have a negative correlation (Figure 2). Organic matter has a lower density than rock matrix. Therefore, higher TOC leads to lower density values.

3.2. XRD Characterization

The mineralogical composition of the examined shale samples (14 samples) was determined based on XRD patterns. The crystalline mineral proportion offers a quantitative evaluation as well as valuable petrophysical characteristics (e.g., fracability). The sample depth varies between approximately 760 m and 1900 m. The analysis results show that clay, kaolinite, muscovite, quartz, and carbonate (calcite) are the dominant mineral composition of the Middle Eastern examined shale (Figure 5). Most of the minerals show a wide range depending upon the samples. Kaolinite content range varies between 69% (WS13-1350) and 3.9% (JF2-760). Muscovite composition varies between 16.2% (WS13-1385) and 8.5% (JF2-1050). Quartz content varies between 49% (WS14-1895) and 9.1% (JF-760). JF2-760 has the highest amount of calcite (74%). The other mineral component such as albite, pyrite, barite and gypsum content varies between 5 and 7%.
In the Middle Eastern shale, the non-brittle elements (clay minerals) are dominant compared with brittle minerals (quartz). Clay mineral content is considered very relevant for economical shale production. Clay mineral usually forms structures (edge–face/edge–edge/face–edge) of orientated flakes [43,44]. The inter-particle clay flake pores are responsible for the volume of the structure. The pores between flocculates are mostly larger than the methane molecules. However, higher clay content leads to lower brittleness, which is unfavorable for hydraulic fracture operation [45]. Considering the mineral composition of Middle Eastern shale, the areas are not favorable for hydraulic fracture.

3.3. Rock–Eval Pyrolysis

The results of the Rock–Eval analysis are presented in Table 5.

3.4. Organic Source Richness

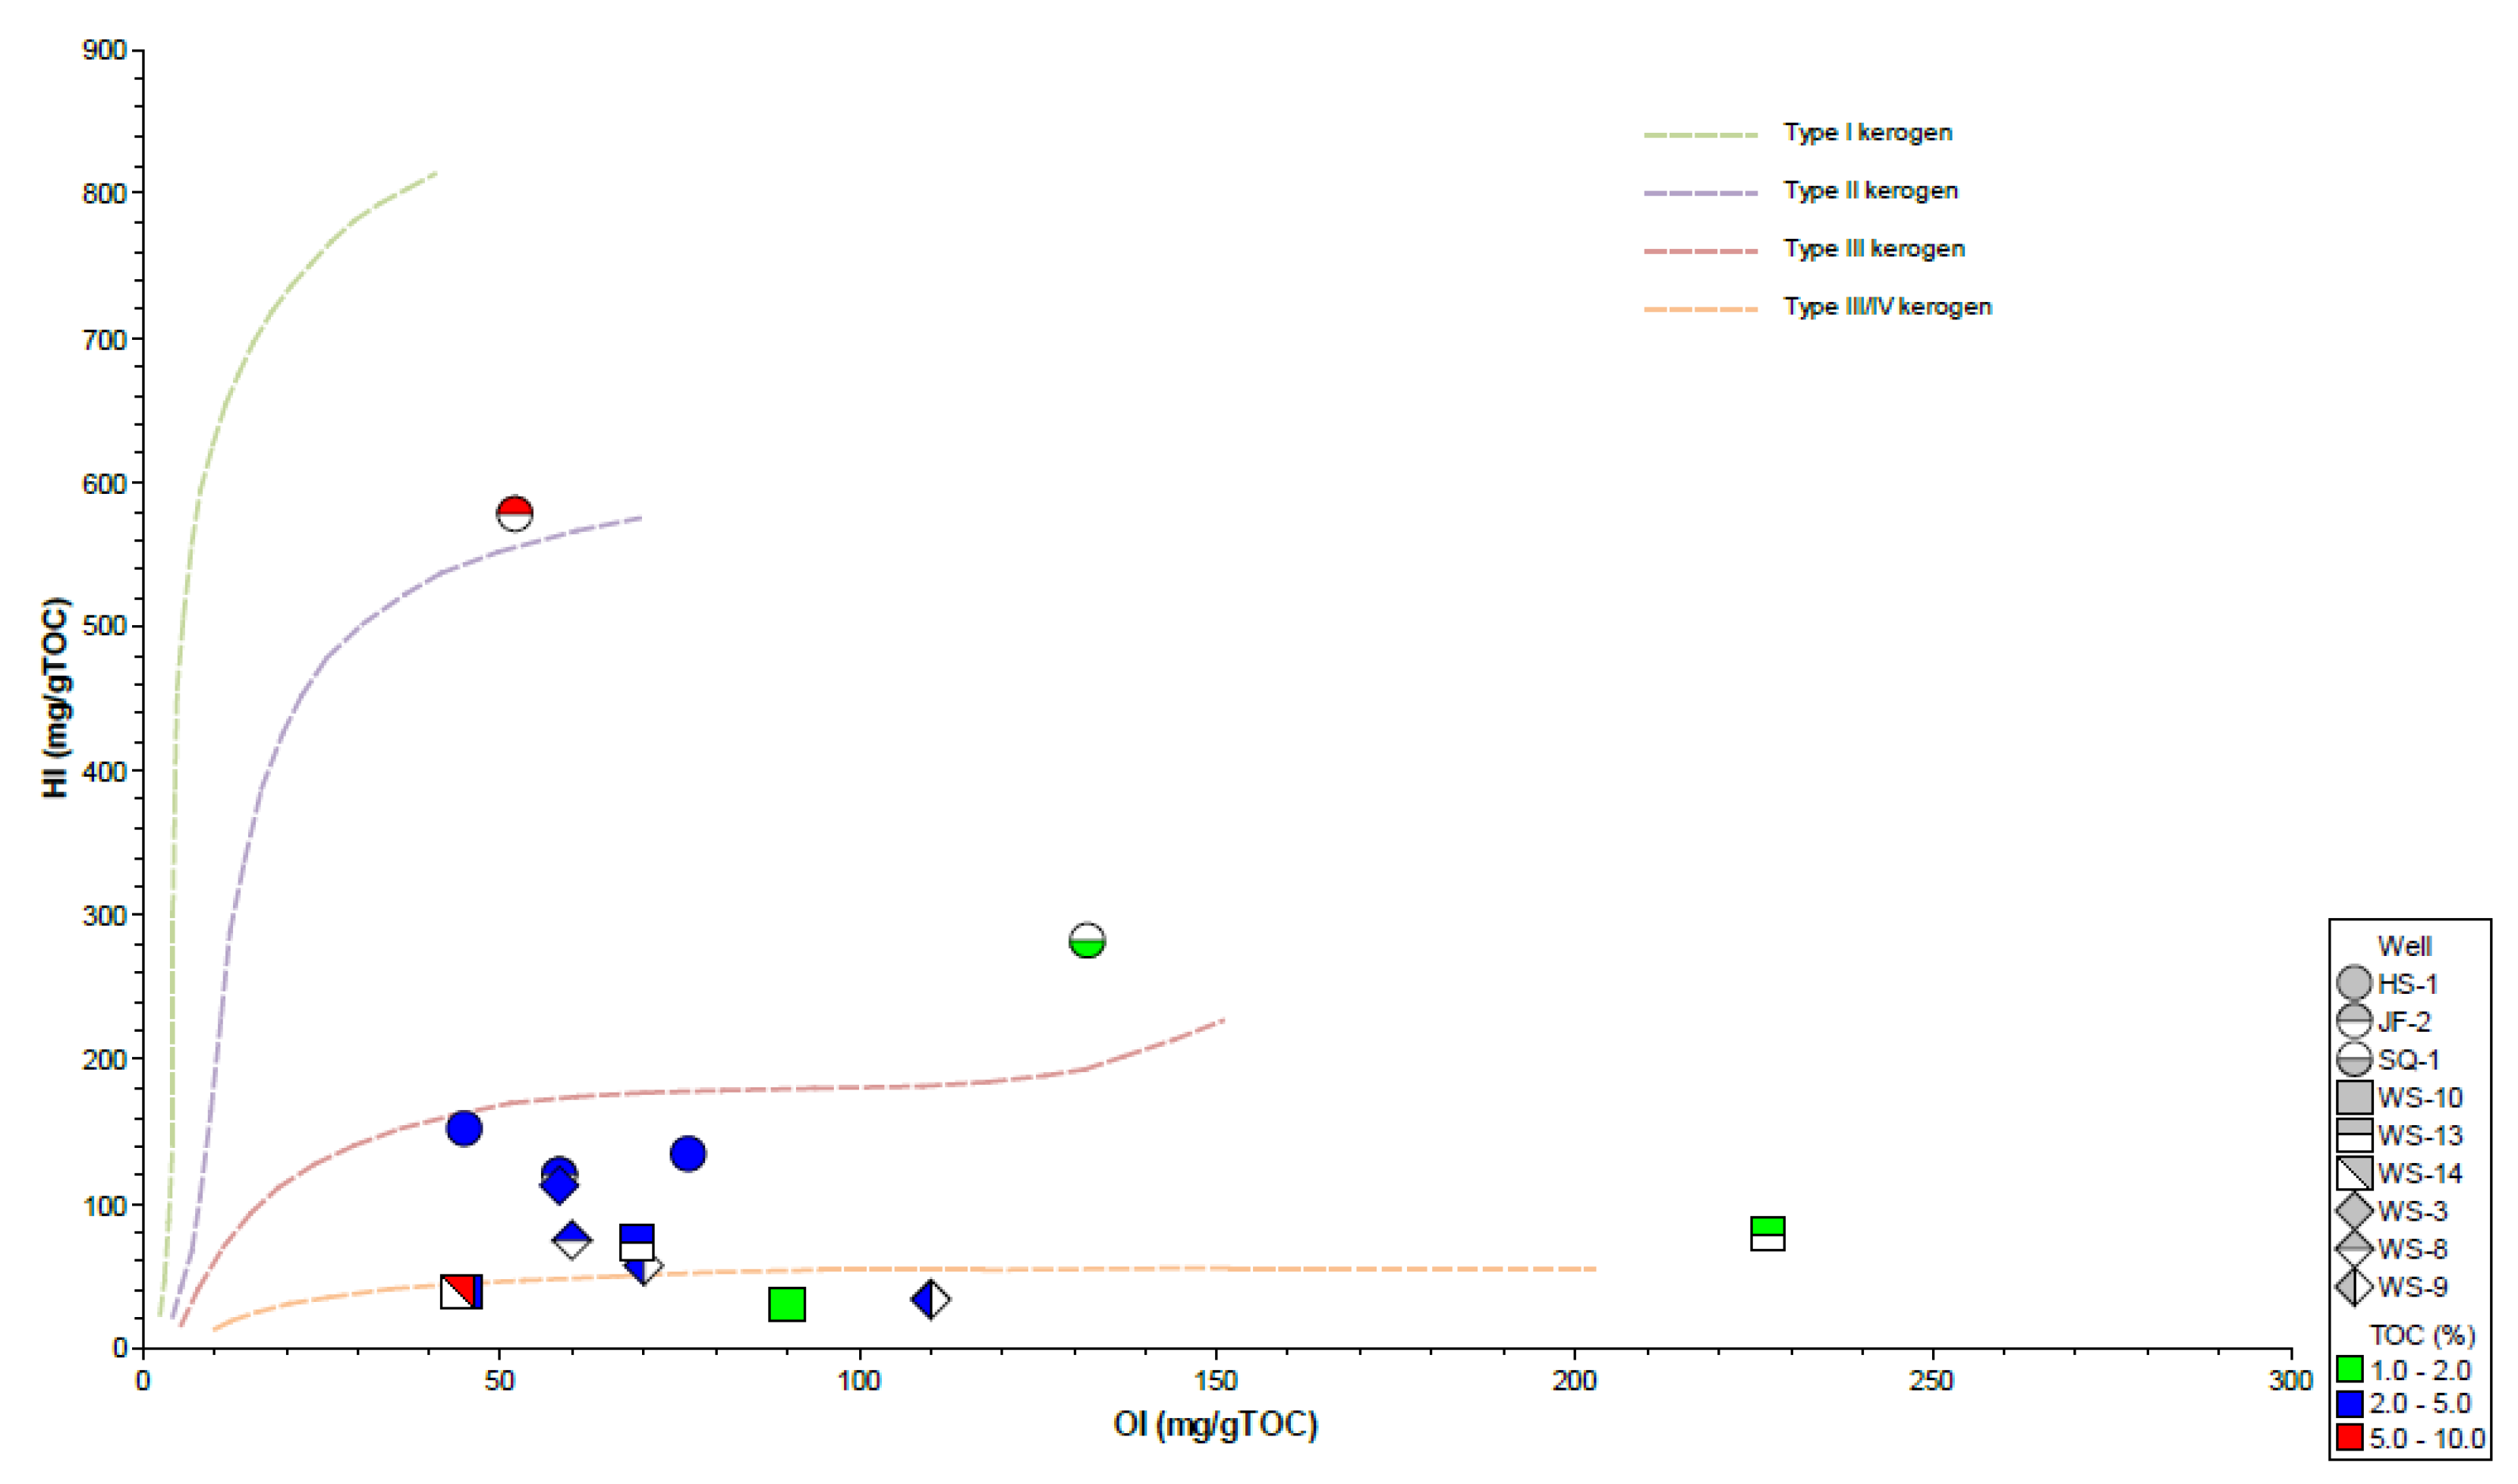
3.4.1. Organic Matter Quality

As described by Van Krevelen (1961) [46], the hydrogen index (HI) is one of the most important geochemical parameters for source rock evaluation. Availability of hydrogen has importance in identifying petroleum generation potential [27,47]. The HI index has a wide range (34–578 mg HC/gTOC) (Table 5). JF2-760 has the highest HI, and SQ1-1340 has the second-highest HI value, respectively, 578 and 282 mg HC/ gTOC. HS1-1515, HS1-1520, JF2-1050, and WS3-1490 have HI values similar to the type III kerogen Van Krevelen diagram (Figure 6). Plotting S2 against TOC (Figure 7) and hydrogen index (HI) against oxygen index (OI) show that the shale has type iii kerogen, which can be generally assumed to be terrestrial land plants (Figure 6).

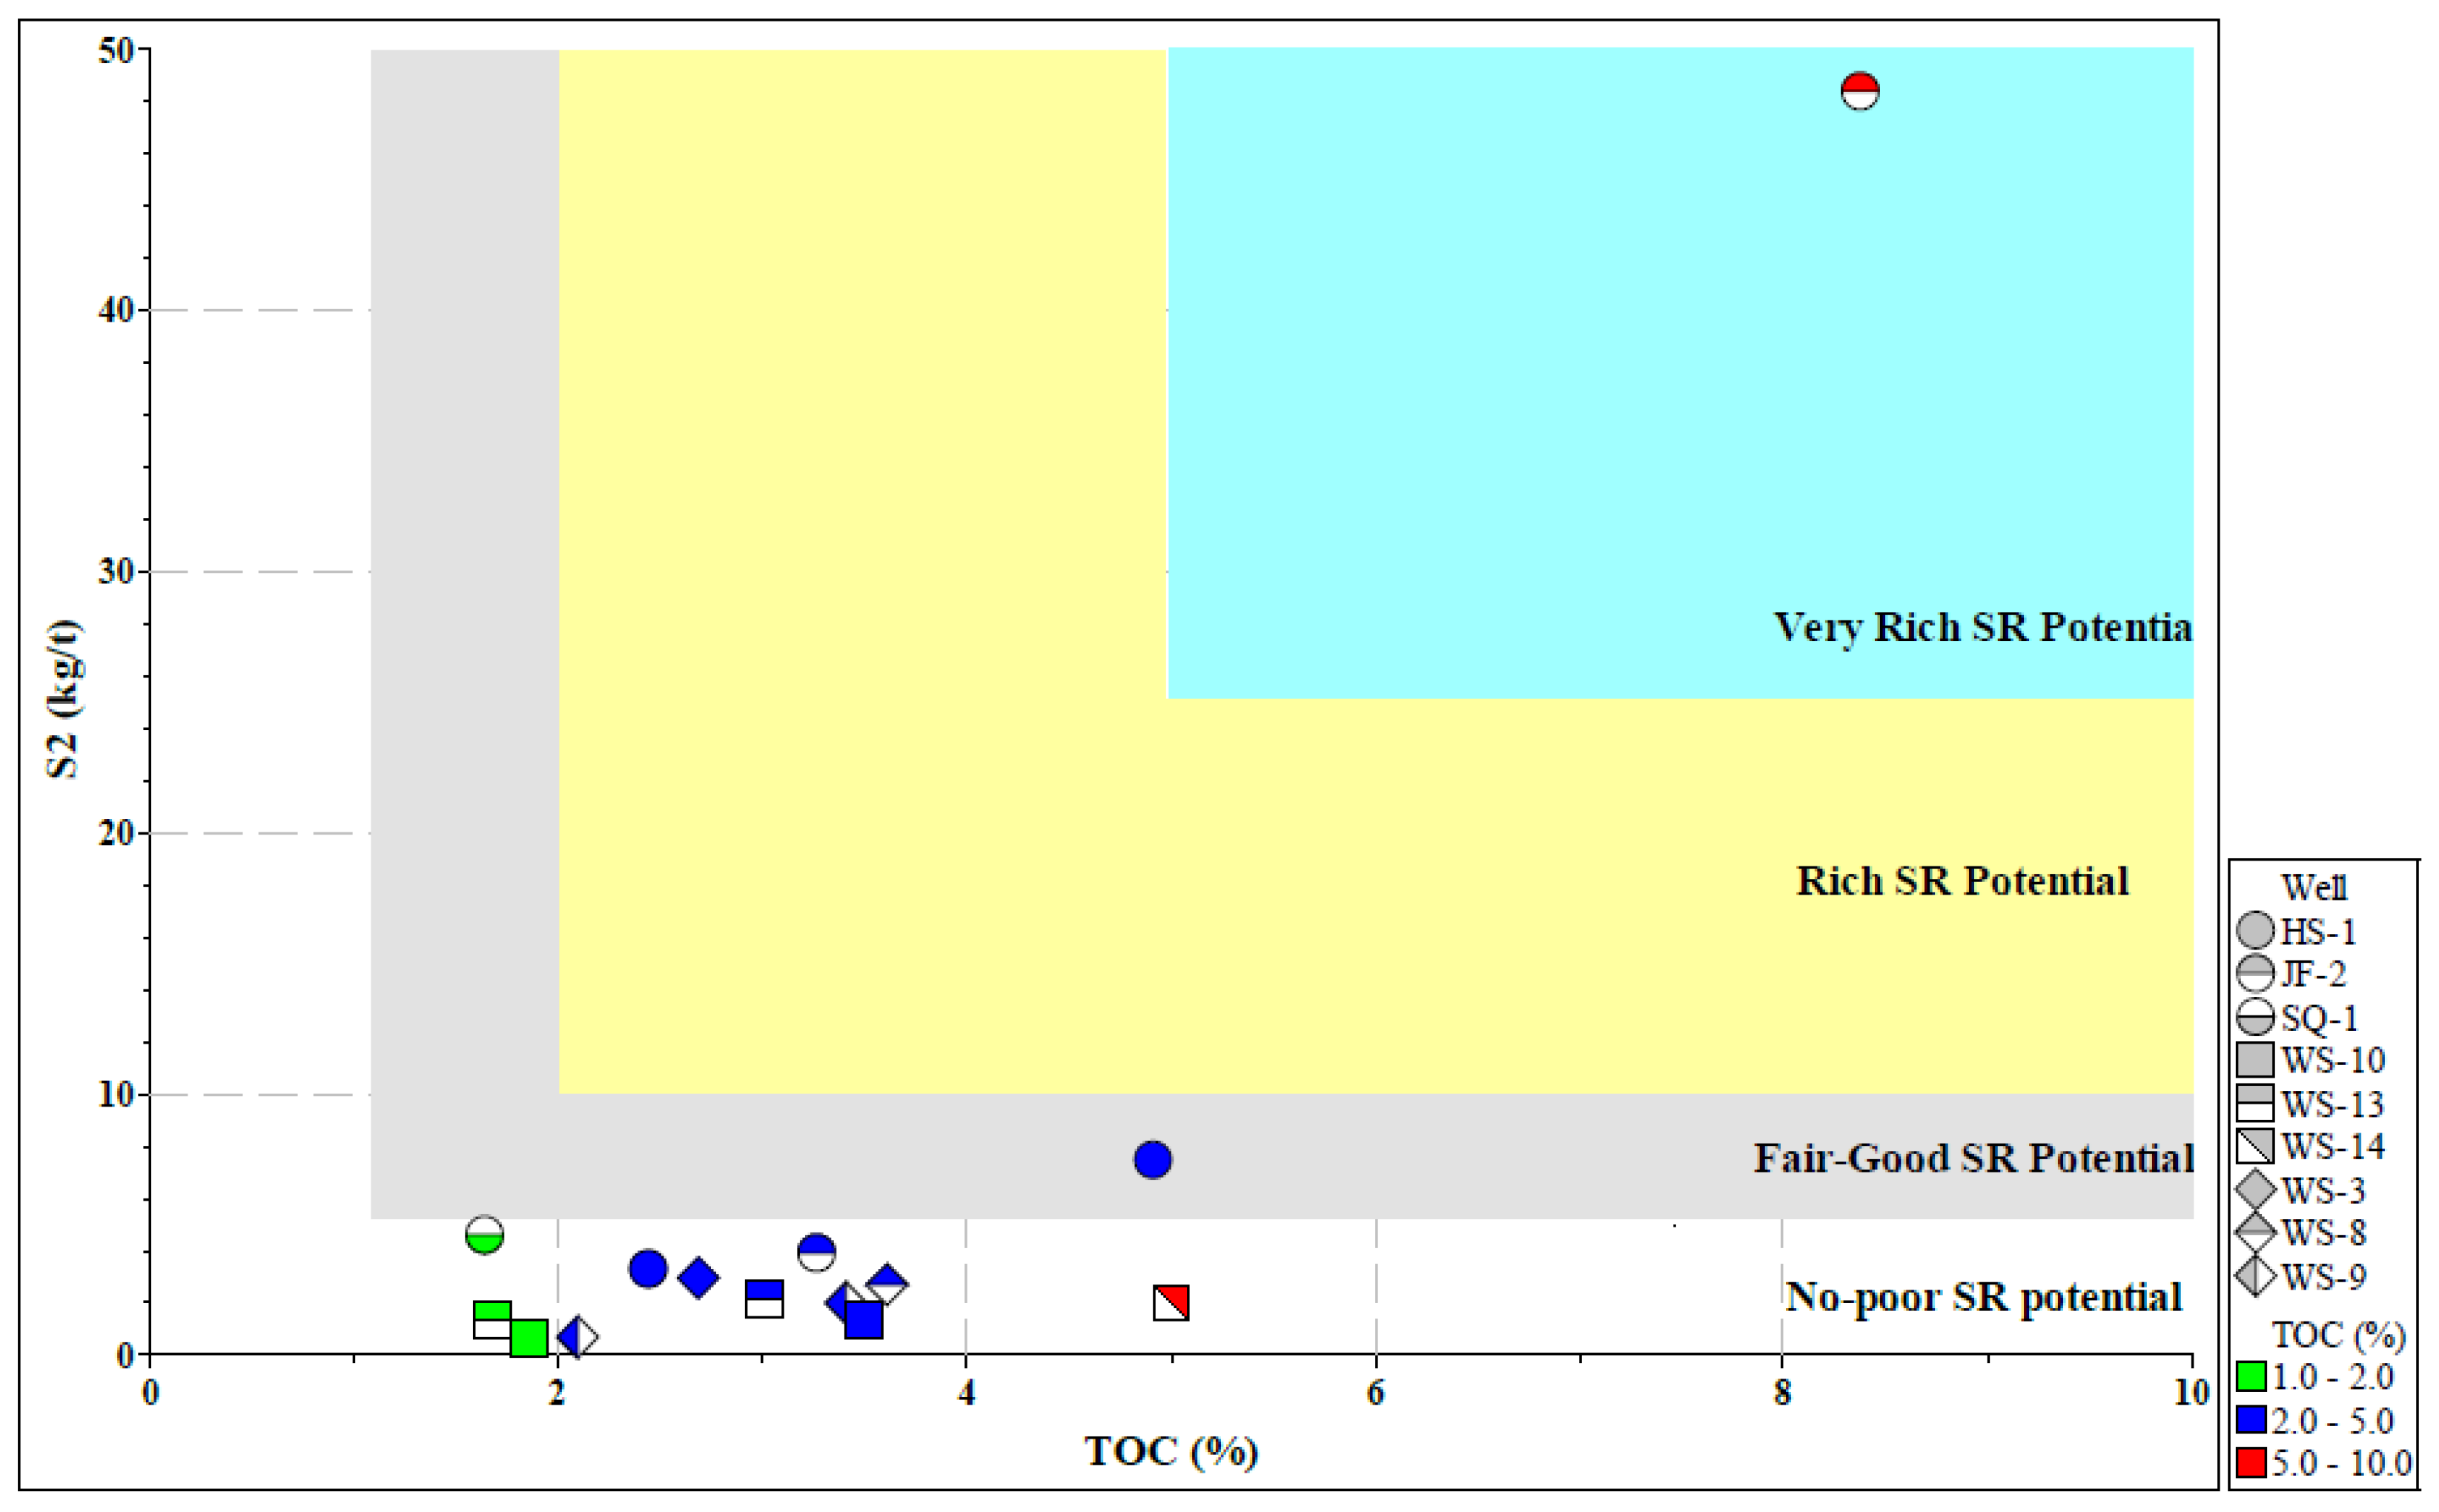
3.4.2. Hydrocarbon Potential

Hydrocarbon potential is generally identified as (S2) values that range very low (below 5 mg/g) (Table 5). Most of the examined samples have very little hydrocarbon generation potential (Figure 7). The only exceptions are JF2-760 (48.38 mg/g) and HS1-1520 (7.45 mg/g) (Figure 7).

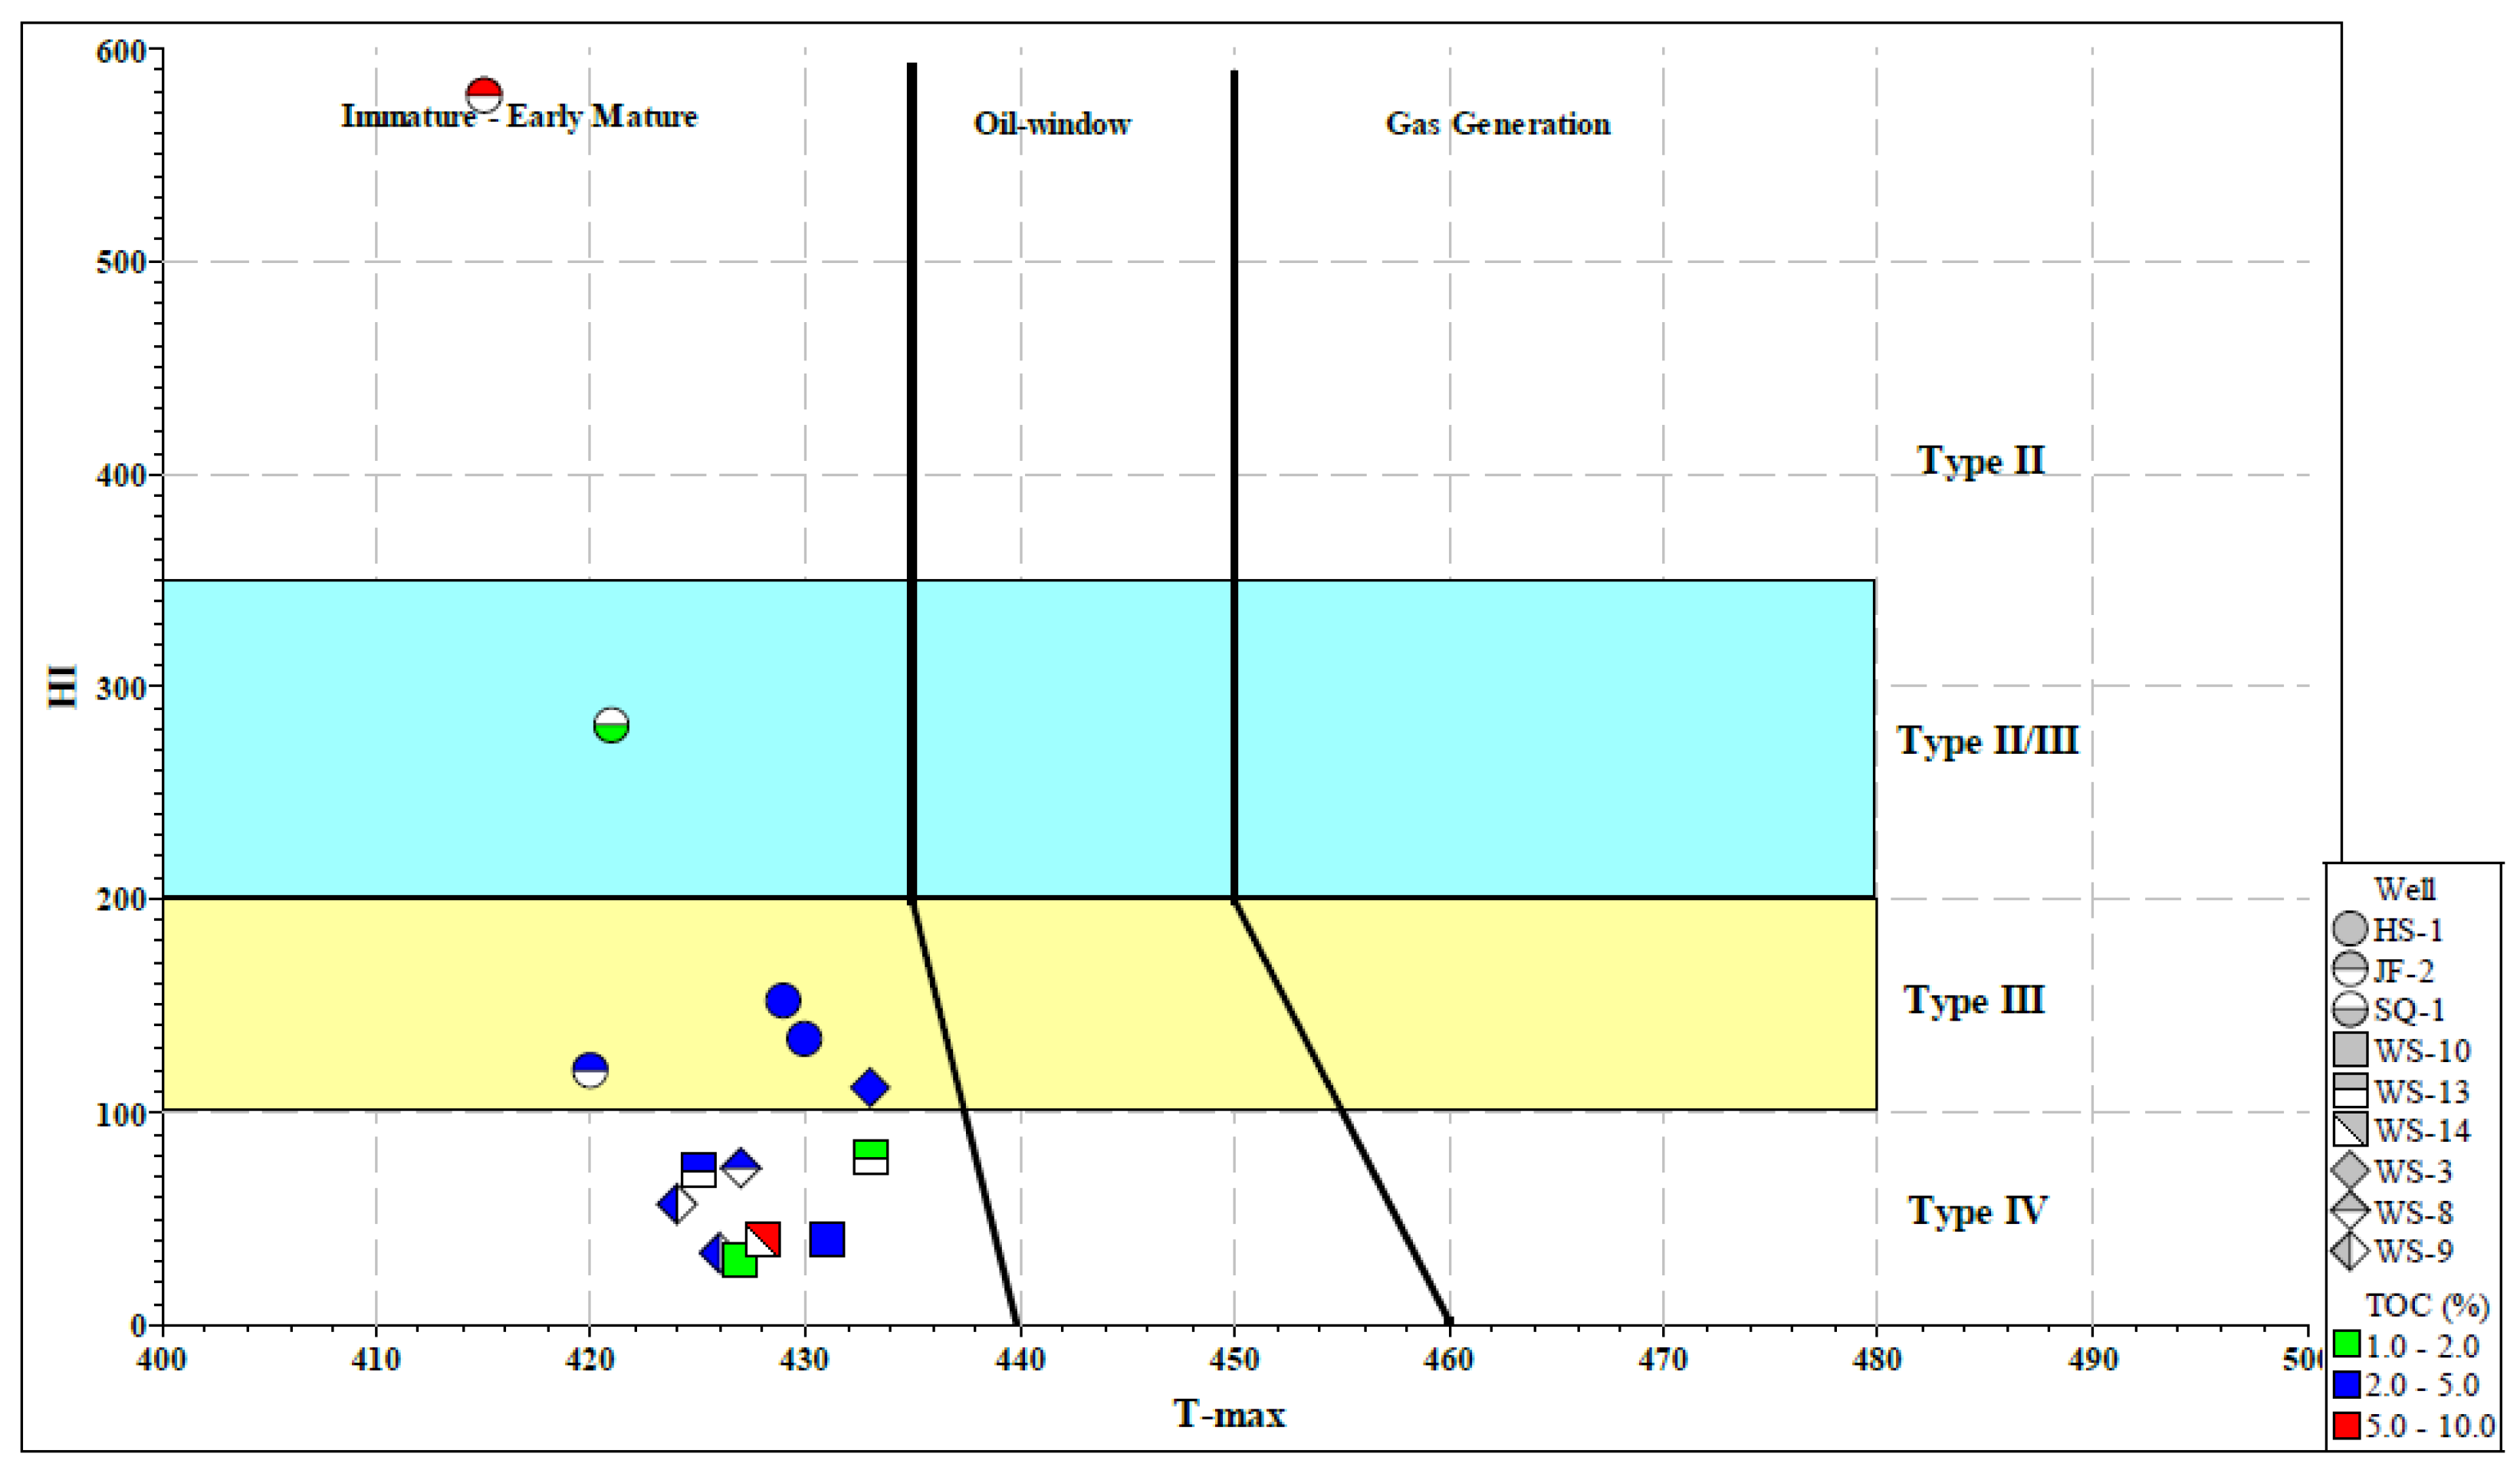
3.4.3. Thermal Maturity

The thermal maturity of the analyzed samples was indicated by Tmax of 415–433 °C, indicating that these samples are immature in nature. WS13-1350 has indicated the highest Tmax of 433 °C, and JF2-760 indicated the lowest Tmax of 415 °C among the investigated samples. The data from the investigated samples are immature-to-early-mature in nature to generate and expel hydrocarbon. The plot HI versus Tmax (Figure 8) reveals that all the samples are immature-to-marginally-mature for hydrocarbon generation and expulsion. Production index (PI) and the Tmax reveals the important information related to kerogen to oil and gas conversion. The results (Table 5) show that all the samples have a comparatively low value of PI, which is also in line with low Tmax, implying low conversion potential.

4. Conclusions

In this paper, the unconventional petroleum system (shale) of the Middle East was evaluated considering TOC, Rock–Eval pyrolysis, and X-ray diffraction results. A total of Middle Eastern shale samples were analyzed. The following are the key findings:
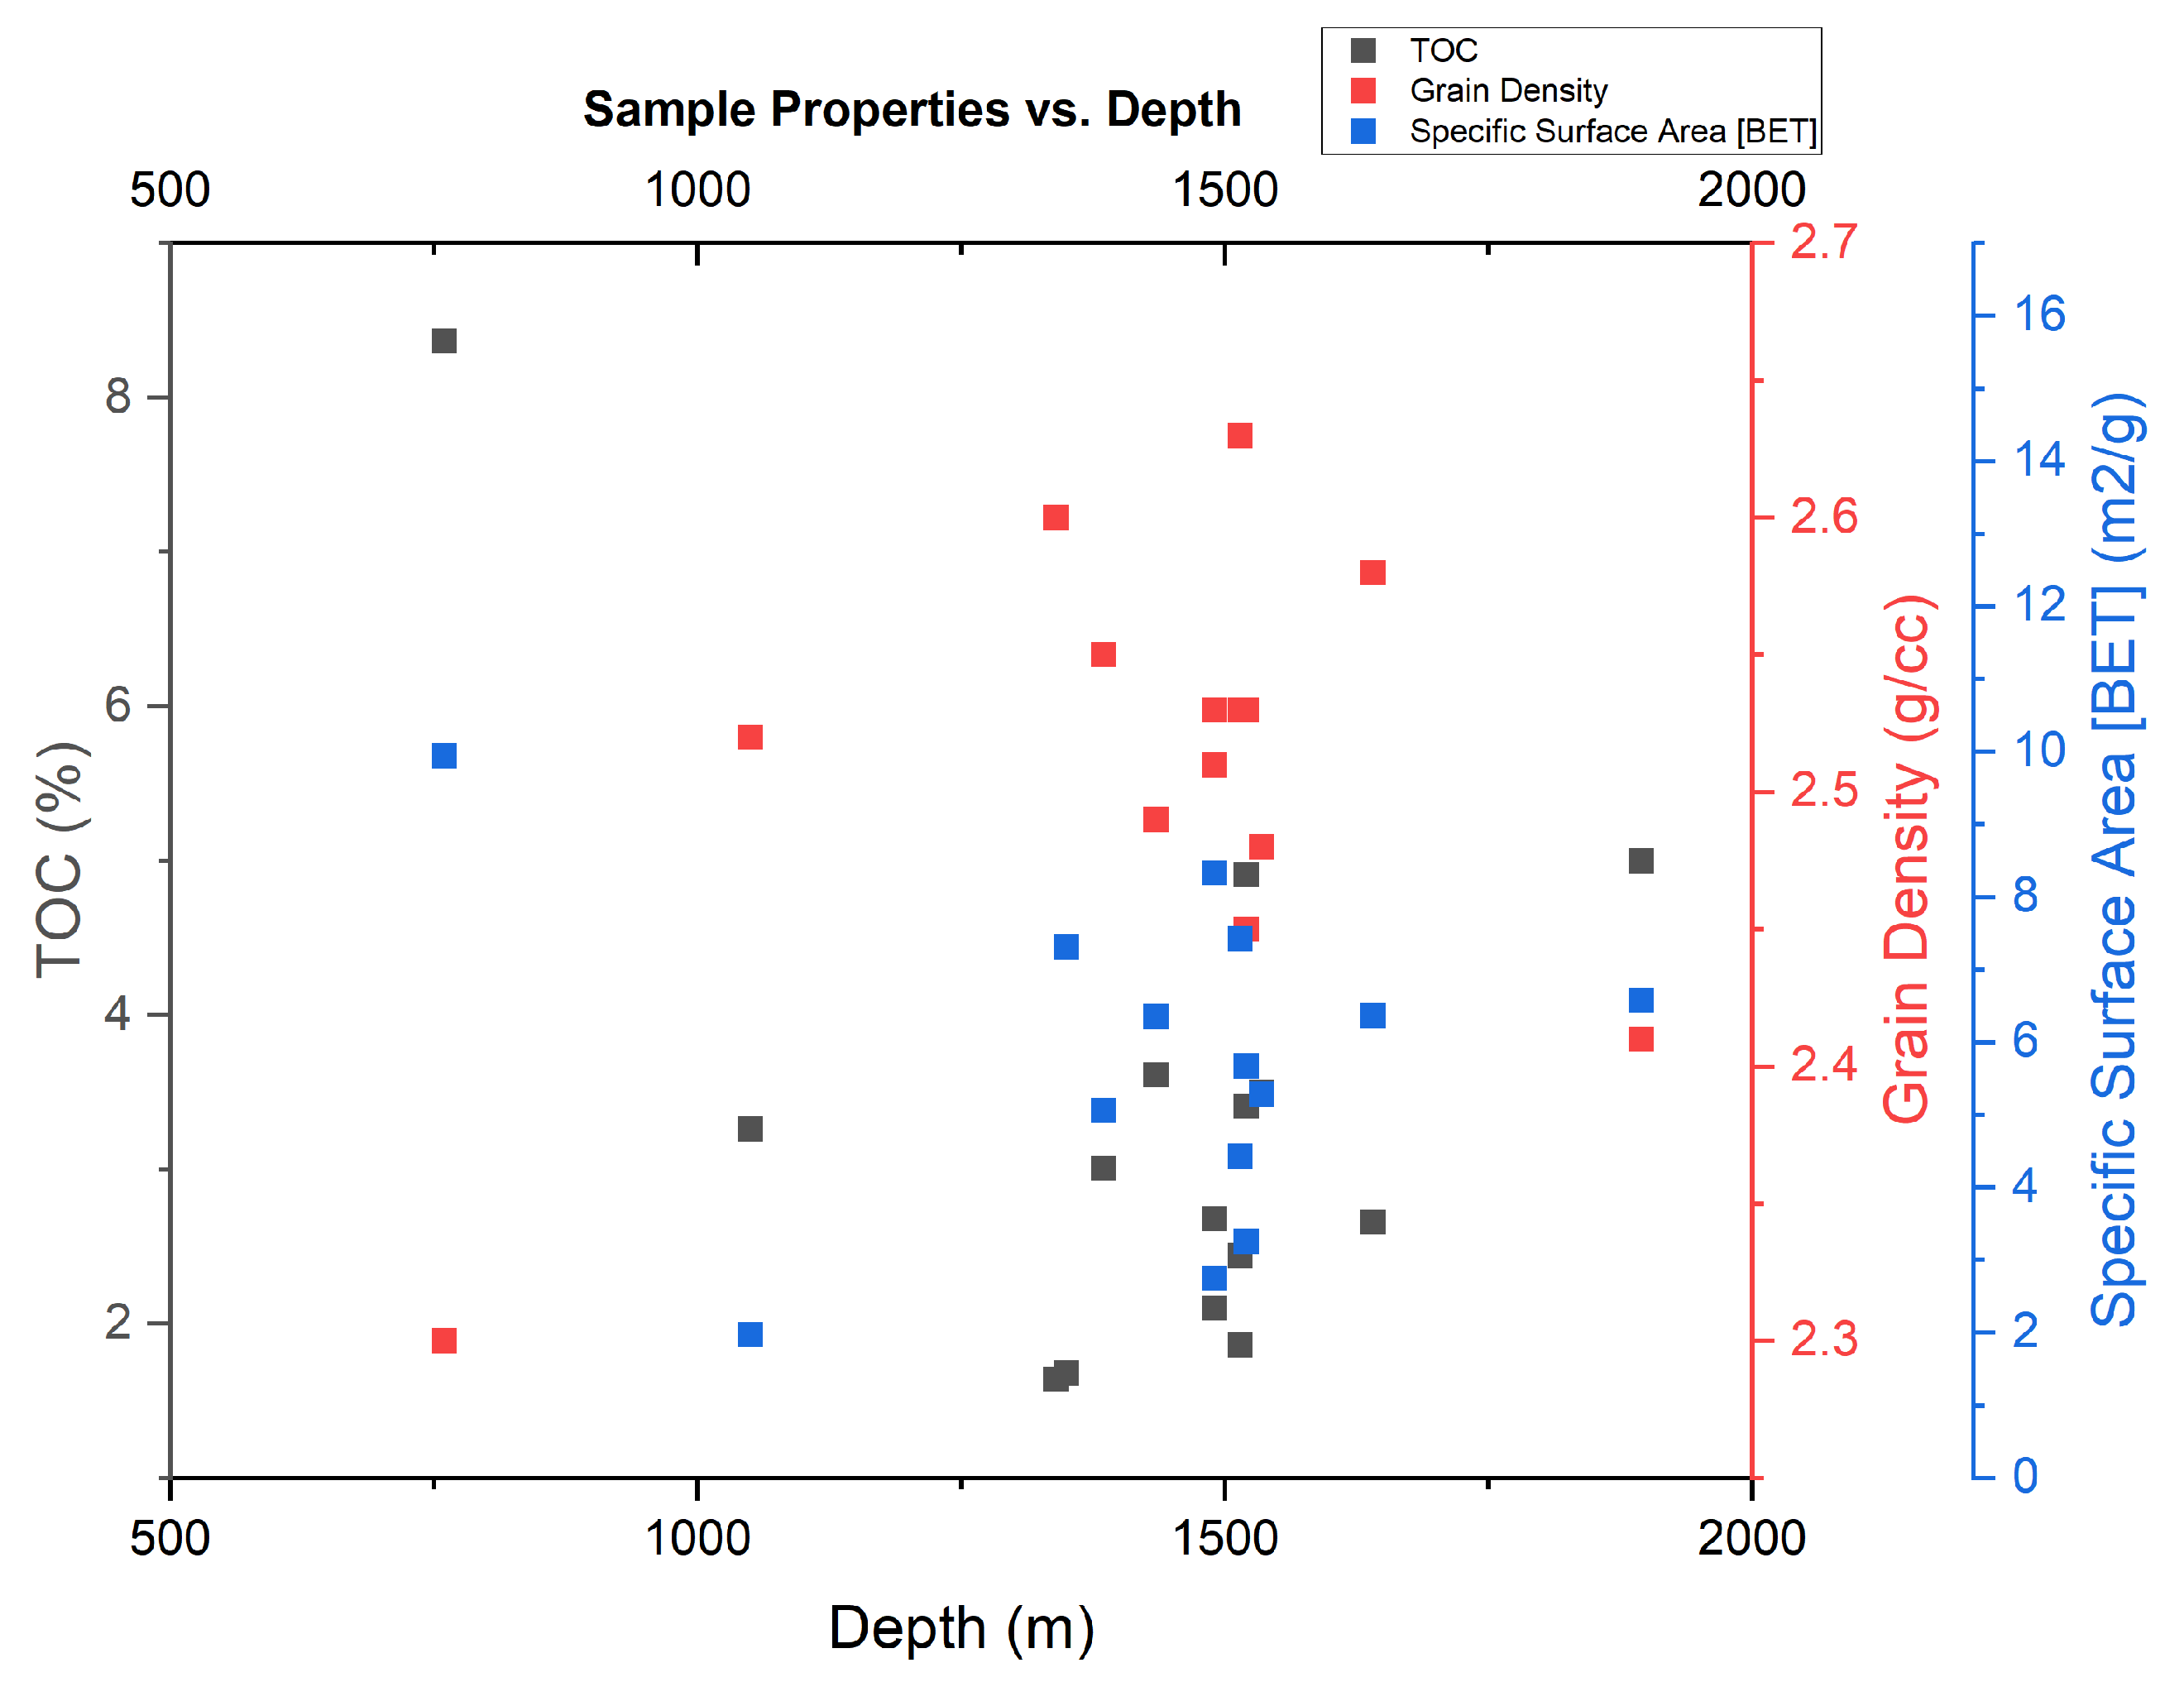
  • The TOC and grain density of these examined samples are in the range of 1.64–8.37% and 2.3–2.63 g/cc. As the organic component has a lower density than the minerals, the TOC and density of the samples have an inversely propositional relationship.
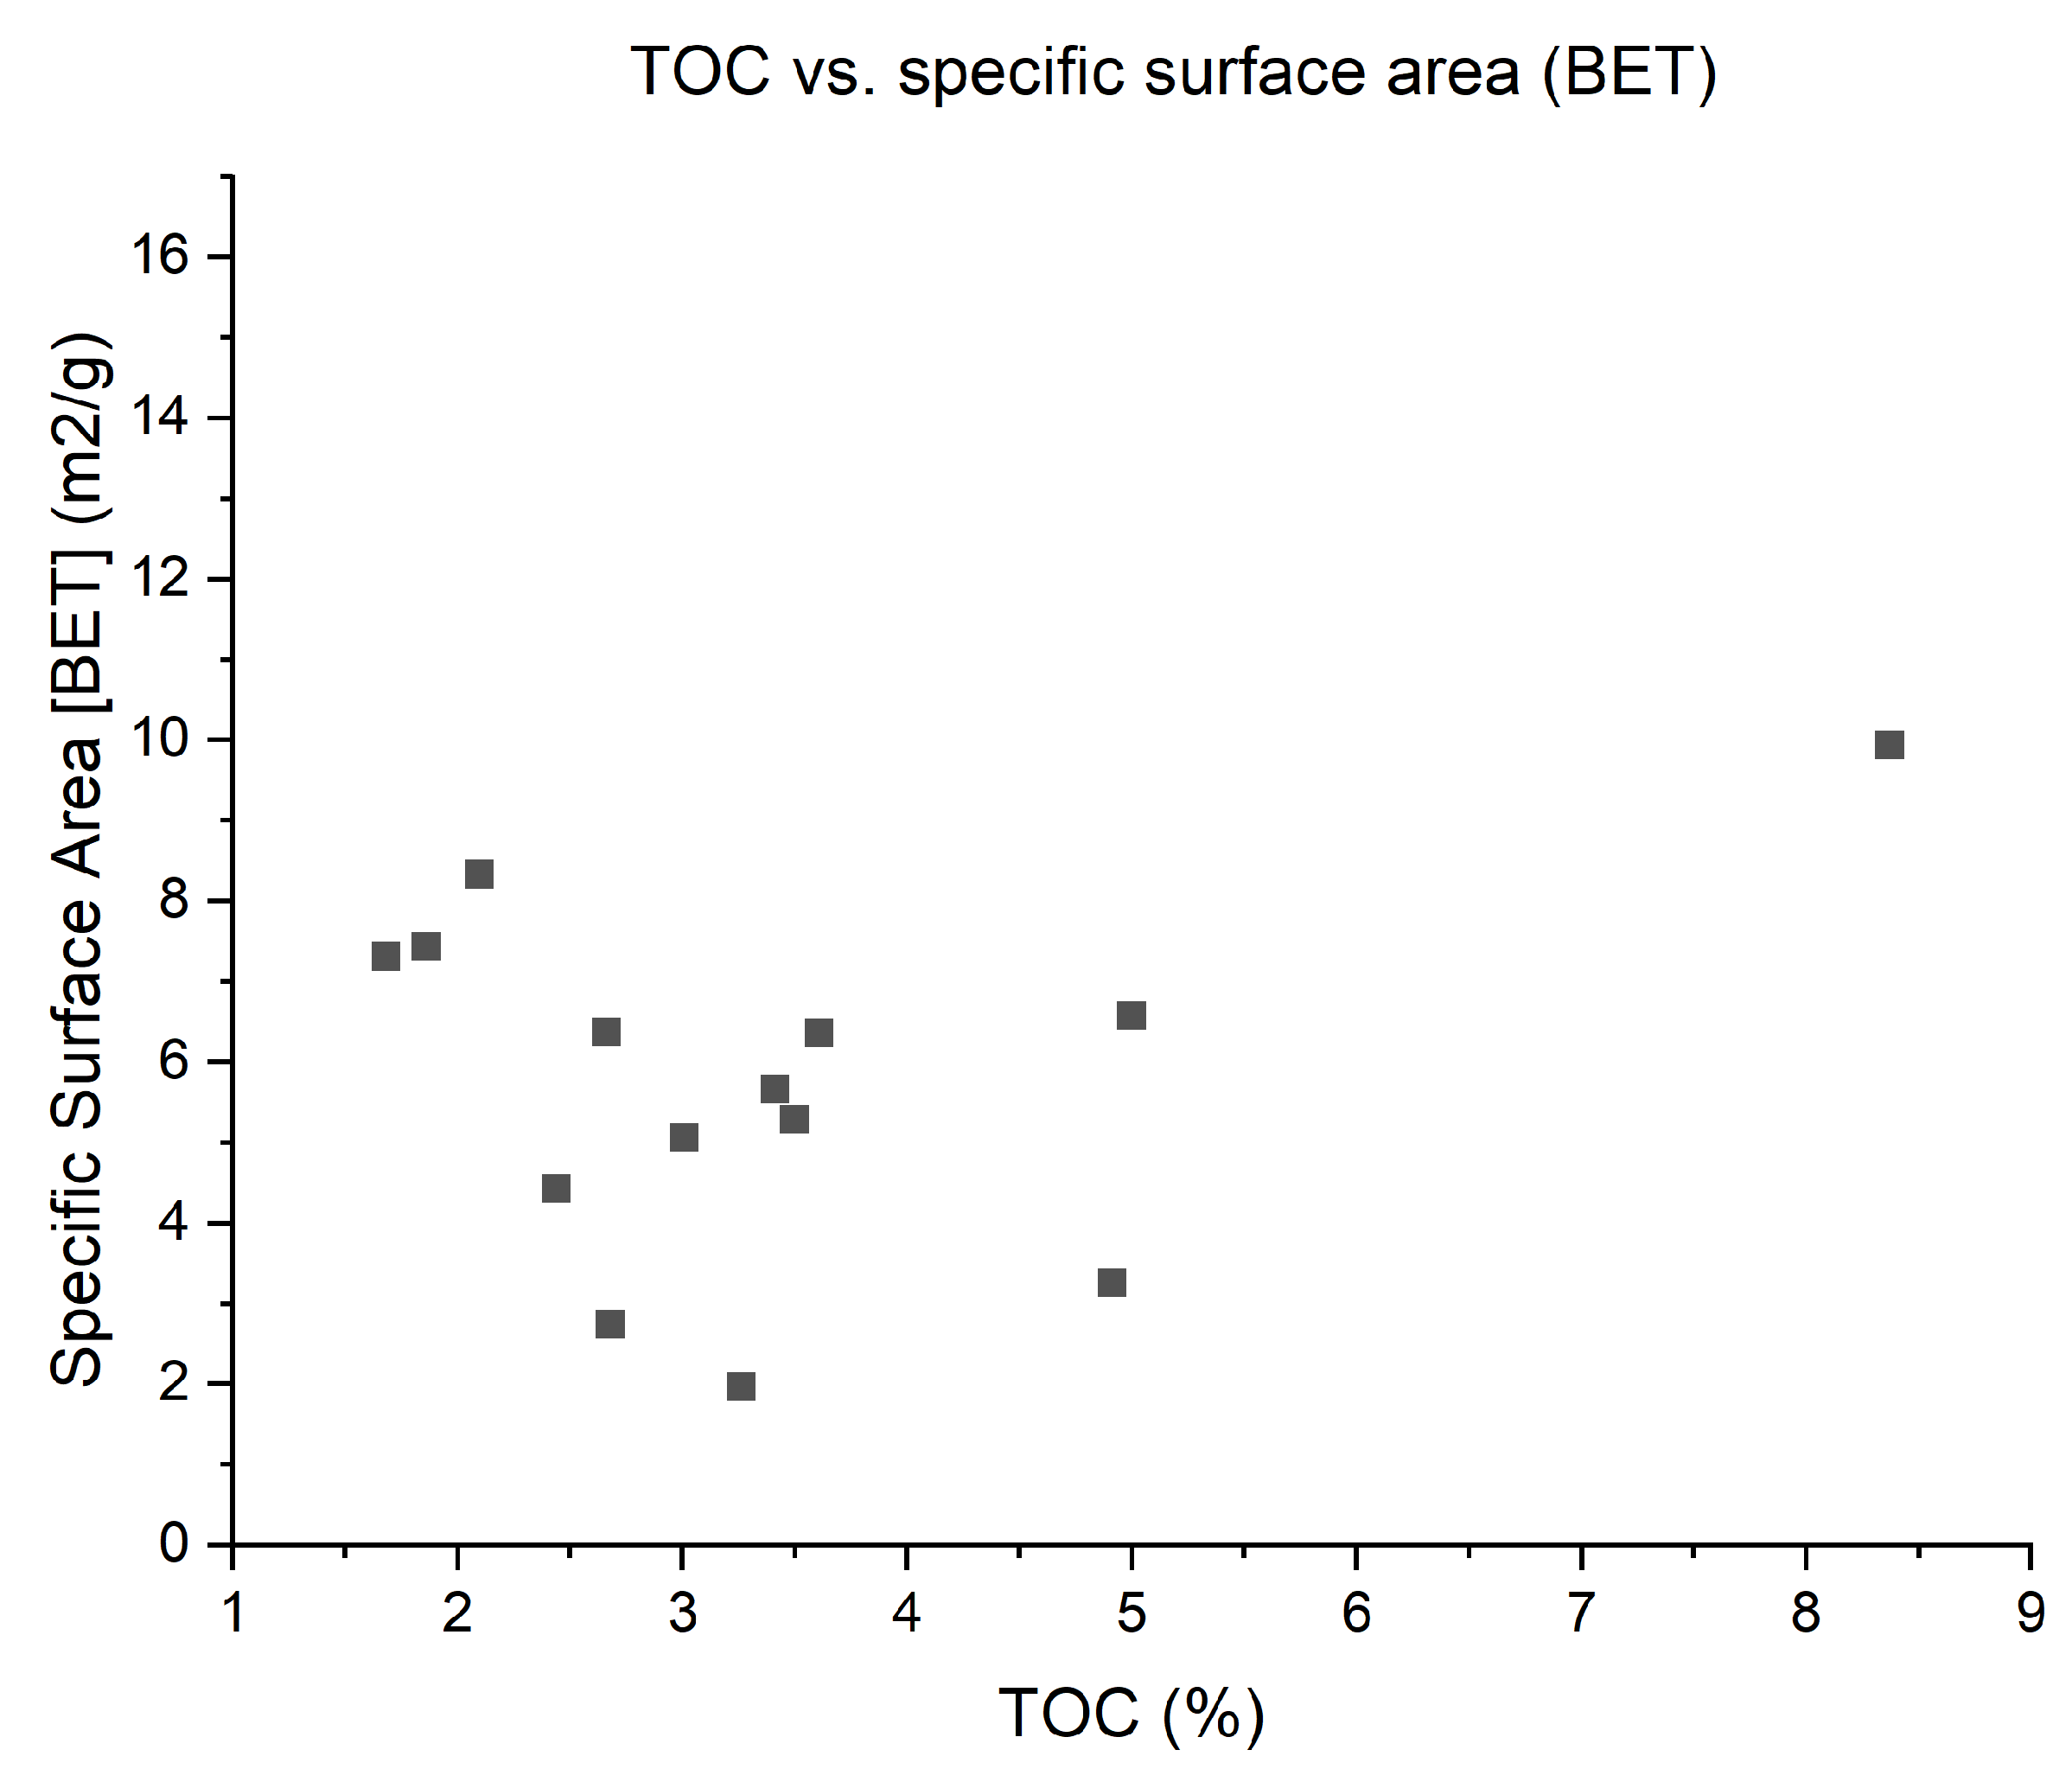
  • The specific surface area (BET) of the examined samples is in a range of 1.97–9.94 m2/g, which has a positive correlation with TOC.
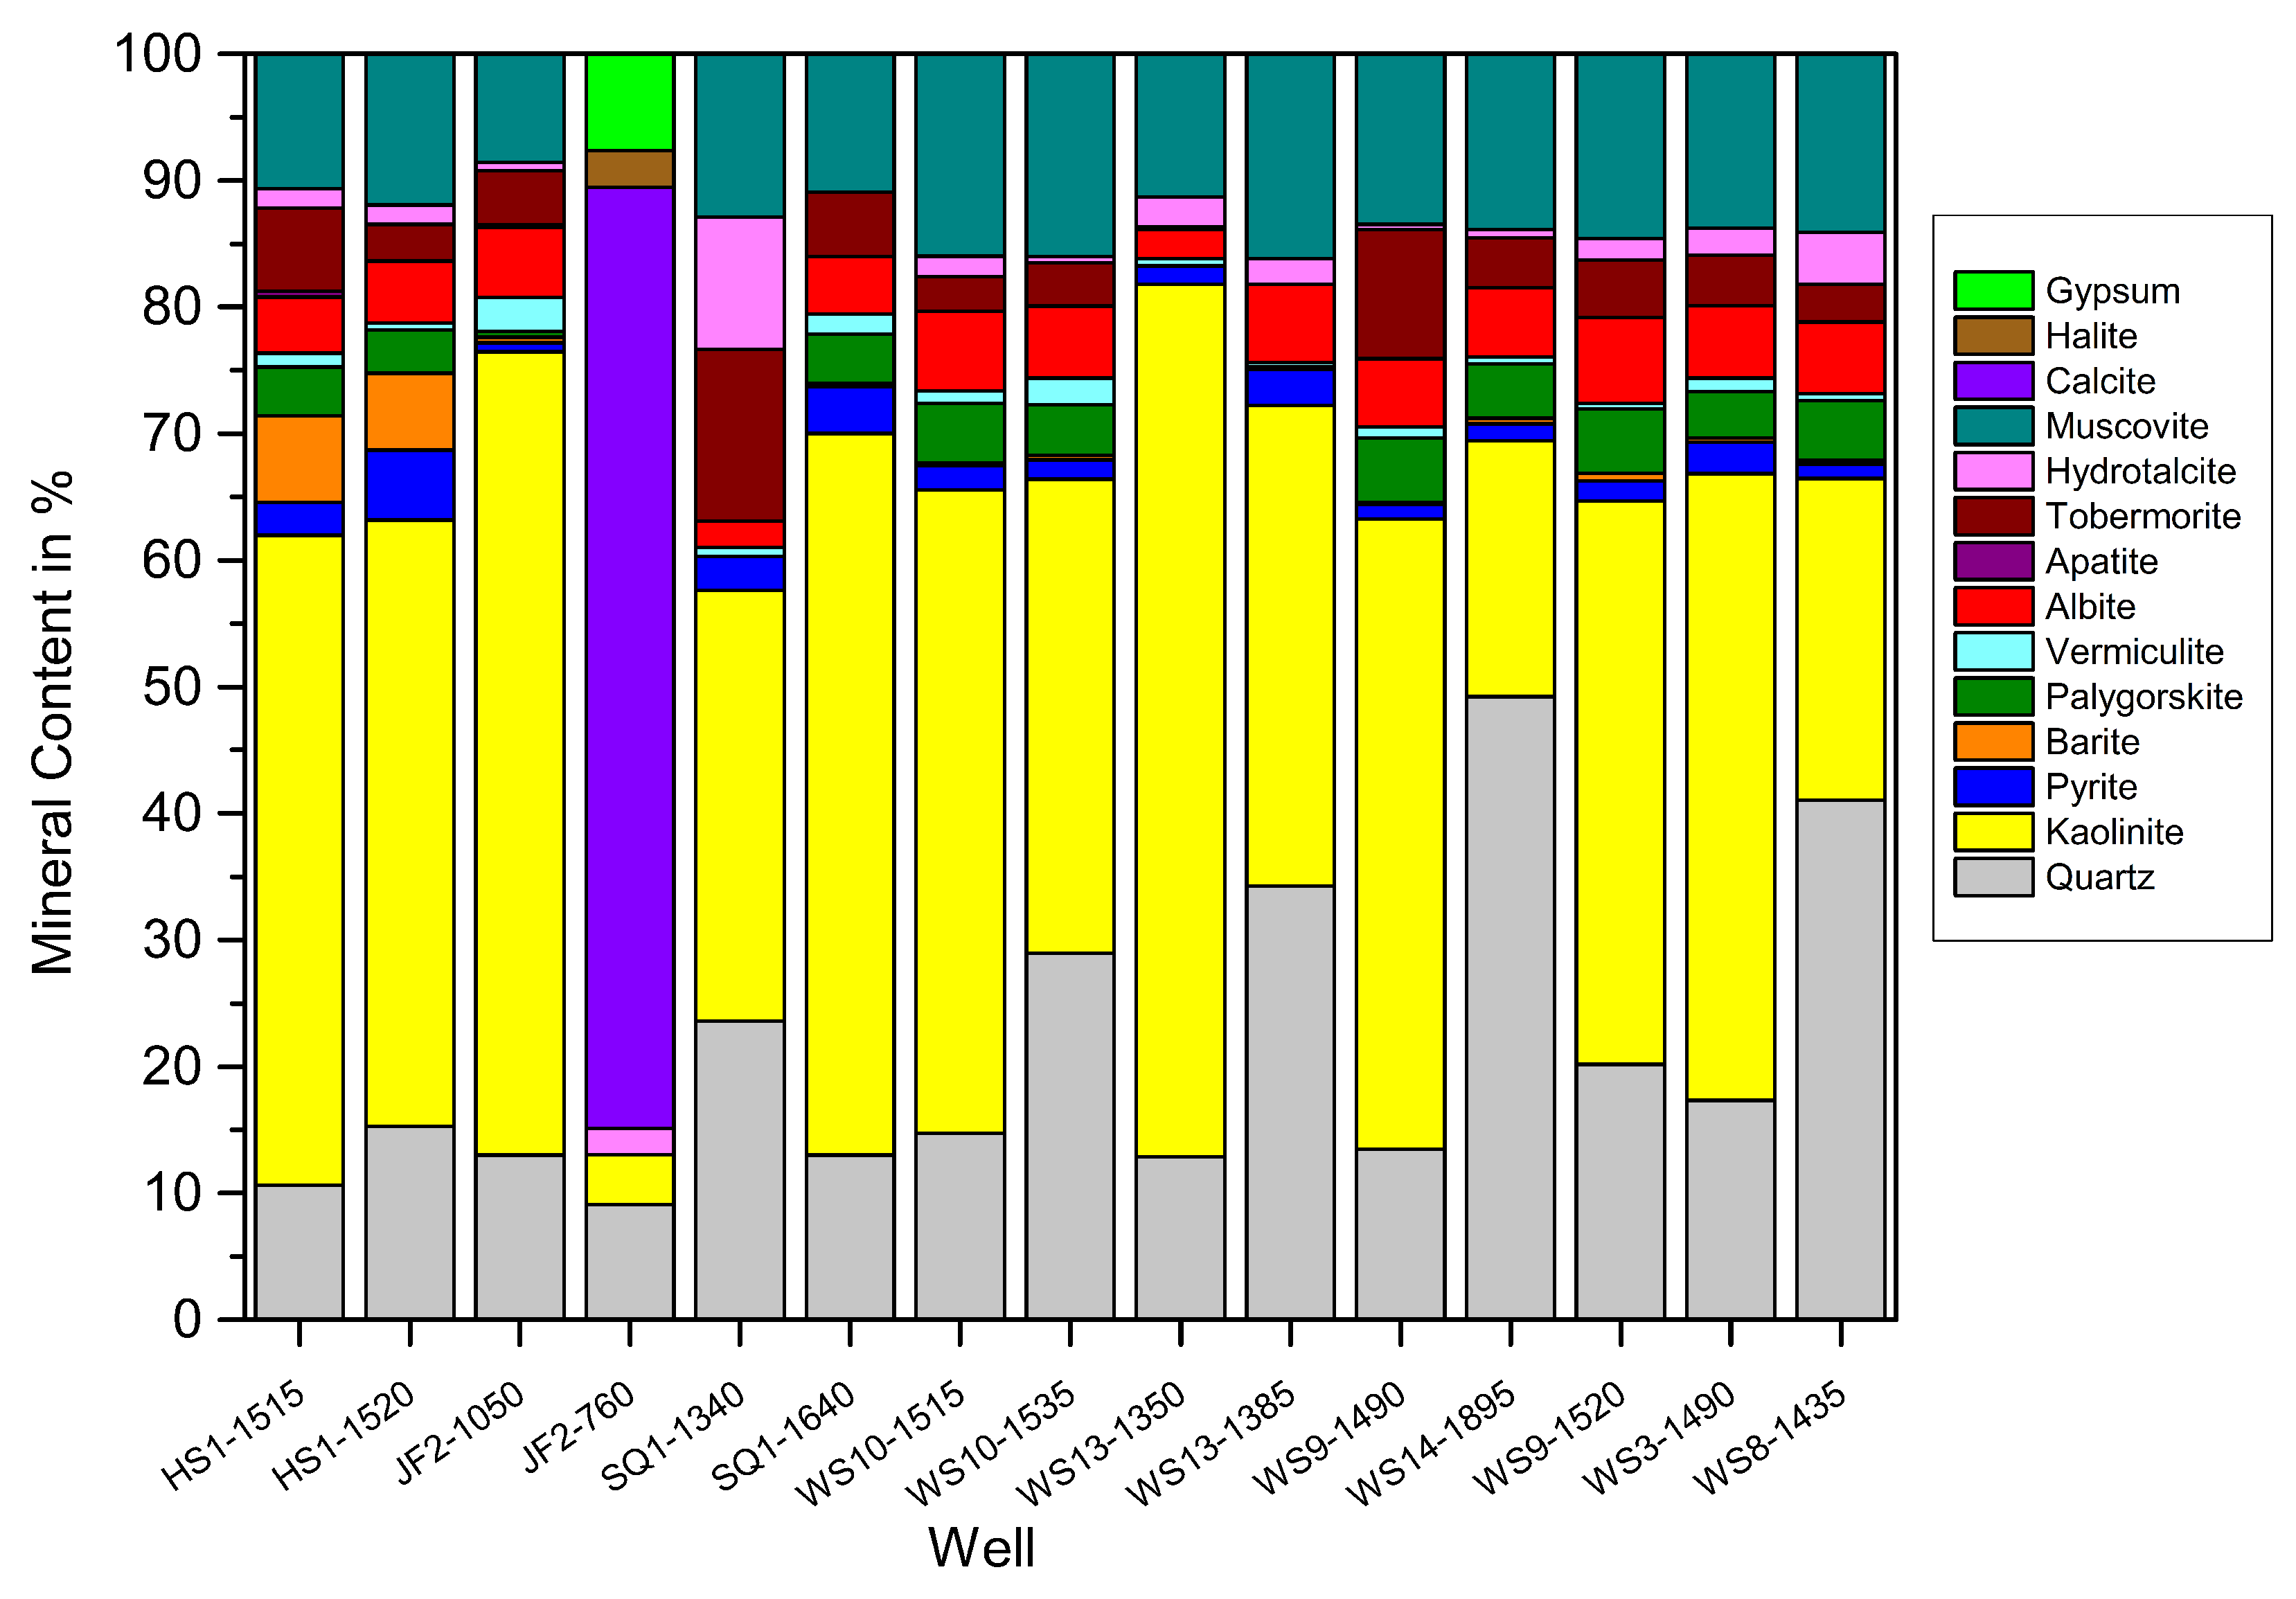
  • XRD results indicate that the shale samples are dominated by clay, primarily kaolinite and muscovite. Few samples have a higher proportion of quartz and calcite. However, considering the brittleness component of the shale, such a high amount of clay is not suitable for hydraulic fracture. Therefore, this Middle Eastern shale is not the best candidate for economic hydrocarbon production (in case hydrocarbon is present).
  • Rock–Eval analysis results indicate that almost all of the samples have very low hydrogen index (HI) and oxygen index (OI). Sample JF2-760 shows high HI and high S2. The HI and OI value suggests that the type III and type III /IV kerogen are most likely from terrestrial and varied settings’ origin. The Tmax and PI data indicate immature-to-early-mature source rock status and low conversion scenario.
The integrated result analysis of these data substantiates that the petroleum generation potential for these Middle Eastern shales is very poor. Although the HC generation potential is poor, this shale formation can be used for further purposes (e.g., carbon capture utilization and sequestration). We hope that these data will be useful for future consideration of the geological, petrophysical, and geochemical deposits in case of multi-purpose usage.
Additional research, as well as investment, would be needed for performing in-depth assessment in case of multi-purpose for future usage (e.g., storage). In the case of CO2 storage operation, the composition of existing organic matter (kerogen) will be relevant. Therefore, biomarker evaluation of thermal maturity and variation with temperature can be investigated for a better understanding of this Middle Eastern shale.

Author Contributions

Conceptualization, G.M. and M.A.; methodology, G.M. and M.A.; software, G.M. and C.F.; formal analysis, G.M., C.F. and K.A.; investigation, G.M., N.K. and C.F.; resources M.A.; writing—original draft preparation, G.M. and K.A.; writing—review and editing, G.M., M.A., C.F. and N.K.; visualization, G.M., N.K. and K.A.; supervision, M.A. and C.F.; project administration, M.A. All authors have read and agreed to the published version of the manuscript.

Funding

Open Access Funding by the Publication Fund of the TU Bergakademie Freiberg.

Institutional Review Board Statement

Not applicable.

Informed Consent Statement

Reprinted with permission from ref. [42]. Copyright 2005 Copyright Elsevier.

Data Availability Statement

The data presented in this study are available on request from the corresponding author. The data are not publicly available due to [confidentiality].

Acknowledgments

We acknowledge Robert Möckel and Edgar Schach for helping with the XRD measurement as well as the fruitful discussion. We would like to thank Susann Rabe and Christine Hecker from the institute of Electronic and Sensor material at the Technical University of Technology for helping with the specific surface area (BET) measurement.

Conflicts of Interest

The authors declare no conflict of interest.

Abbreviations

The following abbreviations are used in this manuscript:
TOCTotal Organic Content
XRDX-ray Diffraction
SSASpecific Surface Area
BETBrunaur-Emmett-Teller
EOMExtractable Organic Matter
FIDFlame Ionization Detector
IRInfrared
SCISpore Color Indices
TAIThermal Alteration Index

References

  1. Few, S.; Gambhir, A.; Napp, T.; Hawkes, A.; Mangeon, S.; Bernie, D.; Lowe, J. The impact of shale gas on the cost and feasibility of meeting climate targets—A global energy system model analysis and an exploration of uncertainties. Energies 2017, 10, 158. [Google Scholar] [CrossRef]
  2. Kaczmarczyk, W.; Słota-Valim, M. Multidisciplinary Characterization of Unconventional Reservoirs Based on Correlation of Well and Seismic Data. Energies 2020, 13, 4413. [Google Scholar] [CrossRef]
  3. Zheng, M.; Tang, H.; Li, H.; Zheng, J.; Jing, C. Geomechanical Analysis for Deep Shale Gas Exploration Wells in the NDNR Blocks, Sichuan Basin, Southwest China. Energies 2020, 13, 1117. [Google Scholar] [CrossRef] [Green Version]
  4. Jarvie, D.M. Factors affecting Rock–Eval derived kinetic parameters. Chem. Geol. 1991, 93, 79–99. [Google Scholar] [CrossRef]
  5. Jarvie, D.M. Shale resource systems for oil and gas: Part 1—Shale-gas resource systems. AAPG Memoir 2012, 97, 69–87. [Google Scholar]
  6. Sanei, H.; Goodarzi, F. Relationship between organic matter and mercury in recent lake sediment: The physical-geochemical aspects. Appl. Geochem. 2006, 21, 1900–1912. [Google Scholar] [CrossRef]
  7. Barberes, G.A.; Pena dos Reis, R.; Pimentel, N.L.; Spigolon, A.L.D.; Fonseca, P.E.; Karcz, P.; Azevedo, M.C.; Barata, M.T. Geochemical Considerations from the Carboniferous Unconventional Petroleum System of SW Iberia. Minerals 2021, 11, 811. [Google Scholar] [CrossRef]
  8. Turakhanov, A.; Tsyshkova, A.; Mukhina, E.; Popov, E.; Kalacheva, D.; Dvoretskaya, E.; Kasyanenko, A.; Prochukhan, K.; Cheremisin, A. Cyclic Subcritical Water Injection into Bazhenov Oil Shale: Geochemical and Petrophysical Properties Evolution Due to Hydrothermal Exposure. Energies 2021, 14, 4570. [Google Scholar] [CrossRef]
  9. Spasennykh, M.; Maglevannaia, P.; Kozlova, E.; Bulatov, T.; Leushina, E.; Morozov, N. Geochemical Trends Reflecting Hydrocarbon Generation, Migration and Accumulation in Unconventional Reservoirs Based on Pyrolysis Data (on the Example of the Bazhenov Formation. Geosciences 2021, 11, 307. [Google Scholar] [CrossRef]
  10. Bogdanovich, N.; Kozlova, E.; Karamov, T. Lithological and Geochemical Heterogeneity of the Organo-Mineral Matrix in Carbonate-Rich Shales. Geosciences 2021, 11, 295. [Google Scholar] [CrossRef]
  11. Zhang, Y.; Jiang, S.; He, Z.; Li, Y.; Xiao, D.; Chen, G.; Zhao, J. Coupling between Source Rock and Reservoir of Shale Gas in Wufeng-Longmaxi Formation in Sichuan Basin, South China. Energies 2021, 14, 2679. [Google Scholar] [CrossRef]
  12. Dembicki, H., Jr. Three common source rock evaluation errors made by geologists during prospect or play appraisals. AAPG Bull. 2009, 93, 341–356. [Google Scholar] [CrossRef]
  13. Hart, B.S.; Steen, A.S. Programmed pyrolysis (Rock–Eval) data and shale paleoenvironmental analyses: A review. Interpretation 2015, 3, SH41–SH58. [Google Scholar] [CrossRef]
  14. Katz, B.J. Limitations of “Rock–Eval” pyrolysis for typing organic matter. Org. Geochem. 1983, 4, 195–199. [Google Scholar] [CrossRef]
  15. Vandenbroucke, M. Kerogan: From types to models of chemical structure. Oil Gas Sci. Technol. 2003, 58, 243–269. [Google Scholar] [CrossRef] [Green Version]
  16. Khatibi, S.; Ostadhassan, M.; Tuschel, D.; Gentzis, T.; Carvajal-Ortiz, H. Evaluating molecular evolution of kerogen by raman spectroscopy: Correlation with optical microscopy and Rock–Eval pyrolysis. Energies 2018, 11, 1406. [Google Scholar] [CrossRef] [Green Version]
  17. Sondhi, N. Petrophysical Characterization of Eagle Ford Shale. Ph.D. Thesis, University of Oklahoma, Norman, OK, USA, 2011. [Google Scholar]
  18. Butt, A.S. Shale Characterization Using X-Ray Diffraction. Master’s Thesis, Dalhousie University, Halifax, NS, Canada, 2012. [Google Scholar]
  19. Ross, D.J.K.; Marc Bustin, R. The importance of shale composition and pore structure upon gas storage potential of shale gas reservoirs. Mar. Pet. Geol. 2009, 26, 916–927. [Google Scholar] [CrossRef]
  20. Herrmann, J.; Rybacki, E.; Sone, H.; Dresen, G. Deformation Experiments on Bowland and Posidonia Shale—Part I: Strength and Young’s Modulus at Ambient and In Situ pc–T Conditions. Rock Mech. Rock Eng. 2015, 51, 3645–3666. [Google Scholar] [CrossRef] [Green Version]
  21. Josh, M.; Esteban, L.; Delle Piane, C.; Sarout, J.; Dewhurst, D.N.; Clennell, M.B. Laboratory characterisation of shale properties. J. Pet. Sci. Eng. 2012, 88–89, 107–124. [Google Scholar] [CrossRef] [Green Version]
  22. Wang, Y.; Li, X.; Zhang, Y.X.; Wu, Y.S.; Zheng, B. Gas shale hydraulic fracturing: A numerical investigation of the fracturing network evolution in the Silurian Longmaxi formation in the southeast of Sichuan Basin, China, using a coupled FSD approach. Environ. Earth Sci. 2016, 75, 1–18. [Google Scholar] [CrossRef]
  23. He, J.; Deng, H.; Ma, R.; Wang, R.; Wang, Y.; Li, A. Reservoir characteristics of the Lower Jurassic lacustrine shale in the Eastern Sichuan Basin and its effect on gas properties: An integrated approach. Energies 2020, 13, 4495. [Google Scholar] [CrossRef]
  24. Gong, L.; Zhang, Y.; Li, N.; Gu, Z.-K.; Ding, B.; Zhu, C.-Y. Molecular Investigation on the Displacement Characteristics of CH4 by CO2, N2 and Their Mixture in a Composite Shale Model. Energies 2021, 14, 2. [Google Scholar] [CrossRef]
  25. Sondergeld, C.H.; Newsham, K.E.; Comisky, J.T.; Rice, M.C. Petrophysical Considerations in Evaluating and Producing Shale Gas Resources. In Proceedings of the SPE Unconventional Gas Conference, Pittsburgh, PA, USA, 23–25 February 2010. [Google Scholar]
  26. Ye, Y.; Tang, S.; Xi, Z. Brittleness evaluation in shale gas reservoirs and its influence on fracability. Energies 2021, 13, 388. [Google Scholar] [CrossRef] [Green Version]
  27. Hunt, J.M. Petroleum Geochemistry and Geology, 2nd ed.; W.H. Freeman & Company: New York, NY, USA, 1996. [Google Scholar]
  28. Rahmani, O.; Khoshnoodkia, M.; Kadkhodaie, A.; Beiranvand Pour, A.; Tsegab, H. Geochemical analysis for determining total organic carbon content based on delta LogR technique in the South Pars field. Minerals 2019, 9, 735. [Google Scholar] [CrossRef] [Green Version]
  29. Kern, M.; Möckel, R.; Krause, J.; Teichmann, J.; Gutzmer, J. Calculating the deportment of a fine-grained and compositionally complex Sn skarn with a modified approach for automated mineralogy. Miner. Eng. 2018, 116, 213–225. [Google Scholar] [CrossRef]
  30. Rahfeld, A.; Kleeberg, R.; Möckel, R.; Gutzmer, J. Quantitative mineralogical analysis of European Kupferschiefer ore. Miner. Eng. 2000, 115, 21–32. [Google Scholar] [CrossRef]
  31. Als-Nielsen, J.; McMorrow, D. Elements of Modern X-ray Physics, 2nd ed.; John Wiley & Sons: West Sussex, UK, 2011. [Google Scholar]
  32. Lafargue, E.; Marquis, F.; Pillot, D. Rock–Eval 6 applications in hydrocarbon exploration, production, and soil contamination studies. Revue de l’Institut Francais Du Petrole 1998, 53, 421–437. [Google Scholar] [CrossRef] [Green Version]
  33. McCarthy, K.; Rojas, K.; Niemann, M.; Palrnowski, D.; Peters, K.; Stankiewicz, A. Basic petroleum geochemistry for source rock evaluation. Oilfield Rev. 2011, 23, 32–43. [Google Scholar]
  34. Tissot, B.P.; Welte, B.H. Petroleum Formation and Occurence, 2nd ed.; Springer Science & Business Media: Berlin/Heidelberg, Germany, 1984. [Google Scholar]
  35. Hutton, A.; Bharati, S.; Robl, T. Chemical and Petrographic Classification of Kerogen/Macerals. Energy Fuels 1994, 8, 1478–1488. [Google Scholar] [CrossRef]
  36. Wei, J.; Wang, Y.; Wang, G.; Wei, Z.; He, W. Geochemistry and shale gas potential of the lower Permian marine-continental transitional shales in the Eastern Ordos Basin. Energy Explor. Exploit. 2021, 39, 738–760. [Google Scholar] [CrossRef]
  37. Zhao, B.; Li, R.; Qin, X.; Li, D.; Wu, X.; Khaled, A.; Zhou, W.; Zhao, D.; Liu, Q.; Zhang, Y. Biomarkers and Re–Os geochronology of solid bitumen in the Beiba Dome, northern Sichuan Basin, China: Implications for solid bitumen origin and petroleum system evolution. Mar. Pet. Geol. 2021, 126, 104916. [Google Scholar] [CrossRef]
  38. Hood, A.; Gutjahr, C.C.M.; Heacock, R.L. Organic metamorphism and the generation of petroleum. AAPG Bull. 1975, 59, 986–996. [Google Scholar]
  39. Magoon, L.B.; Dow, W.G. The Petroleum System—From Source to Trap; AAPG Bulletin; American Association of Petroleum Geologists (AAPG): Tulsa, OK, USA, 1991. [Google Scholar]
  40. Klemme, H.D.; Ulmishek, G.F. Effective petroleum source rocks of the world: Stratigraphic distribution and controlling depositional factors. Am. Assoc. Pet. Geol. Bull. 1991, 75, 1809–1851. [Google Scholar]
  41. Boyer, C.; Kieschnick, J.; Suarez-Rivera, R.; Lewis, R.E.; Waters, G. Producing gas from its source. Oilfield Rev. 2006, 10, 36–49. [Google Scholar]
  42. Cornford, C. Petroleum Geology: The petroleum system. In Encyclopedia of Geology; Selley, R.C., Cocks, L.R.M., Plimer, I.R., Eds.; Elsevier: Bideford, UK, 2005; pp. 268–294. [Google Scholar]
  43. O’Brien, N.R. Fabric of Kaolinite and Illite Floccules. Clays Clay Miner. 1971, 19, 353–359. [Google Scholar] [CrossRef]
  44. Slatt, R.M.; O’Brien, N.R. Pore types in the Barnett and Woodford gas shales: Contribution to understanding gas storage and migration pathways in fine-grained rocks. AAPG Bull. 2006, 95, 2017–2030. [Google Scholar] [CrossRef]
  45. Liu, W.; Liu, J.; Cai, M.; Luo, C.; Shi, X.; Zhang, J. Pore evolution characteristic of shale in the Longmaxi Formation, Sichuan Basin. Pet. Res. 2017, 2, 291–300. [Google Scholar] [CrossRef]
  46. Van Krevelen, D.W. Coal: Typology, Chemistry, Physics, Constitution; Elsevier Scientific Pub. Co.: Amsterdam, The Netherlands, 1961. [Google Scholar]
  47. Petersen, H.I.; Andsbjerg, J.; Bojesen-Koefoed, J.A.; Nytoft, H.P. Fabric of Coal-generated oil: Source rock evaluation and petroleum geochemistry of the Lulita oilfield, Danish North Sea. J. Pet. Geol. 2000, 23, 55–90. [Google Scholar] [CrossRef]
Figure 1. Grain size distribution for laboratory analysis.
Energies 14 06672 g001
Figure 2. The relationship between TOC and grain density (values from Table 4).
Energies 14 06672 g002
Figure 3. The relationship between TOC and SSA (values from Table 4).
Energies 14 06672 g003
Figure 4. The relationship between petrophysical properties vs. depth (values from Table 4).
Energies 14 06672 g004
Figure 5. Mineralogy distribution (XRD result).
Energies 14 06672 g005
Figure 6. Pseudo van Krevelen plot of hydrogen index versus oxygen index.
Energies 14 06672 g006
Figure 7. Total Organic Carbon (TOC)-S2 cross plot for characterizing source rock potential.
Energies 14 06672 g007
Figure 8. An alternating source quality interpretation Tmax-HI for characterizing kerogen type and maturity.
Energies 14 06672 g008
Table 1. A list of examined samples.
SampleDepth, mTOCGrain DensityXRDSSA[BET]Rock-Eval
JF2-760760
JF2-10501050
WS3-14901490
WS8-14351435
WS9-14901490
WS9-15201520
WS10-15151515
WS10-15351535
WS13-13501350
WS13-13851385
WS14-18951895
HS1-15151515
HS1-15201520
SQ1-13401340
SQ1-16401640
Table 2. Rock–Eval parameters and evaluation indices.
ParameterDefinitionUnitMeasurement ProcedureIndicator
TOCTotal organic carbon%Corg/Rock (wt%)Richness
S1Free bitumenmg/gHC/Rock (wt%)Oil and gas present
S2HC potenitalmg/gHC/Rock (wt%)Quality/Quantity
S3CO2 potentialmg/gCO2/Rock (wt%)Quality
TmaxTemp. of maximum
generation rate (i.e., S2)
°C Maturity
HIHydrogen indexmg/g TOC100 * S2/TOCKerogen Type
OIOxygen indexmg/g TOC100 * S3/TOCKerogen Type
PPPetroleum potentialmg/gS1 + S2HC potential
PIProduction index S1/(S1 + S2)Transformation ratio
Table 3. Equivalence maturity parameters with respect to oil and gas generation [42].
OilGasOilGasOilGasOilGas
Generation Stage% R %,Tmax, °CSCI (1–10)TAI (1–5)
Immature–Early mature0.51432455492.252.6
E. Mature–Mid Mature0.71.34424655>92.33.5
M. Mature–Late Mature12.2455525910+2.64
Post Mature1.3>3.00465>575>910+3.55
Table 4. TOC, grain density, and specific surface area of examined shale samples.
SampleDepth, mTOC, %Grain Density, g/ccSpecific Surface Area
[BET], m2/g
JF2-7607608.372.309.94
JF2-105010503.262.521.97
WS3-149014902.682.512.75
WS8-143514353.612.496.36
WS9-149014902.102.538.33
WS9-152015203.412.455.67
WS10-151515151.862.537.43
WS10-153515353.502.485.29
WS13-135013501.68n/a7.31
WS13-138513853.012.555.06
WS14-189518955.002.416.58
HS1-151515152.442.634.43
HS1-152015204.912.533.26
SQ1-134013401.642.60n/a
SQ1-164016402.662.586.37
Table 5. Rock–Eval pyrolysis results.
SampleTmaxS1,
(mg/g)
S2,
(mg/g)
S3,
(mg/g)
PI,
(wt ratio)
PP, mg/gHIOITOC, %
HS1-15154302.933.281.850.476.21134762.44
HS1-15204294.277.452.230.3611.72152454.91
JF2-7604152.4648.384.350.0550.84578528.37
JF2-10504200.393.901.890.094.29120583.26
SQ1-13404210.214.622.170.044.832821321.64
WS10-15154270.520.581.670.471.1031901.86
WS10-15354310.671.411.590.322.0840453.50
WS13-13504330.561.333.820.301.89792271.68
WS13-13854251.122.192.090.343.3173693.01
WS14-18954281.422.012.210.413.4340445.00
WS3-14904330.442.991.560.133.43112582.68
WS8-14354271.442.672.180.354.1174603.61
WS9-14904260.610.722.310.461.33341102.10
WS9-15204241.291.952.370.403.2457703.41
Publisher’s Note: MDPI stays neutral with regard to jurisdictional claims in published maps and institutional affiliations.

