Abstract
The impact of the use of cargo bicycles for delivery processes on the environment is undeniably positive: it leads to the reduction of pollutants, noise, and vibrations caused by traditional vehicles; decreases traffic jams; causes more effective use of public space; and others. But how should such an effect be measured? What tools should be used to justify the necessity for change to more sustainable means of transport? How can we improve the state of the environment considering the interests of logistics service providers? There is a large amount of scientific literature dedicated to this problem: by using different modeling approaches, authors attempt to address the issue of sustainable transport. This paper conducts a literature review in the field of green cargo deliveries, investigates the benefits and drawbacks of integrating cargo bikes in urban logistics schemes, and examines methodologies and techniques for evaluating the impact of using cargo bicycles on the environment. By providing an opportunity to get acquainted with the situation in the sphere of green deliveries, the authors aim to encourage a breakthrough in the field of sustainable transport that may be achieved by using cargo bikes in modern cities. We review the existing approaches and tools for modeling transport emissions and state the significant positive environmental consequences.
1. Introduction
The constant, alarming, worsening state of the environment is an issue of major concern to the European Union policy-making authorities for more than 50 years. The United Nations Framework Convention on Climate Change developed in 1992 is considered as the starting point of the international environmental-protection policymaking. This treaty was a base for the following and more famous Kyoto Protocol and the Paris Convention, which introduced the state parties’ regulations for limiting and reducing greenhouse gas (GHG) emissions. Furthermore, the EU continues providing air-quality politics and ratifies with its member states legislative acts (starting with the Council Directive 96/62/EC) that establish the mechanism for acquiring and controlling ambient air quality. As well, all the European Union member states (that adopt the directives) are obliged for its implementation to conduct annual reports on the state of the air. Such reports are collected and inspected by the European Environment Agency (EEA), the leading organization for managing the cooperation with the EU members states, which gathers, verifies, and presents the information on Europe’s environment.
While the polluting sectors (such as agriculture, industry, and others), which undergo the monitoring of EEA, show a steady downward trend in pollution emissions, the road transport segment indicates the growth of global emissions since 1990 [1]. Moreover, the EEA states that overall greenhouse gas emissions from transport reach up to a quarter of all GHG emissions in the EU. Road transport is denoted as the main producer of such emissions in 2018 (about 70%) [1]. Besides being responsible to a large extent for global warming, transport is accountable for significant social and environmental harm: it causes health issues, noise pollution, congestion, loss of public space, and negatively affects the overall livability of the city. On the other hand, transport plays the role of an engine in economic progress and recovery: it contributes to investment growth, brings employment, and widens markets. Therefore, the area of sustainable transportations is among the main targets of EU policymaking. Furthermore, a positive result could only be achieved through the collective interaction of global and local initiatives by mutual influence of bottom-up and top-down approaches [2].
Along with the rapid increase of digital technologies and demand for city logistics, the requirement for improvement of urban life quality also grows. As follows, the bottom-up approach is gaining momentum due to the growing awareness of the population about the threat of global warming and specifically about the impact of transport, one of the main contributors to climate change [3,4]. Whereas more citizens are concerned with the living condition of the neighborhood and appeal to city authorities for adequate reaction, the question of introducing the new, environmentally friendly business models and strategies arises. As a reaction to that prompt, many cities around the world introduced urban transport policies that aim to support the use of city space for pedestrians and non-motorized vehicles, limit speed, and restrict access of heavy diesel motor vehicles to the city centers (e.g., Cracow [5], Paris [6], London [7], Sao Paolo [8], Seoul [9], Rio de Janeiro [10], New York [11], Barcelona [12]). Moreover, officials in turn motivate residents to shift to more sustainable transport. For instance, purchasing of electric cars and cargo bicycles (CB) could be induced by funding and tax reduction; traveling by bicycles could be prompted by infrastructure improvement and encouragement through social initiatives; and use of public transport by increasing its efficiency and accessibility, and that is the representation of the top-down approach.
Consequently, there is increased attention for planning, adapting, and shifting to the new sustainable distribution solutions in the cities that could satisfy all parties interested in the delivery process. Not only does such a solution design eliminate negative environmental and social impacts from road transport on city inhabitants, but it also minimizes losses in efficiency and costs for urban logistic operators (ex. operating and investment costs). Inevitably, cycle logistics is gaining more attention in recent EU research and development projects, such as CityChangerCargoBike [13], Handshake [14], Park4SUMP [15], GreenCharge [16], etc.
Currently, the main concept for estimation of transport impact is to determine the level of pollution using the various transport emission models, which receive as an input the parameters’ set of characteristics achieved from the traffic situation. Sometimes, such characteristics are oversimplified; in other cases, they are obtained from models of a transportation system (infrastructure of the study region, vehicle fleet characteristics). Furthermore, atmospheric dispersion models are applied for the evaluation of the behavior of pollutants in the atmosphere.
The great amount of scientific literature that analyzes alternative/ sustainable distribution scenarios for the last- (or first-) mile deliveries explores CB (and its variations) as an environmentally friendly means of transport and the main substitute for traditional vans (in last-mile deliveries). Primarily, the directions of such studies, which are the subject of interest of this article, could be outlined as:
- (1)
- Analysis of business strategies. Commonly, in such an approach, the potential and the challenges of using CB as a green transport mode are investigated in the context of the development of strategies for logistics service providers (LSP) [12,17,18,19]. While developing the strategies, the economic impact area for CB use is assessed, its cost-effectiveness is evaluated, and the competitiveness of LSP is estimated.
- (2)
- Transportation system modeling (TSM) is used to optimize the transport system parameters. For this approach, the routing models are usually implemented that integrate less-polluting vehicles (such as electric vehicles, CB, etc.) into a delivery system. These models could be used as a strategic and decision-making tool by city planners and authorities [20,21,22,23,24,25]. Additionally, the operations impact area and the location of transshipment points are defined by the means of TSM [26,27,28]. Another promising direction of using TSM is the justification of the multimodal schemes with the incorporation of consolidation centers (for loading and unloading operations) on the edge of the city center with transshipment to the small, nonmotorized delivery vehicles, possibly CB [8,29,30].
- (3)
- Estimation of transport impact. Transport emission and dispersion models are developed to evaluate amounts of different types of pollutants (CO2, PM, SO2, NOx, VOC, and CO) and their distribution in the atmosphere as well as to estimate the noise level [7,8,31,32].
- (4)
- Combination and mixture of the approaches listed above [11,33,34,35].
Despite the great interest in the last years for the topic of ecological modes of transport, there is a lack of research with a special focus on the environmental impact of non-motorized solutions for goods’ deliveries [6,36]. The authors of the paper [37] underline that the perspective in the exploration of new techniques and recommendations about using cargo bikes is vast.
This paper aims to identify the set of basic requirements that should be addressed by the contemporary methodology for evaluating the environmental impact of cargo bicycles. For these purposes, we explore the state of art in a topic of sustainable freight deliveries when CB are used as a mean of transport.
The paper is organized as follows: the next section is dedicated to the exploration of pluses and minuses of CB as a means of transport; the third part presents the review of existing studies on delivery schemes used by logistics service providers in real-world solutions; the fourth section contains a short analysis of the literature on using the transport systems modeling approach; methods for evaluation of transport impact on the environment are presented in the fifth section; and the last part provides conclusions and plans for the future research.
2. Cargo Bike as a Means of Transport: Advantages and Disadvantages
CB is a bicycle that serves for transportation of various freights (goods, passengers, etc.) and was specifically invented for such purposes nearly a century ago [2,38]. Depending on the design, the number of wheels, or their purpose, CBs are called freight, transport or box bikes, carrier cycles, tricycles (CT) and quadricycles, cycle-trucks, long-john, and others. Modern CBs are usually electrically assisted, and their models vastly vary from simple two-wheelers bikes equipped with boxes on the front or back wheel to more progressive longtails and long johns that can carry weights around 50–100 kg. The most advanced multi-wheelers or light electric vehicles (LEV) can transport cargo up to 500–700 kg [2,17,39,40]. The term “cycle logistics” commonly refers to any type of pedal bicycle [41].
Recent studies confirm the enormous potential of cargo cycles to serve as sustainable substitution of traditional delivery vehicles. At the same time, the readiness to transition to more ecological means of transport (powered by electricity) was detected in slightly more than 60% of studies dedicated to last-mile problems, whereas nearly 50% of scientific sources advocate for freight bicycle adoption [42]. Such great possibility of CB to replace conventional vans is conditioned, to a large extent, by the small or the medium size and light weight of the most cargoes and relatively short delivery distances in central areas of the cities. According to results of the CycleLogistics project, nearly half of all urban goods transportation in the EU could be carried by CB; furthermore, the average trip distances in the city centers do not exceed 7 km [43]. A similar figure was obtained by the authors of the paper [44]: they observed that the distance of most commercial delivery routes is less than 10 km. TNT-FEDEX data that was used in the research [8] show such average freight parameters, volume, and weight: 0.025 m3 and 20 kg (maximum 30 kg), and those are medium packages of electronics and textiles. Moreover, the authors of the study [20] noted that 80% of all parcel flow are cargoes weighing less than 6 kg.
The following types of freights can be distinguished as the most frequently transported by CBs:
- small packages and boxes [17,45]:
- ○
- food [6,7,11,17,39,40,46],
- ○
- correspondences, documents [6,17,37],
- ○
- pharmaceuticals [6];
- medium size: mail, retail [46], and
- service trips [39,46], home deliveries [37].
Especially, advantages of CB could be observed in the narrow streets of historical city centers, with one-way traffic management and a large number of pedestrian areas [12,27,41,45,47] (see Table 1). Such districts frequently have spatial and timing restrictions on cars entering and are highly congested due to the population density and high demand for goods delivery [17,48]. Moreover, most authors emphasize the effectiveness and suitability of CB for the last- (or first-) mile urban distribution [6,8,10,11,12,19,21,22,23,25,36,40,41,47,48,49,50].

Table 1.
Advantages and disadvantages of using bikes for cargo deliveries.
Beneficial results of using CBs were indicated in:
- cost savings [6,8,17,20,21,36,48,50];
- decreasing congestions, CO2 emissions, and local pollutants [6,8,9,11,19,23,27,51,52];
- improving safety on roads due to reduction of car-related accidents [6,38];
- presentation of attractive (green) image of a company amongst its customers [17,20,48]; and
- improving livability of the city [8].
Economic effectiveness could be achieved due to low charging, purchase, and maintenance costs, which are notably less than for traditional vans [50]. Furthermore, the increase in performance could be attained due to the reliability of CB and their agility in urban centers (possibility to ride on one-way streets, park on the sideways, etc.) [6]. By occupying less than 35% of the space that takes up the van, CBs contribute to eliminating the congestion delays [11]. The collaborative scheme of supplies, which includes CT and mobile depots (MD), indicates a significant reduction in GHG emissions [10]. The availability of ready-to-use bicycles and equipped transshipment hubs can ensure the elimination of delays in deliveries [53].
Nonetheless, along with the huge advantages of CB, their drawbacks and limitations must be considered. The most common disadvantages could be found in Table 1. As for ECB also, potential issues could arise in the areas of battery and engine malfunctions and, accordingly, the lowering of travel range and time. Additionally, researchers indicate the lack of regulations (e.g., parking policies) and cycling infrastructure (charging stations and transshipment points) [17,47,52].
Special attention should be paid to the parameters, features of CB, and general recommendations when choosing an alternative vehicle. Table 1 summarizes the advantages and disadvantages of cycle logistics and provides a short description. Some disadvantages can be identified through a comparison of CB with conventional delivery vehicles.
In the literature on cycle logistics, much attention is paid to the problem of the implementation, concept testing, and determining the location of the urban consolidation centers (UCC), which are also called micro, mobile, delivery, transshipment center, or loading hubs, terminals and points, satellites, micro depots, micro-distribution platforms, and others. Usually, such centers are used for managing freight flows and represent temporal or permanent storage facilities to which cargo is delivered by one means of transport (conventional vans) and then is transported to the client by other means (cargo bikes) [5]. Authors of the paper [19] characterize a mobile depot as a trailer that is connected to a loading dock and serves as an office and a warehouse. The main consequence of the introduction of the UCC is the lowering of transport emissions due to the introduction of the more sustainable scheme of transport, where the route from the UCC to a customer was performed by CT [8]. In the presented study, the transshipment center (TC), besides just storing the freights, also serves as a garage for bikes. To use UCC in the form of containers and truck-trailers was offered as an option in one study [27]; the proposed solution led to a notable decrease in travel distances and annual emissions of local CO2. Additionally, the authors of the manuscript [30] underlined the considerable role of UCC in pollution reduction; however, they pointed out that the large cost is the biggest obstacle for implementing such centers.
Besides focusing only on UCC, some studies are devoted to an exploration of the cycling infrastructure. For instance, a field experiment that was carried out using two CB was a subject of the research [40]. The authors observed bike deliveries performed on the pre-planned routes with aim of examining of quality and affordability of the bike lanes, road traffic threats, etc. As a result, attention was drawn to the poor bicycle infrastructure, the necessity of the thorough choice of the fleet, and the huge role of the policymakers in the sustainable shift. Similarly, by exploring a free CB-sharing system, the authors of the research [2] highlight the importance of extensive cycle infrastructure for the wider adoption of CBs. Likewise, the focus on bicycle paths as a basic need for the green mode shift was highlighted in the paper [37]. As a result of the literature review and surveys with representatives of the logistics industry, attention was drawn to the key role of interest groups and private businesses as well as the influence of municipalities on the sustainable development of the cities.
There are not many ways researchers can obtain data for the studies in the transportation area. The most common method is to conduct interviews and surveys; another more difficult procedure is gaining information from transport organizations (oftentimes, such data is protected by the confidentiality agreement and cannot be openly displayed). Furthermore, some perform field tests or observations or use GPS tracking data; others use knowledge from the literature or previously developed projects. The pie chart in Figure 1 shows the proportion of the data sources that have been used in the scientific papers cited in this article.
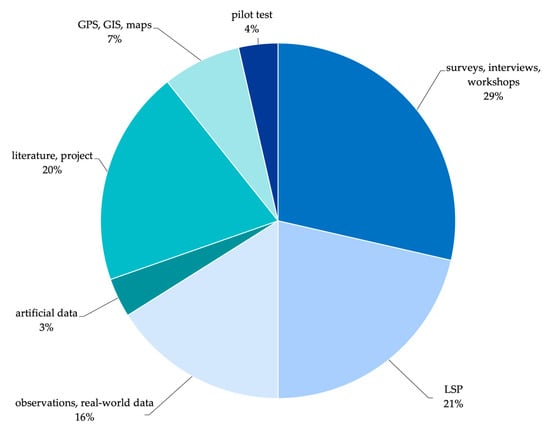
Figure 1.
Rating of the most frequently used data sources.
The data represented on the graph illustrates that most researchers collect information from surveys, interviews, and workshops (nearly 30%). The second most popular position is shared by parcel delivery companies and scientific literature and projects (each of these sections gained approximately 20%). Slightly fewer papers refer to such sources as observations (a little more than 15%). However, GPS, GIS, and maps were used only by a small percentage of authors (about 7%), and the smallest segment is represented by studies for the implementation of which data from pilot projects were used (3.6%).
The described results demonstrate that data are mostly collected through questionnaires and surveys; thus, such information is often biased. Moreover, there is clearly a lack of works based on practical experiments and cooperation between the private sector and scientific institutions. On the other hand, we can observe the wide engagement of research and development projects that aim the popularization and expansion of sustainable mobility solutions in the urban areas.
Such projects demonstrate the potential, possibilities, and prospects of environmentally friendly transport to be adapted and implemented by the private sector, researched by scientists, and promoted among the public. Among recently implemented or started projects, the following ones should be listed:
- Ich ersetze ein Auto (I’m replacing a car) [55],
- SMILE [12],
- STRAIGHTSOL [12,19],
- Pro-E-bike [17],
- CycleLogistics [42],
- Ich entlaste Städte (Taking the load off cities) [44],
- Freie Lastenräder [2],
- LCL (Low carbon logistics) [40], and
- LEVV-LOGIC [39].
For the last years, the market of cycle logistics has grown rapidly. Large logistics companies adopt sustainable business models, take part in various pilot projects to test possibilities of green means of transport, cooperate with municipal authorities and non-governmental organizations, and provide data for the research. Some of these operators are TNT [8,17], EBC, GKC [17], DHL [17,50,51], GLS [17], UPS [18,50], FedEx [50], Hermes, Gnewt Cargo [41], CEP [8], and PonyZero [23].
Deliveries of freights by bicycles are performed in many urban areas around the world, although a study of the scientific literature of recent years has shown that most research on CB activities was conducted in the USA in such cities as Seattle, Austin, New York, Portland, and others. Germany comes second with six heavily researched cities. Slightly fewer articles were detected in Poland. The further ranking is shown in Figure 2.
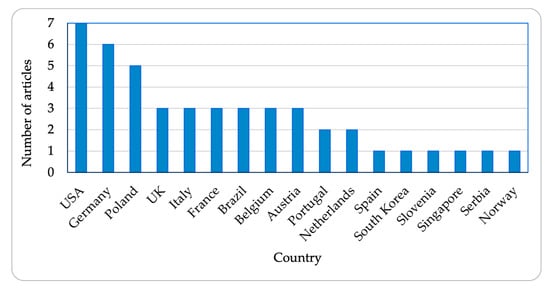
Figure 2.
Geographical distribution of studies dedicated to CB issues.
In summary, most scientific papers attribute such main advantages of cargo bicycles as their environmental friendliness, compactness, accessibility, safety, and efficiency in urban conditions. However, it is necessary to pay attention to such features as their limited size, capacity, and speed, and, most importantly, to the working conditions and associated risks for the person operating such a vehicle.
3. Approaches to the Improvement of Business Strategies of Logistics Service Providers
Despite the obvious benefits of using zero-emission alternatives in city logistics, regardless of the eventual readiness of local authorities to put into action sustainable solutions, the decision-making process largely remains to the transportation service providers and their customers. Moreover, in many cases, such organizations show hesitance and a negative attitude to the introduction of green innovations [41,46,56]. Whereas the implementation of new strategies entails additional costs for the private sector, it is essential to consider such indicators as investment, operating costs, and other costs incurred by the company, although some researchers indicate such investment as beneficial, with return for the business [49]. However, authors of publications [6,7,17,37,41,57] emphasize the crucial role of the city authorities in influencing the implementation of effective green schemes. Such influence could be realized through policies, regulations (e.g., limitations of delivery hours, initiation of pedestrian zones, increase of penalties, etc.), and long-term planning. Additionally, the significance of pilot projects in the encouragement of the modal shift to environmentally friendly transport was pointed out in works [17,37].
For instance, city municipalities, transport operators, and eco-logistic and car-parking companies became the participants in the pilot project, which was examined by the authors of the work [12]. In the presented study, two electrically assisted tricycles along with transshipment points were used in two cities for performing parcel transportations for last-mile deliveries. Authors evaluate criteria concerning various spheres: economic, transport operations and energy, environmental, and social area. The outcome underlines the importance of contemplating the parameters of the study region and the crucial role of the cooperation between all the stakeholders of the transport system. Another pilot test was the subject of the study [17]. Through extensive research on big companies’ (participants of the pilot project) operational practices, the major misconceptions about CB efficiency, load capacity, and reliability were identified. In addition, the environmental and economic effects of using CB were introduced through the evaluated savings of CO2 emissions and energy costs.
Even though most research results indicate a significant positive economic, environmental, and social consequence from the implementation of cycle logistics, the authors of the paper [18] did not achieve any noteworthy outcome in reducing costs and emissions. The presented work describes the analyzes of the pilot test, in which one of the delivery variants included ECT. However, the general authors’ remarks regarding the use of alternatives were positive.
Another research that was based on a cargo cycle trial project presents a model that could be practically used by decision makers [44]. The purpose of the experiment was a comparison of the travel times between vans and CB that perform distribution of goods in a public space in a mixed-fleet scheme. The estimated results for the option with substitution of 50% of traditional vehicles by bikes pointed out that expected delays in deliveries by CB would not exceed 10 min. Moreover, the replacement of 90% of motor vehicles would not result in delays of more than 20 min. Such promising outcomes could contribute to companies’ decision to move to sustainable transport.
One more work, which was based on a real-life project, provides information on the competitiveness of clean transport mode in urban logistics [55]. A thorough socio-demographic overview was carried out on one of the main representatives of the decision-making group, individual messengers. The research provides a glimpse on indicators that could prompt the adoption of new technologies, such as the raise of awareness through arranging advertisement campaigns, field tests, and other forms of social informing.
Searching for an effective solution, numerous studies analyze the benefits and implications of different cooperation strategies that could be adopted for sustainable urban transportations, such as the estimation of a green delivery concept of using MD in combination with ET [19]. The authors applied the methodology multi-actor multi-criteria analysis (MAMCA) for the decision-making evaluation of six scenarios. Besides, the environmental, social, transport, and economic impacts were examined. As a result, the most significant effect was obtained in decreasing of emission level. However, the delivery time slightly dropped, and operational costs turned out to be twice higher than during the traditional transportation process. However, the confirmation of the greater cost-effectiveness of EACB over trucks was achieved in the cost-function comparison model for four transportation scenarios, developed by the authors [50]. Beneficial results showed the scenario in which the deliveries were performed by electrically assisted CB (ECB) over short distances from the distribution center. The research on the integration of green solutions into the traditional transportation business model is presented in [20]. Authors indicate the lack of studies dedicated to the adaption of zero-emission schemes by the main participants of the delivery system, international courier delivery service providers. The GUEST (Go, Uniform, Evaluate, Solve, Test) business methodology was used for the analysis of the supply system from the business and operational angles. Further, the decision-support system (DSS) was developed for the evaluation of different supply scenarios. As a result, savings in CO2 emissions were achieved in the green operational scheme. However, the loss of efficiency by traditional service providers emphasizes the need for a holistic approach while implementing sustainable concepts.
In addition, the effectiveness of transportations is largely influenced by the productivity of selected means of transport. For instance, to choose the most suitable electric bike on the market, the authors applied the multi-criteria decision-making model COMET [58]. Evaluating such criteria as battery and engine parameters, speed, driving range, gear characteristics, price, etc., the comparison of ten EB models was conducted considering the condition of incomplete knowledge. The proposed model could be freely used in practice. Furthermore, the efficiency of cycle deliveries varies seasonally. The dependency of the CB productivity on the cold season was analyzed by [29]. Results indicate a decrease in the bike’s average speed by approximately 30%. Additionally, the authors highlight that overall effectiveness could be increased by the improvement of working conditions of bicyclists and winter-specific bicycle maintenance. No less important is the arrangement of the consolidation centers, which could provide the opportunity to warm up and get technical support.
The extensive research through the interviews and consultations with the business owners was conducted by the authors of the paper [46] for defining the most influential conditions for the suitability of LEV for innovative urban logistics. Among other things, the necessity of using transshipment points as well as thorough planning of a mixed delivery fleet was strongly emphasized in that study. Similar research on the ability of CT to compete with diesel vans was presented in the paper [47]. The results of the evaluation of logistics and cost minimization models clearly indicate the effectiveness and suitability and applicability of CB services in the sustainable goods movement.
4. Transport System Modelling Approach
Using TSM as the first phase of the analysis of transport impact on the environment is a common practice. In such an approach, at first, the transportation network is inspected: the characteristics of the research area are explored (infrastructure, terrain properties); fleet composition, traffic volume, and speed are examined. Afterward, the output parameters from the TSM can be used as input parameters for the transport emission modeling.
In many cases, advanced TSM use subsystems that describe the rational behavior of the transport system entities. Such subsystems are often based on the Vehicle Routing Problem (VRP) algorithms. For instance, in the paper [21], the Two-Echelon Capacitated Electric Vehicle Routing Problem with Time Windows and Partial Recharging (2E-EVRPTW-PR) was proposed for the last-mile logistics for exploring the possibilities of clean transport modes (ECB and e-vans). The authors emphasize the effectiveness of such a two-echelon scheme, where ECBs perform the deliveries inside the restricted city area after the cargos were delivered to the micro depot by the e-vans. Similarly, obtaining synchronization between CB and traditional vans with a transshipment point near the city center in the two-echelon supply scheme was a purpose of the research [22]. Through the analysis of different delivery scenarios, the authors presented the algorithm, based on the GRASP metaheuristics (Greedy Randomized Adaptive Search Procedure), which aims to assist in a decision-making process while determining the most optimal solution for the distribution process. Another decision-supporting system that combines the business management tool Odoo with the route optimization technique and that is based on the Vehicle Routing Problem with Time Window (VRPTW) was introduced in the study [23]. Analysis of the collaboration of zero-emission vehicles transporting cargo less than 5 kg with conventional means of transport shows reduction of CO2 emissions up to 14 tons per year. The system that assists food deliveries by CB was designed by the authors of the research [24] for connecting producers, distributors, consumers, and carriers. As the result, the beneficial results of delegating fresh food transportations in urban zones to the CB with IoT were noted.
Determining the optimal composition of the transport fleet by analyzing various alternatives of distribution schemes is exactly the problem that could be resolved using simulation modeling. Thus, authors of the study [52] pursue the exploration of different delivery scenarios that include small-sized electric vehicles (SEV) that replace vans in varying proportions. The simulation procedure was implemented in the AIMSUNG program. The optimal attainable rate that leads to costs, energy, and emission savings would be the 10% scenario, due to which it is possible to achieve a 3.6% reduction of CO2. However, the positive effects of using SEV are shaded by the unwanted private sector risks and additional costs. Another simulation system for comparison of two operational schemes (where deliveries are performed only by trucks or by CB with mobile hubs) is presented in the paper [59]. Considering the varying characteristics of demand, the evaluation of some key transport efficiency indicators was performed. As the outcome of the CB delivery variant, the notable reduction (by nearly 150 deliveries per km2) in vehicle distances and times traveled was achieved.
Different route and supply characteristics were examined in the research [50] to ascertain the conditions for the most efficient performance of CB compared to conventional trucks. The scheme, located near where the UCC clients were served by ECB, turned out to be more cost-effective than the one with deliveries by trucks. Likewise, the supplies by the ECB over short distances (about 2 km) were evaluated by the authors of the study [36]. The calculation of the optimal number of emission-free vehicles, which could substitute traditional vans in the city districts without reducing the efficiency of the initial system, was conducted using the micro-simulation software AIMSUN and the fuel consumption Well-to-Wheel approach. The results reveal that replacing 10% of vans brings beneficial results for all the stakeholders of the innovative distribution solution.
The research [9] suggests the model for reduction of GHG emissions along with operational costs by combining delivery trucks with zero-emission vehicles, ECB. Applying Heterogeneous Fleet Vehicle Routing Problem (HFVRP) in conjunction with the Tier-1 method for emission evaluation, the authors seek to achieve the optimal proportion between bikes and trucks in the mixed delivery system. The obtained most favorable fleet scheme with 29 trucks and 9 ECB showed the costs lowering by nearly 14% and carbon emissions by 10% compared with the scheme with a fleet of only trucks.
Integrating CB into urban operational scenarios was the objective of the study [45]. A developed GIS-based simulation tool aims to support the planning process while de-signing alternative distribution patterns that include CB and TP. In addition to the route-simulation feature, implemented with help of AnyLogic software and Capacitated Vehicle Routing Problem with Multiple Depots (MDCVRP), the presented system has functionality for calculating the economic and environmental impact of the examined network. Similarly, the research on different variants of delivery scenarios using the simulation approach presents the evaluation of operational and external costs of different distribution concepts [56]. The outcome shows that a scheme that includes 10 to 25% of self-pickups plus CB deliveries (performed from DP) is beneficial and can notably reduce external costs of LSP (nearly by 30%).
Almost no modern, efficient urban logistics solution can function without UCC. Such concept of providing facilities close to the core of the city is especially useful in case of using small or light modes of transport for last-mile distribution. Therefore, to incorporate consolidation centers into the operational scheme, the whole set of methods must be implemented, such as localization and capacity planning, synchronization, scheduling, and others. Thus, the authors of the publications [5,26] used the computer simulation approach for determining the location of loading hubs near the city area with traffic restrictions. The proposed freight delivery model, which is based on the simple Facility Location Problem (FLP), was implemented in Python programming language, and considers the stochasticity of the demand for transport services. Likewise, the authors of the paper [28] were engaged with the problem of establishing positions for micro depots and developed DSS aiming to study different transportation scenarios to reduce total operating costs as well as negative impact on the environment. The question of optimization of the delivery schemes in a city center by effectively situating parcel depots and route planning was examined in the paper [27]. As the main instrument for the implementation of Pickup and Delivery Problem with Time Windows (PDPTW) and location-allocation tasks, the ArcGIS software was chosen.
The problem of minimization of overall transporting costs while considering the stochasticity of the process was a goal of the work [54]. The authors explored a 2-Echelon Vehicle Routing Problem (2EVRP) with synchronization, where deliveries on the first echelon were performed by vans, and the CB (as a second echelon vehicle) served customers starting from the depot points. Moreover, an interesting concept of transshipment points was proposed: using satellites for synchronization between vans and bikes for loading and unloading operations.
The transport network mathematical model that considers the stochasticity of the demand for transport services was suggested by the research [25]. The open-source library for performing simulations of the delivery system is designed with help of the Python programming language and could be used for analysis and optimization of alternative distribution variants and particularly for implementing CB delivery scenarios. A closely related problem of modeling a new delivery scheme that integrates CB with micro depots (MD) into an urban transport network was presented by the work [51]. The simulation of two supply variants (by traditional vehicles and by CB) was performed in the open-source framework MATSim. Results indicate the significant reduction in total transport costs as well as emissions due to the use of CB.
The complex problem was examined by the authors of the paper [30]: first, they search for the UCC localization, and further, the optimal routes and fleet composition are determined with help of the Multi Depot Vehicle Routing Problem with Heterogeneous Fleet (MDHFVRP) and Genetic Algorithm (GA). The research proposes using a UCC sharing system for minimizing operating costs and achieving a positive environmental impact through the adaptation of sustainable vehicles, CB, and electric vans.
Exploring a case study in which postal delivery vehicles were substituted by CB, authors attempt to determine the economic effect of such modal shift [48]. Analyzing three different areas of the city and several variants of zero-emission vehicles and considering consolidation centers, the model of transport network was implemented using a Capacitated Vehicle Routing Problem with Time Window (CVRPTW) and simulation programs MATSim and jsprit. The proposed model points up the competitiveness of cargo cycles in terms of cost-saving perspective for the LSP and could be used as a city planning tool.
Table 2 highlights algorithms and software that are often used for modeling delivery systems with CB as a means of transport.
Table 2.
Approaches to modeling systems of delivery by means of CB.
The wide range of tools and software presented in Table 2 is evidence of the big number of problems to be solved when optimizing the delivery systems that use CB as a means of transport. On the other hand, here appear the key questions that should be answered to choose the proper model for estimations of CB impact:
- Which optimization problems should be solved while simulating the process of delivering goods by bikes so that the behavior of a transport operator would be adequately considered in the simulation model?
- How much would the consideration of the transport operator’s behavior in the model affect the results of estimations of the CB impact on the environment?
The answers to the listed questions should be obtained at the stage of developing the structure of a simulation model to be used for assessing the impact of CB.
5. Methods for Evaluation of Sustainable Transport Impact on the Environment
The analysis of the scientific literature clearly indicates the lack of studies on the environmental impact of sustainable delivery systems. There are, however, many works that implement various transport emission or dispersion models for evaluation of pollution caused by activities of traditional means of transport [33,35,60,61]. Thereafter, by modeling alternative scenarios and comparing the results, the question of how different transportation concepts would affect the environment could be answered [8,11].
Another equally important indicator of sustainable city development that is affected by transport is noise. Road-traffic noise models aim for the evaluation, management, prediction, and, eventually, the reduction of the sound power and involve such parameters as area information and traffic characteristics (acceleration, speed, and volume). Among the different approaches to noise modeling can be found the regression analyzes [32] and such noise emission models as FHWA, NMPB, ASJ-RNT, Imagine [62], and others.
Vehicle-related pollutants are divided depending on their source: exhaust emissions are produced and discharged by the internal combustion engine and fuel evaporation, and non-exhaust emissions are related to vehicle clutch and breaks, tire, and road wear abrasion. The composition of the exhaust emissions mainly includes carbon dioxide (CO2) and monoxide (CO), nitrogen oxides (NOx, NO, NO2), volatile organic compounds (VOC), particulate matter (PM), nitrous oxide (N2O), ammonia (NH3), persistent organic pollutants (POP), and metals. Non-exhaust emissions mostly consist of PM.
Moreover, another pollutant associated with vehicles is mineral dust, which spreads from the roads and streets surfaces by traffic or wind. Mineral dust, which consists mainly of silica (SiO2) and corundum (Al2O3), sucked in with the intake air by the motorized vehicle engine, causes accelerated wear of engine parts. However, the engine could be protected by using high-efficient air filters [63,64] that contain elements made of pleated filter material (cellulose, cellulose with polyester, or with a nanofiber layer). Such filters are characterized by high filtration efficiency, which is over 99.5% [65,66].
The evaluation of the road transport impact on the environment can be performed using many different tools and approaches. Transport emission models vastly vary from the most popular in the EU countries, COPERT methodology, applied for composing of yearly emission inventories, to EMISENS, IVE, MOVES, HBEFA, VERSIT+, PHEM, MOBILE, and others. Such models allow estimation of the level of discharged emissions near the source. Instead, transport and dispersion models (T&D), also called air quality or atmospheric dispersion models, determine the spread of pollutants in the atmosphere and their concentrations at different locations. For the most part, these models are based on Lagrangian, Eulerian, or Gaussian plum models, such as OSPM, SCIPUFF, CALINE, STREET 5, FLEXPART, EPISODE, and others. The extensive literature review on a sequential usage of models for determining the air and water pollution caused by road transport can be found in the publication [67].
The main concept for estimation of transport emission is the multiplication of emission factors with respective activity data for different types of vehicles. Emission factors are laboratory-obtained measurements (via comprehensive vehicle tests) that depend on the driving behavior (acceleration, speeding, and braking), vehicle categories, Euro class, road, and traffic characteristics. In some cases, the approximate approach for the evaluation of CO2 levels could be applied [27]. According to such a method (passed by U.S. Environmental Protection Agency), a liter of burned diesel fuel is equal to 2.66 kg of CO2.
Emission models differ depending on the input parameters:
- vehicle fuel consumption,
- traffic volume [34] and composition [61],
- meteorological data [34],
- vehicle driving characteristics (speed, acceleration) [35],
- fleet composition (types of vehicles: size, fuel, evaporation, and exhaust control systems) [35],
- infrastructure (road map, speed limits) [61], and
- emission factors [61].
The spread of pollution in the atmosphere is mostly affected by the intensity of the source and meteorological conditions, such as wind strength, temperature, and humidity.
Data for dispersion modelling may contain:
- source parameters [33,61],
- composition of transport network [33],
- terrain characteristics [33], and
- meteorological conditions [33,61].
There is the recent tendency to develop fully integrated models by joining TSM for simulating vehicle activities with EM or T&D for determining or predicting the environmental effect caused by traffic [34,35,67].
For instance, the integrated simulation model that combines mesoscopic TSM, created with the use of FlexSim software and the regression model for evaluation of NO2 concentration was proposed by the authors of research [34]. Such a system predicts the amount of pollution in the atmosphere depending on seasonality and the fleet composition. This approach could be used for the examination of different sustainable traffic variants to improve the ecological condition of the city district. Another integrated traffic-emission computation system was presented in the research [35]. After connecting TSM, implemented in Paramix system, with relational MS Access database, authors then added the emission calculation module based on the IVE model. The presented approach was further tested and is recommended for the estimation of traffic-related pollution. Furthermore, the combination of several methodologies, such as road transport emission EMISENS and evaluation of pollutants dispersion, has been proposed in the paper [61]. Assessing different pollution-reduction scenarios for black carbon (BC) and NOx, the researchers indicate that eliminating 10% of the biggest emitters will lead to a significant reduction of the pollutants (nearly 35% of NOx and 16% of BC daily). The analyses of the impact of different compositions of the conventional transport fleet on the pollution dispersion in the atmosphere by combining several models were carried out by the researchers in [33]. Microscopic TSM, developed in the MAINSIM program, enables to determine the level of emitted by traffic emissions due to its built-in module. Further, a gas-dispersion module was implemented using the SCIPUFF model. The combination of both modules was performed using the CyberGIS framework. Authors present how to analyze and make predictions on the atmospheric pollution behavior depending on the traffic and meteorologic factors.
Investigation of the possibility of changing the transport system and the following possible environmental consequences is of interest to many authors. For example, the comparison of several operational scenarios to determine the difference in the resulting level of pollution was performed in the work [68]. The variant with transportation by ECT showed five times fewer emissions of CO2 compared to the option with diesel vans.
The suggestion to reduce the movement of heavy and light foods vehicles through the adoption of new delivery strategies that implement UCC outside the city together with the substitution of main emitters with electric vehicles is presented in the research [31]. The transport network model for the study was developed in AIMSUN microsimulation software and further transport emissions were evaluated. The quantification results point to the main pollutants, heavy vans, responsible for 13.8% CO2, 43.7% of NOx, and 9.2% of PM from the total amount of emissions. For the study [7], the delivery data of a large platform provider were used to determine operational characteristics and amount of GHG emissions from on-demand deliveries performed by car, moped, and bike. Such an approach could be taken into consideration for comparison of different fleet compositions and justification for the introduction of clean modes of transport into the meal-delivery industry. The substitution of conventional vans by the ECT was examined by the authors of the paper [8] using real-world data. Results indicate the crucial savings in CO2e: more than 95% and nearly a third in operating costs savings, which confirms the competitiveness of clean freight-distribution strategies. Research [11] evaluates traffic parameters and their environmental impact for the comparative analysis of different good movement modes: CB and motor vehicles. Using ArcGIS and Visual Basic, the traffic performance characteristics were calculated. Furthermore, the GHG and vehicle emissions evaluation was implemented with help of the MOVES model. Consequently, the high competitiveness of CB in transporting light freights over short distances was denoted by the outcome.
Instead of focusing only on determining the levels of CO2 emitted by transport, the authors of the manuscript [60] emphasized the necessity of evaluating the concentrations of local pollutants (CO, NO2, hydrocarbons, and PM). Using the approach that is based on the Gaussian plum model and the data achieved from the radar detectors, researchers determined amounts of NOx and CO distributed near the road segment. The highest level of pollutants was observed at a distance of 20 m from the road.
The methodologies for determining the level of noise caused by transport have a similar approach: they mainly depend on studied area characteristics as well on traffic data. The significant impact on a noise level has the congestion, vehicle acceleration, average speed over time, and the number of stopped vehicles [62]. Besides standard input parameters (traffic speed, volume, and width of the road surface), authors of the research [69] included honking into their noise model, which was based on the graph-theoretic approach. The study [32] focuses on the prediction of the noise level in the city area: using the regression modeling technique, the authors analyzed the influence of such urban parameters as street geometry and location and traffic characteristics on the noise level.
Table 3 summarizes the approaches to the estimation of the sustainable transport impact used by the authors of recently published papers.
Table 3.
Approaches to the estimation of the environmental impact of transport and corresponding tools.
As can be noted from the descriptions in Table 3, to estimate the emissions reduction as an effect of using CB, the commonly applied are combinations of different tools. That is explained by the lack of conventions on what to measure and how to estimate the results. The ambiguity of measures of the sustainable transport impact may be also observed in Table 4, which summarizes the results of the studies dedicated to the estimation of road transport’s negative influence.
Table 4.
Parameters achieved by estimation of the various delivery concepts aiming the reduction of the environmental and operational impact.
For various technological solutions listed in Table 4, the results are measured in terms of costs and emission savings. However, the lack of uniformity in the type of used indicators makes the comparison of achieved results practically impossible. As the indicator for costs reductions, operational costs are the most frequently used parameter; however, energy costs, external costs, or delivery costs are used by researchers. This ambiguity also refers to the emission savings indicator: although the carbon dioxide equivalent is the standard parameter to estimate the reduction of emissions, other indicators are also used additionally to characterize the impact.
6. Conclusions
Cargo bikes are an environmentally friendly means of transport. However, their use in commercial delivery schemes, besides obvious advantages, has some restrictions related to relatively small capacity and low delivery speed. The conducted literature review shows that the most preferable use of CB is last-mile deliveries in the cities, especially in districts with traffic restrictions and a high density of the population.
Logistics service providers extensively use CB in real-world solutions. However, the implementation of this technology needs complex actions of the authorities; besides, they are often initiated by active citizens and non-governmental organizations. To implement the delivery scheme that uses CB, the methodology for transportation planning should be chosen and the appropriate zero-emission fleet should be selected, but also the effect of these changes should be substantiated in terms of operational costs (from the point of view of LSP) and emissions reduction (for city authorities and residents).
To estimate the effect of using CB for last-mile deliveries, simulations of the transportation process are usually performed. The completed review of algorithms and software used for the optimization and simulations of cargo deliveries by bikes shows that there is a variety of tools available that allow solving the specific problem (routing, optimizing hub location, scheduling, etc.). However, there is no dedicated instrument that estimates the resulting technological parameters of the process of goods deliveries by CB (e.g., the covered distance and operation time). Such a tool would be indispensable for transport planners and city authorities when substantiating the emissions reduction due to the use of CB and assessing the corresponding operational costs.
Existing approaches to the evaluation of transport impact on the environment allow assessing in detail numerous indicators. A tool that is dedicated to the assessment of emissions reduction for technological schemes with CB as a means of transport must provide the possibility to check the results for CB comparing to other alternative servicing technologies. For these, the aggregated indicator (e.g., CO2e) reflecting the environmental impact of transport should be used to avoid ambiguous conclusions.
The above-mentioned features (i.e., the consideration of interests of all parties, the assessments made based on the set of technological indicators, and the use of the aggregated emissions indicator) should be addressed by the contemporary methodology for evaluating the environmental impact of cargo bicycles.
As the direction of future research, the development of the simulation model for the substantiation of positive environmental effects of CB must be mentioned. We plan to test this model within the CityChangerCargoBike project while estimating the impact of the CB use in the districts with restricted traffic of cities that are the project partners—Krakow (Poland), San Sebastian and Vitoria-Gasteiz (Spain), Lisboa (Portugal), and Dubrovnik (Croatia).
Author Contributions
Conceptualization, H.V., A.S. and S.R.; methodology, H.V., A.S. and S.R.; investigation, H.V.; writing—original draft preparation, H.V.; writing—review and editing, A.S. and S.R.; visualization, H.V.; supervision, A.S. and S.R. All authors have read and agreed to the published version of the manuscript.
Funding
The research was carried out as part of the project “ROAD TO EXCELLENCE—a comprehensive university support programme,” implemented under the Operational Programme Knowledge Education Development 2014–2020, co-financed by the European Social Fund; agreement no. POWR.03.05.00-00-Z214/18.
Institutional Review Board Statement
Not applicable.
Informed Consent Statement
Not applicable.
Data Availability Statements
Not applicable.
Conflicts of Interest
The authors declare no conflict of interest.
References
- Annual European Union Greenhouse Gas Inventory 1990–2018 and Inventory Report 2020; European Environment Agency (EEA): Copenhagen, Denmark, 2020; Available online: https://www.eea.europa.eu//publications/european-union-greenhouse-gas-inventory-2020 (accessed on 30 August 2021).
- Becker, S.; Rudolf, C. Exploring the potential of free cargo-bike-sharing for sustainable mobility. GAIA—Ecol. Perspect. Sci. Soc. 2018, 27, 156–164. [Google Scholar] [CrossRef]
- The First and Last Mile—The Key to Sustainable Urban Transport; Transport and Environment Report 2019; European Environment Agency (EEA): Copenhagen, Denmark, 2020; Available online: https://www.eea.europa.eu/publications/the-first-and-last-mile (accessed on 30 August 2021). [CrossRef]
- Wang, S.; Ge, M. Everything You Need to Know about the Fastest-Growing Source of Global Emissions: Transport. World Resources Institute. Available online: https://www.wri.org/insights/everything-you-need-know-about-fastest-growing-source-global-emissions-transport (accessed on 30 August 2021).
- Naumov, V.; Starczewski, J. Choosing the localisation of loading points for the cargo bicycles system in the Krakow Old Town. Lect. Notes Netw. Syst. 2019, 68, 353–362. [Google Scholar] [CrossRef]
- Koning, M.; Conway, A. The good impacts of biking for goods: Lessons from Paris city. Case Stud. Transp. Policy 2016, 4, 4, 259–268. [Google Scholar] [CrossRef]
- Allen, J.; Piecyk, M.; Cherrett, T.; Juhari, M.N.; McLeod, F.; Piotrowska, M.; Bates, O.; Bektas, T.; Cheliotis, K.; Friday, A.; et al. Understanding the transport and CO2 impacts of on-demand meal deliveries: A London case study. Cities 2021, 108, 102973. [Google Scholar] [CrossRef]
- Ormond Junior, P.A.; Telhada, J.; Paulo, A. Evaluating the economic and environmental impact of the urban goods distribution by cargo cycles—A case study in São Paulo City. In Proceedings of the 2018 Conference: World Conference on Transport Research—WCTR 2019, Mumbai, India, 26–31 May 2019. [Google Scholar]
- Lee, K.; Chae, J.; Kim, J. A courier service with electric bicycles in an urban area: The case in Seoul. Sustainability 2019, 11, 1255. [Google Scholar] [CrossRef]
- Marujo, L.G.; Goes, G.V.; D’Agosto, M.A.; Ferreira, A.F.; Winkenbach, M.; Bandeira, R.A.M. Assessing the sustainability of mobile depots: The case of urban freight distribution in Rio de Janeiro. Transp. Res. Part D Transp. Environ. 2018, 62, 256–267. [Google Scholar] [CrossRef]
- Conway, A.; Cheng, J.; Kamga, C.; Wan, D. Cargo cycles for local delivery in New York City: Performance and impacts. Res. Transp. Bus. Manag. 2017, 24, 90–100. [Google Scholar] [CrossRef]
- Navarro, C.; Roca-Riu, M.; Furió, S.; Estrada, M. Designing new models for energy efficiency in urban freight transport for smart cities and its application to the Spanish case. Transp. Res. Procedia 2016, 12, 314–324. [Google Scholar] [CrossRef]
- CityChangerCargoBike. Available online: http://www.cyclelogistics.eu (accessed on 29 August 2021).
- Handshake. Available online: https://handshakecycling.eu (accessed on 30 August 2021).
- Park4SUMP. Available online: https://park4sump.eu (accessed on 30 August 2021).
- GreenCharge. Available online: https://www.greencharge2020.eu (accessed on 30 August 2021).
- Nocerino, R.; Colorni, A.; Lia, F.; Luè, A. E-bikes and e-scooters for smart logistics: Environmental and economic sustainability in pro e-bike Italian pilots. Transp. Res. Procedia 2016, 14, 2362–2371. [Google Scholar] [CrossRef]
- Athanassopoulos, T.; Dobers, K.; Clausen, U. Reducing the environmental impact of urban parcel distribution. Lect. Notes Logist. 2016, 12, 159–181. [Google Scholar] [CrossRef]
- Verlinde, S.; Macharis, C.; Milan, L.; Kin, B. Does a mobile depot make urban deliveries faster, more sustainable and more economically viable? Results of a pilot test in Brussels. Transp. Res. Procedia 2014, 4, 361–373. [Google Scholar] [CrossRef]
- Perboli, G.; Rosano, M. Parcel delivery in urban areas: Opportunities and threats for the mix of traditional and green business models. Transp. Res. Part C Emerg. Technol. 2019, 99, 19–36. [Google Scholar] [CrossRef]
- Caggiani, L.; Colovic, A.; Prencipe, L.P.; Ottomanelli, M. A green logistics solution for last-mile deliveries considering e-vans and e-cargo bikes. Transp. Res. Procedia 2021, 52, 75–82. [Google Scholar] [CrossRef]
- Anderluh, A.; Hemmelmayr, V.C.; Nolz, P.C. Synchronizing vans and cargo bikes in a city distribution network. Cent. Eur. J. Oper. Res. 2017, 25, 345–376. [Google Scholar] [CrossRef]
- Perboli, G.; Rosano, M. A Decision support system for optimizing the last mile by mixing traditional and green logistics. Lect. Notes Bus. Inf. Process. 2018, 262, 28–46. [Google Scholar] [CrossRef]
- Tegeltija, S.; Ostojić, G.; Stankovski, S.; Kukolj, D.; Tejić, B. Food delivery using cargo-bikes with IoT. Lect. Notes Multidiscip. Ind. Eng. 2020, 483–491. [Google Scholar] [CrossRef]
- Naumov, V.; Starczewski, J. Approach to simulations of goods deliveries with the use of cargo bicycles. AIP Conf. Proc. 2019, 2078, 020070. [Google Scholar] [CrossRef]
- Naumov, V. Substantiation of loading hub location for electric cargo bikes servicing city areas with restricted traffic. Energies 2021, 14, 839. [Google Scholar] [CrossRef]
- Niels, T.; Hof, M.T.; Bogenberger, K. Design and operation of an urban electric courier cargo bike system. In Proceedings of the 21st International Conference on Intelligent Transportation Systems (ITSC), Maui, HI, USA, 4–7 November 2018; pp. 2531–2537. [Google Scholar] [CrossRef]
- Leyerer, M.; Sonneberg, M.O.; Heumann, M.; Breitner, M.H. Decision support for sustainable and resilience-oriented urban parcel delivery. EURO J. Decis. Process. 2019, 7, 267–300. [Google Scholar] [CrossRef]
- Dybdalen, Å.; Ryeng, E.O. Understanding how to ensure efficient operation of cargo bikes on winter roads. Res. Transp. Bus. Manag. 2021, 100652. [Google Scholar] [CrossRef]
- Simoni, M.D.; Bujanovic, P.; Boyles, S.D.; Kutanoglu, E. Urban consolidation solutions for parcel delivery considering location, fleet and route choice. Case Stud. Transp. Policy 2018, 6, 112–124. [Google Scholar] [CrossRef]
- Aditjandra, P.T.; Galatioto, F.; Bell, M.C.; Zunder, T.H. Evaluating the impacts of urban freight traffic: Application of micro-simulation at a large establishment. Eur. J. Transp. Infrastruct. Res. 2016, 16. [Google Scholar] [CrossRef]
- Rey Gozalo, G.; Suárez, E.; Montenegro, A.L.; Arenas, J.P.; Barrigón Morillas, J.M.; Montes González, D. Noise estimation using road and urban features. Sustainability 2020, 12, 9217. [Google Scholar] [CrossRef]
- Cervone, G.; Dallmeyer, J.; Lattner, A.D.; Franzese, P.; Waters, N. Coupling traffic and gas dispersion simulation for atmospheric pollution estimation. GeoJ. Libr. 2019, 118, 13–31. [Google Scholar] [CrossRef]
- Mihăiţă, A.S.; Ortiz, M.B.; Camargo, M.; Cai, C. Predicting air quality by integrating a mesoscopic traffic simulation model and simplified air pollutant estimation models. Int. J. Intell. Transp. Syst. Res. 2019, 17, 125–141. [Google Scholar] [CrossRef]
- Wei, Y.; Yu Ying, X.; Lifeng, H.; Wei, G.; Jianhua, W.; Cao, J. Vehicle emission computation through microscopic traffic simulation calibrated using genetic algorithm. J. Artif. Intell. Soft Comput. Res. 2019, 9, 1, 67–80. [Google Scholar] [CrossRef]
- Melo, S.; Baptista, P. Evaluating the impacts of using cargo cycles on urban logistics: Integrating traffic, environmental and operational boundaries. Eur. Transp. Res. Rev. 2017, 9, 30. [Google Scholar] [CrossRef]
- Rudolph, C.; Gruber, J. Cargo cycles in commercial transport: Potentials, constraints, and recommendations. Res. Transp. Bus. Manag. 2017, 24, 26–36. [Google Scholar] [CrossRef]
- Riggs, W. Cargo bikes as a growth area for bicycle vs. auto trips: Exploring the potential for mode substitution behavior. Transp. Res. Part F Traffic Psychol. Behav. 2016, 43, 48–55. [Google Scholar] [CrossRef]
- Balm, S.; Amstel, W.P.; Moolenburgh, E.; Anand, N. The potential of light electric vehicles for specific freight flows: Insights from The Netherlands. In Proceedings of the International City Logistics Conference, Phuket Island, Thailand, 14–16 June 2017; p. 10. [Google Scholar] [CrossRef]
- Nürnberg, M. Analysis of using cargo bikes in urban logistics on the example of Stargard. Transp. Res. Procedia 2019, 39, 360–369. [Google Scholar] [CrossRef]
- Schliwa, G.; Armitage, R.; Aziz, S.; Evans, J.; Rhoades, J. Sustainable city logistics—Making cargo cycles viable for urban freight transport. Res. Transp. Bus. Manag. 2015, 15, 50–57. [Google Scholar] [CrossRef]
- Oliveira, C.M.; Mello Bandeira, R.A.; Vasconcelos Goes, G.; Schmitz Gonçalves, D.N.; D’Agosto, M.D.A. Sustainable vehicles-based alternatives in last mile distribution of urban freight transport: A systematic literature review. Sustainability 2017, 9, 1324. [Google Scholar] [CrossRef]
- Wrighton, S.; Reiter, K. CycleLogistics—Moving Europe Forward! Transp. Res. Procedia 2016, 12, 950–958. [Google Scholar] [CrossRef]
- Gruber, J.; Narayanan, S. Travel time differences between cargo cycles and cars in commercial transport operations. Transp. Res. Rec. 2019, 2673, 623–637. [Google Scholar] [CrossRef]
- Hofmann, W.; Assmann, T.; Neghabadi, P.D.; Cung, V.D.; Tolujevs, J. A Simulation tool to assess the integration of cargo bikes into an urban distribution system. In Proceedings of the 5th International Workshop on Simulation for Energy, Sustainable Development & Environment (SESDE 2017), Barcelona, Spain, 2017; hal-01875988. Available online: https://hal.archives-ouvertes.fr/hal-01875988/document (accessed on 18 September 2021).
- Moolenburgh, E.A.; van Duin, J.H.R.; Balm, S.; van Altenburg, M.; Ploos van Amstel, W. Logistics concepts for light electric freight vehicles: A multiple case study from the Netherlands. Transp. Res. Procedia 2020, 46, 301–308. [Google Scholar] [CrossRef]
- Tipagornwong, C.; Figliozzi, M. Analysis of competitiveness of freight tricycle delivery services in urban areas. Transp. Res. Rec. 2014, 2410, 76–84. [Google Scholar] [CrossRef]
- Choubassi, C.; Seedah, D.P.K.; Jiang, N.; Walton, C.M. Economic analysis of cargo cycles for urban mail delivery. Transp. Res. Rec. 2016, 2547, 102–110. [Google Scholar] [CrossRef]
- Oliveira, C.; Nascimento, L.; Belcavello Rigatto, I.; Oliveira, L.K. Characterization and analysis of the economic viability of cycle logistics transport in Brazil. Transp. Res. Procedia 2020, 46, 189–196. [Google Scholar] [CrossRef]
- Sheth, M.; Butrina, P.; Goodchild, A.; McCormack, E. Measuring delivery route cost trade-offs between electric-assist cargo bicycles and delivery trucks in dense urban areas. Eur. Transp. Res. Rev. 2019, 11, 11. [Google Scholar] [CrossRef]
- Zhang, L.; Matteis, T.; Thaller, C.; Liedtke, G. Simulation-based assessment of cargo bicycle and pick-up point in urban parcel delivery. Procedia Comput. Sci. 2018, 130, 18–25. [Google Scholar] [CrossRef]
- Melo, S.; Baptista, P.; Costa, Á. Comparing the Use of Small Sized Electric Vehicles with Diesel Vans on City Logistics. Procedia-Soc. Behav. Sci. 2014, 111, 1265–1274. [Google Scholar] [CrossRef]
- Fikar, C.; Hirsch, P.; Gronalt, M. A decision support system to investigate dynamic last-mile distribution facilitating cargo-bikes. Int. J. Logist. Res. Appl. 2018, 21, 300–317. [Google Scholar] [CrossRef]
- Anderluh, A.; Larsen, R.; Hemmelmayr, V.C.; Nolz, P.C. Impact of travel time uncertainties on the solution cost of a two-echelon vehicle routing problem with synchronization. Flex. Serv. Manuf. J. 2020, 32, 806–828. [Google Scholar] [CrossRef]
- Gruber, J.; Kihm, A. Reject or embrace? Messengers and electric cargo bikes. Transp. Res. Procedia 2016, 12, 900–910. [Google Scholar] [CrossRef]
- Arnold, F.; Cardenas, I.; Sörensen, K.; Dewulf, W. Simulation of B2C e-commerce distribution in Antwerp using cargo bikes and delivery points. Eur. Transp. Res. Rev. 2018, 10, 2. [Google Scholar] [CrossRef]
- Buldeo Rai, H.; Verlinde, S.; Macharis, C. City logistics in an omnichannel environment. The case of Brussels. Case Stud. Transp. Policy 2019, 7, 310–317. [Google Scholar] [CrossRef]
- Sałabun, W.; Palczewski, K.; Watróbski, J. Multicriteria approach to sustainable transport evaluation under incomplete knowledge: Electric bikes case study. Sustainability 2019, 11, 3314. [Google Scholar] [CrossRef]
- Chiara, G.D.; Alho, A.R.; Cheng, C.; Ben-Akiva, M.; Cheah, L. Exploring benefits of cargo-cycles versus trucks for urban parcel delivery under different demand scenarios. Transp. Res. Rec. 2020, 2674, 553–562. [Google Scholar] [CrossRef]
- Kijewska, K.; Konicki, W.; Iwan, S. Freight Transport Pollution Propagation at Urban Areas Based on Szczecin Example. Transp. Res. Procedia 2016, 14, 1543–1552. [Google Scholar] [CrossRef][Green Version]
- Ježek, I.; Blond, N.; Skupinski, G.; Močnik, G. The traffic emission-dispersion model for a Central-European city agrees with measured black carbon apportioned to traffic. Atmos. Environ. 2018, 184, 177–190. [Google Scholar] [CrossRef]
- Can, A.; Aumond, P. Estimation of road traffic noise emissions: The influence of speed and acceleration. Transp. Res. Part D Transp. Environ. 2018, 58, 155–171. [Google Scholar] [CrossRef]
- Dziubak, T.; Bąkała, L. Computational and Experimental Analysis of Axial Flow Cyclone Used for Intake Air Filtration in Internal Combustion Engines. Energies 2021, 14, 2285. [Google Scholar] [CrossRef]
- Tian, X.; Ou, Q.; Liu, J.; Liang, Y.; Pui, D.Y.H. Particle Loading Characteristics of a Two-Stage Filtration System. Sep. Purif. Technol. 2019, 215, 351–359. [Google Scholar] [CrossRef]
- Dziubak, T.; Dziubak, S.D. Experimental Study of Filtration Materials Used in the Car Air Intake. Materials 2020, 13, 3498. [Google Scholar] [CrossRef] [PubMed]
- Liu, B.; Zhang, S.; Wang, X.; Yu, J.; Ding, B. Efficient and reusable polyamide-56 nanofiber/nets membrane with bimodal structures for air filtration. J. Colloid Interface Sci. 2015, 457, 203–211. [Google Scholar] [CrossRef] [PubMed]
- Shorshani, M.F.; André, M.; Bonhomme, C.; Seigneur, C. Modelling chain for the effect of road traffic on air and water quality: Techniques, current status and future prospects. Environ. Model. Softw. 2015, 64, 102–123. [Google Scholar] [CrossRef]
- Saenz, J.; Figliozzi, M.; Faulin, J. Assessment of the carbon footprint reductions of tricycle logistics services. Transp. Res. Rec. 2016, 2570, 48–56. [Google Scholar] [CrossRef]
- Gilani, T.A.; Mir, M.S. Modelling road traffic noise under heterogeneous traffic conditions using the graph-theoretic approach. Environ. Sci. Pollut. Res. 2021, 28, 36651–36668. [Google Scholar] [CrossRef] [PubMed]


Publisher’s Note: MDPI stays neutral with regard to jurisdictional claims in published maps and institutional affiliations. |
© 2021 by the authors. Licensee MDPI, Basel, Switzerland. This article is an open access article distributed under the terms and conditions of the Creative Commons Attribution (CC BY) license (https://creativecommons.org/licenses/by/4.0/).