Article

Experimental Study on Ignition Characteristics of RP-3 Jet Fuel Using Nanosecond Pulsed Plasma Discharge

State Key Laboratory of Multiphase Flow in Power Engineering, Xi’an Jiaotong University, Xi’an 710049, China
*
Author to whom correspondence should be addressed.
Energies 2021, 14(20), 6463; https://doi.org/10.3390/en14206463
Submission received: 3 September 2021 / Revised: 30 September 2021 / Accepted: 4 October 2021 / Published: 9 October 2021
(This article belongs to the Special Issue Challenges and Research Trends of Combustion Mechanism)

Abstract

:
A study on forced ignition characteristics of RP-3 jet fuel-air mixture was conducted around a constant volume combustion vessel and a nanosecond pulsed plasma discharge power supply. Experiments were carried out at different initial pressures (pu = 0.2, 0.3, 0.5 atm), equivalence ratios (ϕ = 0.7, 0.8, 1.1), steam concentrations (ZH2O = 0%, 10%, 15%) and oxygen concentrations (ZO2 = 13.5%, 16%, 21%). The relationship between ignition probability and ignition energy is investigated. The experimental results show that the decrease in pressure, equivalence ratio, oxygen concentration and the increase in steam concentration all lead to an increase in minimum ignition energy (MIE). In order to further analyze the experimental data, one existing fitting equation is reformed with the initial conditions taken into account. Multivariate fitting is carried out for different conditions, and the fitting results of ignition probability are in good agreement with the experiments. The MIE results under different experimental conditions are figured out with the new fitting equation. The impact indexes, which stand for the effects of different factors, are also calculated and compared in present work.

1. Introduction

Development of the aero engine is aimed at powerful thrust, high reliability and economic efficiency. To achieve these goals, proper organization and accurate control of the combustion in chamber are indispensable. Lots of research on jet fuel have been carried out to provide more data about its combustion characteristics. Far et al. [1,2] conducted research on the flame structure and laminar flame speed of JP-8 jet fuel in a constant volume bomb and analyzed the influence of dilution gas. Ji et al. [3] measured the laminar flame speed and extinction stretch rate of JP-8 at 403 K and atmospheric pressure using a counterflow configuration. Vukadinovic et al. [4] measured the laminar flame speed and the Markstein length of the Jet-A using a spherical flame at temperatures of 373–473 K, pressures of 1–8 atm and verified mechanisms for kerosene. Ignition delay times of Jet-A and JP-8 were measured [5,6] with nitrogen dilution in a heated shock tube at temperatures of 715–1229 K, pressures of 17.3–50.9 atm, contribute to propose a correlation equation a surrogate model was verified. Kahandawala et al. [7] measured the ignition delay times and soot emissions of JP-8 with Ar dilution and compared the results of JP-8 with its surrogate. They believed that there was no correlation between soot emissions and chemical ignition delay times. RP-3 jet fuel is one of the most widely used jet fuels in China, Zeng et al. [8] measured the ignition delay times in a shock tube at temperatures of 1100–1600 K and pressures of 0.1–0.3 MPa. Zhang et al. [9] studied the auto-ignition characteristics of RP-3 jet fuel in a shock tube at temperatures of 650–1500 K, pressures of 1–20 atm and observed the NTC effects at 750-850 K. Chen et al. [10] used a modified single-cylinder diesel engine to determine the ignition delay times and combustion emissions of the RP-3 jet fuel. Yan et al. [11,12] developed a simplified chemical reaction mechanism RP-3 surrogate model.
It can be summarized that most of the studies on jet fuels focused on the key parameters in the combustion process, such as laminar flame speed, ignition delay times and soot emissions. However, there are very little research have focused on the ignition characteristics of jet fuel. The aviation gas turbine engine is a product with complicated structure that working at severe conditions. It is difficult to avoid flameout during flight due to the harsh conditions, such as inhalation of rain and hail. For military aero engines, special cases may also lead to engine shutdown, such as inhaling smoke after launching weapons, rapid acceleration/deceleration resulting in rich/lean mixture in the combustion chamber and temporarily shutting down for strategic concealment. Therefore, relight and restart at high altitude is a common requirement.
The problem of the aero-engine restart lies in that the air flows into the combustion chamber at high speed, low pressure and temperature, making it very difficult to ignite the mixture and stabilize the flame. To address such challenges in ignition under extreme conditions, new technologies are proposed and tested. Among them, nanosecond pulsed plasma discharge is believed to be a promising approach, owing to its unique capability in producing heat, active species and modifying transport processes [13,14]. In this study, nanosecond pulsed plasma discharge is used to carry out the ignition characteristics of RP-3 jet fuel.
The purpose of this work is to investigate the ignition characteristics of RP-3 under different initial conditions and establish an ignition probability calculation equation containing factors about initial conditions. These results will be presented herein and the MIEs under experimental conditions are predicted with the equation.

2. Experimental Methods

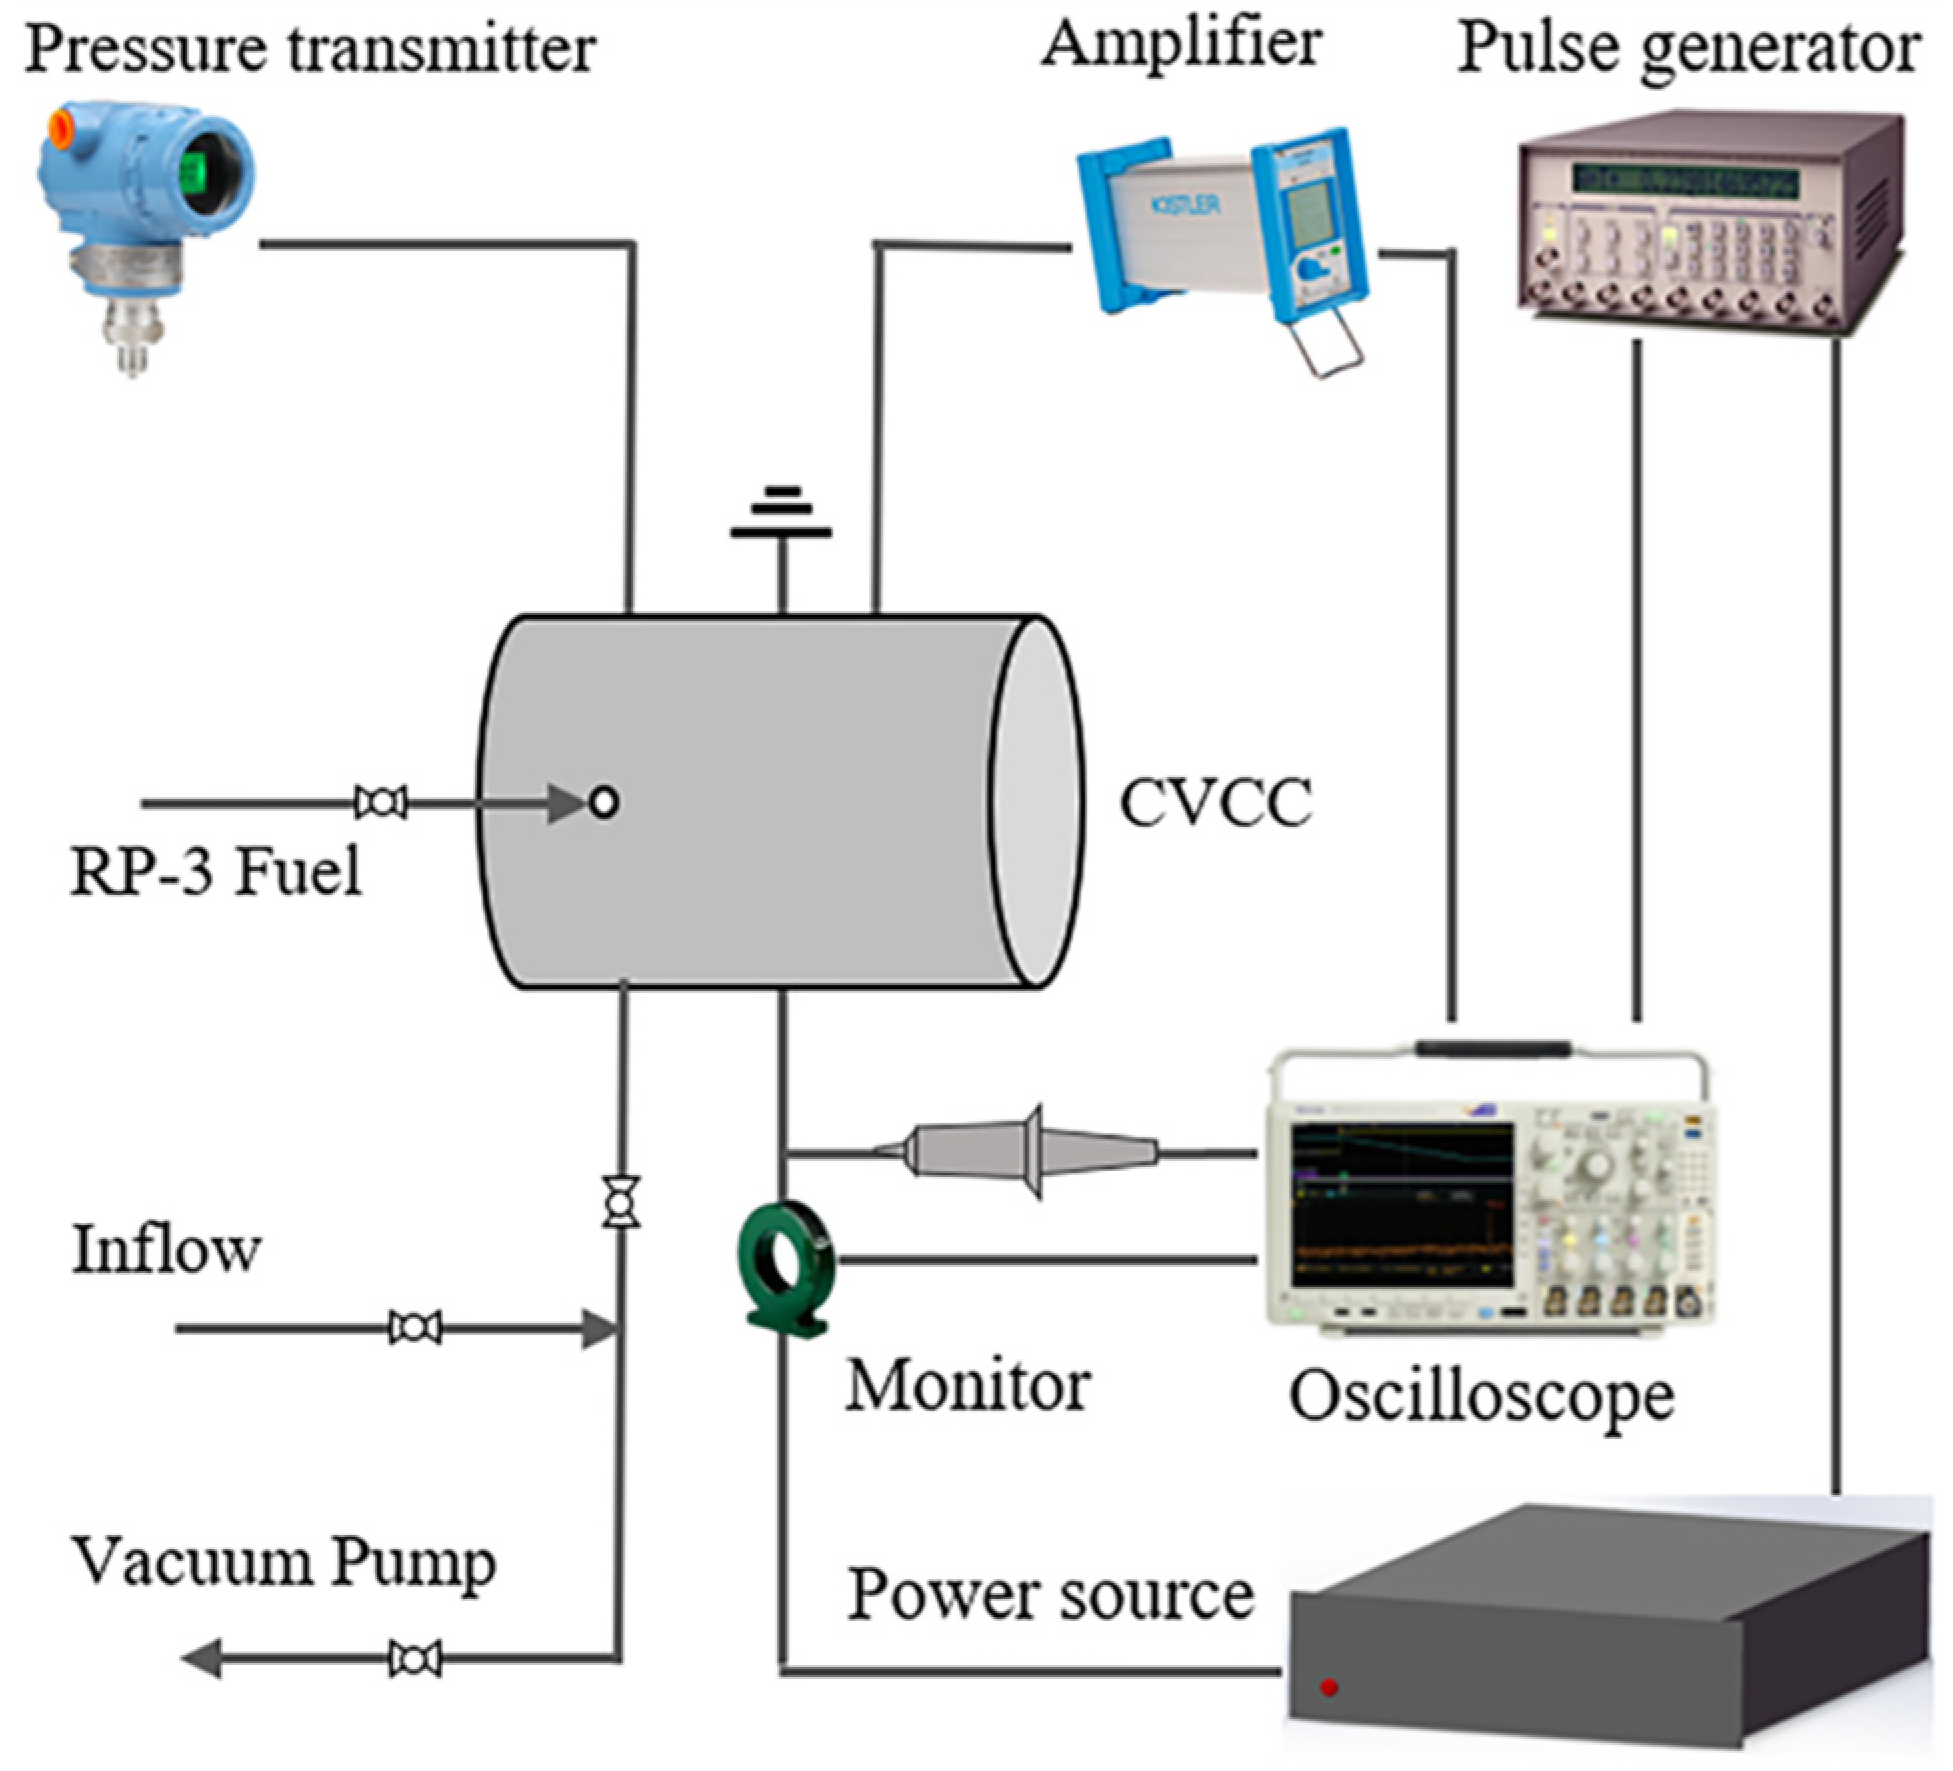
In this study, the experiment setup consists of four parts, including a constant volume combustion bomb, a heating system, a pressure acquisition system and an ignition system. Figure 1 shows schematic diagram of the experimental apparatus. Detailed description was presented in ref. [15,16,17], and only a brief introduction of the experimental apparatus is given here.
The combustion vessel is cylindrical with inner diameter of 180 mm, and volume of 5.58 L. Two tungsten electrodes with a diameter of 0.5 mm are located in the center of the vessel and the electrode gap is fixed at 3 mm. Both electrodes are isolated from the stainless-steel combustor with customized inserts made of Teflon insulating material. A pair of quartz windows with the diameters of 80 mm are located on the two sides for optical access. Initial temperatures are controlled by heating the vessel with a surrounding heating-tape, and the temperature is monitored by an S-type thermocouple located inside the vessel with the accuracy of ±3 K. The pressure was calibrated by the high precision pressure transducer and transmitter with the relative deviation of ±1%. Liquid RP-3 fuel is injected directly into the vessel by micro syringe. Then the air premixed in a heated stainless-steel tank is introduced into the chamber by a micro-adjustable valve. It should be noted that the mixture in the combustion chamber needs to reserve for 5 min to ensure homogeneity before ignition.
A custom pulsed power supply was used to produce high voltage nanosecond pulsed plasma discharge. The discharge energy measurements were performed with a high-voltage probe (P6015A, Tektronix, Beaverton, OR, USA) and a current monitor (6600, Pearson Electronics, Palo Alto, CA, USA). The voltage and current waveforms were recorded with a 5 GHz oscilloscope (DPO4104B, Tektronix, Beaverton, OR, USA). A digital delay pulse generator (DG535, Stanford Research Systems, Sunnyvale, CA, USA) was used to control the timing sequence of ignition, pressure acquisition and discharge waveforms acquisition.
In all conditions, the initial temperature was fixed at 413 K to guarantee fully vaporization of RP-3 jet fuel. The initial pressure was set as 0.2, 0.3 and 0.5 atm. The equivalence ratio was set as 0.7, 0.8 and 1.1. The oxygen concentration was defined as ZO2 = nO2/(nO2 + nN2) and set as 13.5–21%. The steam concentration was defined as ZH2O = nH2O/(nH2O + nO2 + nN2), the range of ZH2O was 0–15%.

3. Results and Discussion

3.1. Discharge Characterization

According to the research by Lefkowitz et al. [18], the inter-pulse time has a noticeable impact on the ignition probability even with the same ignition energy. Thus, in present study, discharge frequency is fixed to 10 kHz. The discharge parameters were set as following: the peak voltage was 12 kV or 15 kV, the pulse width was 100 ns and the ignition energy was adjusted by changing the total number of pulses. Typical nanosecond dis-charge waveforms of voltage, current, power and energy for a single discharge in present study are shown in Figure 2.
It is interesting to note that a single-pulse discharge consists of three phases. The first stage: the storage capacitor is charged, the voltage rises rapidly and a streamer is formed in the discharge gap when breakdown occurs, but it is not completely breakdown. The current and the plasma power are approximately equal to zero. The second stage: the streamer fills the discharge gap completely, thus the voltage drops rapidly, and both of the current and the transient power rises rapidly. The nanosecond pulse source is similar to a MARX generator circuit and can be equivalent to the parallel of capacitors and resistors. These resistances with megohm can be regarded as an open circuit during discharge, thus the power supply can be equivalent to the series of the capacitors (C). The electrode gap is equivalent to a resistor (R) once breakdown occurs and results in RC oscillation of the system. The current direction remains the same at this stage, but the voltage and transient power oscillate multiple times. The third stage: the power supply stops, the current drops rapidly. The electrode gap occurs reverse breakdown and the direction of current is reversed due to the influence of the capacitance. The discharge ends with the voltage and current equal to zero after the direction of breakdown changes twice. The total discharge time is about 2 μs, which shows that the nanosecond pulse excitation produces a microsecond gas discharge, and during which the electron temperature is much higher than the gas temperature, indicates it belongs to the non-equilibrium stage. The energy of a single discharge pulse (Esd) is calculated by Esd = ∫V(t)i(t)dt.

3.2. Measurement of Ignition Probability

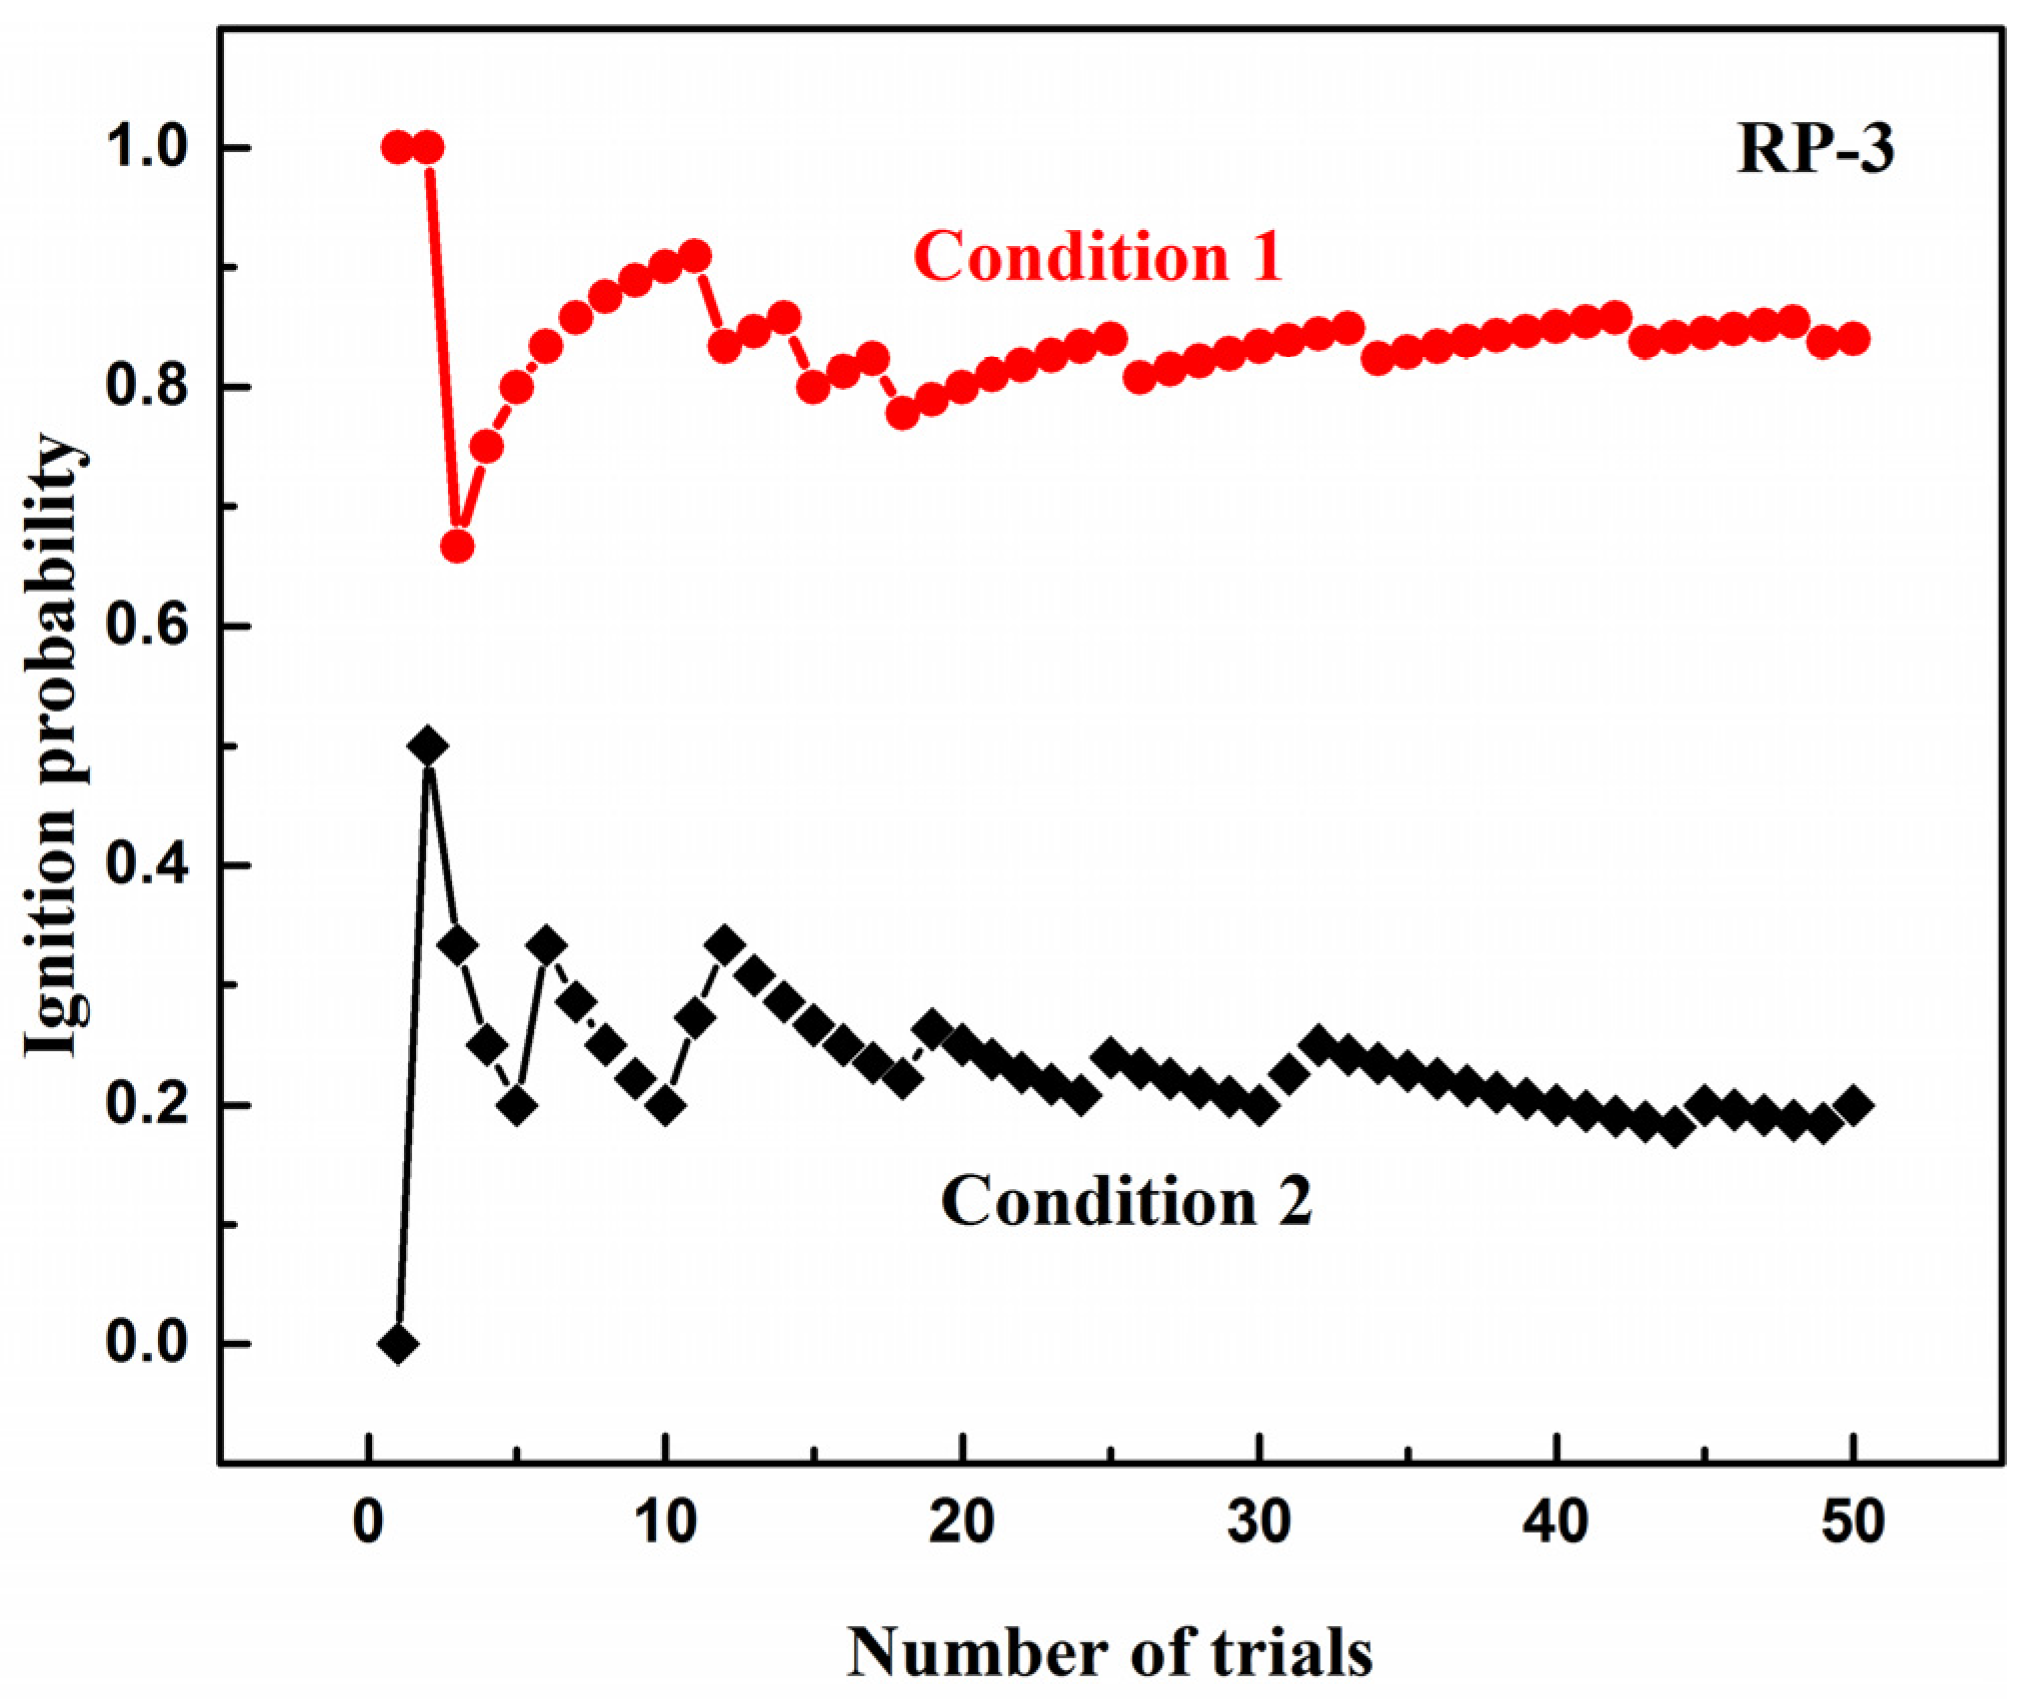
In order to ensure the reliability of the ignition probability, every single experimental condition is repeated 50 times. The ignition probability is calculated by Pi = Ni⁄50, Ni for the amount of successful ignition trials. Whether the ignition is successful is judged by the change of the pressure in the combustion bomb. Ignition probability versus the number of experiments during the repetition of a single experimental condition is shown in Figure 3. The condition 1 was set as Tu = 413 K, pu = 0.3 atm, ϕ = 1.1, ZH2O = 0%, ZO2 = 16%, E = 120.26 mJ and the condition 2 was set as Tu = 413 K, pu = 0.3 atm, ϕ = 0.7, ZH2O = 0%, ZO2 = 21% and E = 70.47 mJ. With the increase of number of experiments, the ignition probability vibrates obviously at first, and then converges gradually. When the same condition is repeated more than 40 times, the obtained ignition probability remained basically unchanged with number of experiments. We define the fluctuation range of the experimental ignition probability between 40 and 50 times as the deviation.
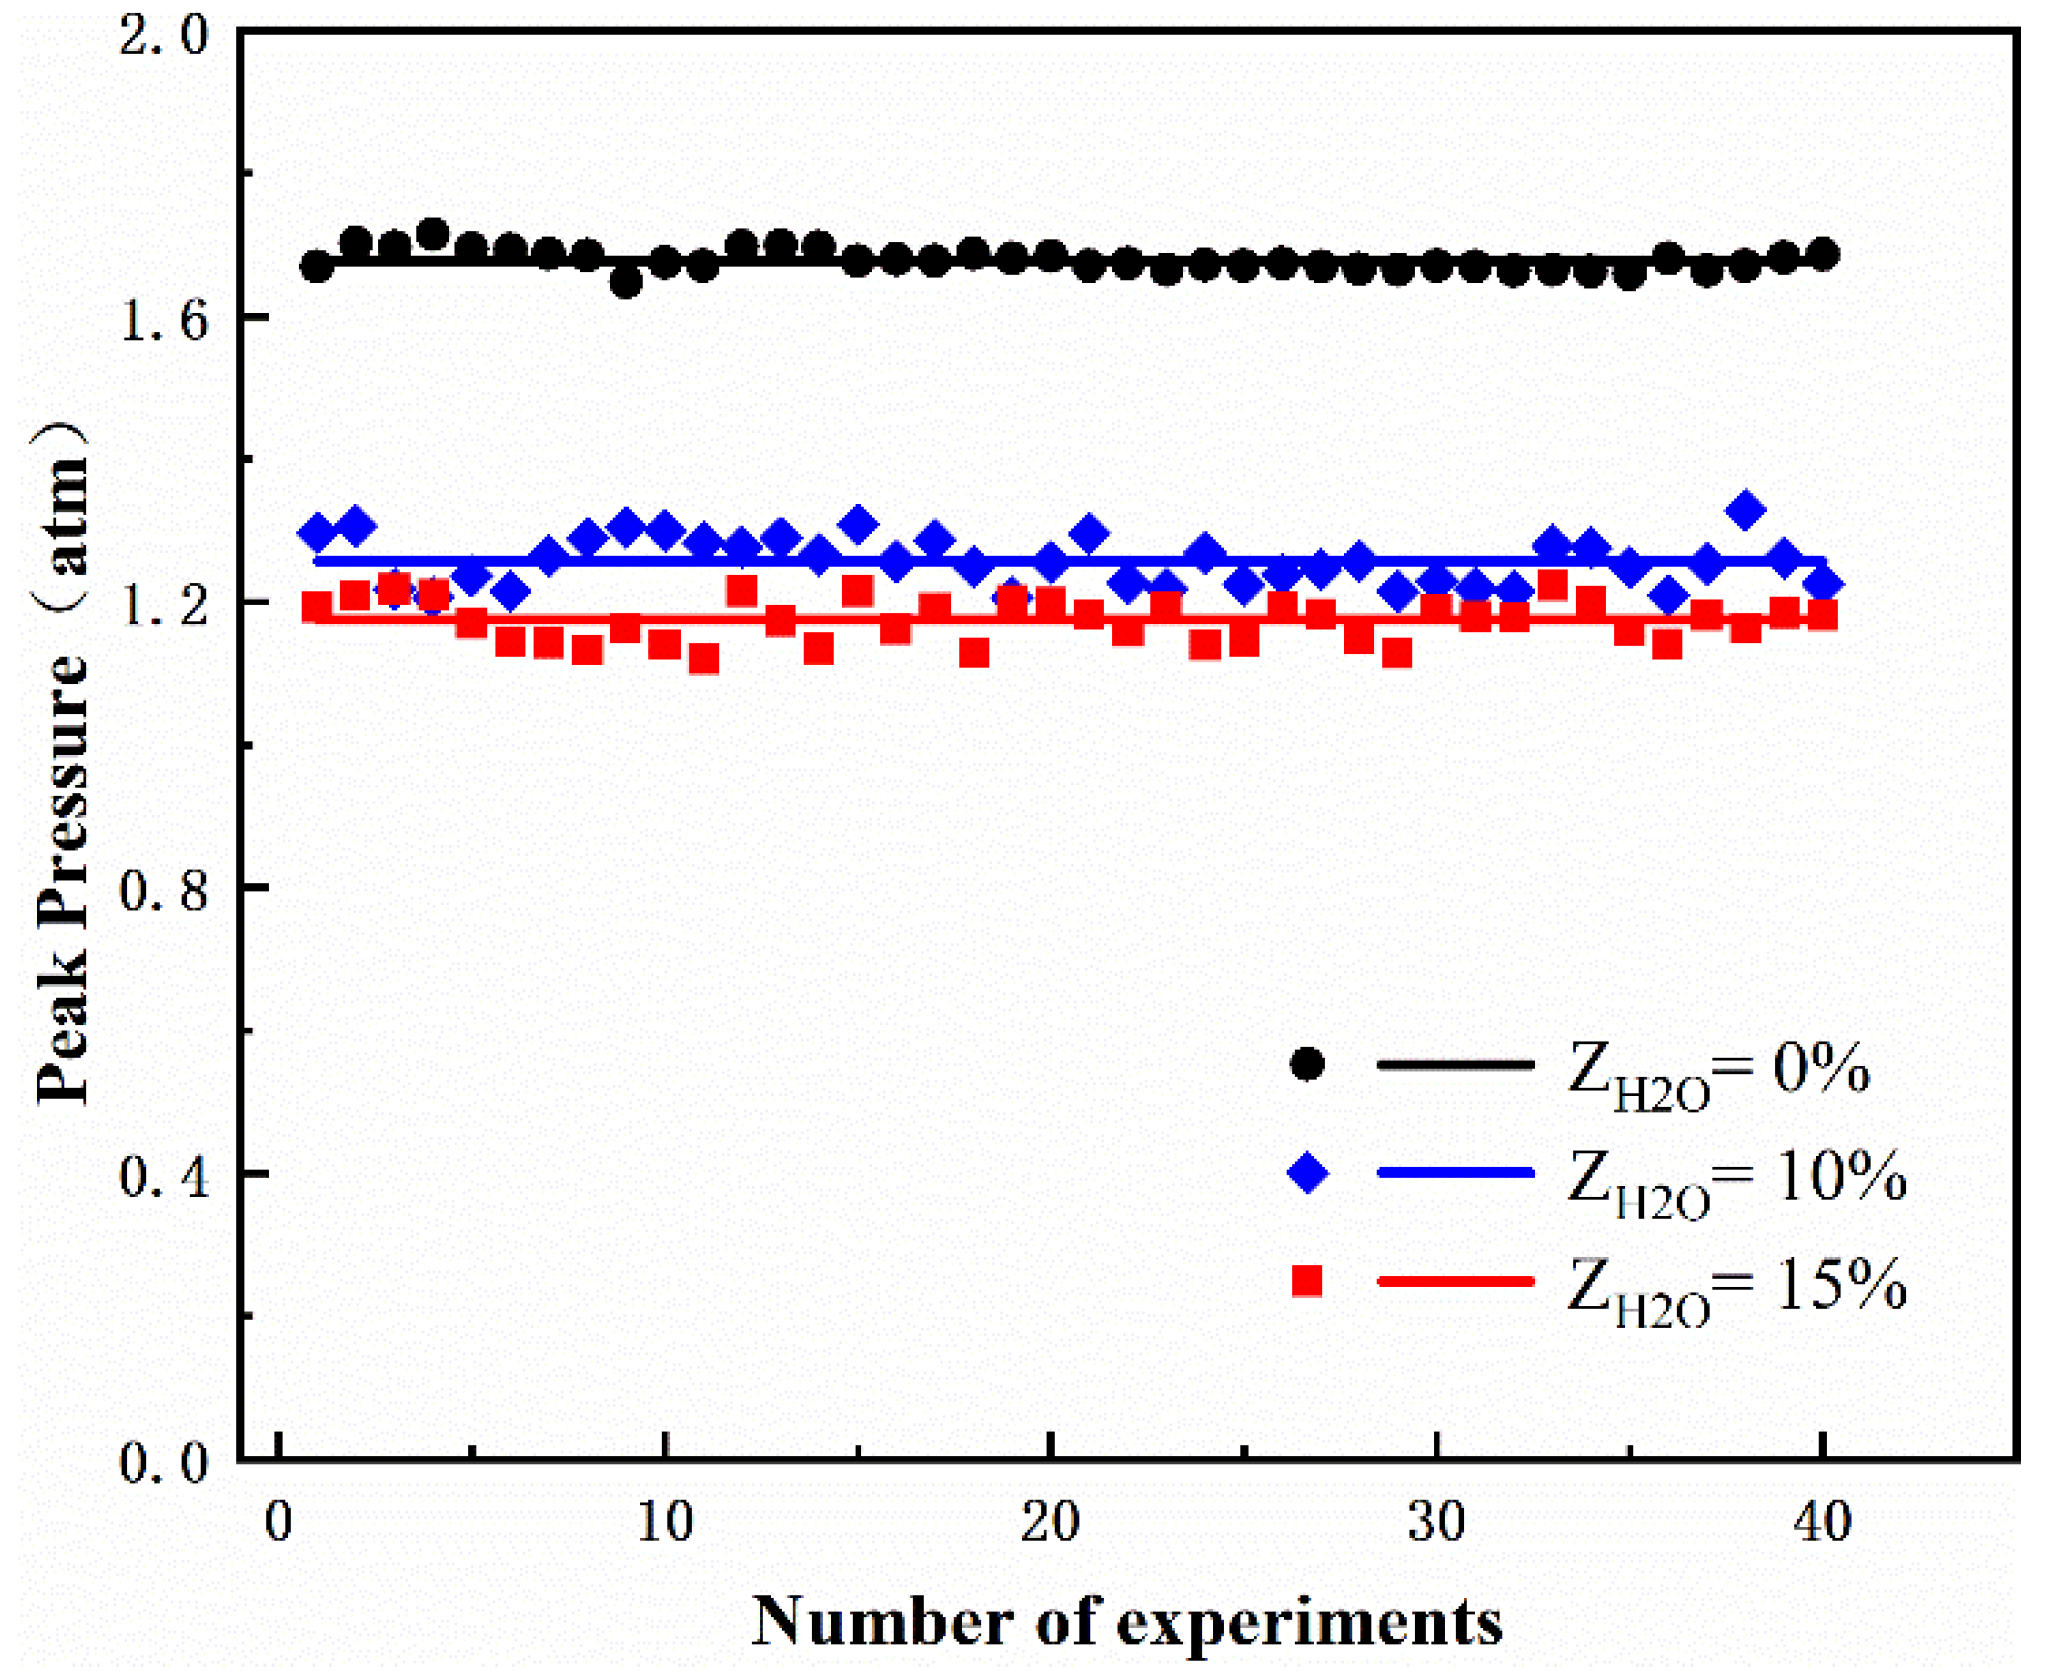
To verify the repeatability of same experimental condition, the pressure trace of each trial is acquired and recorded. The statistical analysis of pressure surge for different steam concentrations (0%, 10%, 15%) at Tu = 413 K, pu = 0.3 atm is presented in Figure 4. The fluctuation range of peak pressure at the same condition is quite small, and the standard deviation is merely 1.5% for ZH2O = 0%. Due to the combustion instability caused by high dilution, the standard deviation of peak pressure is a little larger for higher ZH2O, but still less than 5%. Therefore, the experiments are of good repetition and the results are highly credible.
The binary relationship of ignition probability Pi and ignition energy E is fitted using the formula [19]:
P i = 1 / ( 1 + e β 1 E β 0 )
where the β0 and β1 are fitting parameters. The MIE is defined as the ignition energy corresponding to the ignition probability of 50%. The ignition boundary is defined as the condition at which the mixture cannot be ignited by continuous discharge. Take the initial pressure as example: fix all the other conditions, and then reduce the initial pressure until the mixture cannot be ignited by continuous discharges. The corresponding pressure is the pressure boundary constant (Conp).

3.3. Experimental Results of Ignition Probability under Different Conditions

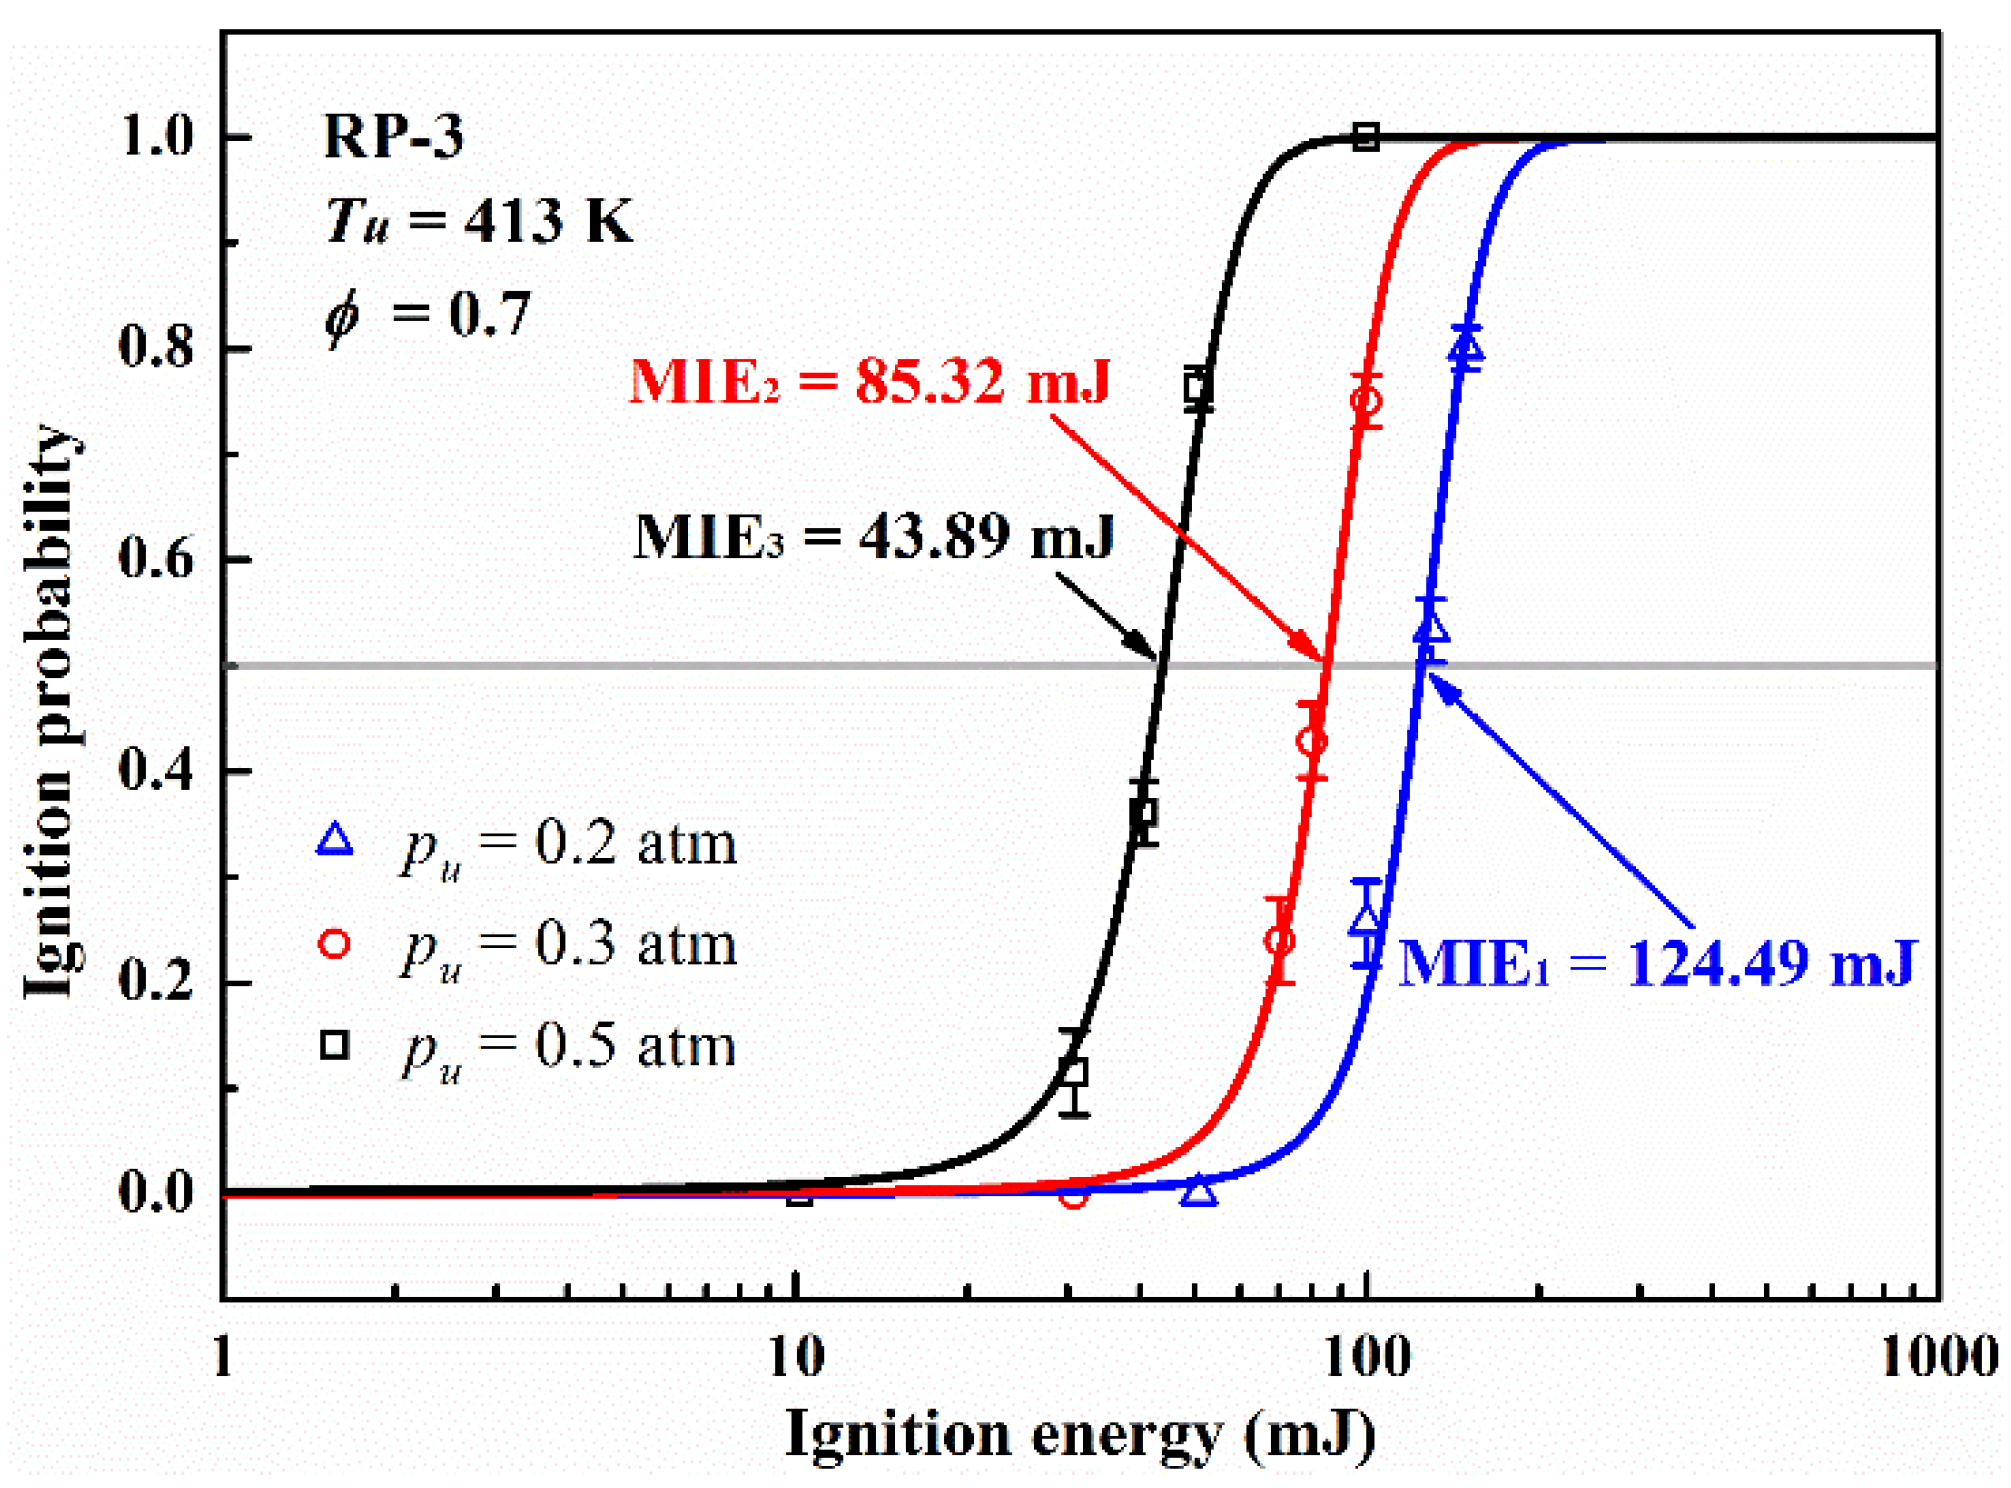
In order to explore the effect of initial pressure on the ignition probability, all the other parameters of the mixture are fixed, among which the steam concentration and oxygen concentration are set as 0% and 21%, and the equivalence ratio is set as 0.7. The ignition probability of RP-3/air mixture with different ignition energy at varied initial pressure (0.2, 0.3 and 0.5 atm) were measured and the experimental results are compared in Figure 5. The results show that as the initial pressure decreases, the ignition probability of the same ignition energy decreases rapidly. The MIE shows a significant increase from 43.89 mJ to 124.49 mJ as well. It was also noticed that the MIE showed a distinct nonlinear relationship with the change of pressure. At smaller initial pressure, the ignition energy increases significantly faster with the same pressure drop. By analyzing the change of MIE with initial pressure, we find that it approximately subordinate to exponential function. Therefore, an attempt is made in the fitting of experimental results, yet related contents will be expanded later.
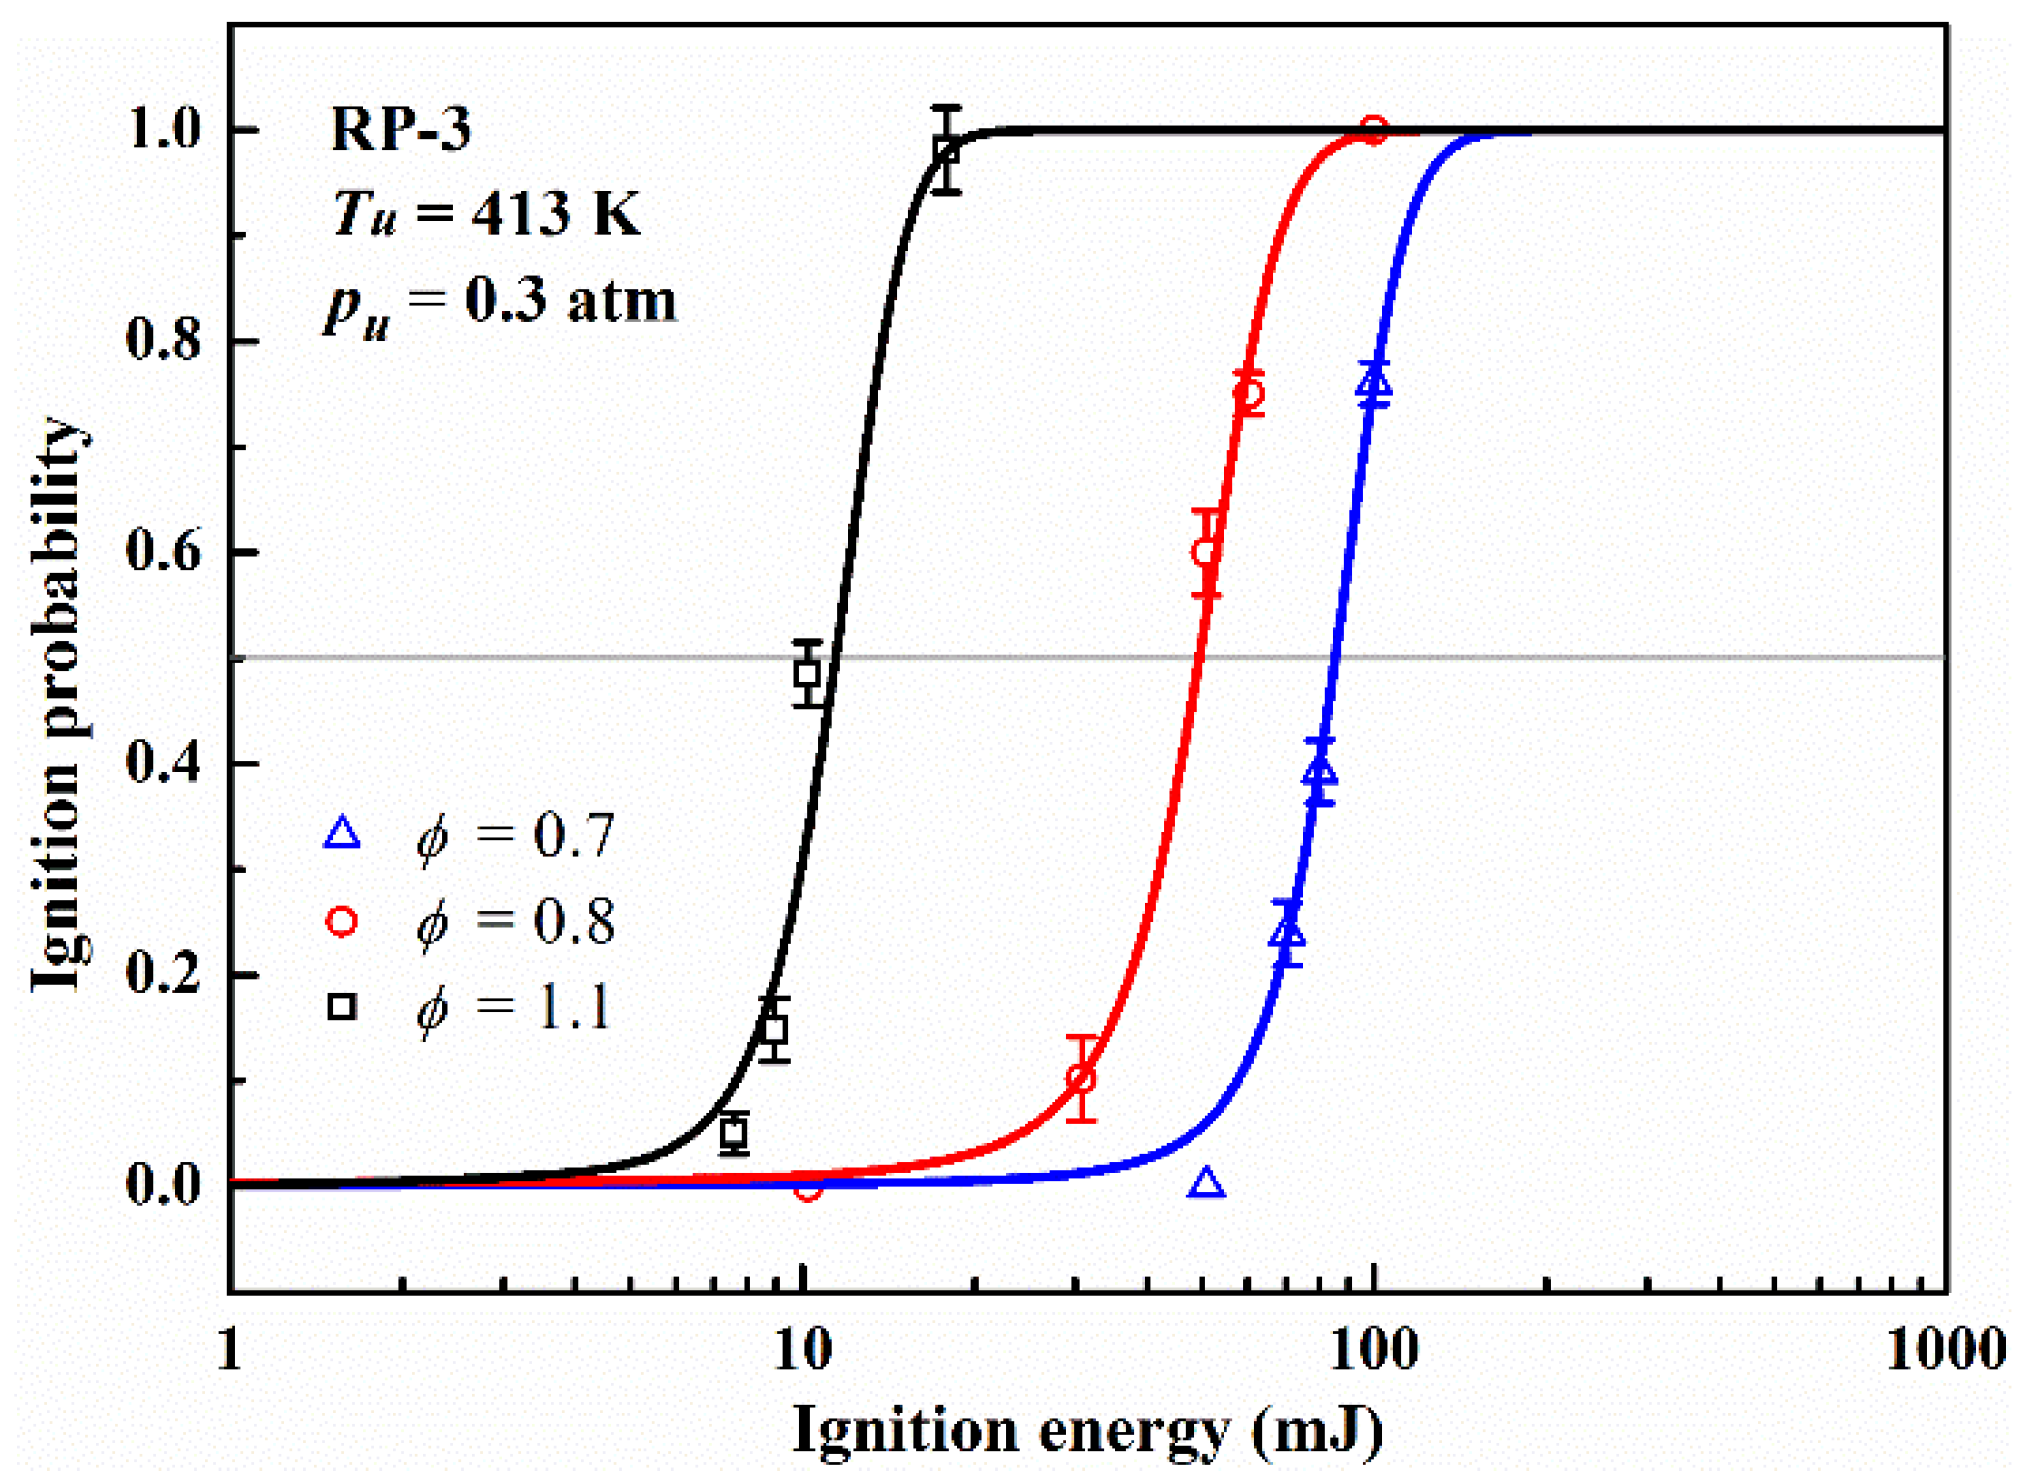
The effects of equivalence ratio were explored by varying the equivalence ratio, while fixing the other parameters at pu = 0.3 atm, ZH2O = 0%, ZO2 = 21%. For aero engine, lean combustion is more common, so we choose three equivalence ratios of 0.7, 0.8 and 1.1. The experimental results are given in Figure 6. Under the premise of maintaining the same ignition probability, as the mixture becomes leaner, the required ignition energy increases substantially. At the same time, a nonlinear relationship between the MIE and equivalence ratio is observed as well.
The effect of steam concentration on the dynamic process of ignition was also studied, and the experiment conditions were set as pu = 0.3 atm, ϕ = 0.8, ZO2 = 21%. The steam concentration was set as 0%, 10% and 15%. The results are presented in Figure 7, and as expected, the increase in steam concentration leads to a sharp increase in the minimum ignition energy. However, it is unexpected that for steam concentration ZH2O = 15%, the corresponding MIE has already risen to as much as 224.57 mJ. Considering the fact that a large discharge energy will prolong the discharge time excessively, experiments with higher steam concentration were not carried out in this study.
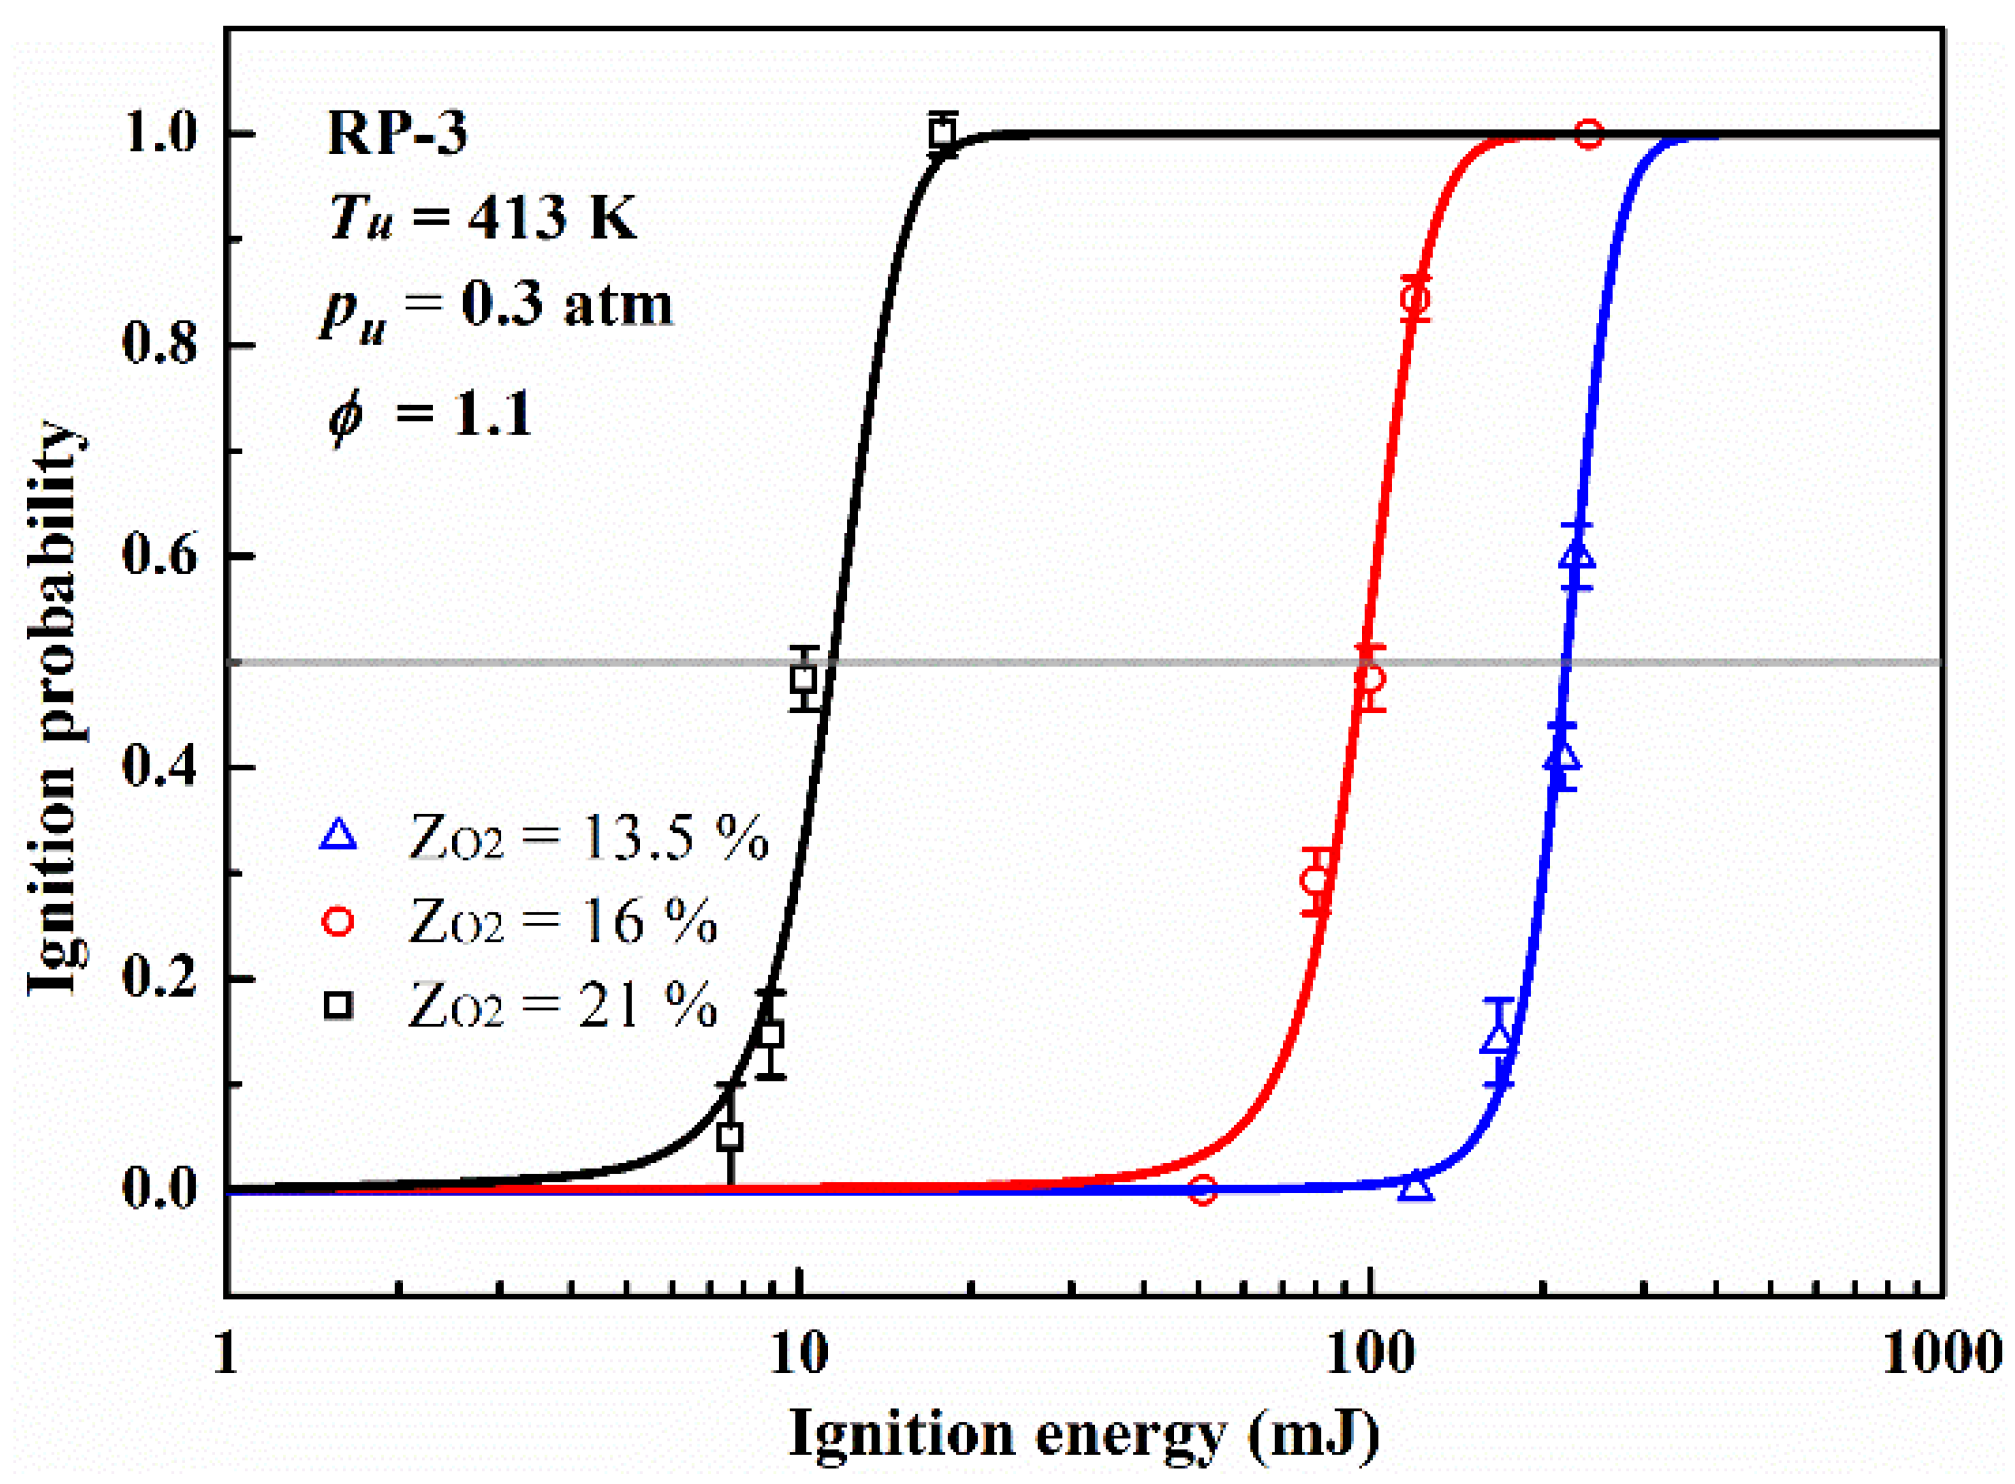
The effect of oxygen concentration was explored by fixing the initial pressure pu = 0.3 atm, ϕ = 1.1, ZH20 = 0%. The oxygen concentration was set as 13.5%, 16% and 21%. Since the energy needed for successful ignition is very small in the condition of ZO2 = 21% the peak voltage of discharge for this experiment was set as 12 kV and the energy of single pulse reduces to 7.61 mJ. As shown in Figure 8, it’s clear that the effect of oxygen concentration on the ignition probability of ignition is much stronger than that of the three factors above. A drop of 5% in oxygen concentration result in a nearly 743% increase of MIE (from 11.46 mJ to 96.57 mJ). The decrease in oxygen concentration can be seen as dilution with nitrogen, and if the result is calculated by the same definition of steam concentration, then the ZO2 = 16% can be converted to ZN2 = 23.8%. Therefore, it is not surprisingly that the oxygen concentration has such a strong impact on ignition probability.

3.4. Multivariate Fitting of Ignition Probability and Experimental Conditions

The results obtained through experiments are very limited, so we hope to establish a multi-dimensional fitting equation to estimate the minimum ignition energy under comprehensive conditions. For industrial fuels such as RP-3 jet fuel, a reasonable fitting equation is more suitable for practical engineering applications. At the same time, we also hope that the new equation can take into account the influence of the initial conditions. Then, we can provide guidance for improving the ignition process by analyzing the variation of ignition probability under different conditions.
The existing formula Equation (1) describes the binary relationship between ignition energy and probability, but it does not include the initial condition, hence cannot indicate the influence of these factors. In order to give a quantitative assessment, the existing equation was reformed. The statistical thinking of the original equation was kept, meanwhile new terms were added, finally to achieve a common fitting of multiple factors.
From a statistical point of view, after taking initial conditions into consideration, the output of the experiment is still subject to the Bernoulli distribution (“ignition” or “no ignition”). Therefore, the ignition probability Pi(x) can be represented with the parametric logistic distribution function:
P i ( x 1 , x 2     x n ) = 1 / ( 1 + e θ ( x 1 , x 2 x n ) ) ,
it should be noted that Equation (1) is a specific form of Equation (2) for n = 1 ,     x 1 ~ E ,   θ ( x 1 ) = β 1 E β 0 .
As mentioned above, the experimental results of MIE show an approximately exponential relationship with these factors. So the θ(x) is expanded and an exponential term representing effect of the initial pressure is added, after which the expression is as follows:
θ ( E , Z p ) = β 1 E     ε ( Z p ) β 0 ,
ε ( Z p ) = e Z p β p ,
where   Z p is the initial pressure, and β p is the impact index of initial pressure. Further consider the influence of the flammable limit and add the boundary constant to the equation, then we can acquire:
ε ( Z p ) = ( Z p C o n p ) / Z p     e Z p β p ,
in which the C o n p is the ignition boundary of initial pressure, and the ( Z p C o n p ) / Z p describes the near-limit effect on the ignition process. the final formula which contains effects of energy and initial pressure is presented as following:
P i ( E , Z p ) = 1 1 + exp ( β 1 E     Z p C o n p Z p       e Z p β p β 0 ) ,
the fitting parameters are computed using the maximum likelihood estimation (MLE) method. Thus, we can estimate the impact of both ignition energy and operating conditions on the ignition probability. Moreover, with the βp as the impact index of the initial pressure, a quantitative comparison of different factors can be carried out.
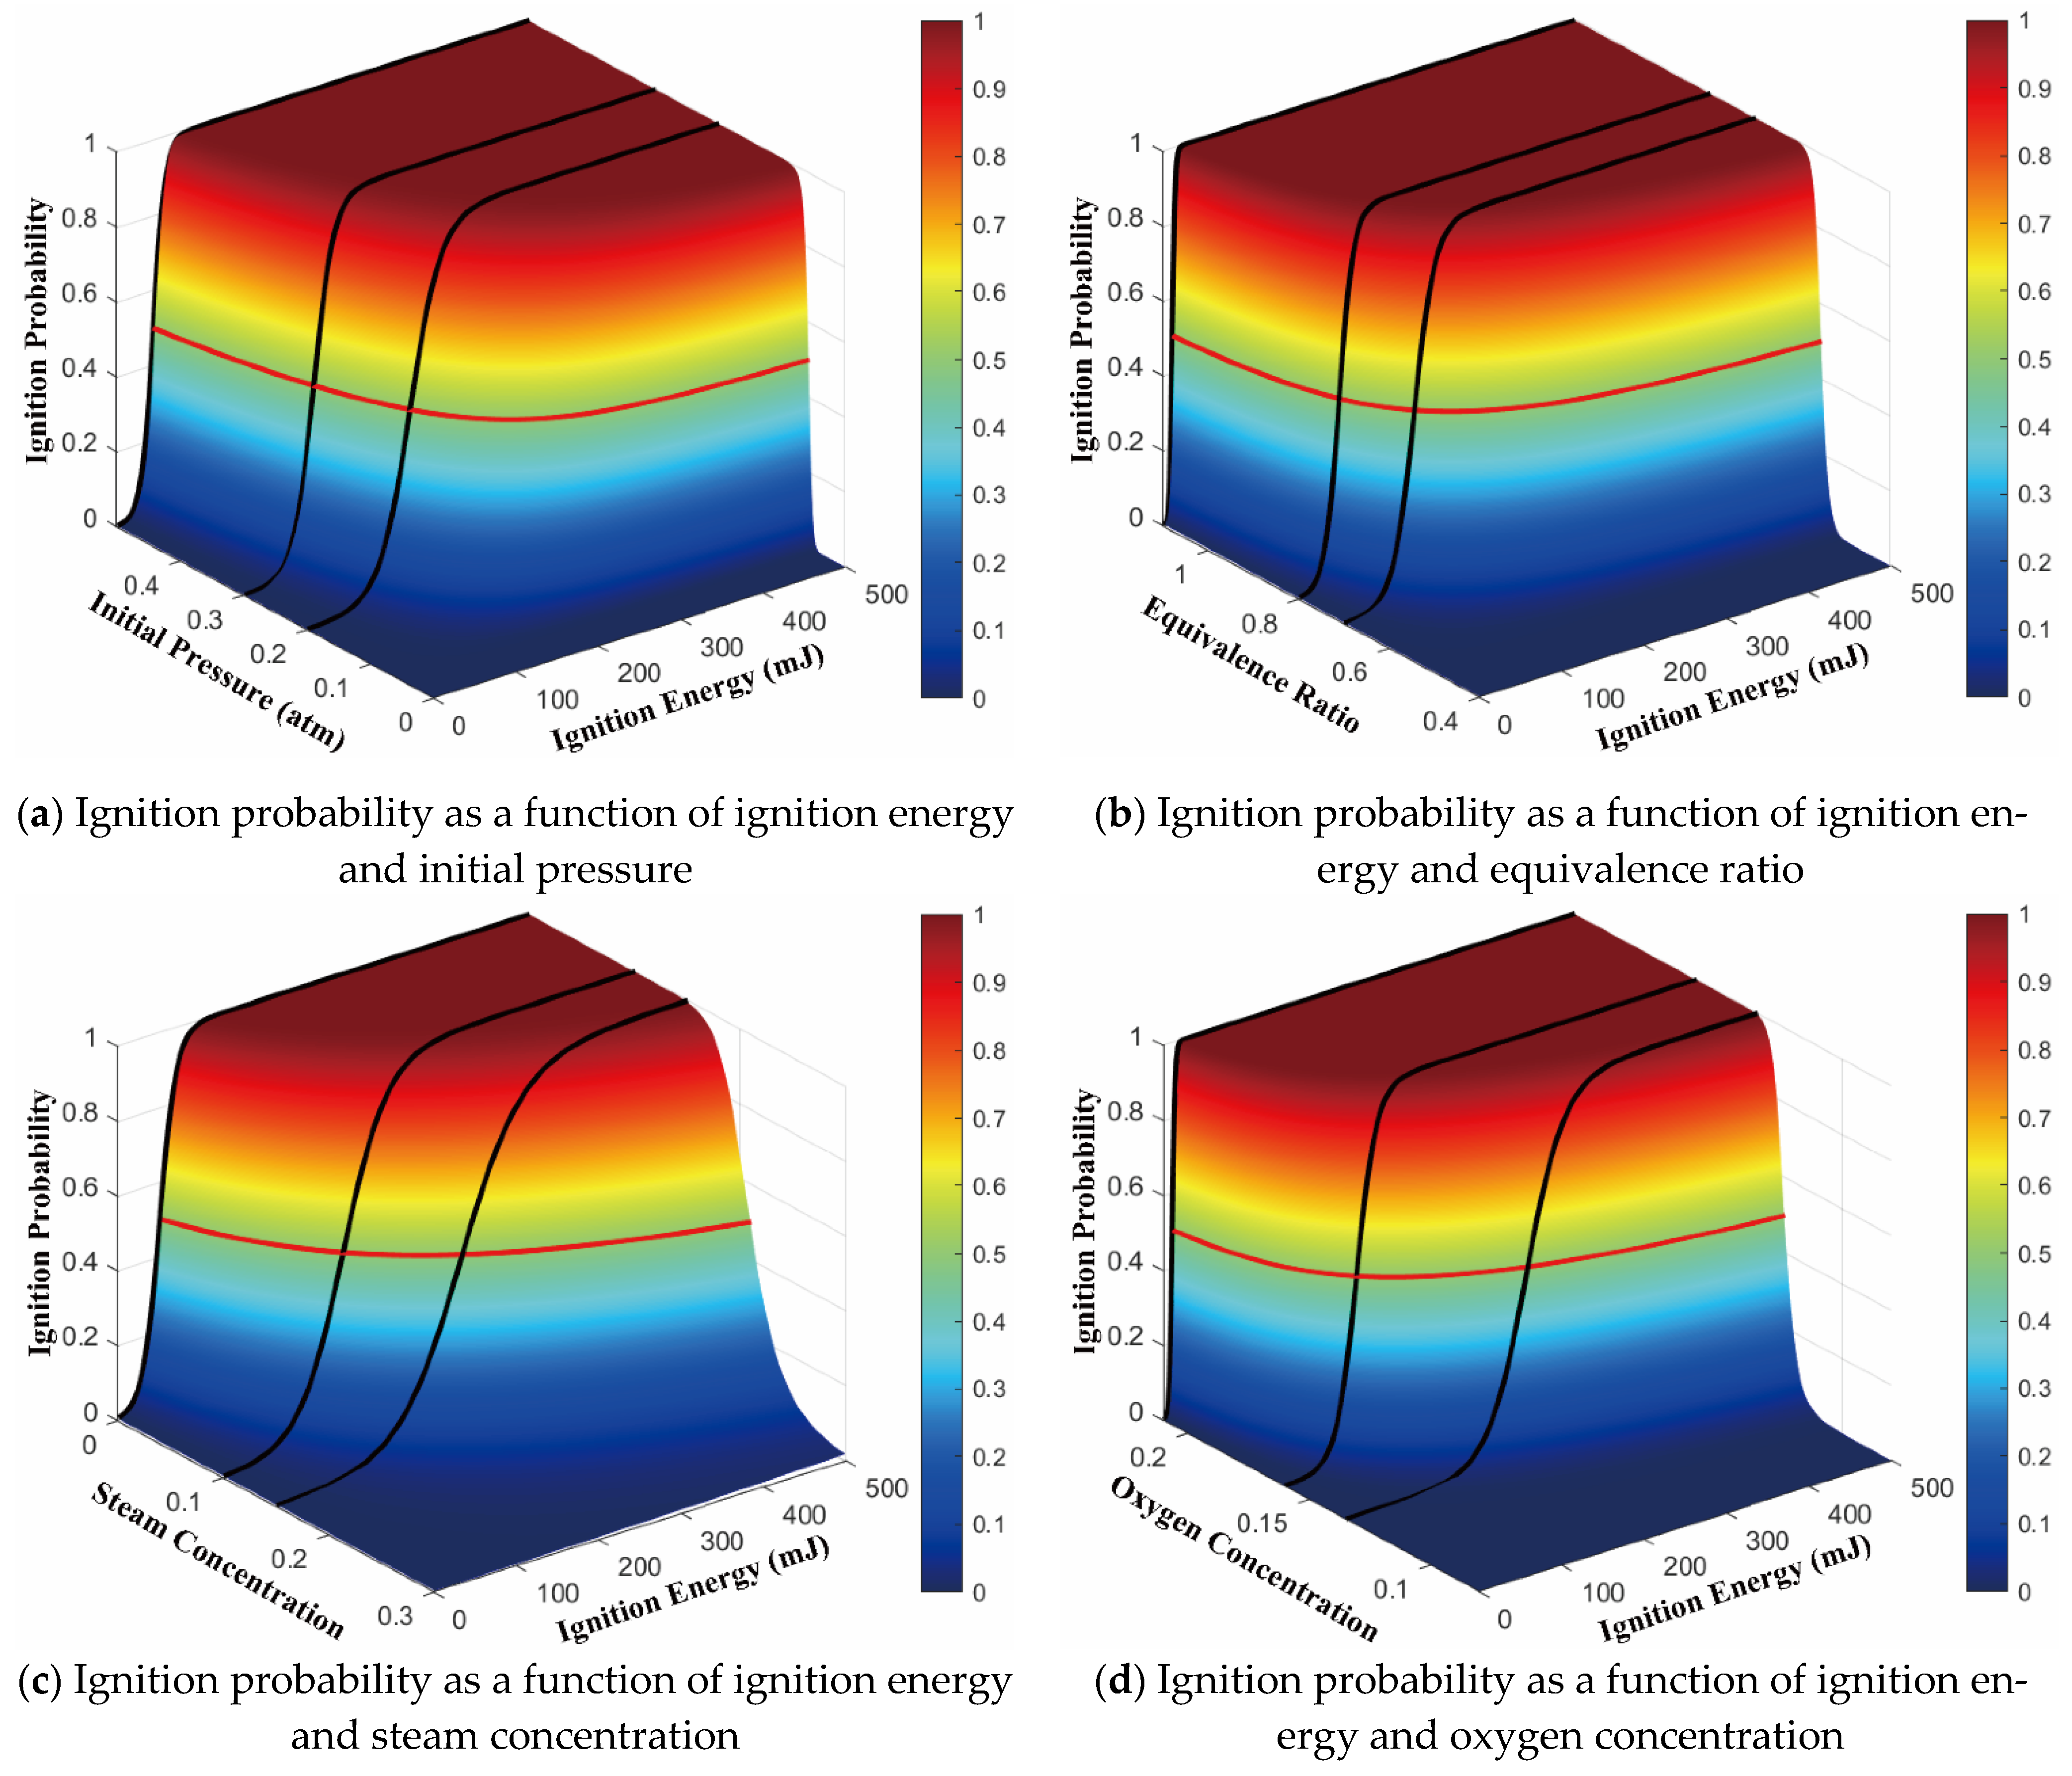
Using Equation (6) to fit the experimental data, we acquire the ignition probability as a function of ignition energy and pressure, as shown in Figure 9a. The black lines represent the fitting curve of experimental data taken from Figure 5, and the red line indicates the MIE at comprehensive conditions. To make the 3D map more intuitive and understandable, we provide the black fitting lines instead of the raw data from the Figure 5. It can be seen from Figure 9a that the fitting results agree well with the experimental results at three initial pressures. As the initial pressure decreases, the ignition probability of the same ignition energy gradually decreases. In the immediate vicinity of the pressure boundary, the ignition probability shows a rapid decline, which is in line with expectations.
Whereupon, referring to the thought of initial pressure factor, we added the other factors:
ε ( Z ϕ ) = ( Z ϕ C o n ϕ ) / Z ϕ     e Z ϕ β ϕ ,
ε ( Z ϕ )   stand for the effect of equivalence ratio;
ε ( Z O 2 ) = ( Z O 2 C o n O 2 ) / Z O 2     e Z O 2 β O 2 ,
ε ( Z O 2 ) stands for the oxygen concentration. The effect of steam concentration   ε ( Z H 2 O )   is contrary to the other three, so its equation has been constructed in a different way:
ε ( Z H 2 O ) = C o n H 2 O Z H 2 O 1 Z H 2 O     e Z H 2 O β H 2 O ,
After the finish of the equation, we fit the experimental data of the other three factors. The results are shown in Figure 9b–d, along with the corresponding data from Figure 6, Figure 7 and Figure 8. It can be seen that the new equation form performs well for all factors and gives reasonable predictions on ignition probability, which shows that the proposed fitting equation is valid and reliable. The influence of four factors is also demonstrated. Within the Figure 9, it is easy to see that MIE shows strong sensitivity to oxygen concentration. Even at the condition of high oxygen concentration, a decrease in oxygen concentration leads to a rapid increase in MIE. The fitting parameter values in the equation are listed in Table 1.
The magnitude of parameter βx represents the effect of the corresponding factor on the ignition probability. As estimated in the previous section, the index βx of oxygen concentration is the maximum among all the four factors, as high as 35.000. The impact of steam concentration comes in second among all factors, while the initial pressure and equivalence ratio come last. Based on the fitting results, we attempt to give the prediction equation of MIE under complex conditions.
M I E = A 0       ξ ( Z x ) ,
ξ ( Z x ) = β 0 / ( β 1     ε ( Z x ) ) / A x ,
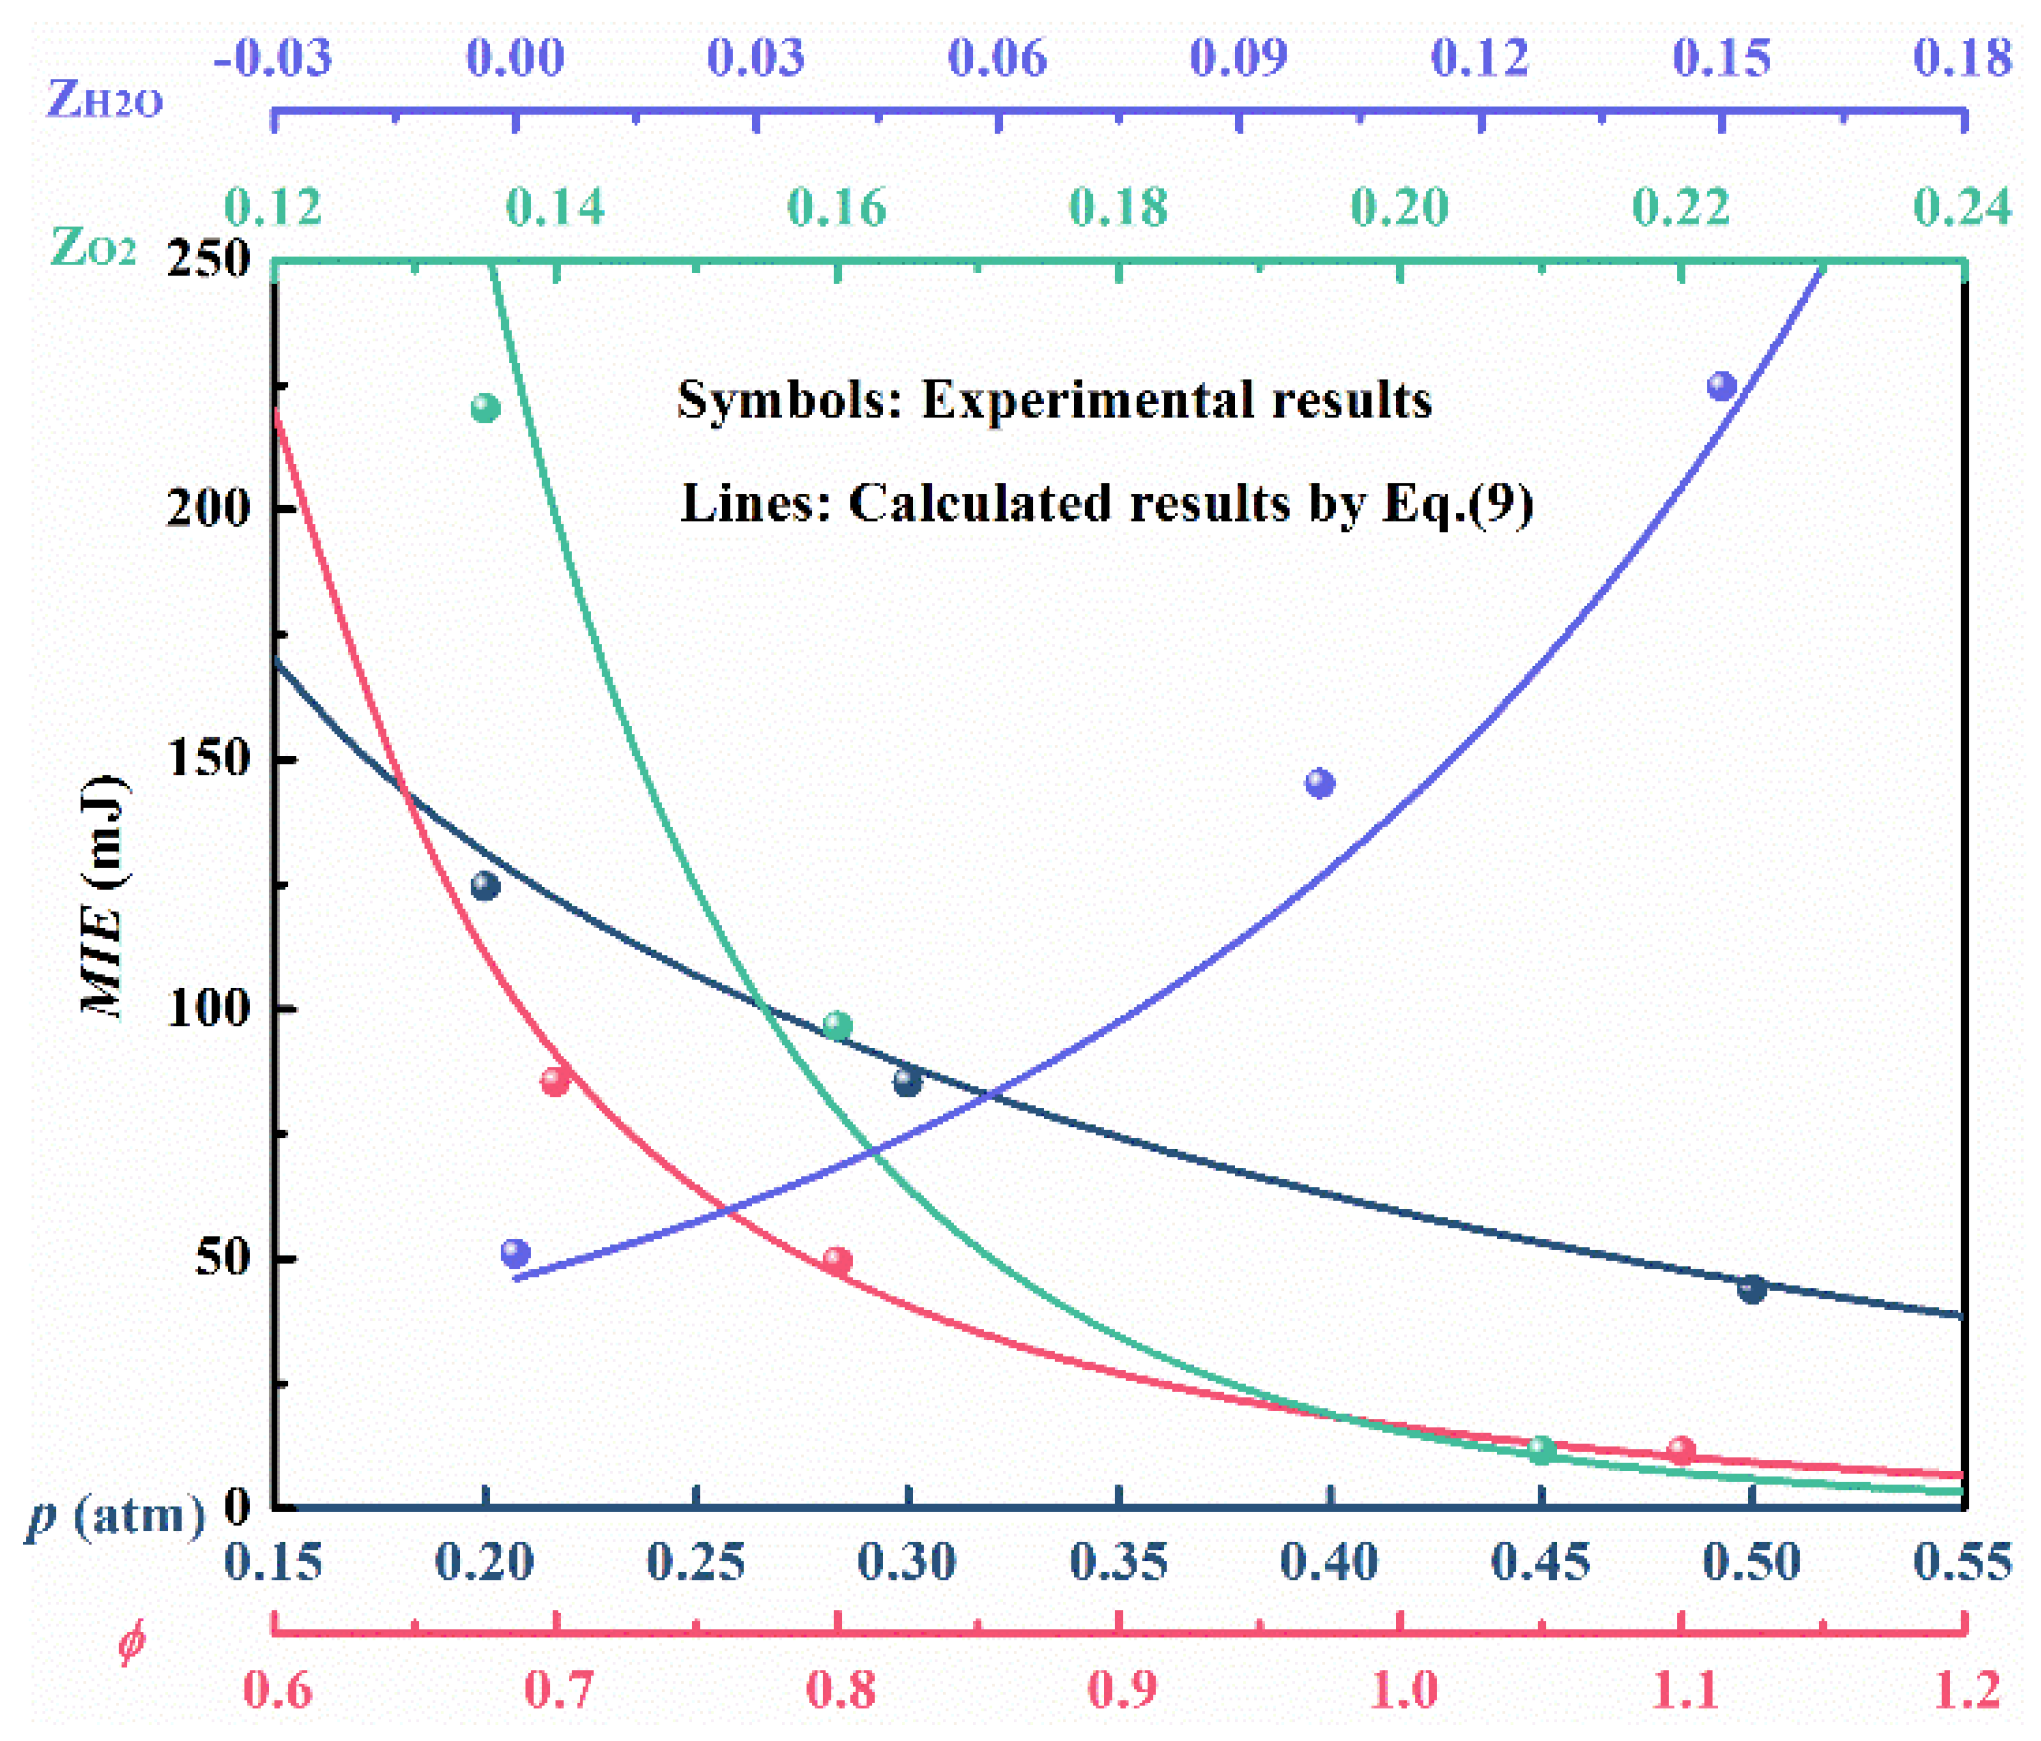
The specific equation developed is too long to be given here and details can be found in Appendix A. According to the Equations (10) and (11), the MIE of the experimental conditions were calculated, and the comparison between the calculated result and the experimental result were shown in Figure 10, for all conditions, the predictions on MIE are in good agreement with the experimental results.
These results can provide an effective direction for us to improve the actual ignition process. When considering the pressure factor, we need to note that the aero engine rarely approaches the ignition boundary of the pressure under actual working conditions. At this time, the MIE is not very sensitive to pressure fluctuations, so moderate enhancement on ignition energy is a suitable technological means to cope with the influence of pressure drop. When it comes to the oxygen concentration, the situation is completely different. Even for ZO2 = 21%, the MIE is still very sensitive to the oxygen concentration. It’s easy to figure out from Figure 10 that for ZO2 < 16%, a great enhancement on ignition energy only results in a very small improvement on the ignition probability. In this case, increasing the oxygen concentration, at least the local oxygen concentration of ignition section, is the best way to improve the ignition probability.
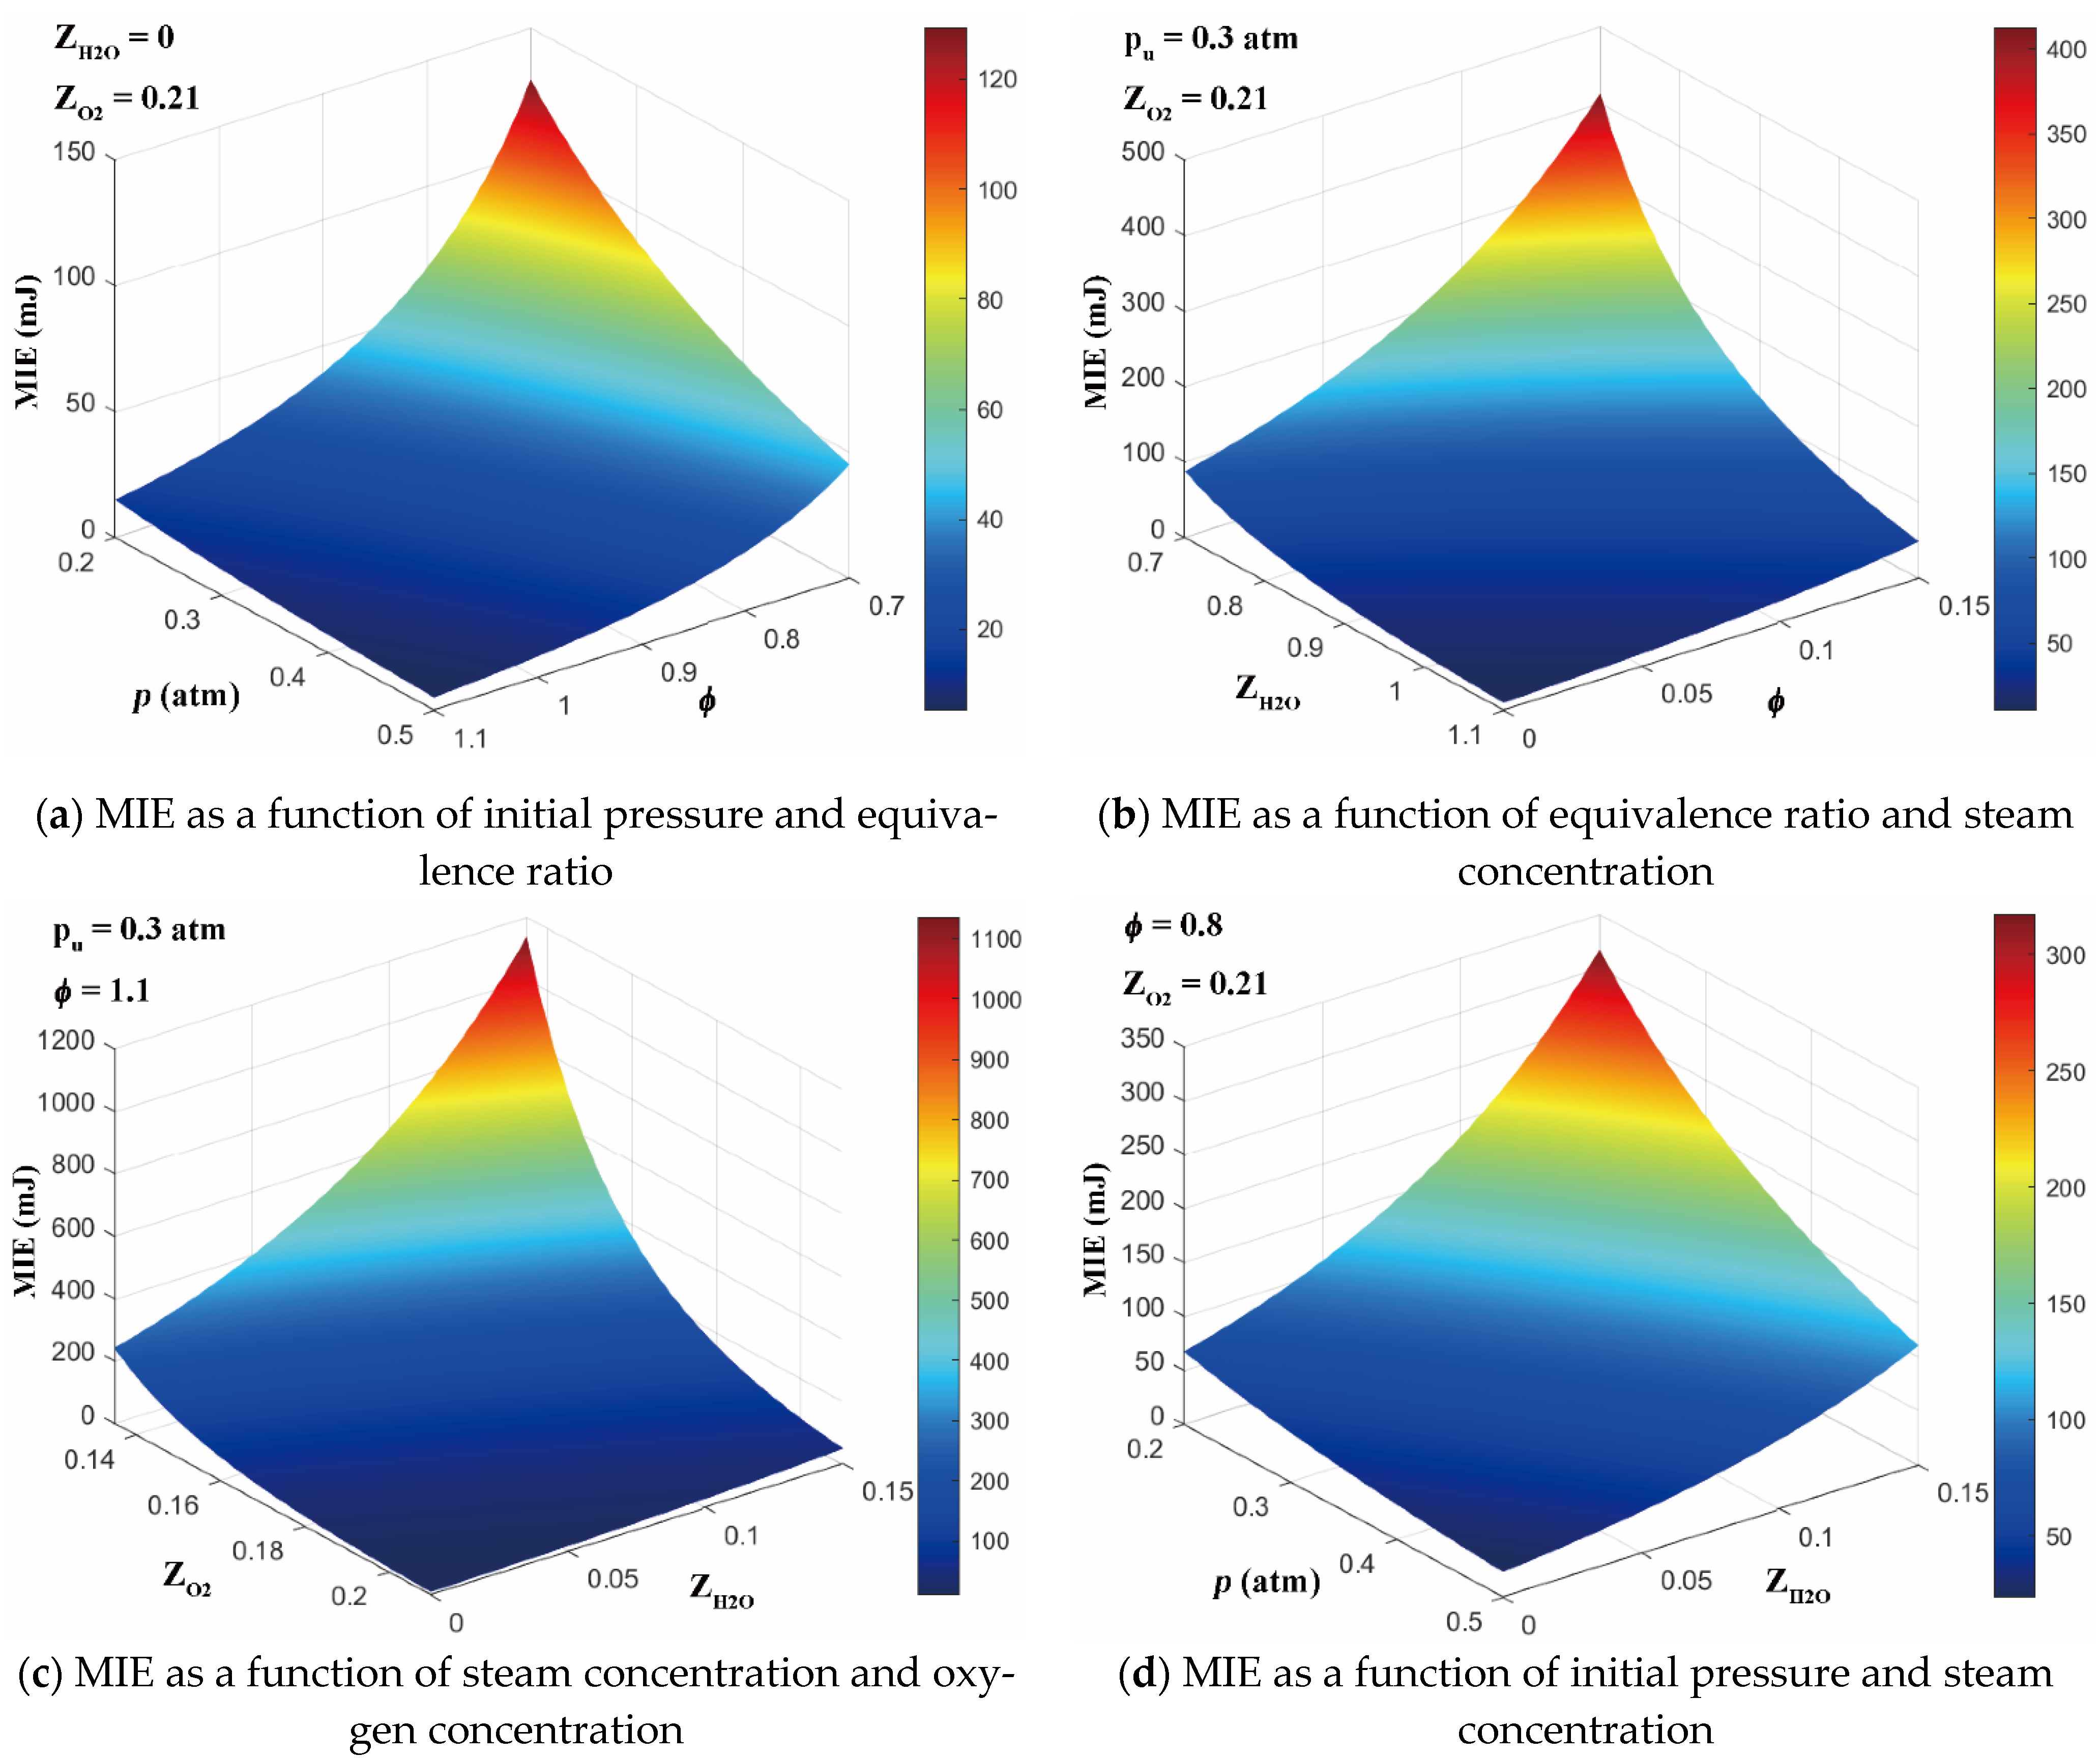
Finally, MIE under comprehensive conditions were calculated with Equations (10) and (11), and the results are provided in Figure 11. Subject to the form of drawing, each figure can only show the influence of two factors. The difference between the effects of four factors is very significant, which is consistent with the impact index above.
4. Conclusions

In this paper, we studied the ignition characteristics of RP-3 jet fuel under complex conditions using a constant volume combustion bomb and nanosecond pulsed plasma discharge. This study focuses on the influences of the initial pressure, equivalence ratio, steam concentration and oxygen concentration.
  • The ignition probability of RP-3 jet fuel under different initial conditions were obtained through experiments. Ignition probability increases with the increasing of the initial pressure, equivalence ratio and oxygen concentration. The increasing of steam concentration actually inhibits ignition probability. In order to quantify the influence of different factors, and provide a practicable calculation method for engineering applications, the existing equations were reformed and the impact index βx was defined.
  • By fitting the experimental data with new equations, the fitting parameters were obtained and the ignition probability map under different conditions were provided. The fitting results of ignition probability were in good agreement with the experimental results. The βx was also obtained, the results showed that the influence of initial pressure was small, and the effect of oxygen concentration was the most significant.
  • Based on the results of the multivariate fitting, some suggestions for improving the ignition probability were proposed. The MIE fitting equation was given, and the fitting results of MIE under comprehensive conditions were provided.

Author Contributions

X.G., methodology, software, investigation, fata curation, writing—original draft preparation; E.H., methodology, supervision, writing—review and editing, funding acquisition; X.L., conceptualization, software, investigation; G.Y., software, investigation; Z.H., supervision, project administration. All authors have read and agreed to the published version of the manuscript.

Funding

This work is funded by the National Natural Science Foundation of China (52176131).

Institutional Review Board Statement

Not applicable.

Informed Consent Statement

Not applicable.

Data Availability Statement

Not applicable.

Acknowledgments

This work is financially supported by the National Natural Science Foundation of China (52176131).

Conflicts of Interest

The authors declare no conflict of interest.

Appendix A

The prediction equation of MIE under complex conditions:
M I E = A 0       ξ ( Z x ) ,
A 0 = 0.013 ,
ξ ( Z ϕ ) = 1.560 0.015     Z ϕ 0.5 Z ϕ     exp ( 3.761     Z ϕ ) ,
ξ ( Z p ) = 0.684 0.037     Z p 0.04 Z p     exp ( 3.052     Z p ) ,
ξ ( Z O 2 ) = 1.546 0.001     Z O 2 0.09 Z O 2     exp ( 35.000     Z O 2 ) ,
ξ ( Z H 2 O ) = 1.302 0.261     0.4 Z H 2 O 1 Z H 2 O     exp ( 8.252     Z H 2 O )

References

  1. Far, K.E.; Parsinejad, F.; Metghalchi, H. Flame structure and laminar burning speeds of JP-8/air premixed mixtures at high temperatures and pressures. Fuel 2010, 89, 1041–1049. [Google Scholar] [CrossRef]
  2. Far, K.E.; Moghaddas, A.; Metghalchi, H.; Keck, J.C. The effect of diluent on flame structure and laminar burning speeds of JP-8/oxidizer/diluent premixed flames. Fuel 2011, 90, 1476–1486. [Google Scholar]
  3. Ji, C.; You, X.; Holley, A.; Wang, Y.; Egolfopoulos, F.; Wang, H. Propagation and Extinction of Mixtures of Air with n-Dodecane, JP-7, and JP-8 Jet Fuels. In Proceedings of the 46th AIAA Aerospace Sciences Meeting and Exhibit, Reno, NV, USA, 7–10 January 2008. [Google Scholar]
  4. Vukadinovic, V.; Habisreuther, P.; Zarzalis, N. Influence of pressure and temperature on laminar burning velocity and Markstein number of kerosene Jet A-1: Experimental and numerical study. Fuel 2013, 111, 401–410. [Google Scholar] [CrossRef]
  5. Black, G.; Curran, H.J.; Pichon, S.; Simmie, J.M.; Zhukov, V. Bio-butanol: Combustion properties and detailed chemical kinetic model. Combust. Flame 2010, 157, 363–373. [Google Scholar] [CrossRef]
  6. Vasu, S.S.; Davidson, D.F.; Hanson, R.K. Jet fuel ignition delay times: Shock tube experiments over wide conditions and surrogate model predictions. Combust. Flame 2008, 152, 125–143. [Google Scholar] [CrossRef]
  7. Kahandawala, M.S.P.; DeWitt, M.J.; Corporan, E.; Sidhu, S.S. Ignition and emission characteristics of surrogate and practical jet fuels. Energy Fuel 2008, 22, 3673–3679. [Google Scholar] [CrossRef]
  8. Zeng, W.; Li, H.X.; Chen, B.D.; Ma, H.A. Experimental and kinetic modeling study of ignition characteristics of chinese RP-3 kerosene. Combust. Sci. Technol. 2014, 187, 396–409. [Google Scholar] [CrossRef]
  9. Zhang, C.; Li, B.; Rao, F.; Li, P.; Li, X. A shock tube study of the autoignition characteristics of RP-3 jet fuel. Proc. Combust. Inst. 2015, 35, 3151–3158. [Google Scholar] [CrossRef]
  10. Chen, L.; Ding, S.; Liu, H.; Lu, Y.; Li, Y.; Roskilly, A.P. Comparative study of combustion and emissions of kerosene (RP-3), kerosene-pentanol blends and diesel in a compression ignition engine. Appl. Energy 2017, 203, 91–100. [Google Scholar] [CrossRef] [Green Version]
  11. Yan, Y.; Liu, Y.; Di, D.; Dai, C.; Li, J. Simplified chemical reaction mechanism for surrogate fuel of aviation kerosene and its verification. Energy Fuel 2016, 30, 10847–10857. [Google Scholar] [CrossRef]
  12. Yan, Y.; Liu, Y.; Fang, W.; Liu, Y.; Li, J. A simplified chemical reaction mechanism for two-component RP-3 kerosene surrogate fuel and its verification. Fuel 2018, 227, 127–134. [Google Scholar] [CrossRef]
  13. Ju, Y.; Sun, W. Plasma assisted combustion: Dynamics and chemistry. Prog. Energy Combust. 2015, 48, 21–83. [Google Scholar] [CrossRef]
  14. Starikovskaia, S.M. Plasma-assisted ignition and combustion: Nanosecond discharges and development of kinetic mechanisms. J. Phys. D Appl. Phys. 2014, 47, 353001. [Google Scholar] [CrossRef]
  15. Hu, E.; Huang, S.; Ku, J.; Huang, Z. Combustion characteristics of natural gas injected into a constant volume vessel. Fuel 2019, 235, 1146–1158. [Google Scholar] [CrossRef]
  16. Hu, E.; Ku, J.; Yin, G.; Li, C.; Lu, X.; Huang, Z. Laminar flame characteristics and kinetic modeling study of ethyl tertiary butyl ether compared with methyl tertiary butyl ether, ethanol, iso-octane, and gasoline. Energy Fuel 2018, 32, 3935–3949. [Google Scholar] [CrossRef]
  17. Li, X.; Hu, E.; Lu, X.; Huang, S.; Huang, Z. Experimental and kinetic study on laminar flame speeds of hexene isomers and n-hexane. Fuel 2019, 243, 533–540. [Google Scholar] [CrossRef]
  18. Lefkowitz, J.K.; Ombrello, T. An exploration of inter-pulse coupling in nanosecond pulsed high frequency discharge ignition. Combust. Flame 2017, 180, 136–147. [Google Scholar] [CrossRef]
  19. Moffett, S.P.; Bhanderi, S.G.; Shepherd, J.E.; Kwon, E. Investigation of Statistical Nature of Spark Ignition. In Proceedings of the Fall Meeting of the Western States Section of the Combustion Institute, Livermore, CA, USA, 16–17 October 2007. [Google Scholar]
Figure 1. Schematic diagram of the experimental apparatus.
Energies 14 06463 g001
Figure 2. Typical nanosecond discharge waveforms of voltage, current, power and energy for a single discharge, parameters set at 15 kV, 100 ns and 10 kHz.
Energies 14 06463 g002
Figure 3. Ignition probability versus number of trails.
Energies 14 06463 g003
Figure 4. Statistics of peak pressure at different steam concentrations.
Energies 14 06463 g004
Figure 5. Effects of initial pressure on the ignition probability. Tu = 413 K, ϕ = 0.7, ZH2O = 0%, ZO2 = 21%).
Energies 14 06463 g005
Figure 6. Effects of equivalence ratio on the ignition probability. (Tu = 413 K, pu = 0.3 atm, ZH2O = 0%, ZO2 = 21%).
Energies 14 06463 g006
Figure 7. Effects of steam concentration on the ignition probability. (Tu = 413 K, pu = 0.3 atm, ϕ = 0.8, ZO2 = 21%).
Energies 14 06463 g007
Figure 8. Effects of oxygen concentration on the ignition probability. (Tu = 413 K, pu = 0.3 atm, ϕ = 1.1, ZH2O = 0%).
Energies 14 06463 g008
Figure 9. Fitting results of ignition probability versus different initial conditions and ignition energy.
Energies 14 06463 g009
Figure 10. Comparison between the calculated results and the experimental results of MIE.
Energies 14 06463 g010
Figure 11. Fitting results of MIE under comprehensive conditions.
Energies 14 06463 g011
Table 1. Fitting parameters for different initial conditions.
Parameterβ1βxβ0Con
p−0.0373.0526.7900.040
ϕ−0.0153.7615.9830.500
ZH2O−0.261−8.2525.5580.400
ZO2−0.00135.0007.2210.090
Publisher’s Note: MDPI stays neutral with regard to jurisdictional claims in published maps and institutional affiliations.