1. Introduction
Rock salt deposits are used not only to exploit salt, but also to create underground caverns for various purposes. Essentially, the caverns can be divided into operating and storage caverns. The first of them is used for the exploitation of salt using the borehole method, the second for the storage of products such as hydrocarbons (crude oil, fuels) and gases (natural gas, hydrogen, and compressed air) [
1]. Caverns can also be used to store industrial or radioactive waste.
Canada is a pioneer in underground salt cavern storage, and in 1949 the first LPG storage was created in Texas (USA). In Europe, natural gas storage technology began in 1970, with salt caverns built in Kiel (Germany) and Etzel (France), [
2,
3]. Today, the largest number (360) of such facilities is in Germany [
4]. In Poland, there are currently 22 caverns for natural gas and 12 for crude oil, fuels and heating oil [
2,
5].
The capacities of the storage caverns built around the world are within various limits, from several thousand to several hundred thousand cubic meters. Most of the underground natural gas storage facilities are located in the United States, Canada, China, and Russia. The leading facilities in Europe are in Germany, France, and Great Britain [
2]. For example, in the storage of Etzel EKB, Etzel Crystal and Etzel there are 51 caverns with active storage capacities of 218 N million m
3, 1009 N million m
3 and 218 N million m
3, respectively (according to 2020 data), while in operational UGS in Denmark there are 7 storage caverns with a total working capacity of 447.3 N million m
3, belonging to Gas Storage Denmark, where the caverns are 300 m high and located at a depth of 950–1400 m below ground level. The variety of shapes and foundations of caverns and their volumes is diverse. The main determinant of chamber size, in addition to demand, is the availability of a salt deposit of appropriate quality and its thickness; the resulting maximum dimensions of the chamber enable its safe operation, due to its stability and tightness [
6]. The completion of such caverns, depending on the planned geometric volume and the available leaching medium stream (water), may take from several months to several years [
7].
Salt production caverns can be created in poorer quality salt deposits because their first purpose is to obtain brine; therefore, efforts are made to exploit the deposit as much as possible, while maintaining the appropriate protective pillars. Such caverns are operated for a very long time, even over a dozen years, due to the low leaching efficiency needed to obtain saturated brine and a very large salt interval: sometimes over 1500 m.
Both the storage and production caverns have been leached in the same way for decades. In the leaching process, water is pumped through the well and semibrine is collected. For this purpose, the opening is provided by two free-hanging columns of leaching pipes. The method of leaching has been improved over the years, but its essential process has not changed [
8,
9,
10].
In 2019, a numerical model and a programme for the development of gas storage caverns in salt deposits using two-well horizontal leaching (TWH, two-well horizontal, and TWV, two-well vertical) were developed in China, proposing a different approach from the conventional one used so far; a model with one leach well and oil insulation. This innovative approach with the use of two leaching wells was used in practice during the construction of caverns in Manosque (France) in 2010 and Zuidwending in the Netherlands in 2011 [
11,
12].
The chamber leaching programmes have changed and evolved to achieve the best possible results. The leaching programme consists of parameters such as the water injection efficiency, the foundation of the leach pipes, the level of insulation, and the concentration of the leaching medium. Appropriate control of these parameters allows for the best implementation of the purpose for which the chamber is created.
The long-term geomechanical stability of the designed storage caverns creates the need to improve the criteria of stability, strength, and adjust parameters at the design stage so that the cavern is created relatively quickly and fulfils its tasks with the best possible efficiency. The stability of the cavern is directly dependent on the shape that it forms during the leaching process [
13,
14]. Additionally, the deformation of the terrain above the underground gas storage facilities located in salt caverns strongly depends on their shape and volume [
15]. Two major improvements that have been applied to chamber leaching are the use of echometric measurement results and numerical modelling that simulates the leaching process in WinUbro or SSCLS software. Thanks to the echometric measurements, it is possible to check whether the chamber develops in accordance with the adopted assumptions. Computer simulations allow the design of the leaching programme prior to the start of the leaching process and its correction while it is running [
12,
16,
17]. In a more advanced stage of leaching a dissolution rate may be controlled by the modelling and analysis of fluid flow velocity and its density changes, [
18].
The Communication of the European Commission, 2020, and the draft of the Polish Hydrogen Strategy show that the hydrogen economy will be one of the main elements of energy transition and a way to reduce pollutant emissions. The main emphasis is on the production of “pure” or green hydrogen, i.e., hydrogen that is obtained from renewable sources. Such sources, however, do not produce constant amounts of electricity, that is essential for hydrogen obtained in the electrolysis process. Thus, the main problem of pure hydrogen is its proper storage, and for this purpose, underground salt caverns seem to be the most appropriate. The density of energy storage in the form of hydrogen in salt caverns is the highest compared to other methods of its storage (pumped storage, compressed air, etc.) [
19].
According to the data on underground storage, derived from the annual reports of the CEDIGAZ organization, there is a continuous increase in the demand for the storage of various utilities. In 2019 to 2020, there was a dynamic development of the situation in the gas markets, caused by a sharp oversupply related mainly to the COVID-19 pandemic, as well as a huge increase in LNG supplies from the United States. Last year also highlighted the fundamental importance of Europe’s underground gas storage facilities, supported by Ukrainian storage facilities, which helped to balance the world markets. Although UGS have developed mainly in North America, Europe, and the Commonwealth of Countries, China is now also on track to develop underground storage facilities. Additionally, Russia, although it is the second largest holder of storage capacity in the world, continues to develop its storage infrastructure to serve both domestic and export markets [
20].
At the end of 2019, there were 661 UGS in the world with a storage capacity of 442 billion m3, an increase of 0.9% compared to the end of 2018. Storage facilities in depleted natural gas deposits are dominant, accounting for 80% of the global volume, while salt caverns use 26% of the global supply. At the end of 2019, 58 units were under construction (new facilities and extensions to existing ones), adding 41 bcm to the active gas volume. Investments in this direction are starting in new and developing gas-consuming countries (China currently has 41% of the global potential to build UGS). At the end of 2019, 97 projects were identified at various planning stages, and if all were completed, they would provide an additional 82 bcm of working storage capacity), [
20].
Of course, underground storage in salt caverns will be a key solution in the near future for storing hydrogen, which is to be the fuel of the future and enable energy transformation in Europe, in accordance with the assumptions of the European Green Deal [
3,
21].
One of the important critical phases of the borehole leaching technology takes place at the very beginning of this process when the diameter of the completed production borehole is relatively small when compared to the target diameter of the cavern, resulting in the very limited contact of water with the rock surface. Furthermore, the descending insoluble parts occupy the bottom of the borehole and stop widening the leaching space. In the case of high caverns this kind of technology is usually preceded by leaching the so-called initial cavern (or cavern base) of the target diameter of the final cavern, but at a much lower level. The goal of the novel technology analysed in the article is to speed up this phase by preconditioning the rock mass by cutting a niche with the high-pressure water jet (one day), immediately after the borehole is finished and ready for conventional leaching. The effect of this operation dramatically increases the water/rock contact surface, accelerates the production of the industrial brine in the beginning of the process, and eliminates the inconvenience mentioned above.
2. The Method of Leaching of Salt Storage Caverns
An alternative method of mining salt deposits, compared to the rock-blasting technique and mechanical excavating, is the leaching technique, which uses the easy solubility of salt in water. Fresh water is introduced into the deposit through deep wells, reaching a depth of below 1000 m, which, due to contact with the salt rock medium, causes the formation of brine for a sufficiently long time, which is used after pumping it up to the surface. As a result of the implemented technology, underground caverns are created, which can remain filled with brine to ensure their geomechanical stability or can be used to store various products (fuels, gases, and waste, etc.) introduced in place of this brine.
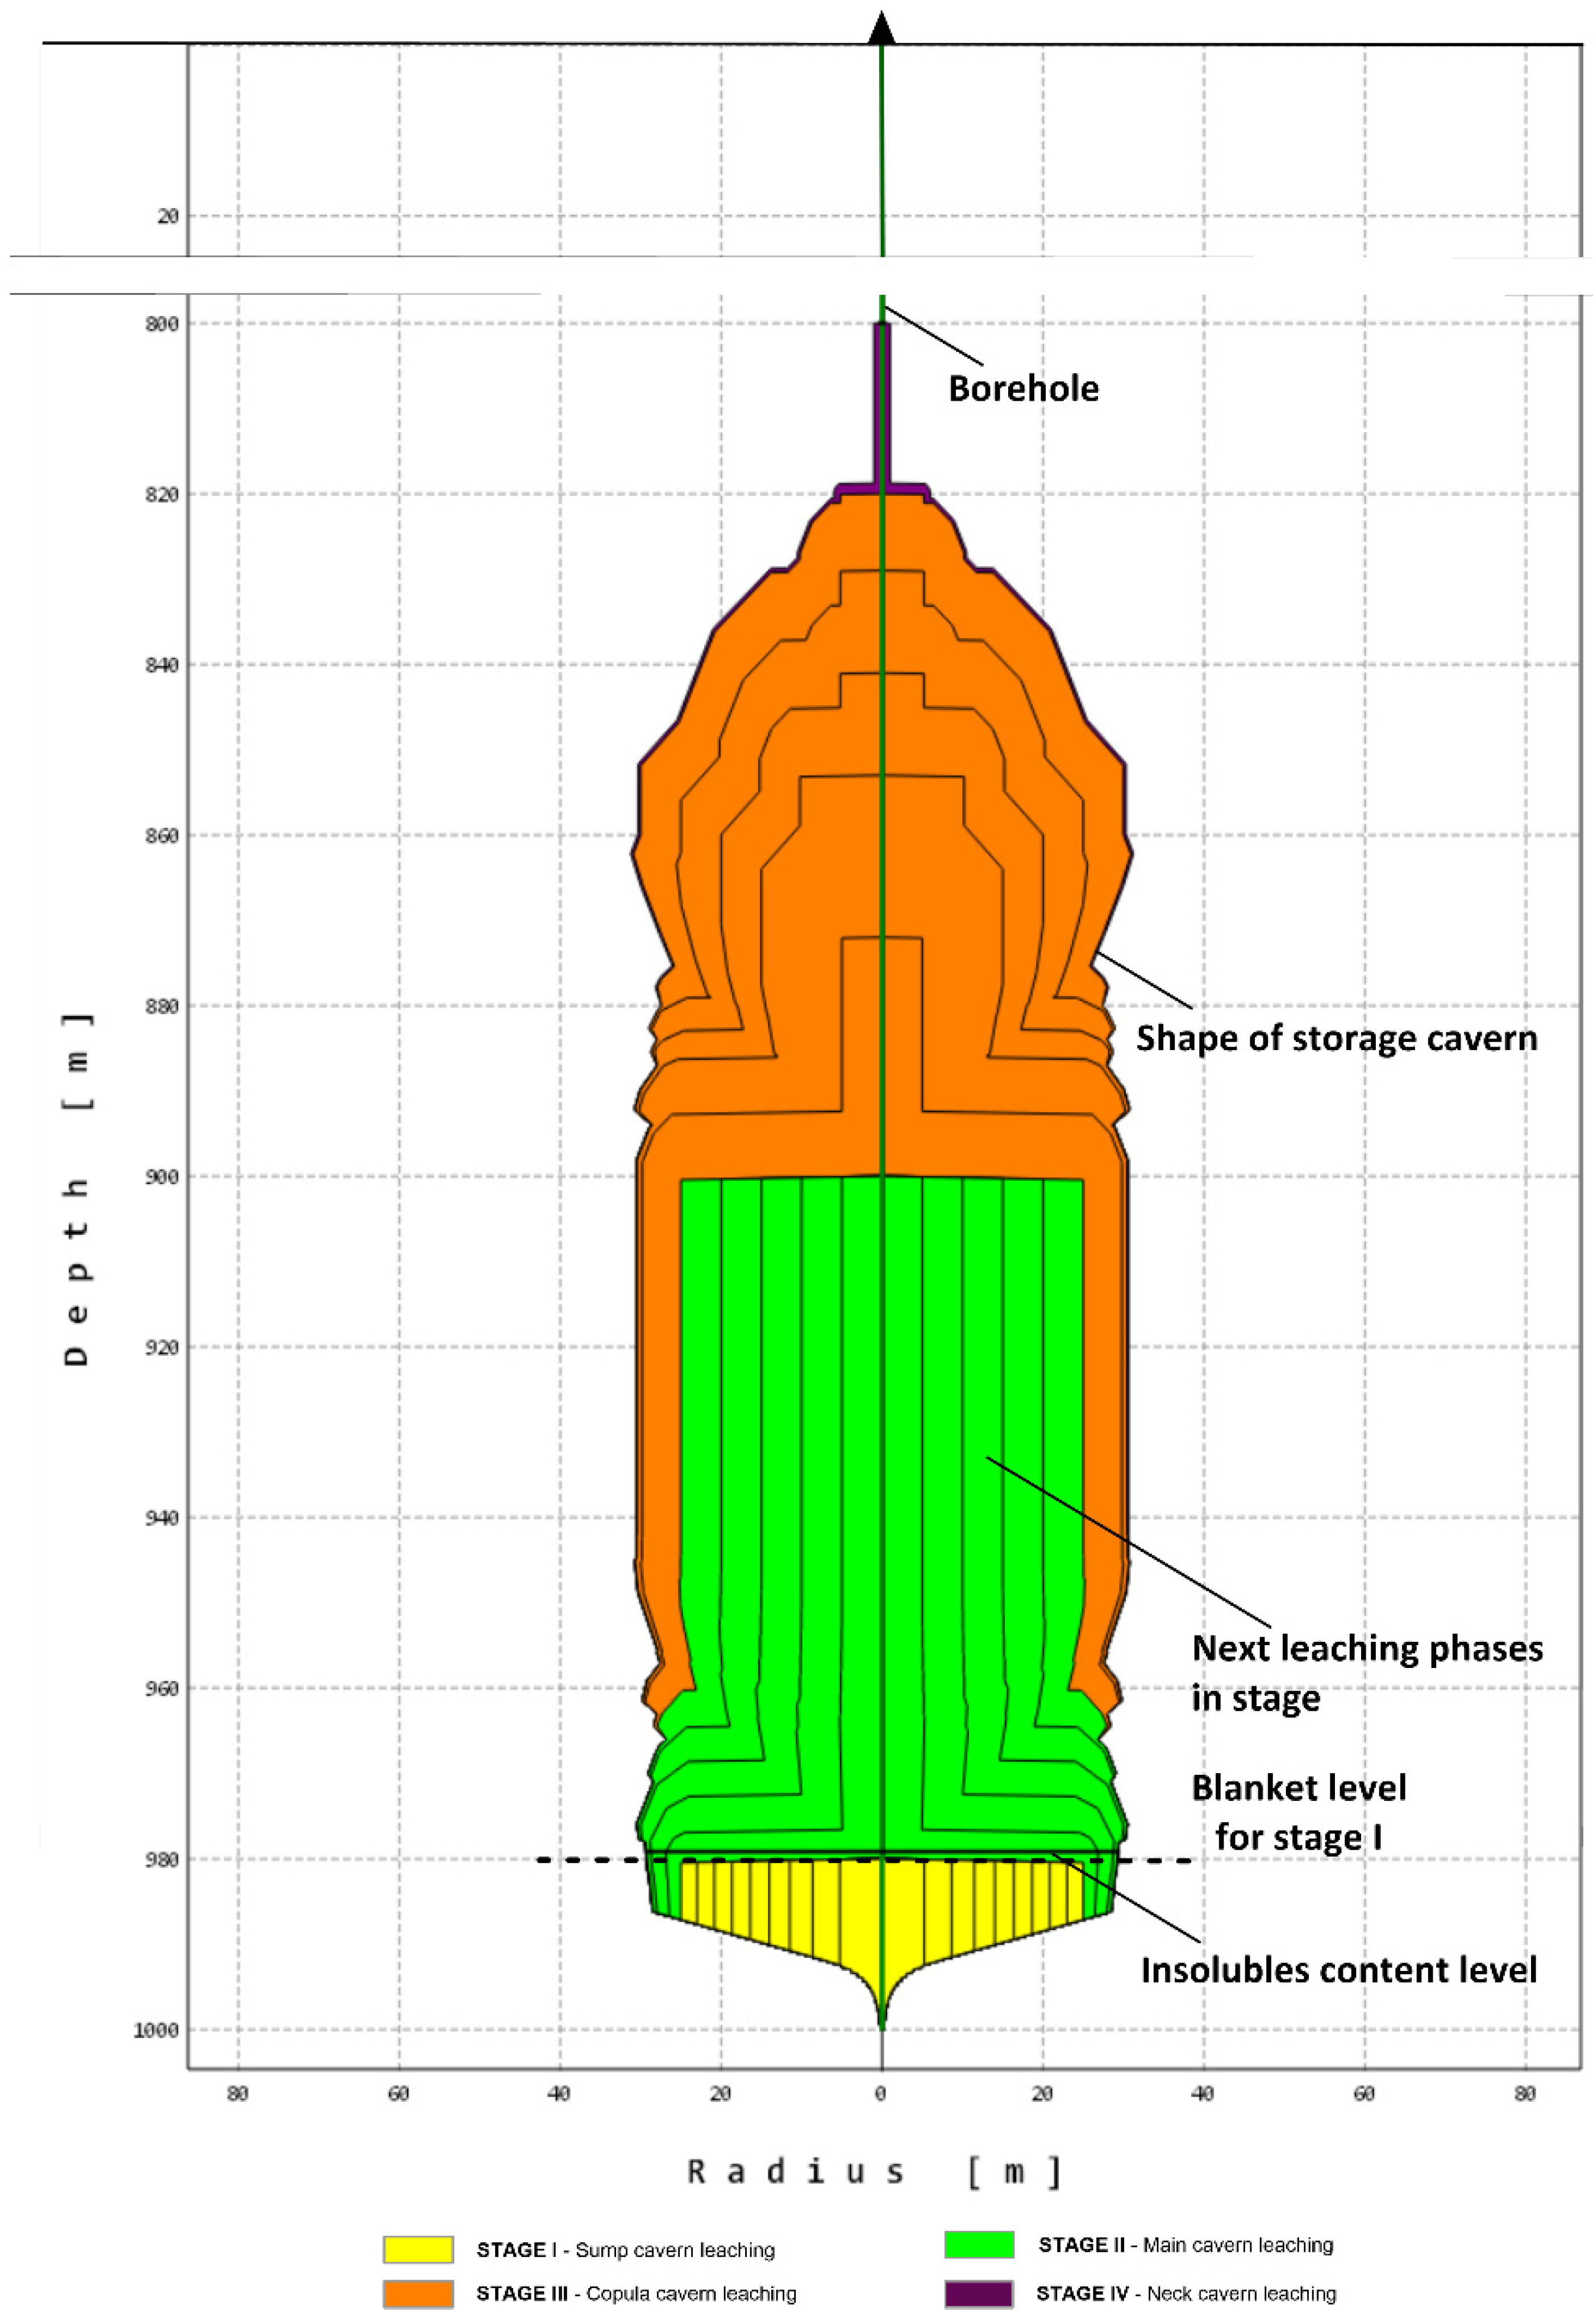
The classic storage cavern leaching programme consists of four characteristic stages, each of which develops in different phases.
Stage I concerns the deepest part of the chamber, in which the necessary space (sump) should be prepared, in which insoluble parts of rock salt can accumulate. The proper preparation of this stage determines the final shape of the chamber, and thus its target capacity.
The second stage of leaching is the basic process for creating the chamber, for which its target shape and storage capacity are obtained. This stage usually consists of several phases which result from the need to manoeuvre the leaching pipes to obtain the designed shape of the chamber. The time between successive phases is used to perform echometric measurements of the shape of the chamber, allowing the process to be better controlled and to adjust the parameters of the subsequent phases and stages of the leaching programme.
Stage III is the leaching of the chamber dome, which should have a shape that ensures the geomechanical stability of the newly created underground excavation. Depending on the programme adopted, the leaching stage may be performed partially for the already leached chamber in an earlier stage or directly afterwards. In the gas storage caverns, the volume of the dome is included in the working volume. In the liquid product compartments, only part of it is included in the working capacity, while the remainder in the dome is “frozen”.
The last IV stage of the storage chamber leaching is the connection of the chamber dome with the so-called “shoe” of the last cemented column of casing pipes, the so-called “neck” stage. It has the shape of a cylinder with a diameter of no more than 1–2 m. Its task is to protect the “shoe” of a column of pipes against excessive stress occurring at this site in the salt rock mass.
In practice, the effectiveness of individual stages is very varied and depends on the structure, geological variability, salt solubility, and insoluble matter content, as well as the size and type of contact surface with the leaching medium.
The subject of this research is to analyse the possibility of increasing the speed of creating the caverns and obtaining the most desired shape, which, according to the authors, can be achieved by modifying the leaching technology by creating additional contact surfaces, which can be obtained by creating one or several niches in the walls of the well transverse to its axis [
7].
3. Numerical Model of the Modified Leach Plant
The
3-D Ubro 4 software, based on the WinUbro algorithm [
22] is applied to the model the well-leaching technology, which allows for the analysis of the development of asymmetric salt caverns made from vertical boreholes in the rock salt deposits, allowing the current volume increments of caverns, radii at specific depths, concentration, and the quantity of brines obtained at a specific time, to be tracked, with the possibility of graphical and tabular data presentation. This programme is the most famous and widely used, not only in Poland but also in China, Thailand, the USA, and Canada. It is another implementation of the UBRO algorithm differing from previous versions, with a more modern interface and a different source language. A comparison of the previous implementation (WinUbro = Software B) with field data (SMRI benchmarks) and four other simulation programmes (SalGas, SimLess, Prosacav, Sansmic) was presented at SMRI conferences in Porto and Austin [
23]. A detailed description of the algorithm is provided by [
24].
Based on the experience to date [
25] and preliminary laboratory tests [
7,
26], it is expected that the modification of the well by creating a niche in the side surface may have the greatest impact on improving the efficiency of leaching caverns, especially in Stage I of the technology. It is also possible to apply the proposed method to other leaching steps and phases, which will be the subject of further studies.
To determine the effectiveness of the new modified leaching technology and to compare its effects with the classical method (without a niche), numerical models were built covering all stages of the technology, according to the two indicated scenarios. Detailed research was conducted for stages I and II,
Table 1. According to our preliminary numerical simulations, substantial improvements of the leaching results (faster industrial brine production) in the modified technology are clear and visible only in stages I and II; therefore, we refrained from testing the next stages. The relatively small niche, cut with a water jet, may be neglected in a much larger cavern.
3.1. Technical Assumptions and Geological Conditions
For the simulation tests, assumptions were made, resulting from the technical conditions of the leaching technologies used so far in Poland, for the geological and mining conditions that can be expected in the Damasławek salt dome. This salt dome is one of the largest in Poland, located in the Zechstein salt formation, covering 60% of the country [
27,
28]. Detailed values are presented in
Table 2.
The Damasławek salt dome is located in the Kuyavian-Pomeranian Voivodeship in Żnin County, Janowiec Wielkopolski, and Żnin Commune. It is located approximately 5 km east of the town of Damasławek.
The Damasławek deposit was documented in category C2 in 1983 [
29]. The current state of the geological diagnosis of the dome can be treated as preliminary and requires a more detailed diagnosis. In November 2013, a license for the exploration of rock salt deposits was granted in the Damasławek ditch—License No. 33/2013/p—OGP Gaz System S.A. Under this license, two deep drillings were carried out in the central part of the dump, on the basis of which new geological documentation will be prepared.
The horizontal plan of the salt dome has a shape similar to an ellipse with an area of approximately 13 km
2 (measured at a depth of 650 m below ground level), the longer axis of which is approximately 5.5 km long, and the shorter one approximately 3.5 km [
29]. In the vertical section, the dome has the shape of a column piercing completely through the Mesozoic formations, with an inclination in the SW direction.
The salt series of the dome is made up of evaporates belonging to the Zechstein salt formation. Rock salts found in the profiles of holes below the salt mirror are recognized as: older salts (Z2), younger salts (Z3), and youngest salts (Z4). The salt mirror is found in exploratory wells at a depth of 446 m to 497 m below sea level. Above it, there is a gypsum-anhydrite-clay cap with thickness ranging from 84 to 294 m [
29]. The internal structure of the dome has been identified only to a small extent; only a small interval in the depth range from 102 m (IG-12) to 180 m (IG-2) below the salt mirror was identified, only the upper part of the salt trunk. Construction of the deposit at greater depths, where it is possible to locate storage caverns, based on the knowledge of the geological structure of this type of deposit in Poland, should not be less successful than in other domes such as Mogilno or Kłodawa [
28].
The roof of the storage cavern is probably located within the range of 700–1400 m below sea level. The most convenient area for the location of storage cavern is the central part of the dome, within which are the best-quality older salts, characterized by good leaching parameters, the best for exploitation in this area. They are represented by medium- and coarse-grained salts, sometimes fine-crystalline, white, light gray, and grey, with crystal salt conglomerations. These salts are contaminated with clay, pieces of clay-salt breccia nature, and anhydrite crumbs, with the occasional occurrence of potassium-magnesium salt. The presence of older salts is found in the eight wells IG-1, IG-2, IG-3, IG-5, IG-6, IG-7, IG-9, IG-12. The highest mean NaCl content in salt rock is recorded in the IG-12 well (97.7%); the lowest in the IG-3 well (93.4%) [
29].
The location of the storage caverns at Damasławek dome is also supported by the fact that the construction of a cavern gas storage facility is planned for the same location [
30]. This investment offers hope to test the results of the presented technology under in situ conditions.
3.2. The Leaching Algorithm
The rate of leaching, understood as the rate at which the front of the leaching surface moves deeper into the salt rock, depends on [
16]:
Current brine concentration;
Angle of inclination of the salt wall;
Temperature of the leaching medium;
Type of salt rock under leaching.
The first three relationships are relatively well-described with appropriate mathematical formulas, whereas the effect of the type of leached salt is empirically determined in laboratory conditions on salt rock samples taken from the studied deposit.
Simulations of the leaching process with the determination of the progressive development of the shape of selected stages of the cavern leaching are carried out using the Ubro 4 programme [
16,
23], in which the following relationships are used:
after taking into account that β = 0.0262 for the salt dome, for T
0 = 20 °C. Transforming the formula, we get the relationship:
where:
—leaching rate progress (m/s);
β—temperature coefficient, (°C−1);
—leaching rate for fresh water, (mm/h);
—horizontal and vertical leaching rate, (mm/h);
—inclination of leaching surface at respective depth h, (-);
T—brine temperature in the cavern (°C);
T0—brine temperature in the cavern, for which β is determined in laboratory;
CN(T)—concentration of saturated brine in temperature T, (kg/m3);
C(h)—concentration of leaching brine at depth h, (kg/m3).
4. Results of the Numerical Simulation of the Leaching Technology of a Storage Chamber
The constructed numerical model of the salt cavern leaching technology refers to the Damasławek salt dome facility,
Figure 1 and covers all its stages and phases,
Figure 2. As soon as the well reaches its target depth, the sump creation process begins (Stage I). In the first phase of this stage, the contact of the solvent (fresh water that morphs into brine over time as a result of increasing amounts of dissolved salt) is limited only to the relatively small vertical surface of the well, which is associated with a slow increase in the concentration of the brine obtained in this phase.
The leaching of the sump (Stage I) takes place with the use of an insulating layer limiting upward development of this space, forcing it to expand in successive phases in the perpendicular direction “from” the axis of the well. After reaching the target size of the sump, Stage II begins.
In this case, the successive phases of cavern volume develop both perpendicularly, “away” from the borehole axis, and upward. The sump is also widened to a small extent. A similar situation takes place in stage III of the dome leaching, but in this case, in addition to the development of the cavern in the place above the one already leached in the previous stage, there is a relatively small expansion of this part:
Figure 2 (green + orange). Stage IV, the last stage, is leaching of the cavern “neck” (the last section of the well), which consists of slowly widening the diameter of the well to its final value.
Table 3 presents the results of the simulation calculations concerning the course of the simulation of the classic process of a storage cavern.
In terms of potentially increasing the effectiveness of the technology of creating the caverns, the first two stages, I and II, are the most important. These stages were analysed in two completed scenarios.
4.1. Scenario S1—Classic
4.1.1. Stage I—Sump Leaching
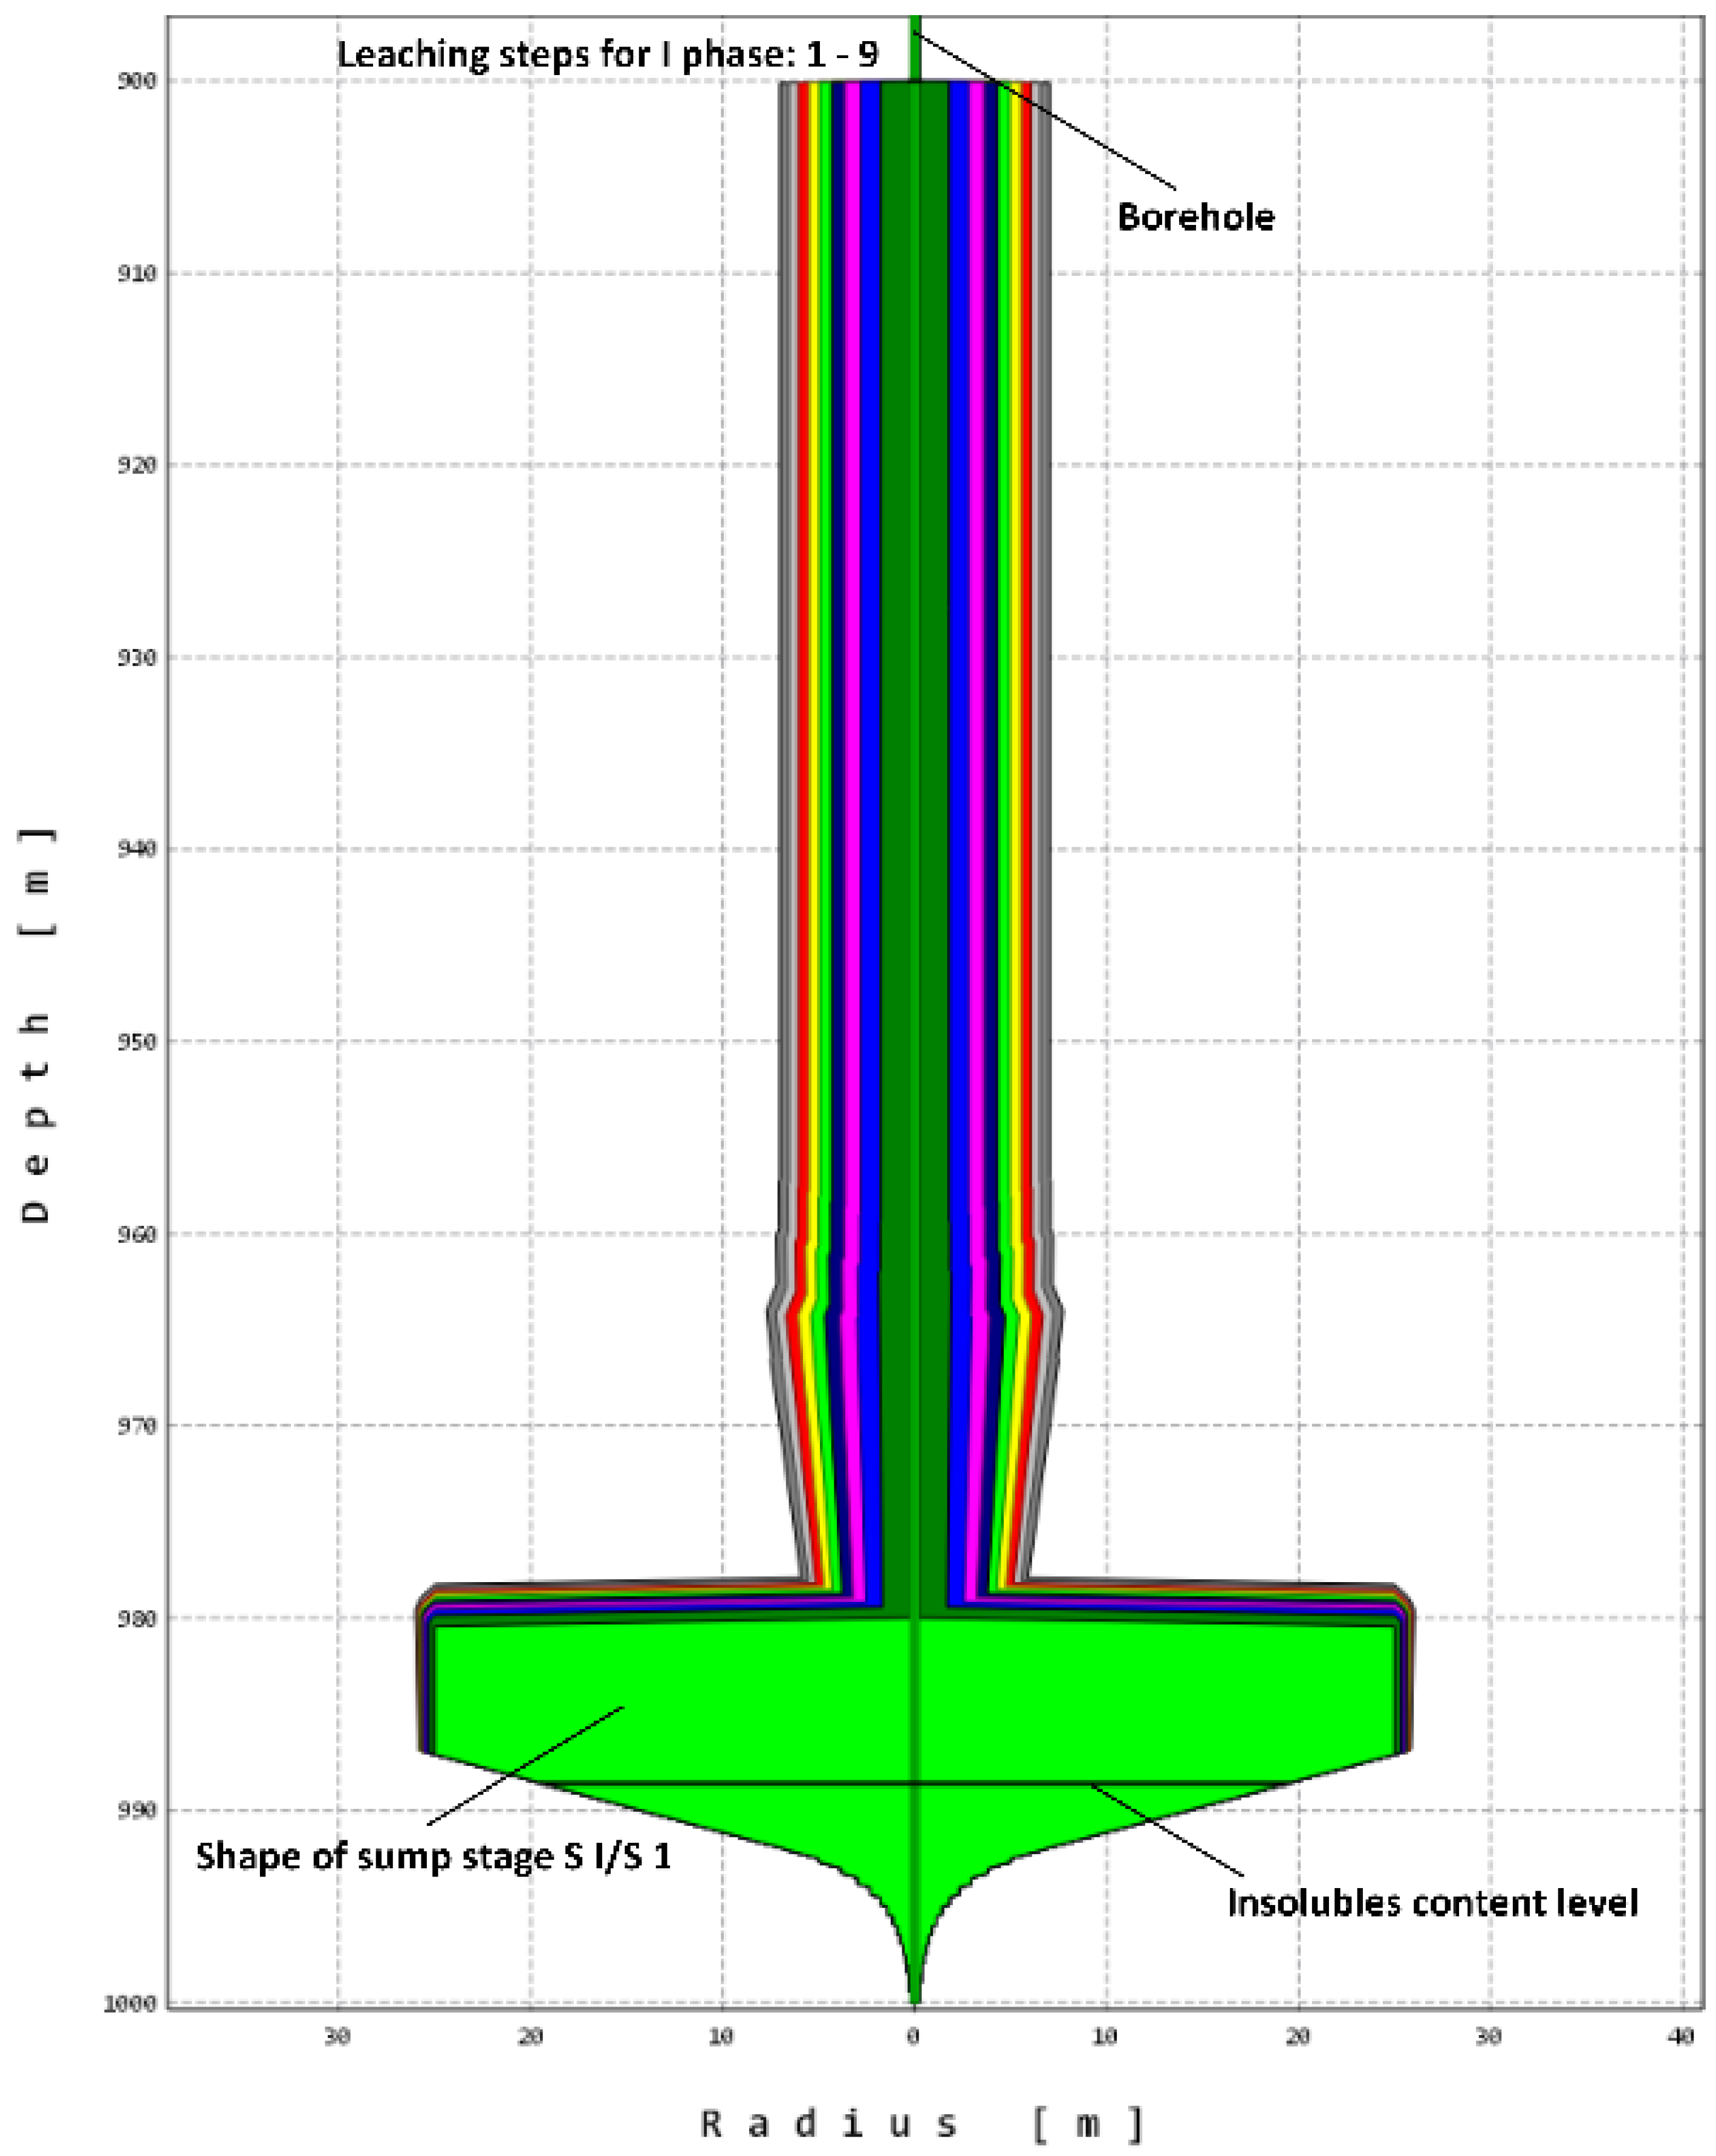
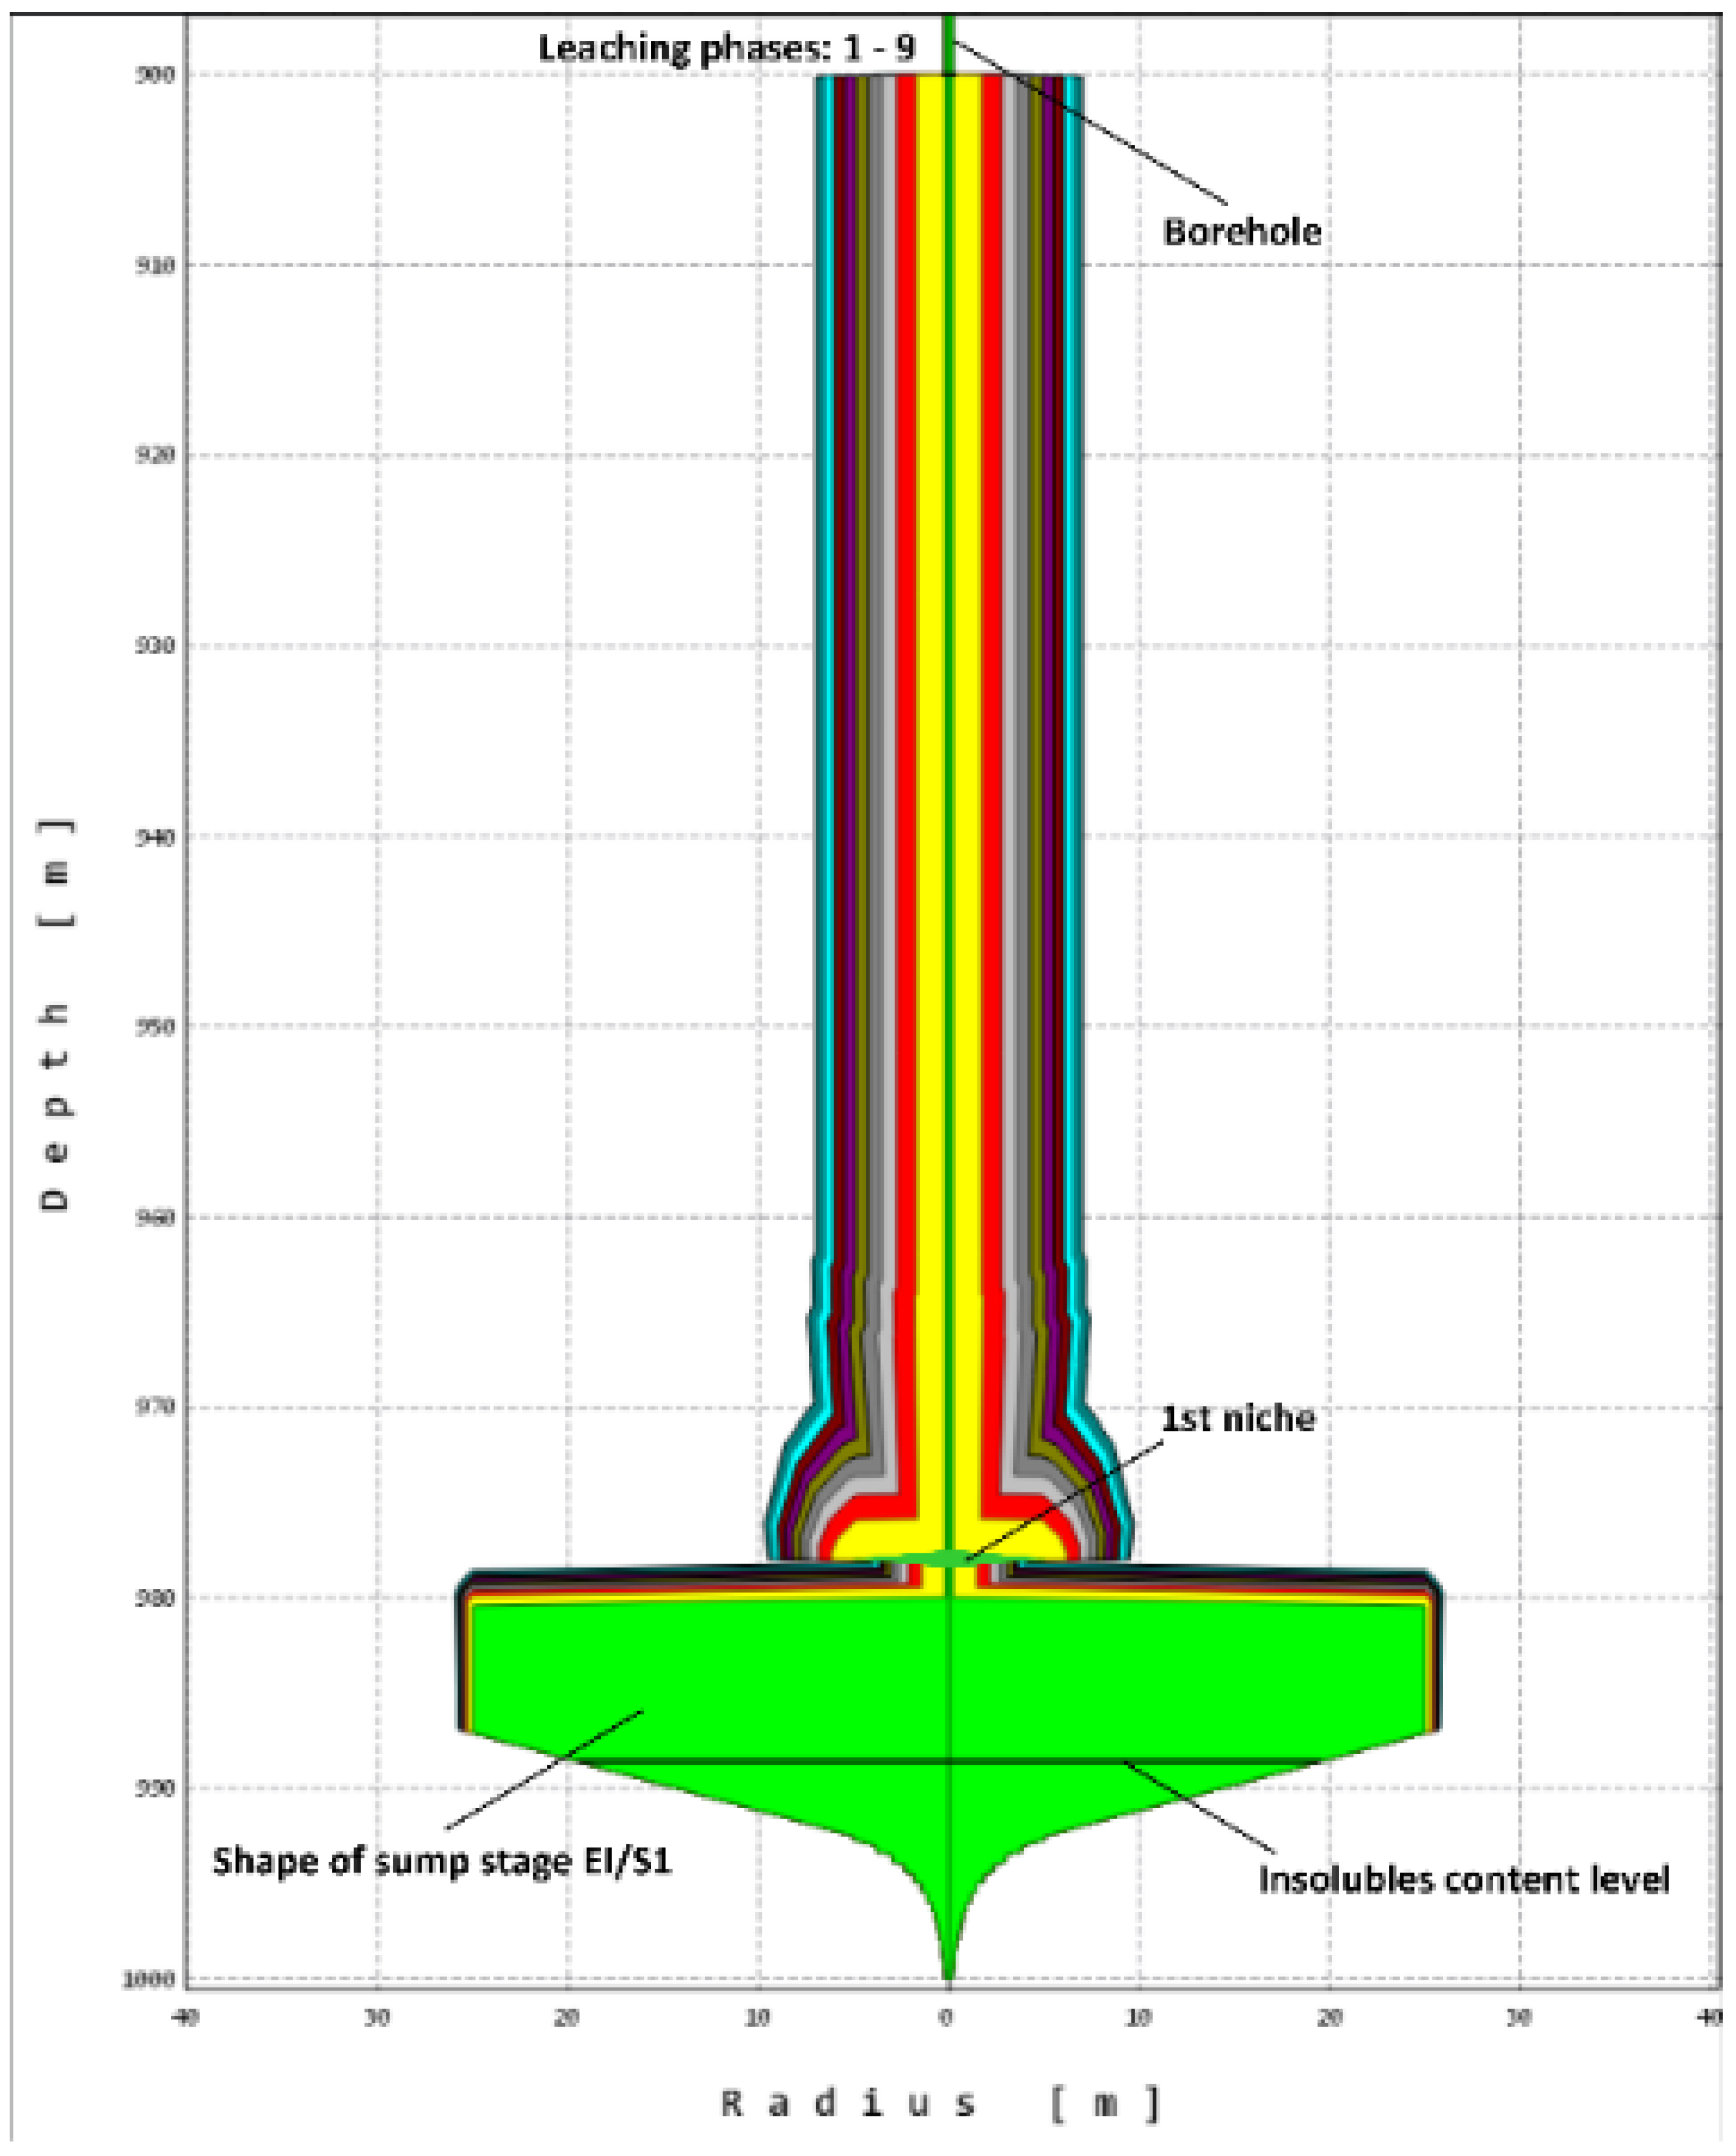
The first stage of leaching is to create a sump to facilitate the commencement of the production of the main cavern and, consequently, to obtain a specific shape in accordance with the design and the expected capacity. The experience gained so far (using the classic method) and the simulations performed show, in
Figure 3, that the sump widening occurs regularly along its entire assumed height, only as a result of lateral leaching (caused by insulation from the roof). With some simplification, it can be assumed that the final obtained shape of the sump is limited from the top by the plane, the sides of the cylinder parallel to the axis of the well, and from the bottom with the cone pointing downward, which results from the gravitational flow of water/brine to the lowest point of the well. In addition, insoluble parts accumulate in the lowest part of the cone (apex). Detailed data on the characteristic parameters of the process at this stage are summarized in
Table 4.
4.1.2. Stage II—Main Chamber Leaching
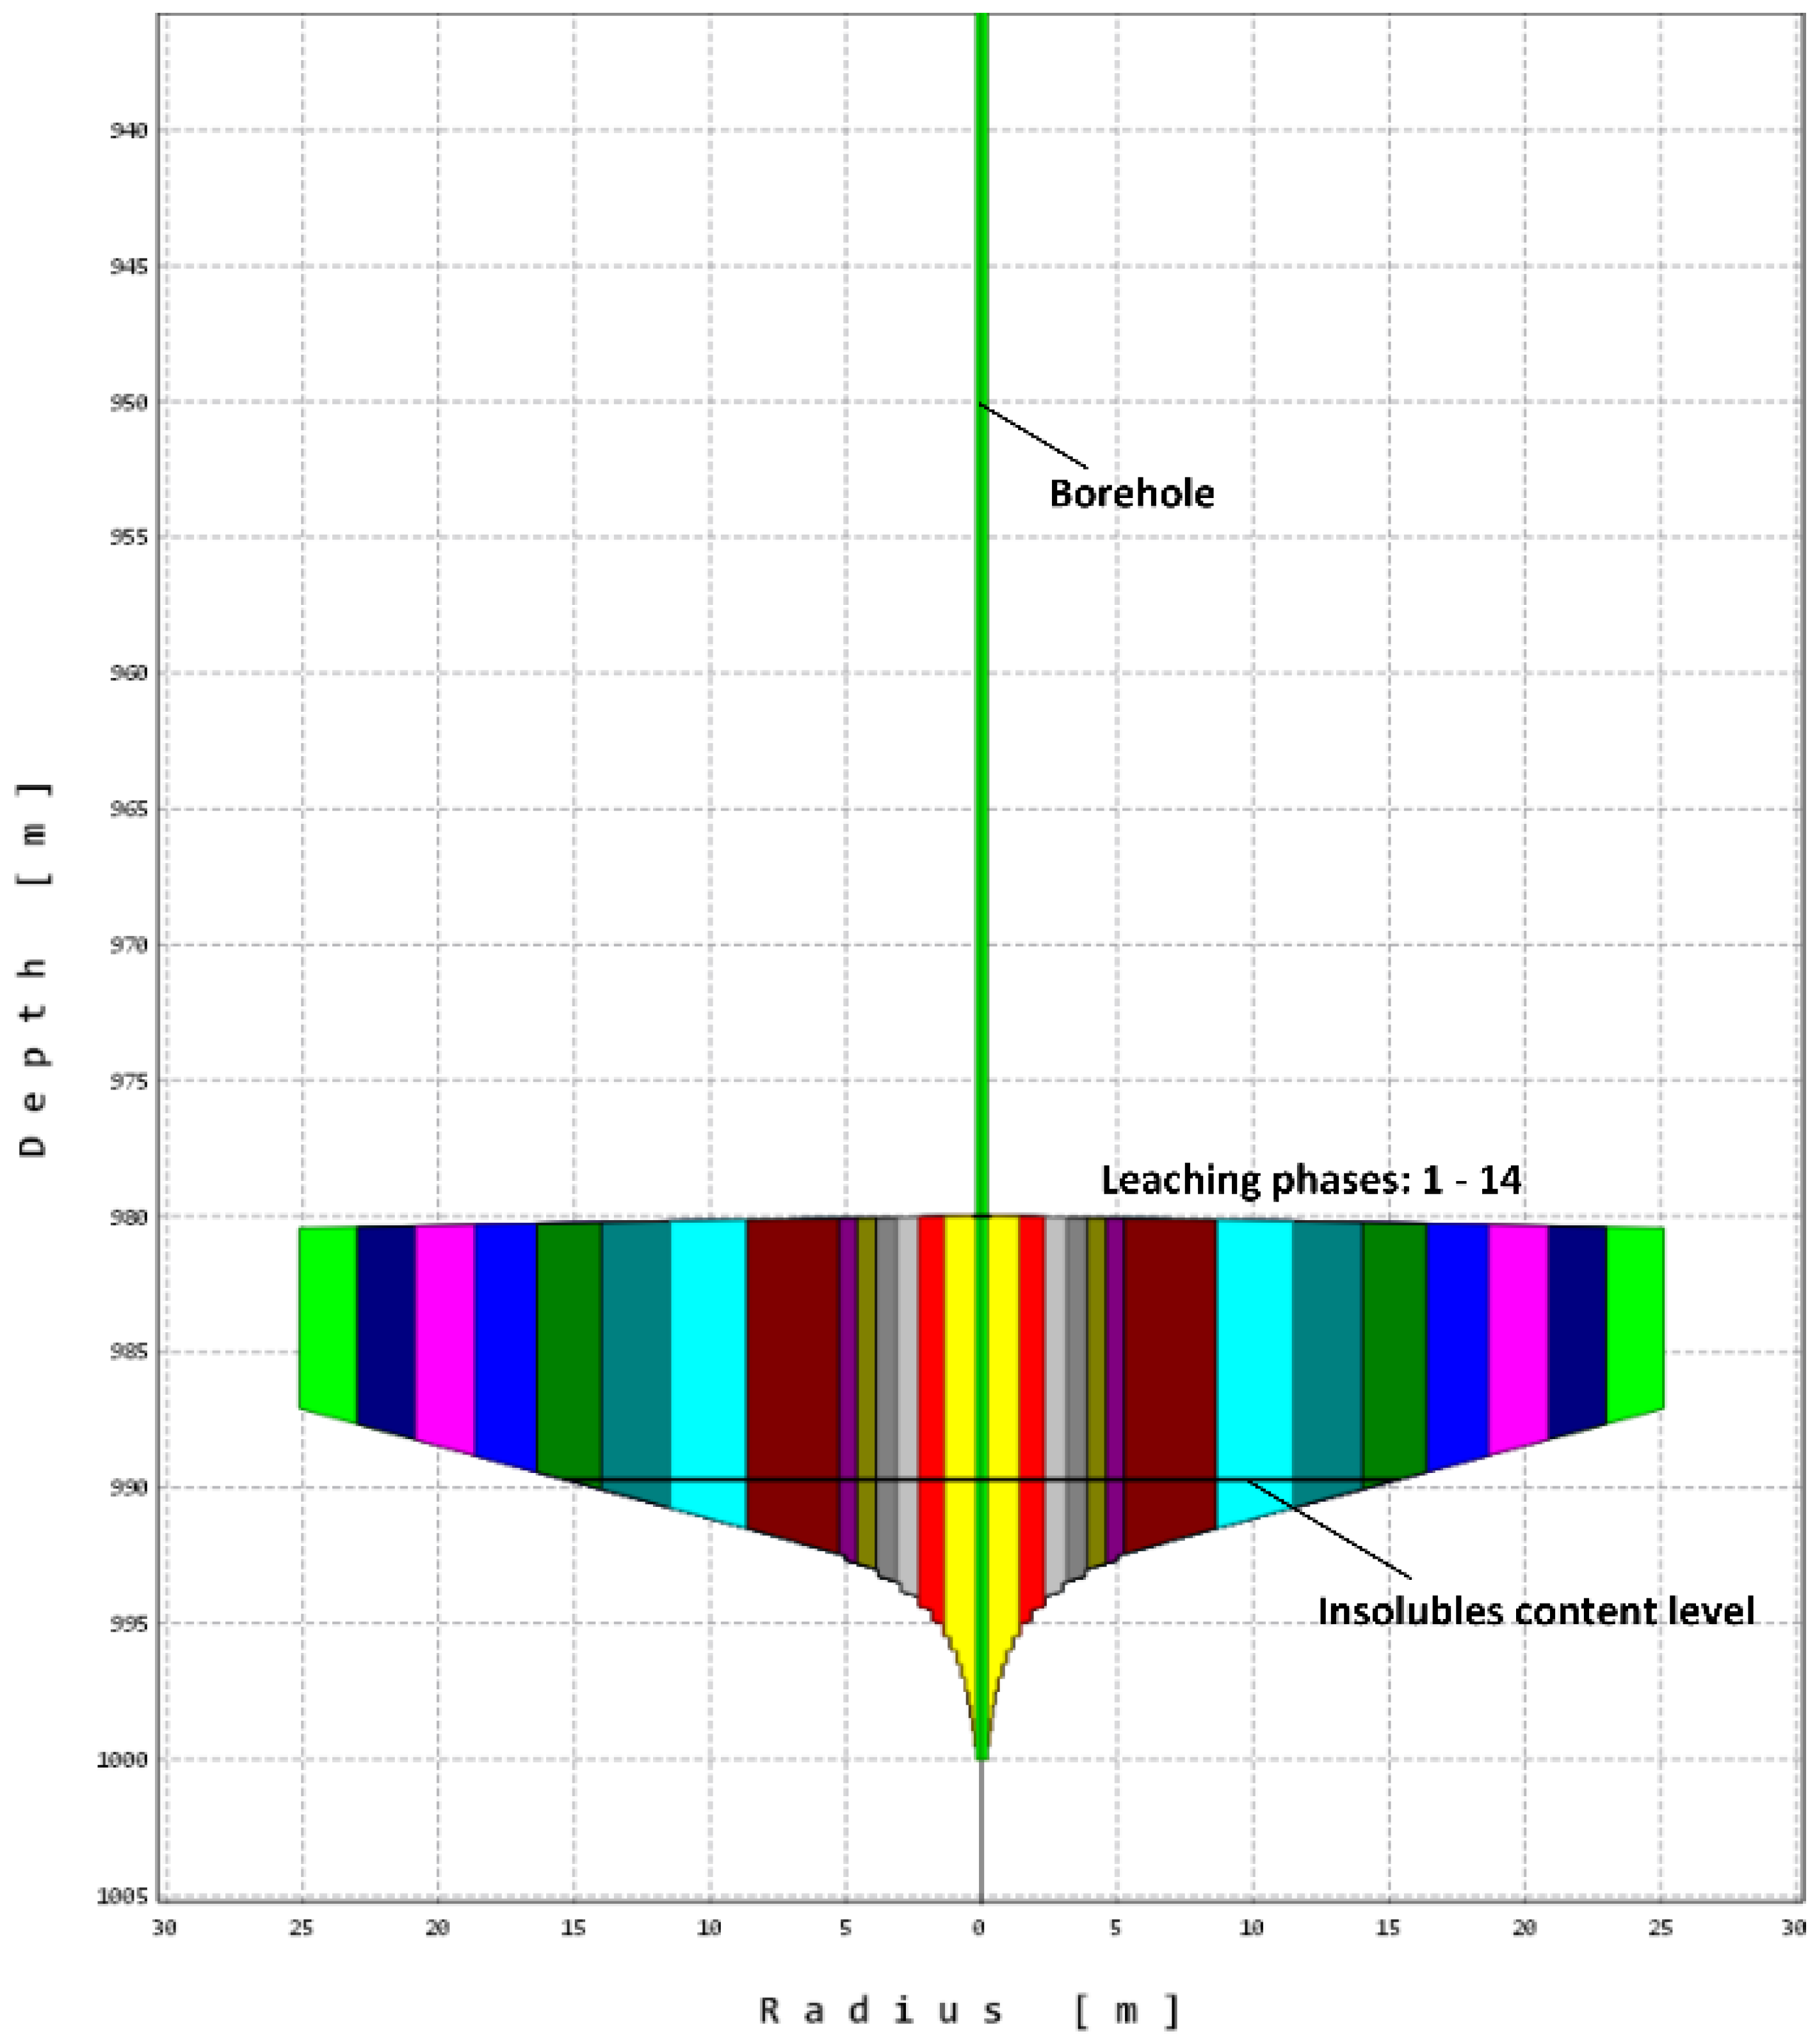
After reaching the designed shape of the sump, the second stage of leaching takes place in order to leach the main cavern. In this case, we are dealing not only with lateral leaching as before but, above all, with overhead leaching, which is a more efficient process. The increments in the subsequent steps for Phase I are shown in
Figure 4. As mentioned above, this stage also causes a slight widening of the previously made sump. Leaching intensity and other technological parameters are summarized in
Table 5.
4.2. Scenario S2—Leaching after Prior Preparation of the Niche Preparation
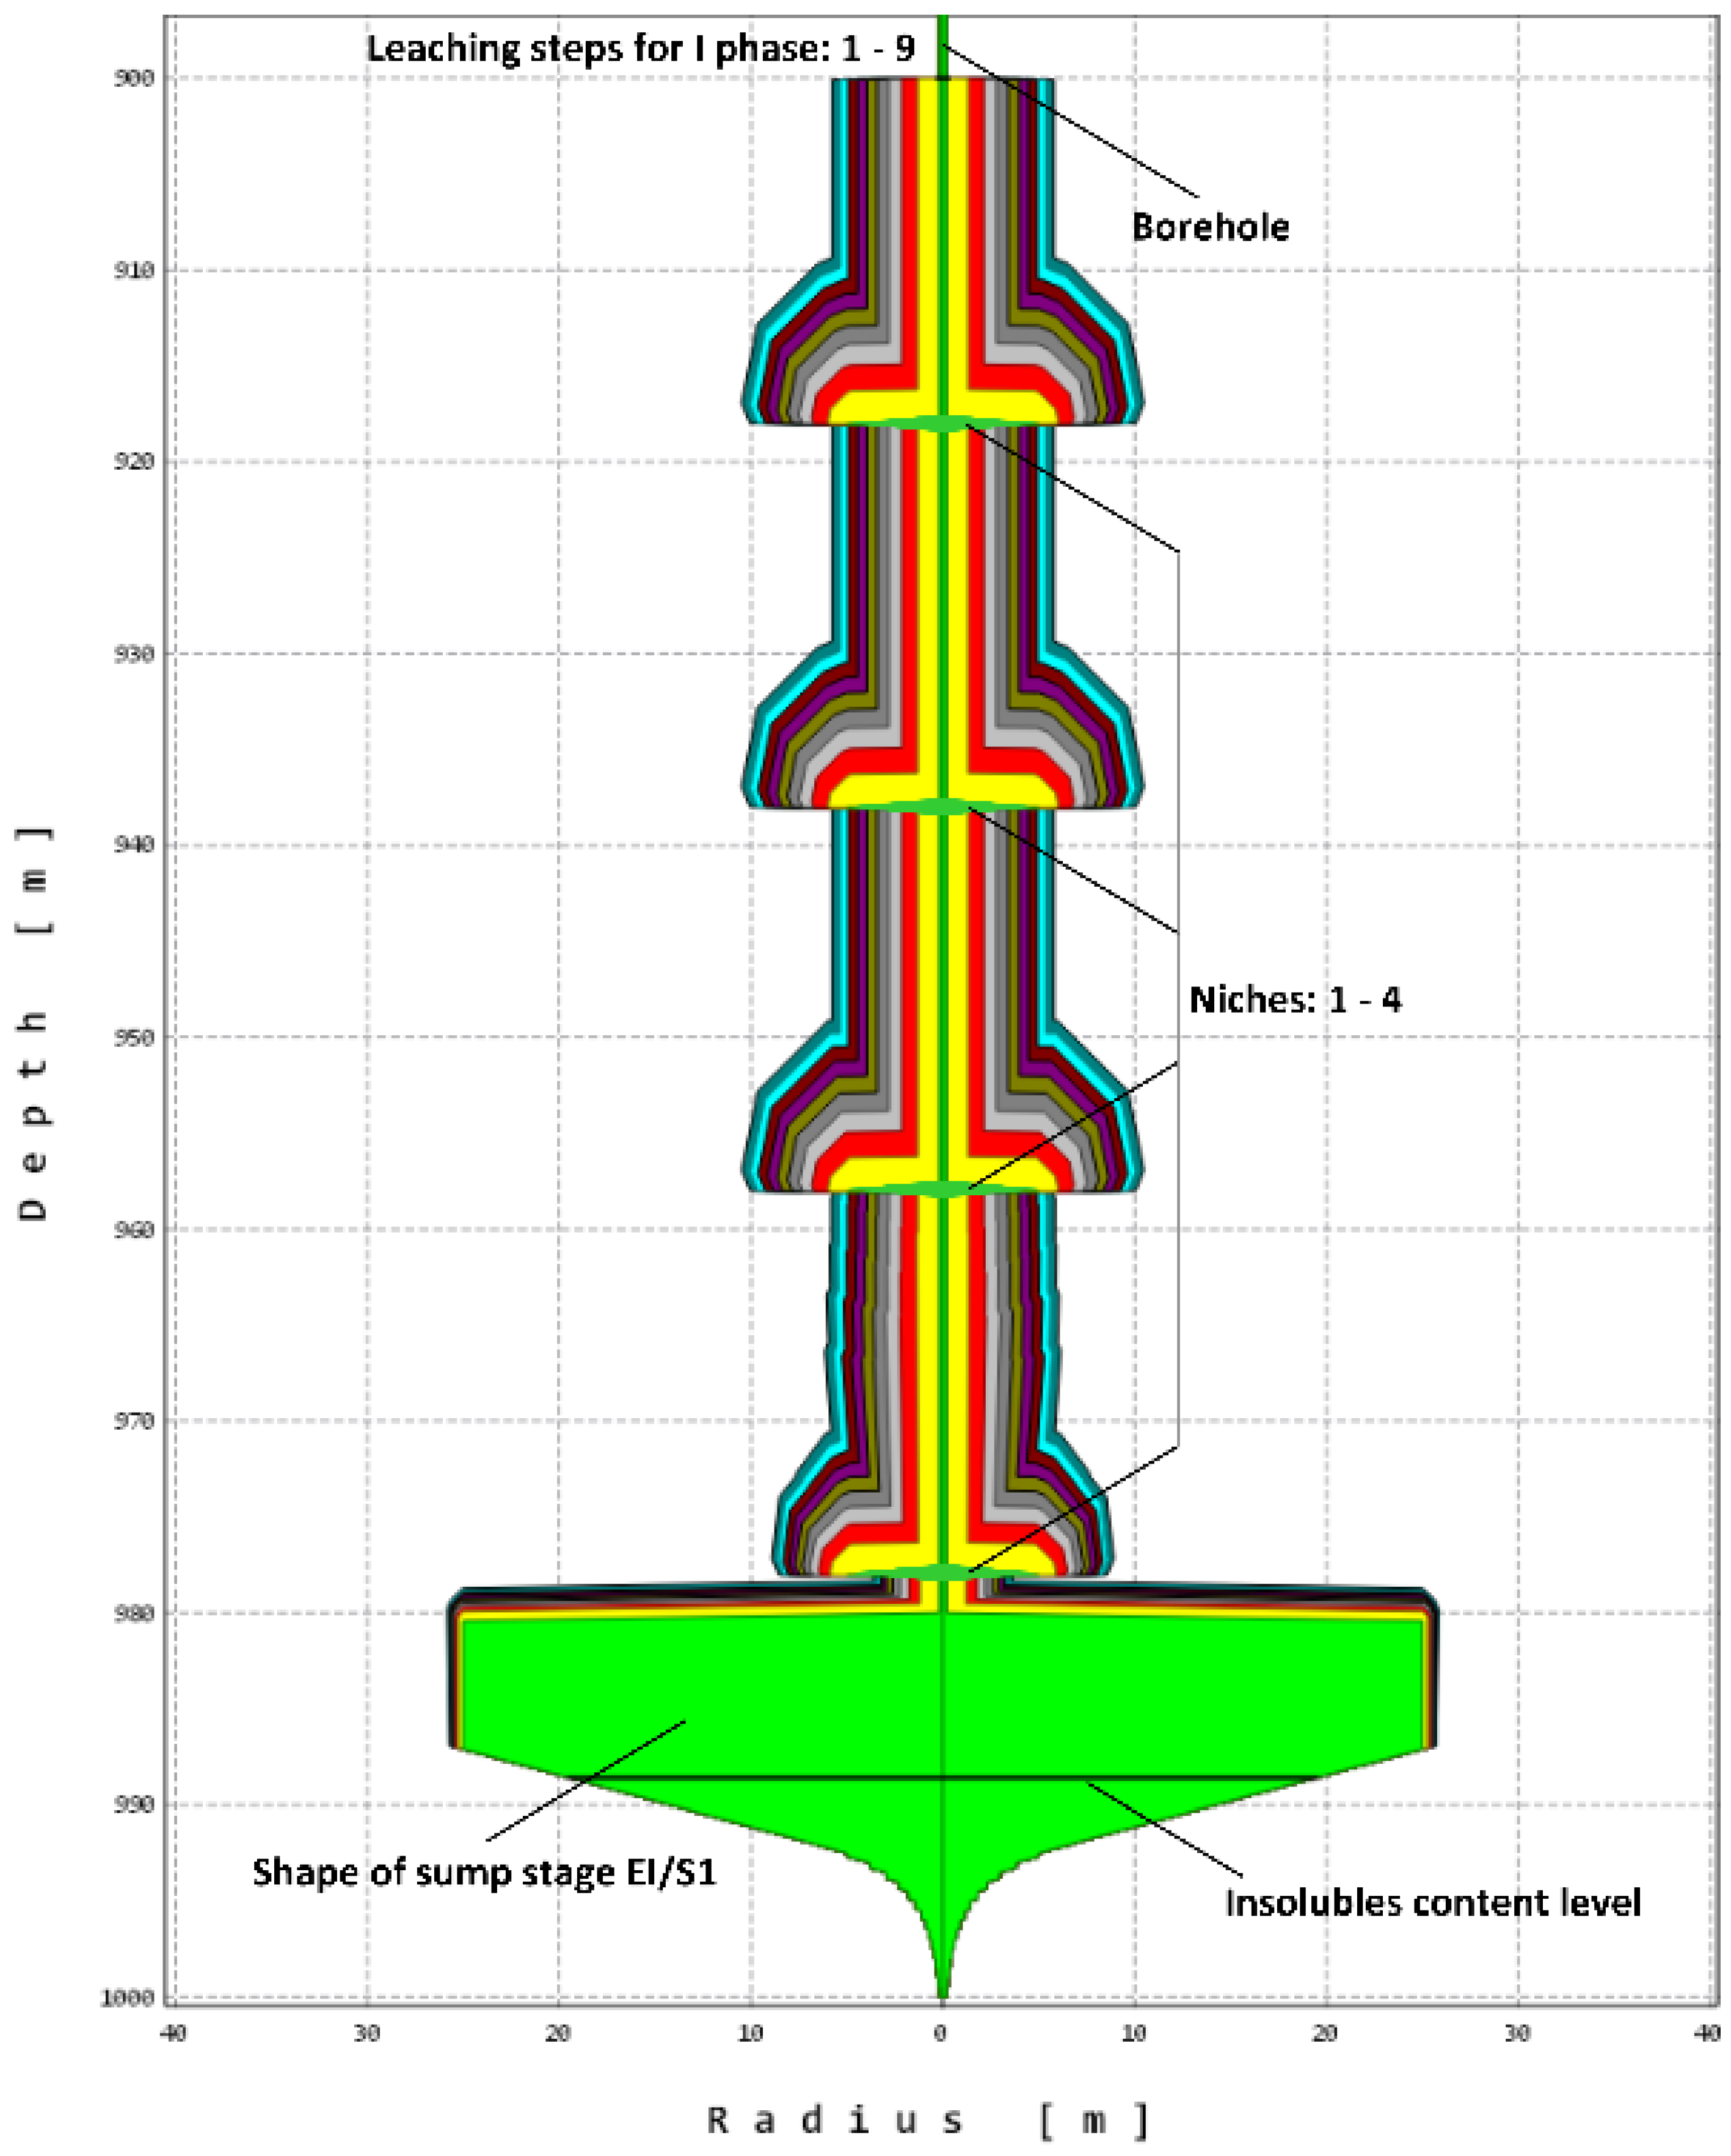
Scenario 2 explains to what extent the performance of a niche on the wall of the leach well will affect the efficiency of the salt leaching process and the final shape of the storage cavern. As part of this scenario concept, various variants related to the size of the niches and their location along the well were examined. In the case of creating the sump (1st stage), one or two niches were assumed,
Figure 5 and
Figure 6.
4.2.1. Stage I—Leaching of Sumps with One or Two Niches
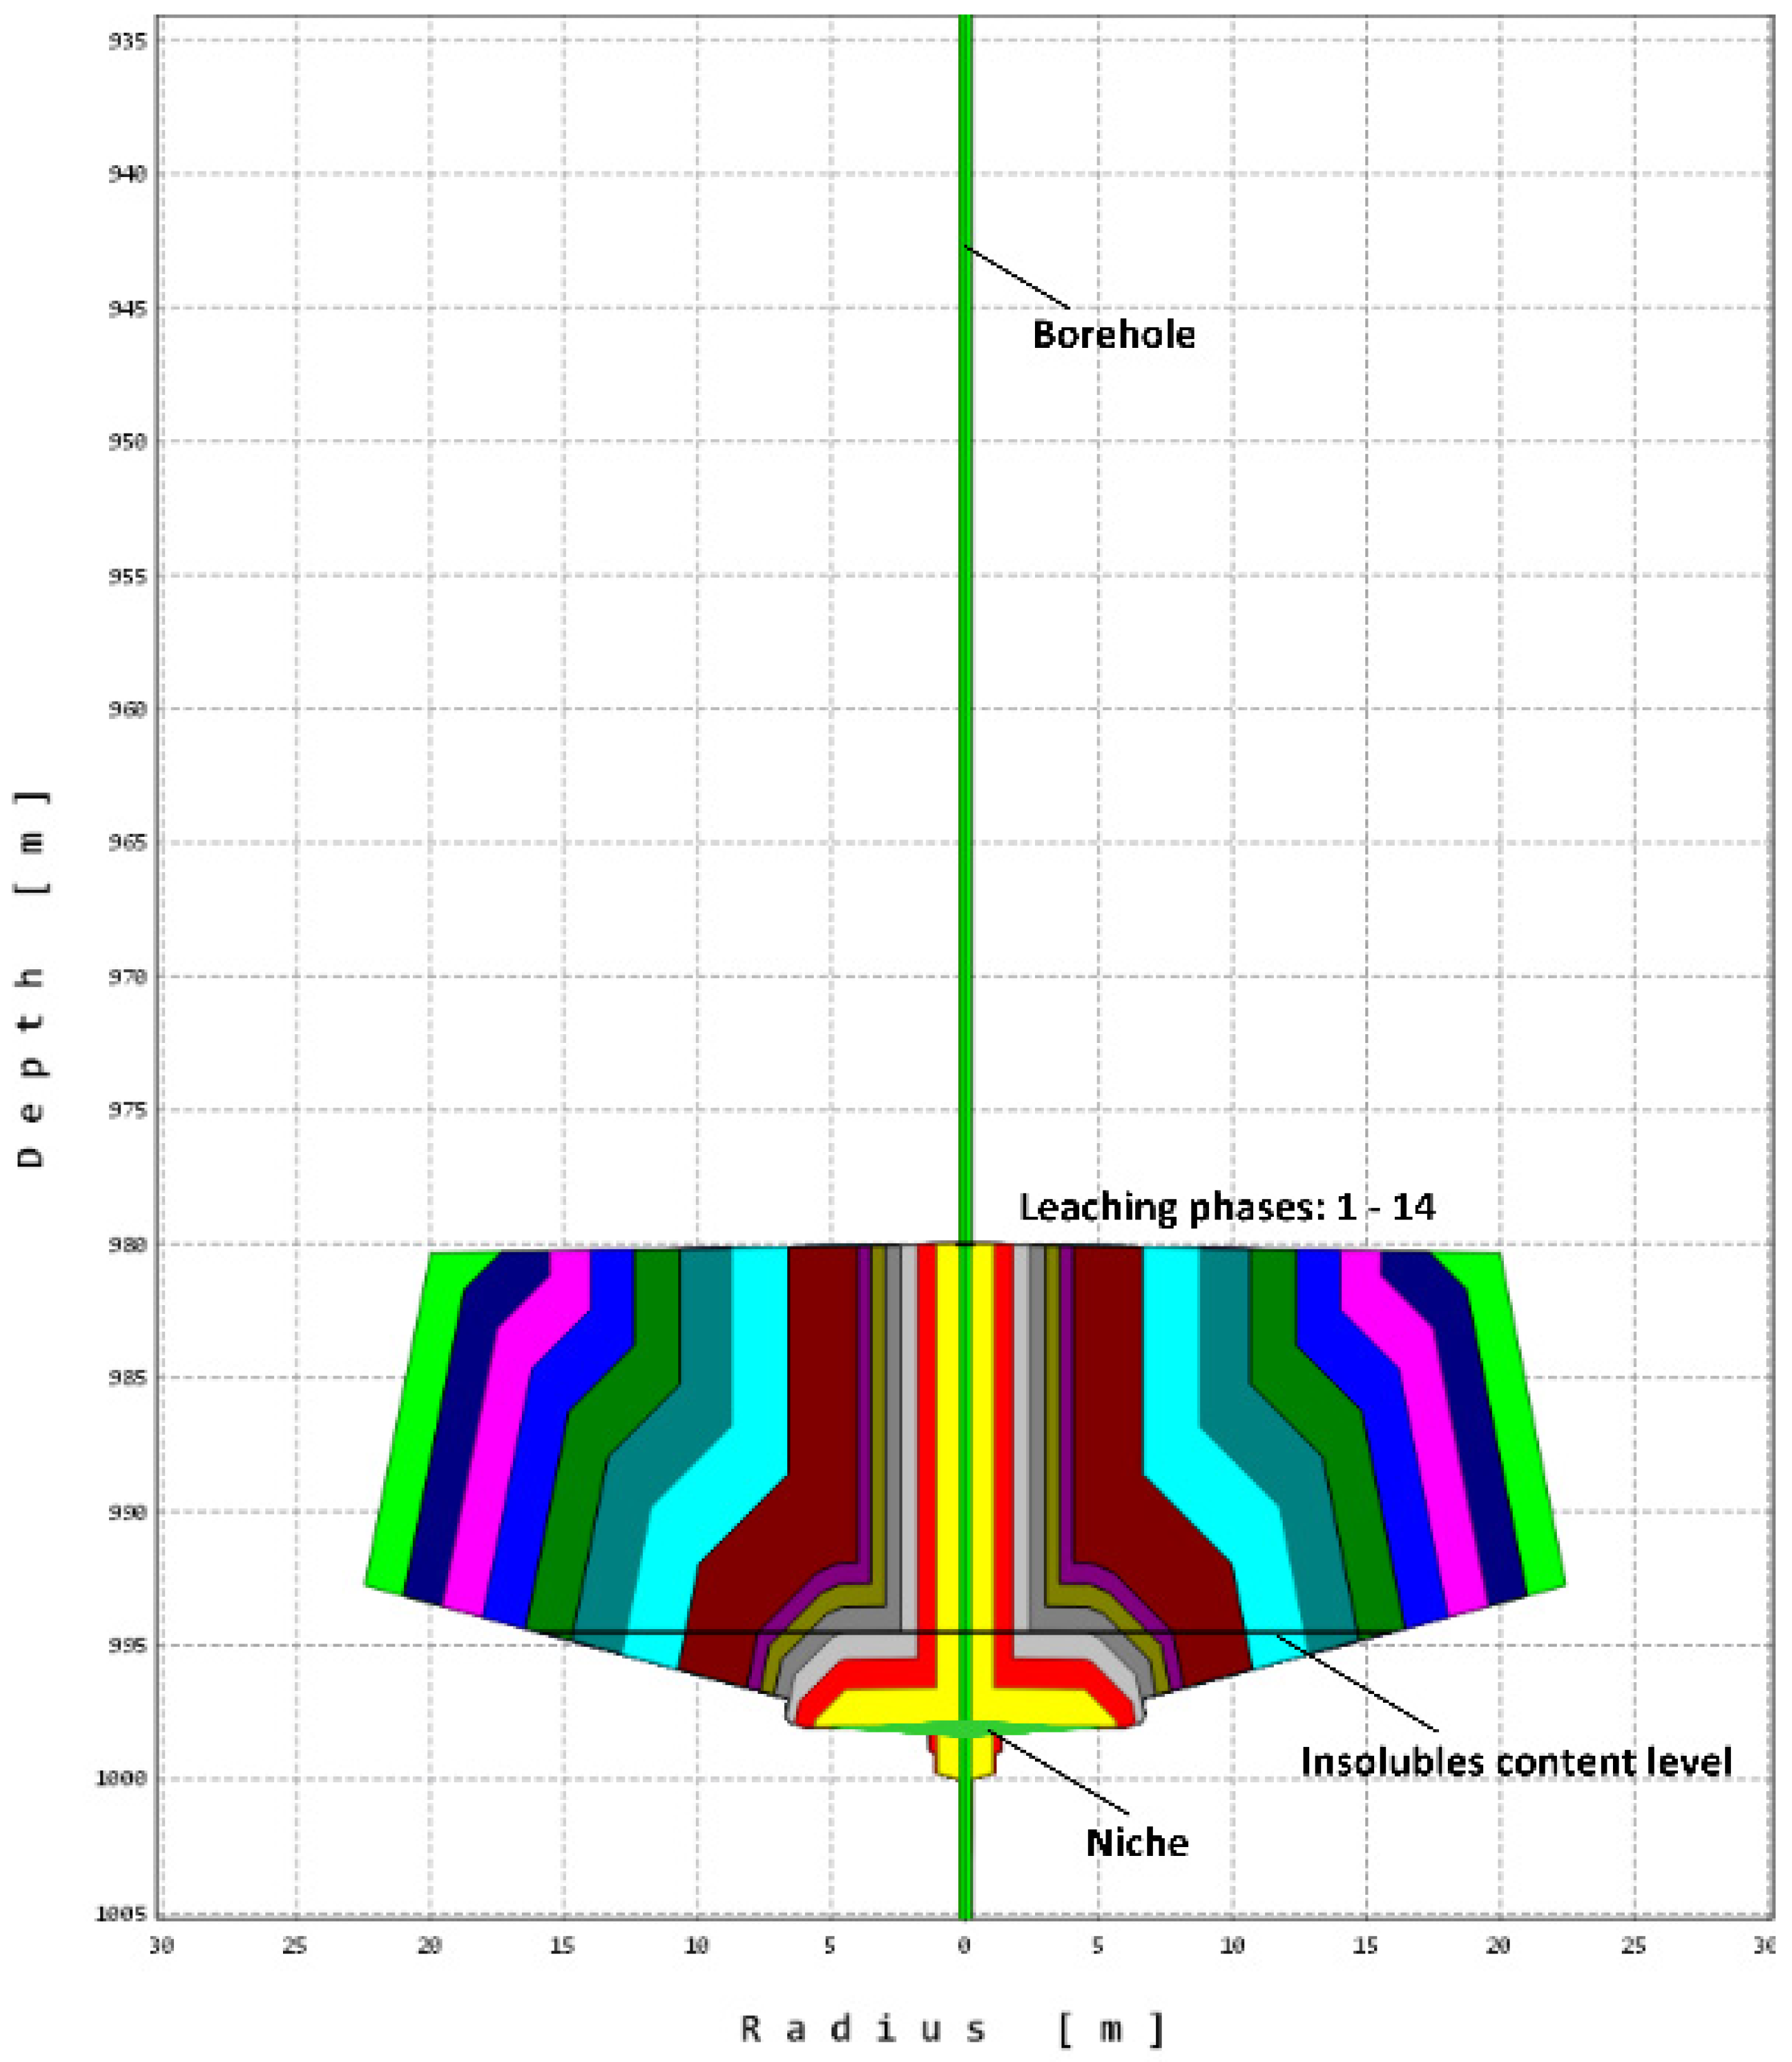
Due to the single recess made in the well, the contact surface of the leaching fluid with the rock mass increases at the very beginning of leaching; see
Figure 5 and
Table 6. Primarily, there is overhead (vertical/roof) leaching and, to a lesser extent, lateral (side) leaching. As in the scenario without a niche, roof insulation is used to limit the extent of the sump development towards the top. A reshaped sump is created compared to the S1 scenario. The side walls are sloped (as opposed to the perpendiculars in the previous scenario). The subsequent leaching phases are of similar shape. After creating two niches in the image of the numerical model,
Figure 6, two analogous cross-sectional shapes around the niches made characteristic for a single niche, are visible. The final shape in this case is less regular than that obtained in the single case and consists of two separate distinct parts of the sumps,
Figure 6. Detailed leaching and geometrical data of the caverns are presented in
Table 7. All results of the numerical leaching simulation regarding the configuration with one or two niches at the Stage I (
Table 8,
Table 9 and
Table 10)are shown graphically in
Figure 7,
Figure 8,
Figure 9,
Figure 10 and
Figure 11.
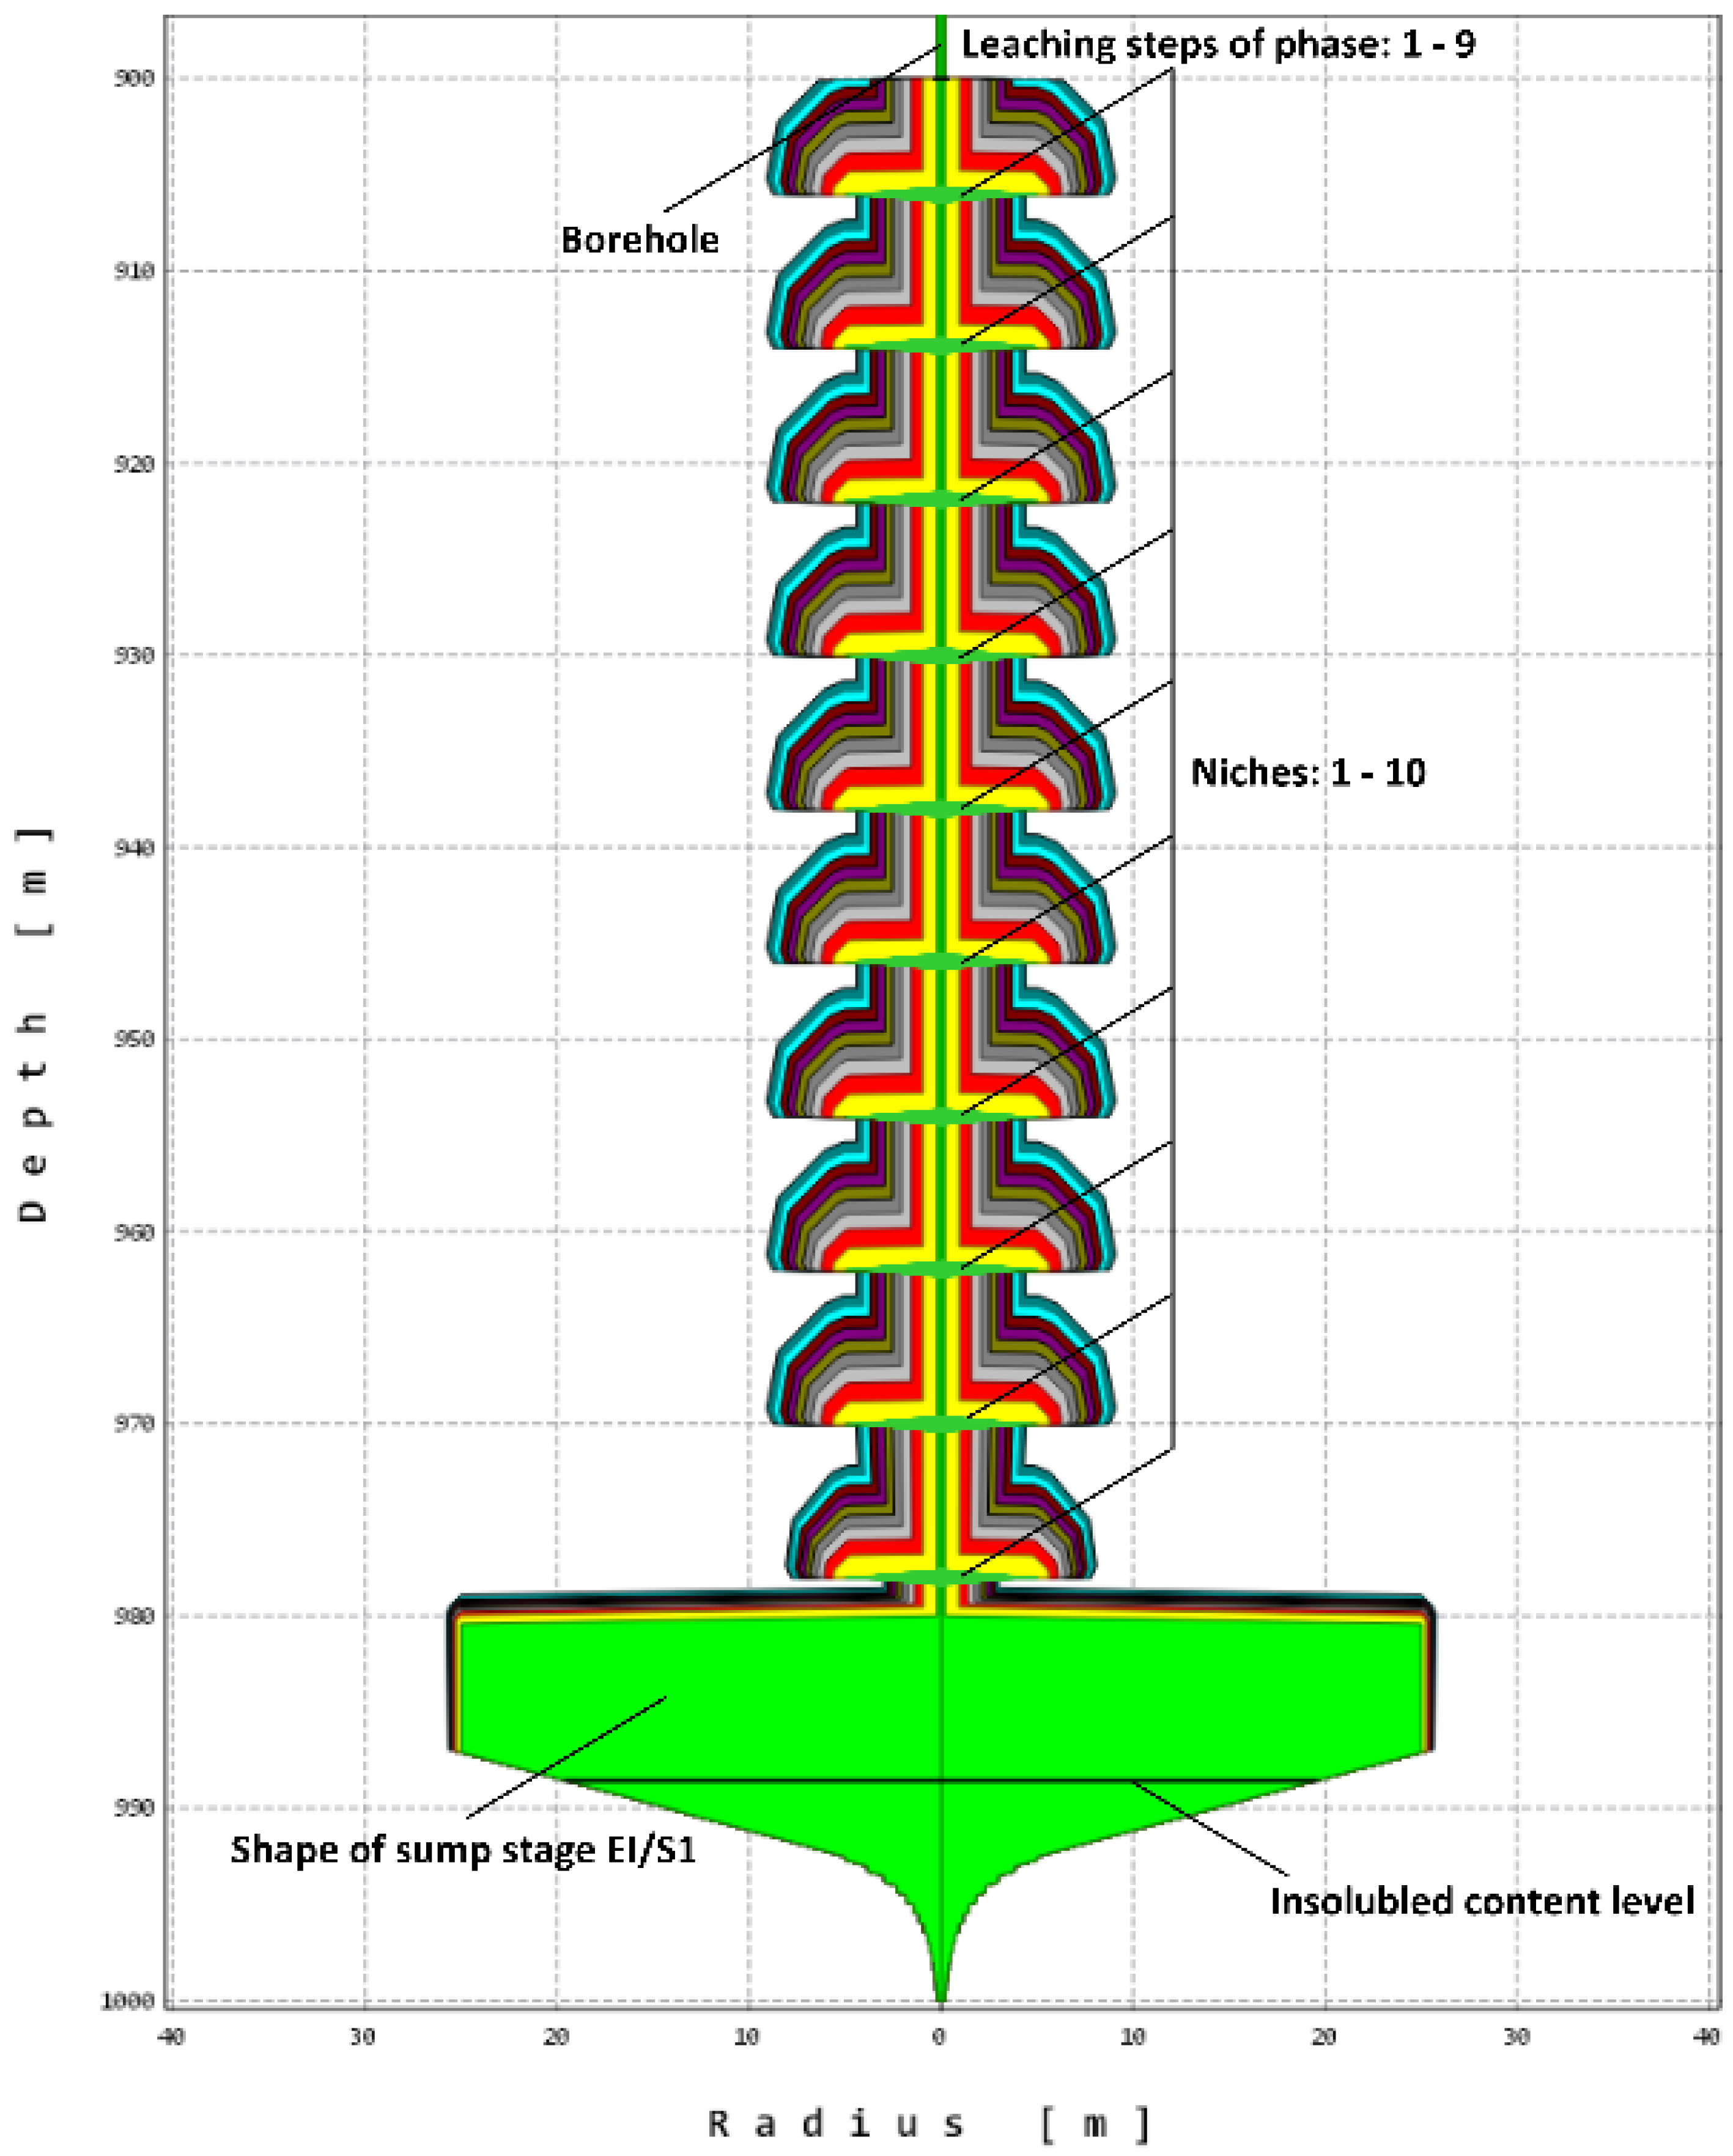
4.2.2. Stage II—Leaching of the Main Chamber
The construction of the main cavern begins in the second stage of technology. This stage was investigated for the cases of the earlier cutting of both a single niche,
Figure 12, as well as several niches evenly spaced along the well (4 and 10),
Figure 13 and
Figure 14. The leaching results are presented graphically in
Figure 15,
Figure 16,
Figure 17,
Figure 18 and
Figure 19.
5. Discussion and Analysis of the Results
The analysed results of the numerical simulations carried out concern the first two key stages of the leaching of caverns in the salt deposits, both in storage and in operation: Stage I and Stage II (first phase). The correct execution of the first stage influences the subsequent stages of the leaching. The first phase of Stage II aims to preliminary loosen the cavern after creating the sump.
Both stages of the leaching technology are very important for the proper construction of the cavern. Depending on their purpose, for each of these stages, different parameters and results of the leaching process will determine the achievement of the intended goal. The comparative analysis discusses in particular:
5.1. Stage I—Leaching of Sump
5.1.1. Sump Target Shape
Both for the storage and production cavern, the sump made should have an appropriate shape and volume, allowing for the further effective leaching of the chamber, achieving its designed final dimensions. Too small a volume or insufficient dimensions of the sump may result in its flooding with insoluble parts, and consequently, prevent further leaching of the cavern in this depth interval. In the case of the storage, this will result in a loss of its capacity, and in the case of the production cavern, in the loss of the deposit resources.
The sump made with the use of a niche has smaller diameters in the ceiling part than the sumps made with the classical technology (according to Scenario 1), while their floors are placed much lower,
Figure 7. This situation results in the better use of the deposit and the obtaining of a larger volume. The sumps made according to Scenario 2 are higher, so that the level of backfill with insoluble parts will rise much more slowly, as shown in
Figure 3,
Figure 5 and
Figure 6.
The volume growth courses during the sump leaching according to scenarios 1 and 2 (
Figure 8 and
Figure 9), and are approximately linear in the indicated time intervals. According to Scenario 2, we achieve the expected volume faster. After the first 30 days of leaching, there are clear differences in the sump volumes. The average rate of cavern volume increase in the classic arrangement (without the niche) is approximately 36 m
3/day. In the system with one niche, the rate increases by approximately 38.8% (to the value of approximately 50 m
3/day), and with two lower ones, the increase in relation to classic leaching is approximately 55% (to 56.6 m
3/day).
After 270 days of leaching, the speed of this process, when comparing the one-niche and the two-niche variants, disappears. During this period, the average rate of volume increase is approximately 62.5 m3/day in scenario 1 and approximately 73 m3/day in scenario 2. The profit on the implementation of niches is therefore about 17% of the obtained additional volume in a given time.
Based on the results presented in
Table 2,
Table 3 and
Table 4, it can be concluded that the production of the niches increases the volume of the obtained sump with the same leaching period of 270 days when:
One niche is made up of 2801 m3, which gives a volume increase of more than 16.5%;
Two niches are made of 2817 m3, which gives a volume increase of over 16.5%.
5.1.2. Change in Brine Concentration
During the leaching process of the cavern, brine is produced, the concentration of which depends on the amount of water injected, temperature, leaching cycle, size of the leached area, and type of salt. According to the industry standard [
31] applied in Poland, the sodium chloride concentration for saturated brine cannot be lower than 305 g/dm
3 for Zechstein rock salt deposits. Brine with a concentration below the above-mentioned limit is called semibrine.
During the leaching of the sump stage, we obtain semibrine with a concentration which increases during the leaching; therefore, depending on the purpose of the cavern and the investment stage, such semibrine can be dumped (in the sea), or supplemented to full concentration and sold. The discharge of brine may be impossible for environmental reasons, while its saturation is associated with increased costs (the brine must be pumped back into the chamber).
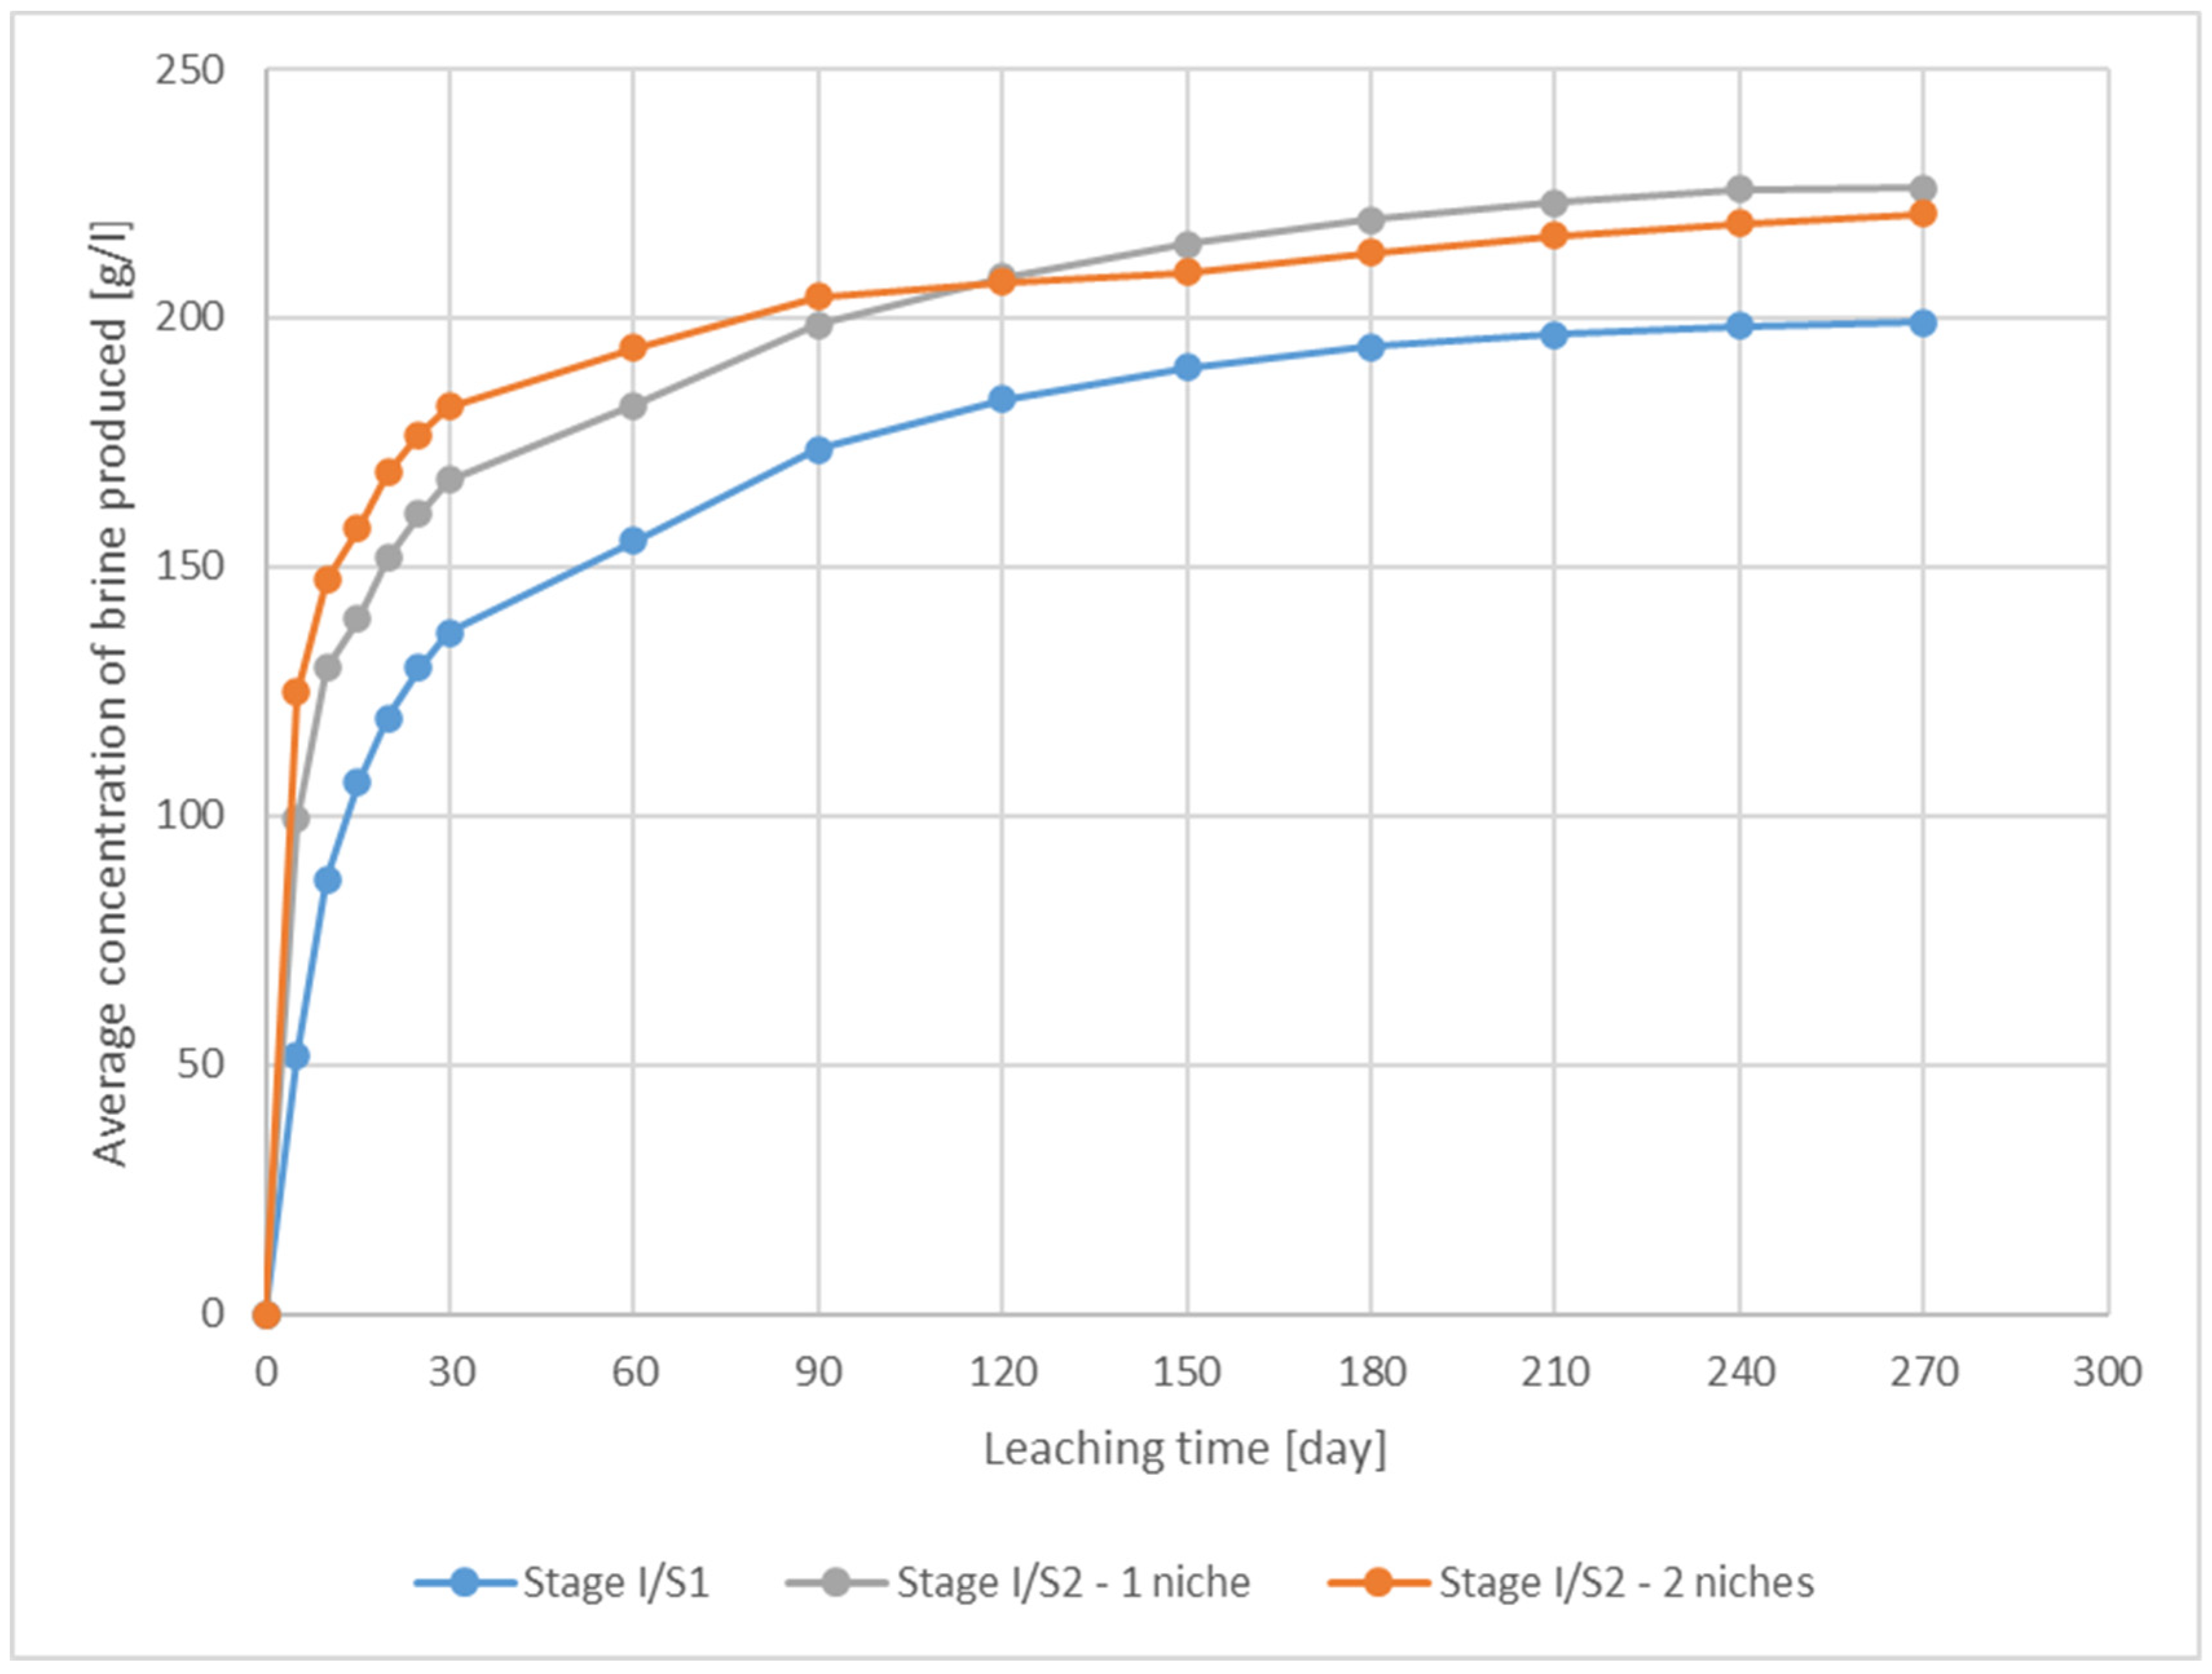
In Scenario 1 and Scenario 2, during the sump leaching, the concentration of unsaturated brine increases intensively during the first 30 days of leaching, after which the growth rate decreases:
Figure 10 and
Figure 11. The change in the semibrine at the end of the respective consecutive phase (column 9) and since the beginning of the leaching (column 10) is presented in
Table 4.
In Scenario 1, after 30 days, the brine concentration was 105 g/L (growth rate: 3.5 g/L/day), and for the entire 270-day sump stage, it was 177 g/L (growth rate: 0.66 g/L/day).
The simulations made according to Scenario 2, with niches made,
Figure 10 and
Figure 11,
Table 4,
Table 5,
Table 6 and
Table 7, show clear increases in the growth rate of brine concentration in relation to Scenario 1. The use of one niche can obtain brine with a concentration of 141 g/L (after 30 days) leaching, which causes an increase in concentration by about 34% up to the value of 4.7 g/L/day, compared to the analogous situation in Scenario 1.
For the entire 270-day sump leaching stage, the half-brine concentration in the one-niche system is 204 g/L (growth rate: 0.76 g/L/day), i.e., about 15% more than in Scenario 1 without the niche. Using two niches after 30 days, a concentration of 159 g/L was achieved (growth rate: 5.3 g/L/day), approximately 51.4% more than in Scenario 1. After 270 days of leaching, the concentration is 205 g/L, at a rate analogous to that of a single-niche system. The maximum brine concentration obtained at the end of the leaching of the sump with one niche is 226 g/L, and with two niches it is 221 g/L.
There is no clear difference in the change in brine concentration between the two-niche and one-niche situations for the entire 270-day sump leaching period. This is the case because the spacing between the niches is too small and the effect of creating the two niches disappears, reducing the leaching area and, consequently, the brine concentration. With a larger pit spacing, the brine concentration for the two-niche simulation should be the highest at the end of the sump leaching.
In summary, it can be stated that the construction of niches resulted in a faster increase in the concentration of the obtained semibrine as compared to the classically made sump. In the first 30 days, the increase is approximately 34% for one niche and 54% for two niches. Taking into account the entire sump leaching period of 270 days, it is shown that the leaching rate increased by about 15% compared to Scenario 1, with no significant difference in these values between the use of one or two niches. It can be assumed that with the increased spacing of niches, the values for two niches should be much larger.
5.1.3. Speed of Sump Leaching
The sump leaching stage, due to the low injection water capacity, takes a relatively long time when compared to the final volume of the chamber. This is due to the fact that the pressure during the leaching of the sump is one of the highest during the leaching of the cavern, and due to the possibility of losing the tightness of the connection borehole × cavern. The pressures for storage caverns must not exceed 0.75–0.85 of the salt rock fracturing gradient at the depth of the shoe installation of the last cemented column [
10,
32].
The time to create a classic sump, depending on the planned maximum diameter of the cavern, can be up to 9 months. This article assumes that, in both scenarios, the sump execution time will be 270 days. When comparing this value with the leaching time of the entire storage cavern,
Table 3, it can be concluded that sump leaching can take up to 35% of the entire cavern leaching time.
The time required to create the niche is not added to the sump leaching stage for Scenario 2, as this procedure is performed before the leaching begins, thus still in the drilling stage. Laboratory tests show [
7] that when using a nozzle with a diameter of 1 mm, a pressure of 500 bar, a stream velocity of 25.4 m/s, a nozzle travel speed of 100 mm/min, and a stream output of 1 to cut a niche 18 l/min, it is possible to cut a niche in one cycle with a maximum depth of 23.34 mm/min. Laboratory data cannot be directly translated into real conditions in the borehole at a depth of approximately 1000 m, due to the different flow rate and the speed of the nozzle movement. For the verification and validation of the modified technology, in situ tests on a real deposit are in the planning stages.
5.1.4. Meaning and Role of the Number of Niches
In the sump leaching stage, the niches significantly influence the leaching process. Simulations performed according to Scenario 2 show that the key to creating niches is their appropriate location. Too many niches will not have a positive effect on the leaching process due to the overlapping effect of the niches. The effect of the reduction of the leach area is shown in the diagram in
Figure 11. From the 120th day of leaching, the semibrine concentration for the simulation with two niches is lower compared to one niche. When analysing the development of the shape of a sump with two niches,
Figure 6, it can be seen that, for the first nine leaching phases, there is a so-called top-side leaching. Lateral leaching takes place on the well wall (the side leaching coefficient dominates), -in the niches there is roof leaching (the roof leaching coefficient dominates), while the bottom of the niches is not leached. With each successive leaching phase in the niches, the proportion of lateral leaching increases at the expense of the top, until the completion of phase 9, where the side of the sump is almost vertical, and thus the lateral leaching factor plays a dominant role in the leaching. The side leaching coefficient is much lower than the overhead leaching, and therefore after the 120th day of leaching we observe a decrease in brine concentration, which is related to a smaller increase in the volume of the sump with two niches. For a one-niche sump,
Figure 5, we observe that the top-side leaching continues until the sump leaching is complete, while for a classic leach sump (Scenario 1),
Figure 3, only side leaching occurs.
From the simulation results, it appears that the height of the niche does not matter for the leaching process itself, but it must be large enough to prevent it from tightening due to salt creeping before starting the leaching. The extent of the niche is of significant importance and as it grows, the leaching process becomes longer. As a result, a more favourable shape of the bottom of the sump is obtained.
5.1.5. Other Beneficial Changes to the Overall Leaching Process and its Control
The simulations of the sump leaching stage allow one to conclude that, with the appropriate arrangement of the niches, it is possible to select such a chamber leaching programme, to shorten the sump leaching to 2 months, and/or to obtain an industrial brine after that time. Such a solution can significantly accelerate or reduce the costs of newly built mines and storages, for which it is impossible or difficult to discharge the obtained semibrine during sump leaching.
5.2. Stage II—Leaching of the Main Chamber (Phase I)
5.2.1. Final Result
The end result of Phase I, after leaching the sump for the storage cavern, obtains the appropriate shape in its lower part, and in case of the need to saturate the obtained semibrine in other caverns, also obtains the appropriate diameter of approximately 10 m in the shortest possible time, approximately 250 g/L, allowing it to be supplemented in other, already developed caverns, with a high water efficiency of over 200 m3/h. Poor leaching of the lower part of the cavern may result in the inability to obtain the appropriate target shape, thus reducing its capacity or its geomechanical stability.
One of the most important parameters in the production of caverns is the fast obtaining of industrial brine. In the first phase, after creating the sump, the appropriate cavern diameter should be achieved. The improved leaching results of this phase due to the creation of niches, compared to the total lifetime (possibly over 20 years), does not translate into specific benefits. There are enough well-developed caverns in the borehole salt mines to perform this phase quickly and properly. For this reason, the discussed technology has no practical application and is not discussed in more detail in the mining caverns at this stage of leaching.
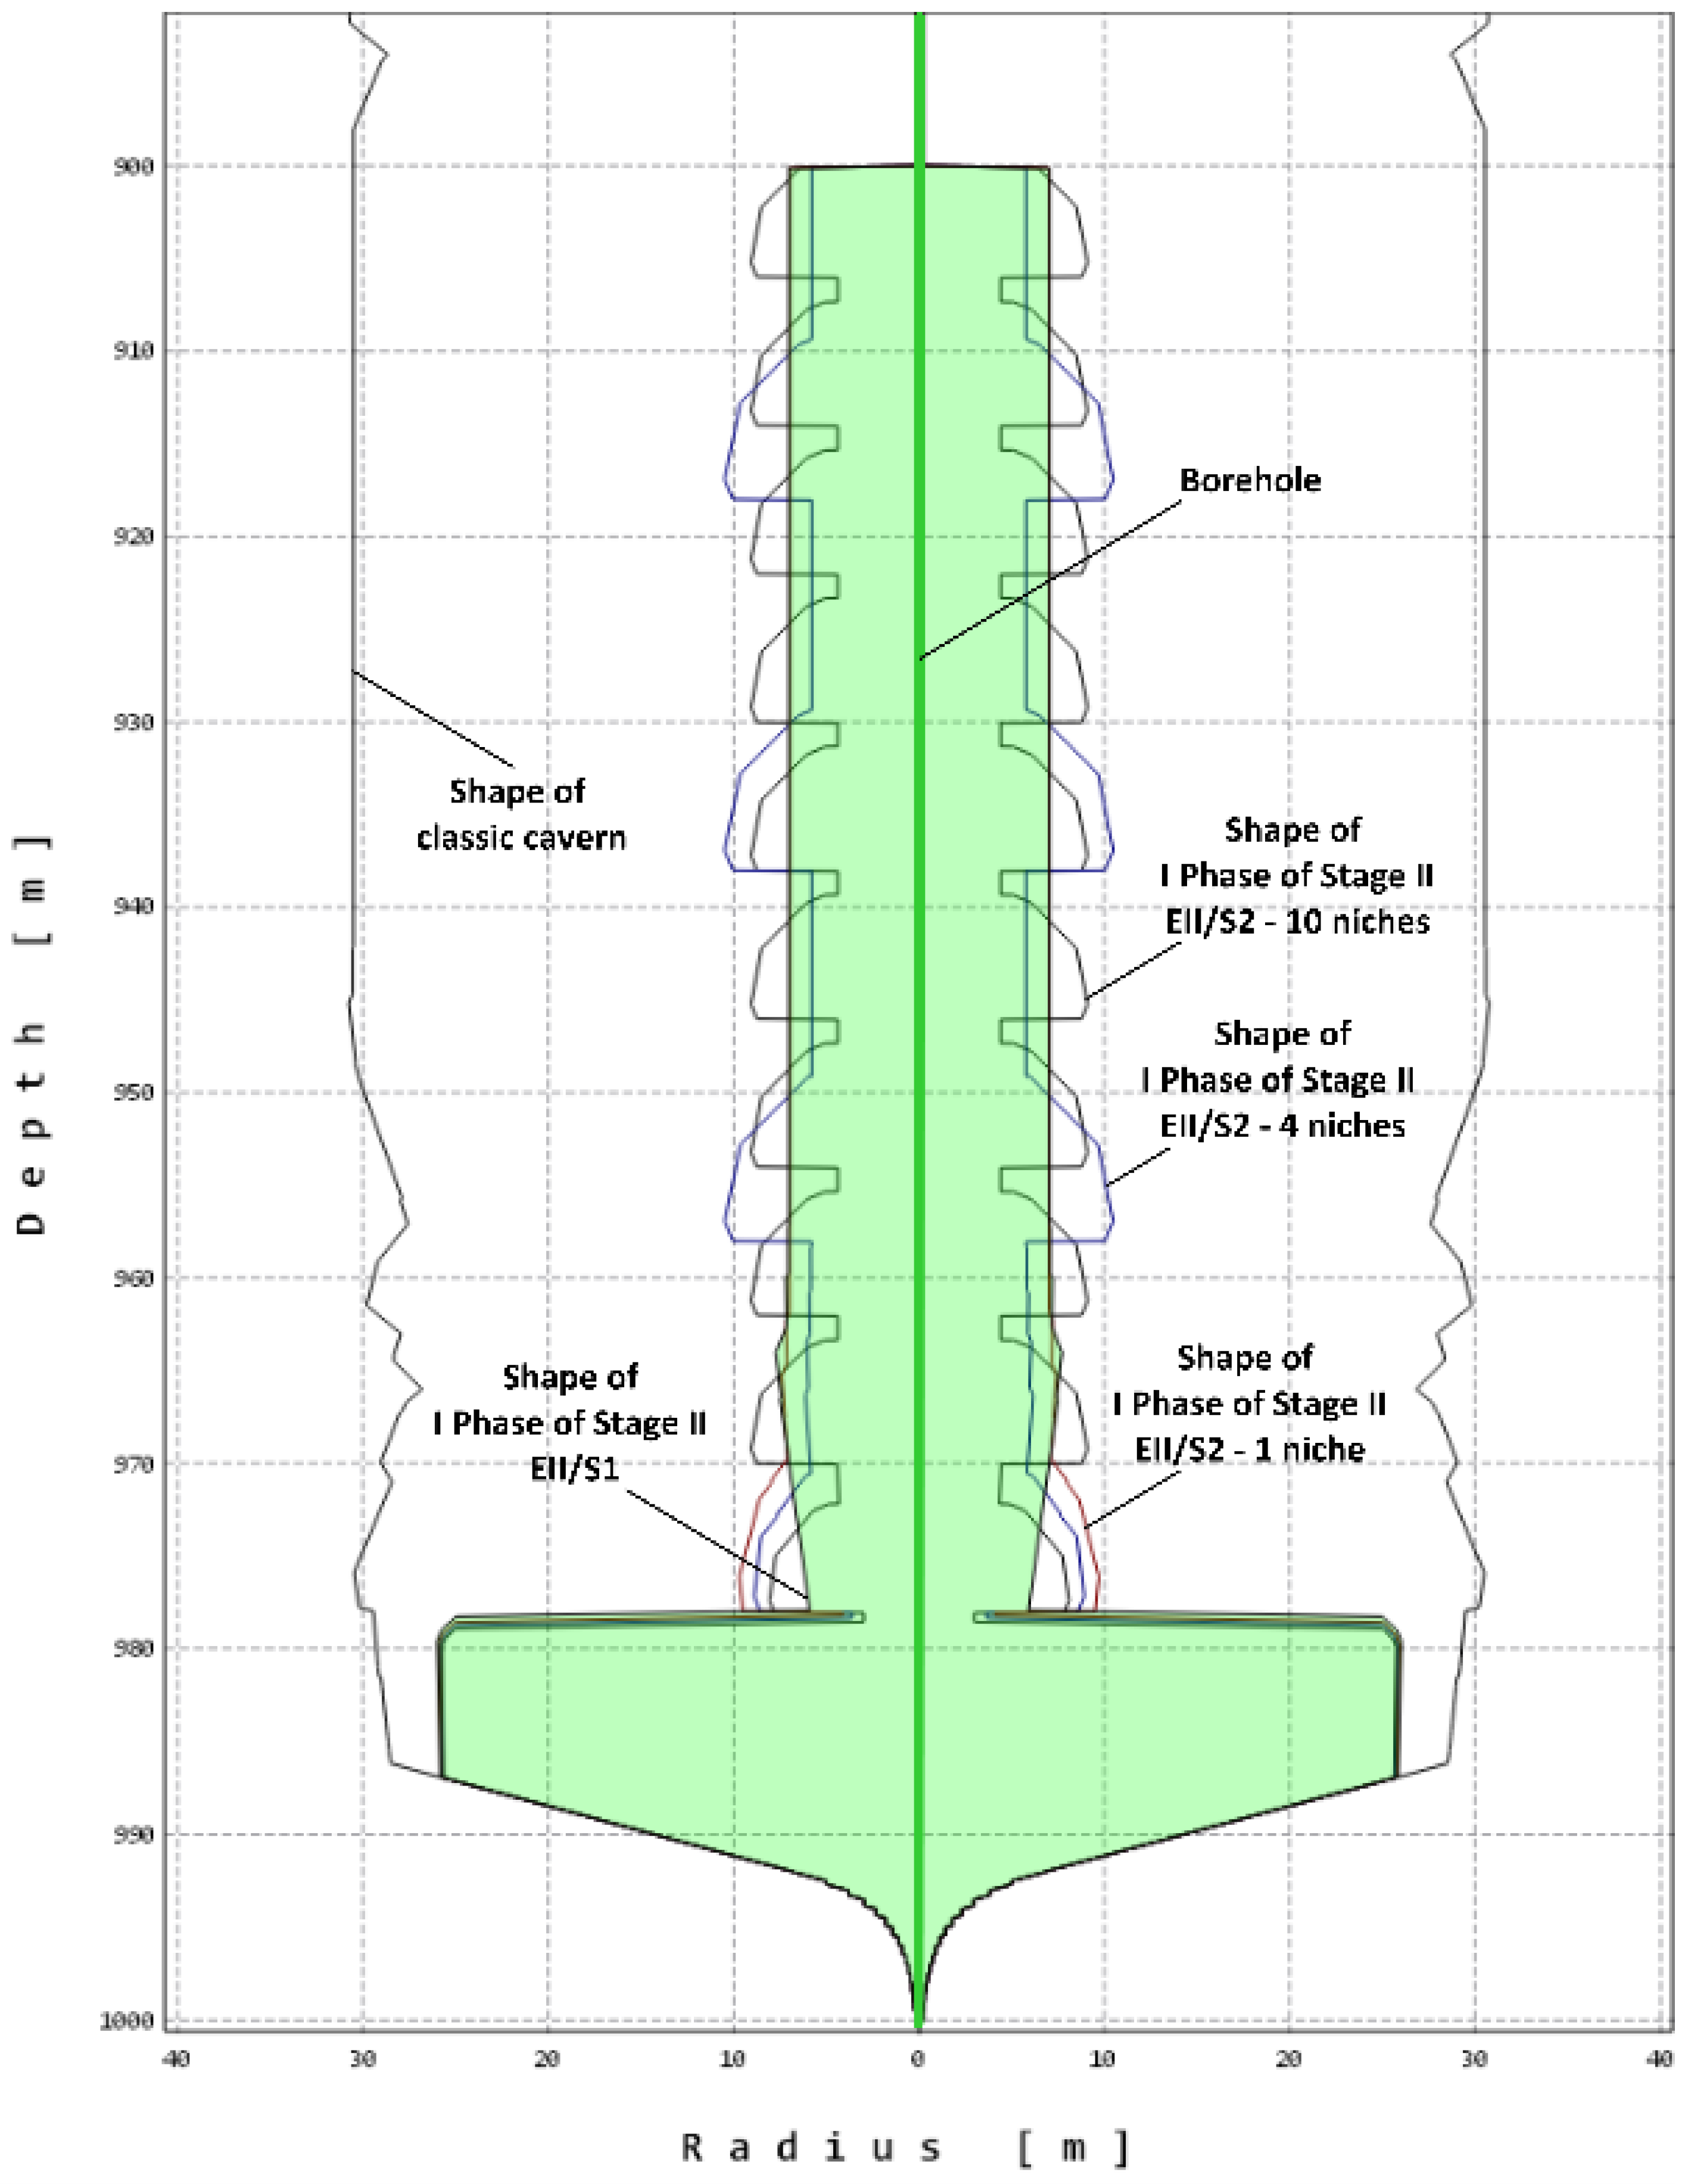
Figure 15 shows a comparison of the end shapes for both scenarios. The shape of Phase I after the leaching of the sump made classically (Scenario 1) is marked in green, while the contours with the use of 1, 4 and 10 niches are marked in red, blue, and black (Scenario 2), respectively.
The classically made I phase (SII/S1) has the shape of a cylinder of the same diameter, which turns into an inverted cone in the lower part of the chamber, i.e., the “tooth” which is characteristic of the leach caverns in the reverse circulation “with the shoes of the tubes alike” (the distance between the shoes of the leaching pipes is much less than the height of the salt interval during leaching). In leaching practice, the chamber leaching programme is designed to minimize its size as much as possible. This “tooth” is larger or smaller depending on the leaching parameters. The smaller the distance between the pipes’ shoes, the smaller its height, but at the cost of a reduced concentration of the obtained brine.
Simulations made according to Scenario 2 show that in the place where the niches were cut, the shape of the cavern develops into a dome shape during leaching (
Figure 12,
Figure 13 and
Figure 14). This shape is due to the fact that the niche leaching is on the top side. The greater the number of niches, the smaller the maximum diameter of the dome and its height. From the simulation of the process with several niches, it can be seen that the development of the chamber for individual niches is diversified and, with increasing depth, the successive domes become smaller. This is because the concentration increases with depth, thus reducing the rate of leaching.
Niches made in the lower part of the chamber, directly above the sump, change the shape of the chamber in such a way that no “tooth” is formed, due to which it is possible to leach with a greater distance between the pipes’ shoes, without losing the volume of the chamber and obtaining the appropriate final shape and high concentrations of semibrine.
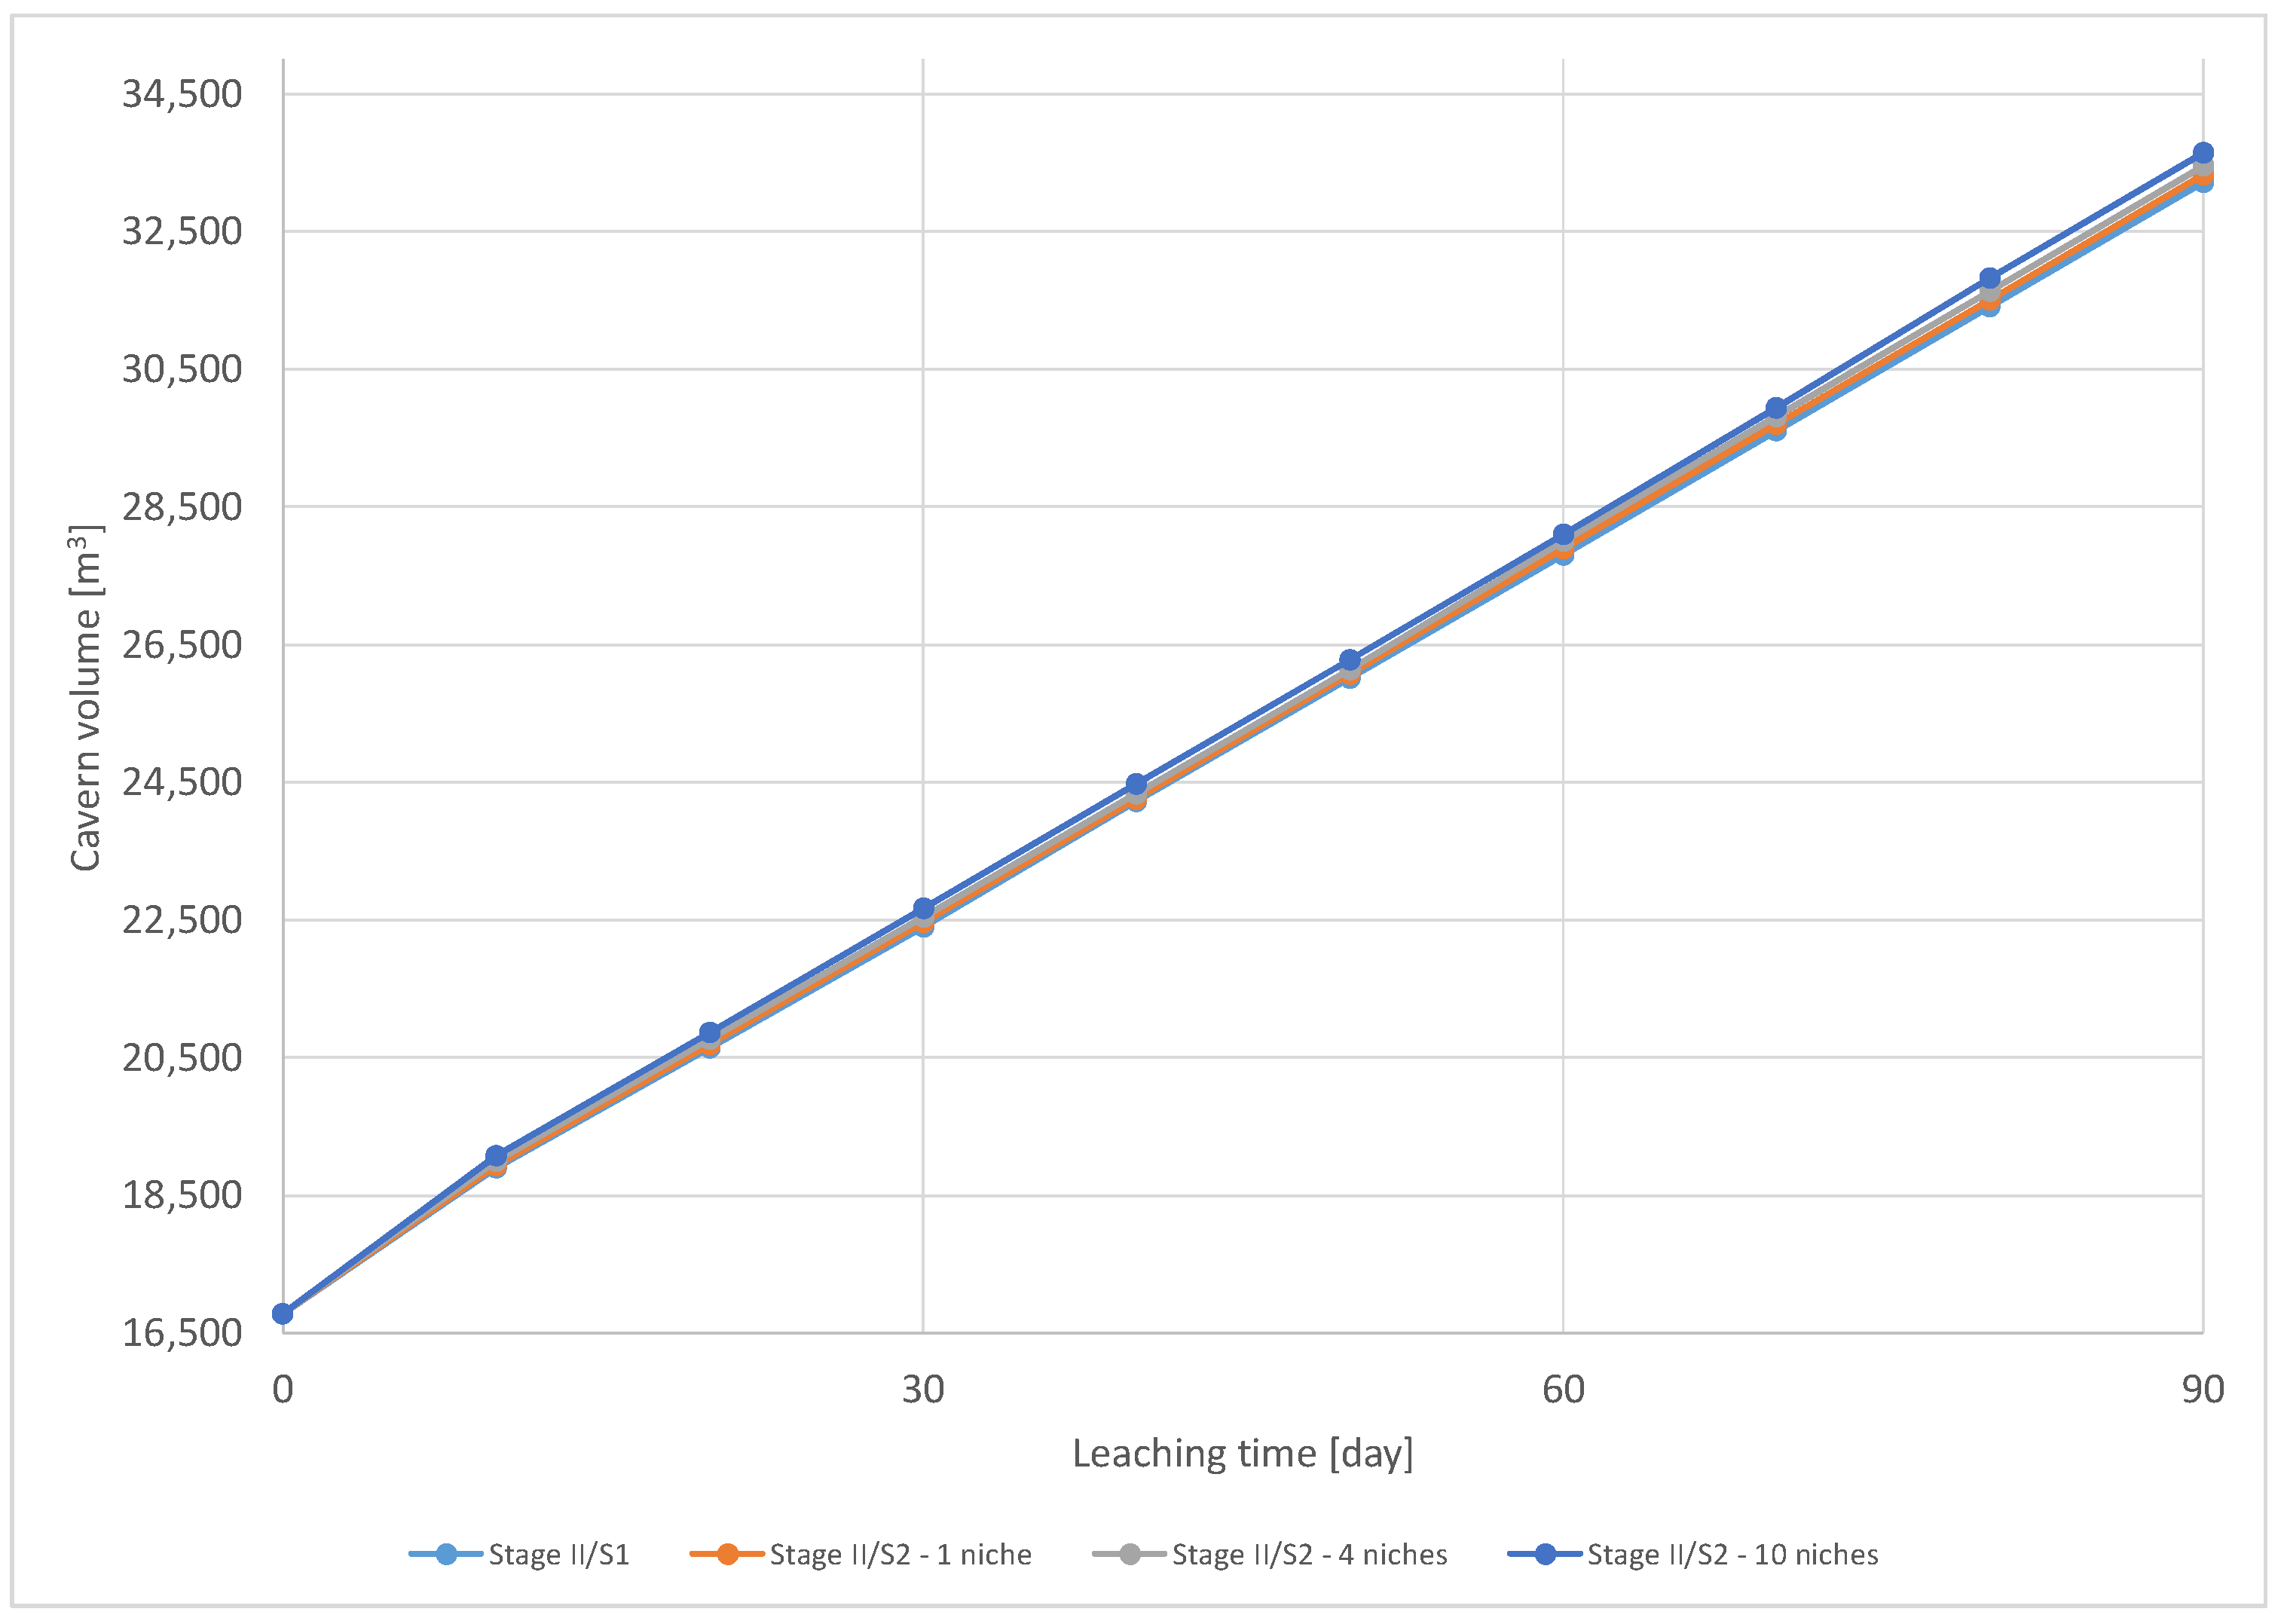
Comparing the volume changes,
Figure 16 and
Figure 17, for Scenarios 1 and 2, it can be concluded that they are almost linear from the start of leaching. The volume for Phase I performed according to Scenario 2 is slightly higher than for Scenario 1, and with time this difference increases.
Based on the results in
Table 8,
Table 9 and
Table 10, it can be concluded that the production of the niches does not significantly increase the volume of the main chamber for the same leaching period of 90 days:
In the case of 1 lower version, the increase is 108 m3, which means an increase in volume below 1.0%;
If 4 niches are made, the increase is 232 m3, which means an increase in volume below 1.0%;
If 10 niches are made, the increase is 425 m3, which means an increase in volume by 1.3%.
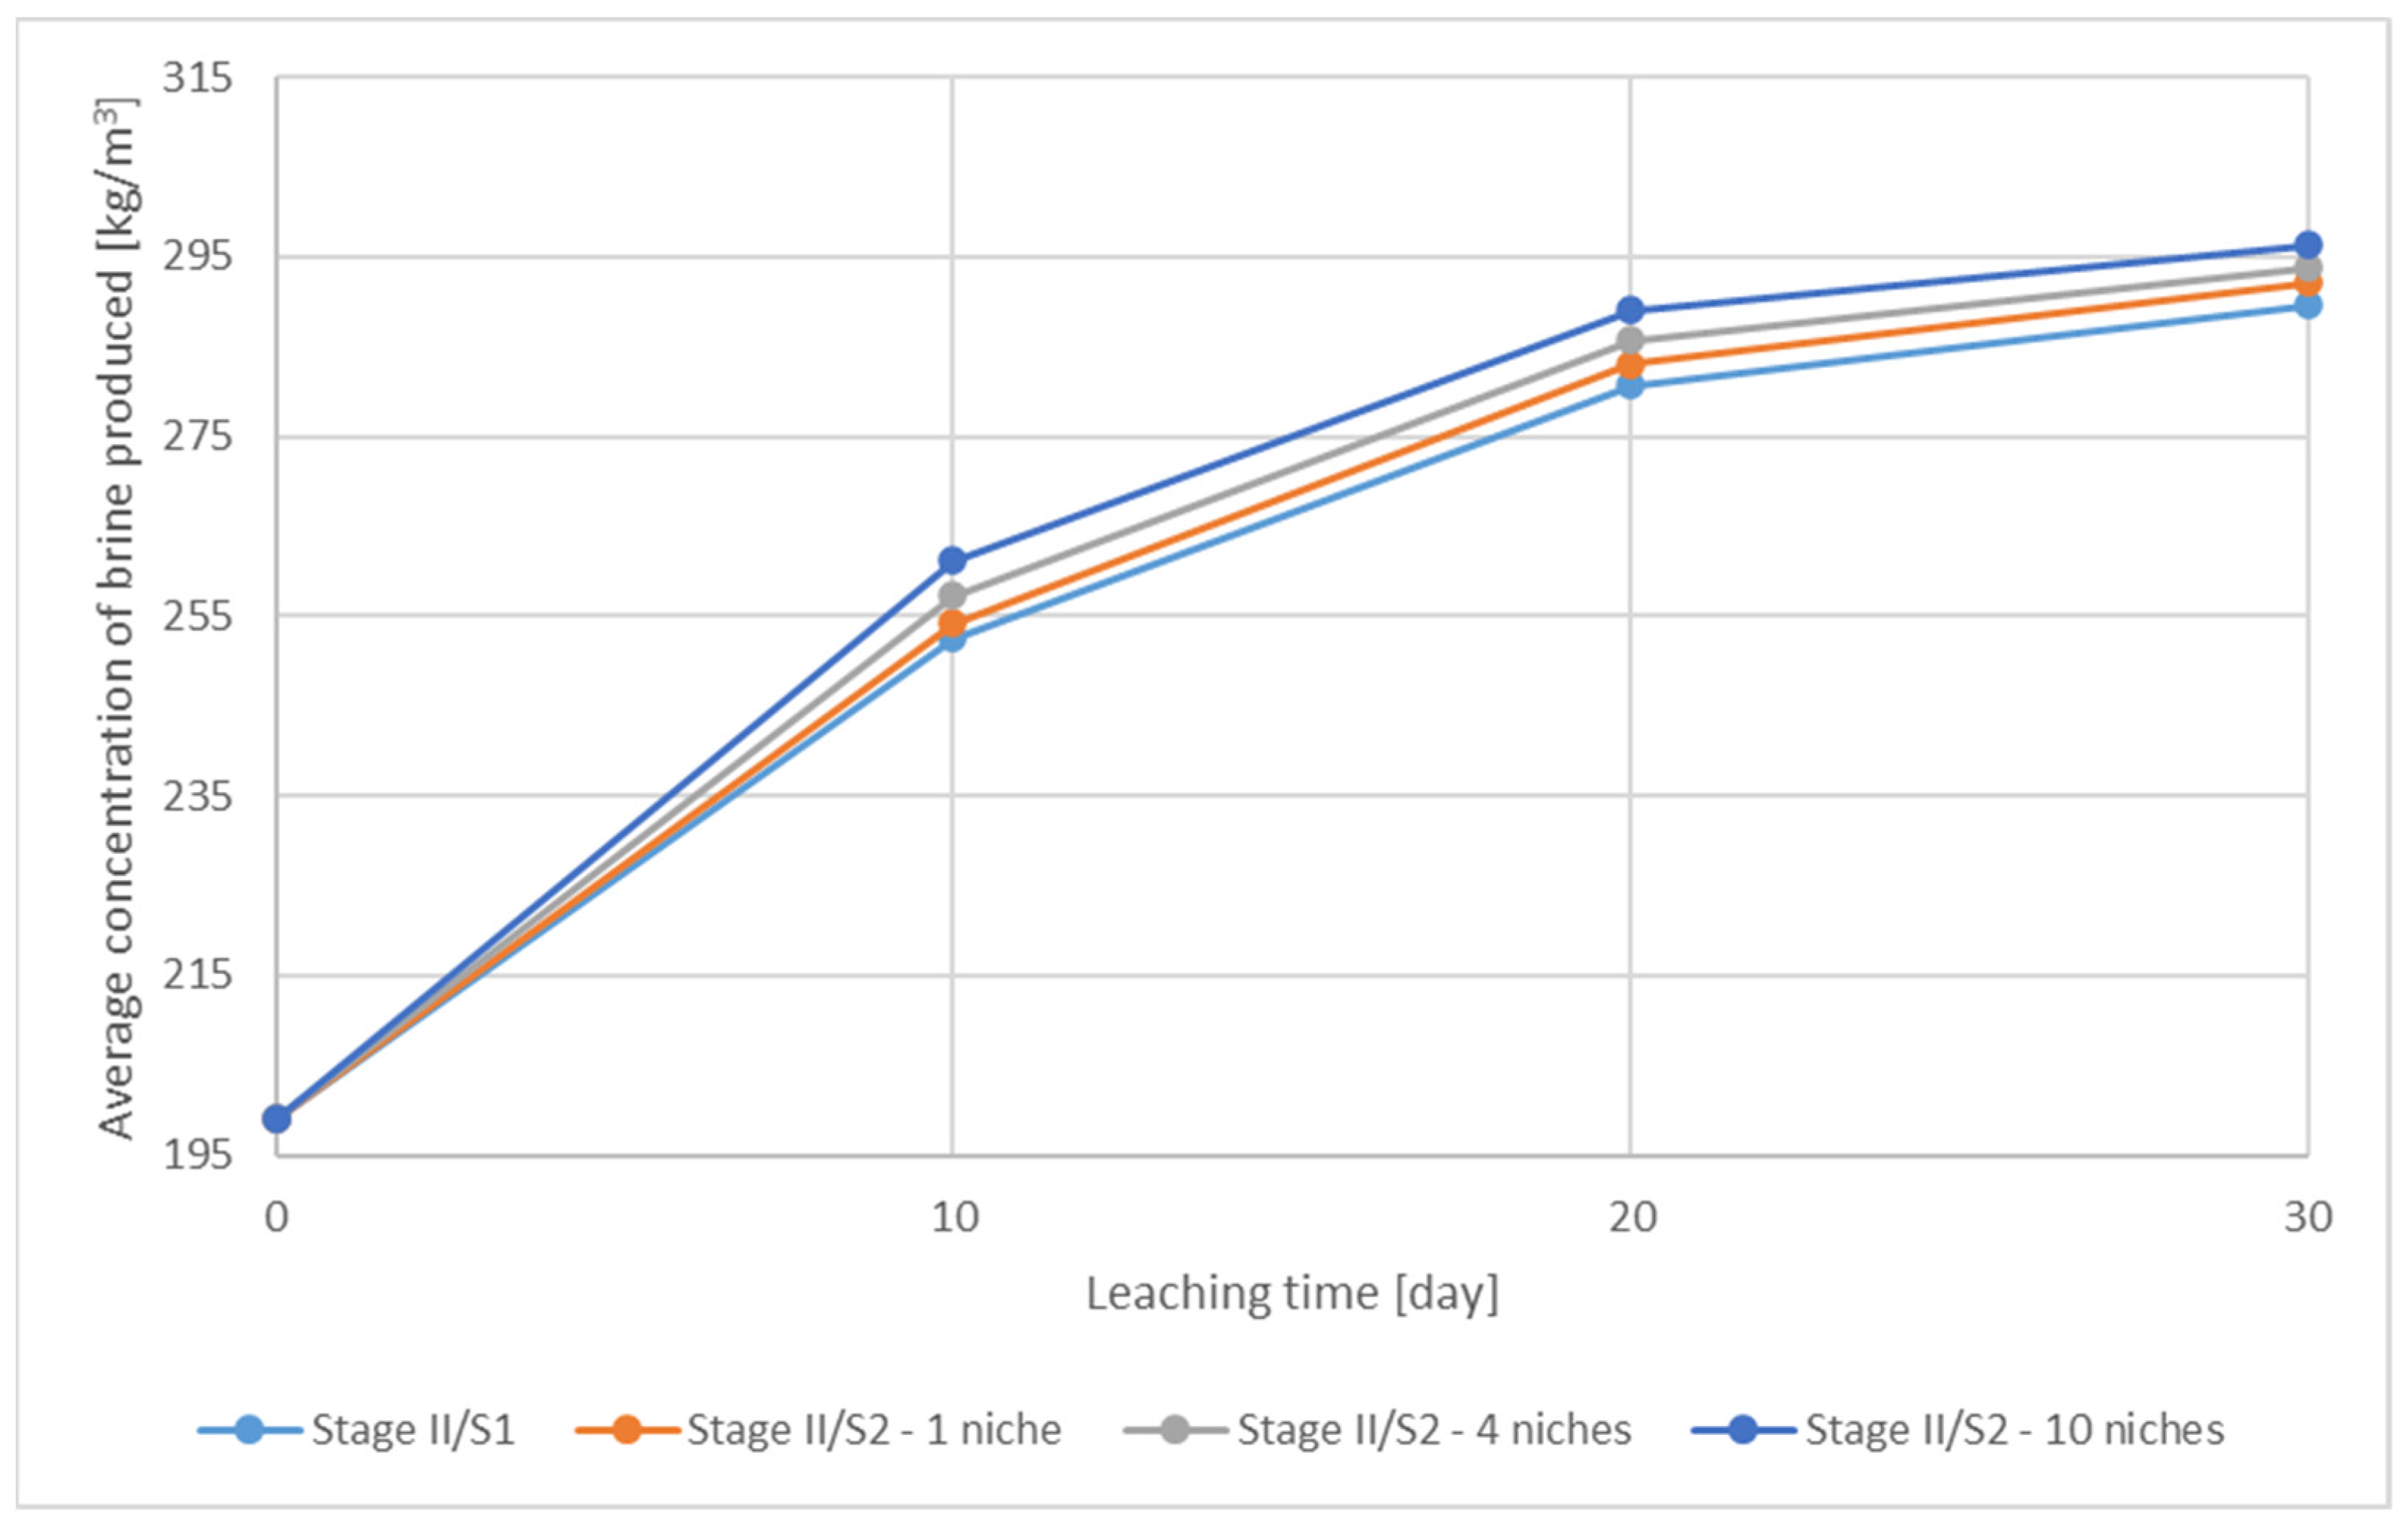
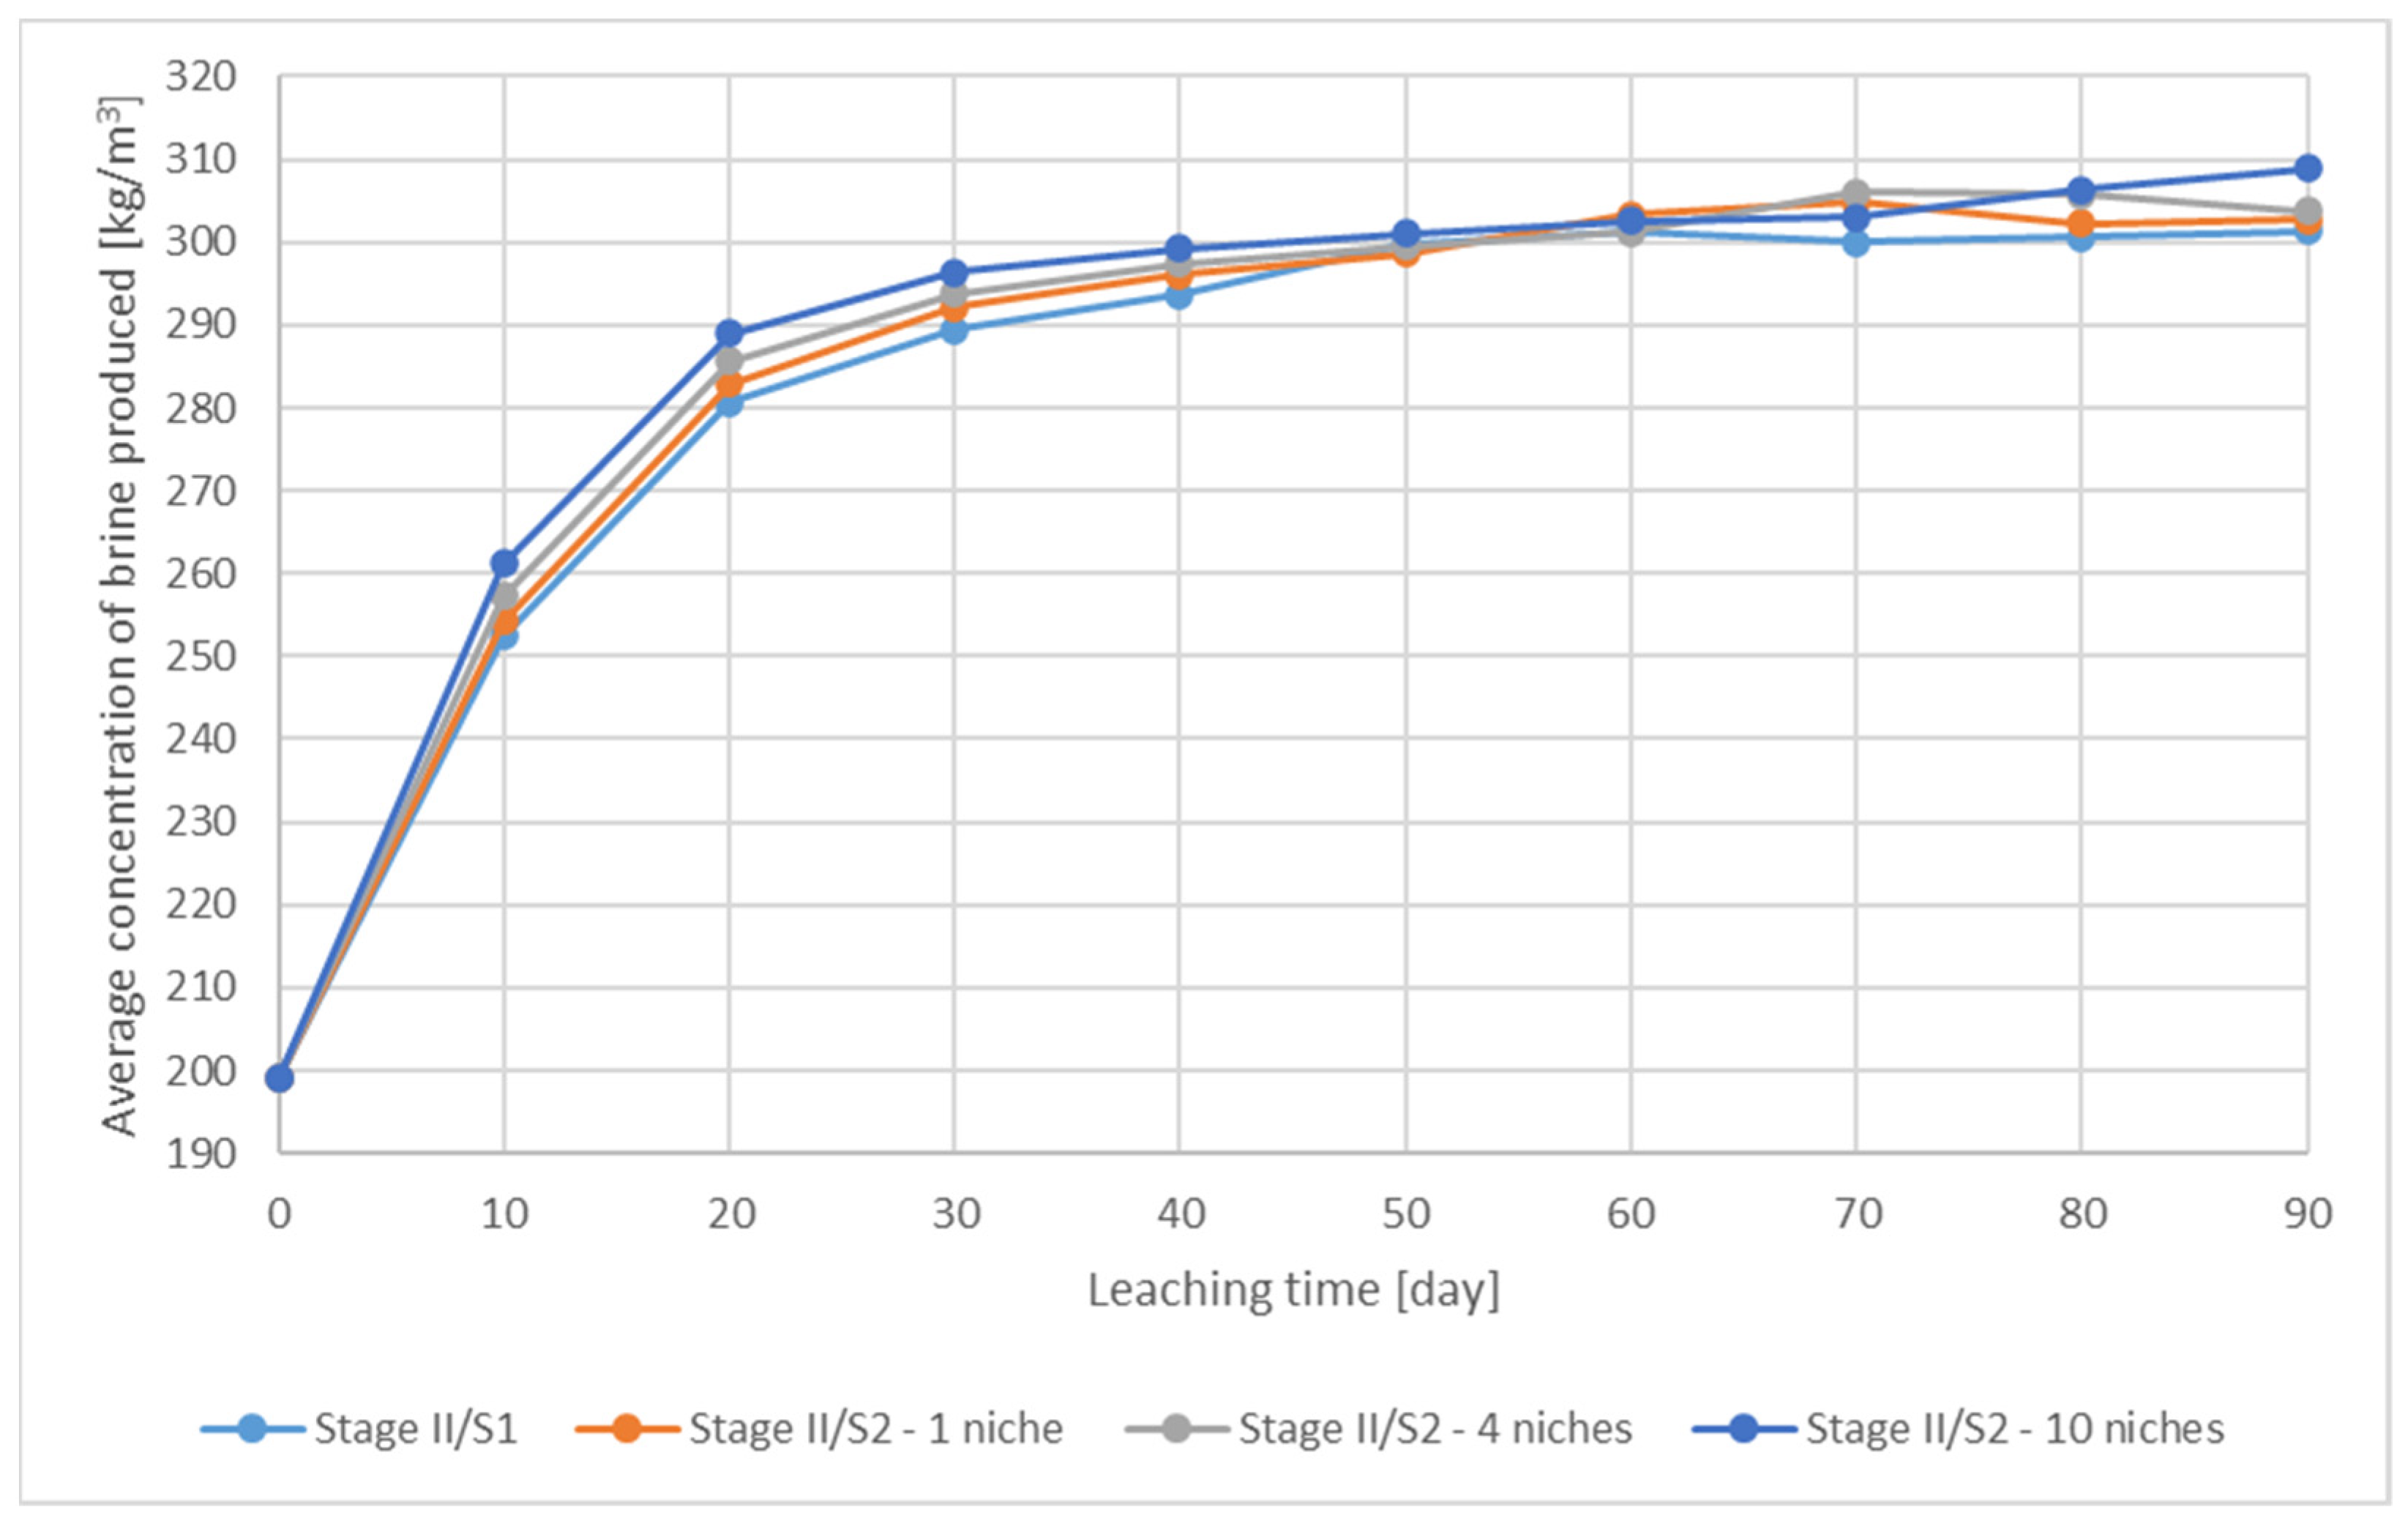
5.2.2. Change of Brine Concentration
During the first phase of the second stage of leaching (main chamber),
Figure 18 and
Figure 19, a gradual decrease in the rate of the increase in the brine concentration over time is visible, both in Scenarios 1 and 2. After about 40 days, it reaches a concentration of 290−300 g/L and then stabilizes at around 300 g/L. According to the industry standard [
31], saturated brine must have a concentration of 305 g/L. The software used to perform the simulation does not take into account the temperature difference between the chamber and the surface. The concentration is given for the conditions in the chamber, so it is actually higher. For this reason, it was assumed that the industrial brine would be considered to have a concentration greater than 300 g/L.
Table 6 shows the change in brine concentration at the end of each step of Phase I (column 9) and from the beginning of its leaching (column 10). The summary shows that for all phases I, which lasted 90 days, the semibrine concentration was 291 g/L and the maximum brine concentration obtained at the end of the leaching process was 301 g/L.
The greatest increase in volume occurs after the completion of Step 1 (the first 10 days of leaching), with the lowest half-brine concentration of all steps. This state of affairs results from the change in the direction of the leaching circuit from the direct to the reverse and raises the level of insulation after creating the groove next to the 80 m interval between the shoes of the leaching pipes, and then those formed during the supply of fresh water. In the sump, there was semibrine at the same concentration as at the end of its leaching; approximately 199 g/L for the classical sump. Thus, fresh water started to leach and became gradually saturated. Over time, the concentration increase stabilized depending on the size of the leached area (all steps of Phase I were performed with the same pumping capacity of water). During the period of intensive increase in the concentration of semibrine, more salt was leached; hence the increase in the chamber volume was greater than in the following steps. However, most of the salt remained in the chamber until the conditions stabilized there, so there was no visible increase in the amount of salt in the first step. The initial high concentration of the obtained brine resulted from the extruding of semibrine from the groove and part of the currently leached salt. It can be seen in the graphs that after 60 days of leaching in each of the simulations performed, a temporary decrease in brine concentration is observed, caused by the end of extruding the brine from the groove.
Analysing the data from the leaching process presented in
Table 6,
Table 8,
Table 9 and
Table 10, it appears that for the entire phase I of the phase of 90 days, the concentrations of semibrine for simulations with 1, 4, and 10 niches are: 293 g/L, 295 g/L, and 296 g/L, respectively, while the maximum brine concentrations obtained at the end of the basin leaching are: 303 g/L, 304 g/L, and 309 g/L.
In summary, it can be stated that the construction of the niches increased the concentration of the obtained semibrine in relation to the classically created I phase by 2 g/L (0.7%) for one niche, by 4 g/L (1.4%) for four niches, and by 5 g/L (1.7%) for ten niches, for the entire sump leaching step. The final brine concentrations are higher by 1.3 g/L (0.4%) for one niche, 2.3 g/L (0.8%) for four niches and 7.5 g/L (2.5%) for ten niches.
5.2.3. The Speed of the Execution of Phase I after Leaching the Sump
In the case of the leaching of the storage caverns, with the possibility of semibrine discharge, Phase I of the leaching process is similar to the other Phases of Phase II. This phase maintains the required pressures, preventing the connection between salt rock and the shoe of the last-cemented well column from being unsealed. In the case of half-brine saturation obtained from leaching, the duration of Phase I may be extended due to the reduced efficiency of the injected water, which results from the need to obtain higher concentrations.
In the operating caverns, obtaining the appropriate chamber diameter at the end of Phase I is crucial to obtaining saturated brine. In well-developed mining caverns, the leaching time of Phase I is not important as the semibrine will be saturated. Shortening the time to obtain the appropriate diameter will only reduce the costs of filling, which are not significant compared to the chamber’s service life (even over 20 years). Phase I leaching time is important in the case of new investments where it is not possible to discharge brine. In such a case, the caverns are leached with the obtained half-brine, which significantly extends the time required to obtain the appropriate chamber diameter, so that it is possible to continuously obtain saturated brine.
The duration of Phase I after the sump leaching is usually not a significant parameter for the leaching of the entire chamber because it does not exceed 2 months. For both scenarios, it is assumed that the execution time of Phase I will be 90 days. By comparing this value with the leaching time of the entire storage chamber,
Table 3, it can be concluded that the Phase I leaching takes about 11% of the total leaching time.
The time needed to complete the niche is not added to the leaching stage of Phase I of Stage 2. Based on laboratory tests [
7], it is not possible to determine the time of creating a niche, due to the large differences in the parameters of the cutting stream in the laboratory and the stream obtained in the technological well.
Leaching according to Scenario 2, i.e., with previously made niches, allows one to obtain saturated brine after approximately 40–50 days, compared to approximately 50 days, according to Scenario 1.
Table 7,
Table 8,
Table 9 and
Table 10, and
Figure 18 and
Figure 19. The construction of niches shortens the time needed to obtain brine with an industrial concentration by 10 days (20% of the time) using only 10 niches, due to which it is possible to finish the saturation of semibrine earlier or its discharge. However, taking into account the duration of the procedure, which for 10 niches is more than 10 days, such a procedure can be considered economically unjustified.
5.2.4. Meaning and Role of the Number of Niches
In Phase I of Stage II of chamber leaching, the slight improvement of the niches slightly improves the parameters of the leaching process. A noticeable effect is visible for one niche made just above the ceiling of the sump and for 10 niches.
By creating one niche just above the roof of the sump, it is possible to change the shape of the development of the chamber in such a way that the “tooth”, which is formed during the leaching in the left circulation, has been eliminated. Creating a larger number of niches reduces the effect compared to one because the lowest-placed niche uses semibrine with the highest concentration in the chamber, which translates into a smaller increase in the “dome” formed above the niche.
The implementation of ten niches shortened by 20%, the time to obtain saturated brine but the effect would be stronger if a larger number of niches or a wider range were used, which would involve an extension of preparatory activities and, consequently, an extension of Phase I leaching compared to the classical method. The niches also cannot be made at the stage of drilling the hole, as they will most likely tighten due to the rheological properties of the rock mass or be filled with insulation (e.g., solar oil) during the leaching of the sump.
Of both positive cases of creating niches, it seems more advantageous to make one niche above the roof of the sump, particularly when creating small storage caverns or caverns in onboard salt deposits with a small thickness. In such cases, it is most important to make a chamber with the largest possible capacity. Thanks to one niche, we obtain a better shape of the lower part of the chamber, increasing the capacity, without the need to extend the leaching time.
From analysing the development of the shape of the niches (
Figure 12,
Figure 13 and
Figure 14), it can be seen that for the first three steps in the leaching, top leaching dominates, while over time it turns into top-side leaching, where both directions have a similar share in the leaching, creating a characteristic dome, the basis of which is the originally made niche. Continuing the leaching, the individual domes would merge, and the leaching would already take place throughout the salt interval provided, with the dominant effect of lateral leaching.
The height of the niche does not matter for the leaching process itself, but it must be large enough so that it does not tighten due to salt creeping before starting the leaching. The greater the extent of the niche, the more effective the leaching process will be, because of the higher rate of top-side leaching than side leaching.
6. Technological Conditions for the Implementation of Innovative Technology
The tests performed confirmed that the proposed method to increase the efficiency of the leaching of caverns in salt deposits can be used in both storage and exploitation caverns. Both types of caverns are made for different purposes, so different leaching parameters are important for design purposes.
The storage caverns should be leached out quickly, and their volume should be as large as possible within the prescribed interval of the depth of the salt deposit. The essential parameter during the leaching of the mining caverns is the brine concentration of the obtained brine and the maximum use of the deposit.
The production of niches in the leaching hole for the leaching of storage caverns brings the following benefits:
Shortening the time of Stage I—leaching the chamber sump, and thus reducing the cost of its implementation;
A better shape of the lower part of the sump, allowing for more effective use of the salt interval and, consequently, increasing the active capacity of the chamber, which in the case of a larger number of caverns results in a significant increase in storage capacity;
The easier saturation of semibrine obtained from the groove leaching (in the case of its discharge being impossible), due to the high concentration of the obtained semibrine.
For exploitation caverns, the most positive effect of using niches is the improvement of the shape of the chamber in the zone directly above the sump and the elimination of the so-called “tooth” that forms during the leaching after Stage I is completed.
Bearing in mind the above positive effects of using the technology of cutting niches in the hole, it is proposed to use this technology in particular for:
The leaching of storage and exploitation caverns;
The leaching of storage caverns in low-thickness salt beds;
The leaching of small storage caverns, particularly for hydrogen storage;
The leaching of the first mining caverns in new investments where the discharge of semi-salt or its addition is difficult.
Due to the time needed to create niches and the manner of their implementation, they are most efficiently performed at the stage of drilling. As it results from the simulations carried out, one niche allows for the improvement of the sump leaching parameters, therefore this technology can be used for the sump leaching of all storage and production caverns.
In the seam, salt deposits of a small thickness, caverns with a small volume and a more advantageous shape of its lower part can be made. Consequently, a greater active storage capacity is obtained. This is all the more important as the economy has increasingly shifted to renewable energy sources, related, inter alia, to the need to store hydrogen. Work on the technology of hydrogen storage in salt caverns has been carried out in Poland and around the world for several decades [
33,
34].
Hydrogen storage caverns can be built in many locations in Poland, but the Baltic region is the most promising area [
35]. There is an extensive salt bed of varying thickness and numerous wind farms in this area. Natural gas storage caverns are located on this bed. Because of the high density of hydrogen storage, such storage caverns can be formed as individual ones. The use of cutting niche technology increases the volume of the sump which, in the case of small storage caverns, allows for a significant increase in the active storage capacity (the share of the volume of the sump in small caverns is much greater than in large ones).
In deposits with a small amount of insoluble parts, in the sump leaching zone, it is possible to obtain industrial brine just a few weeks after the leaching plant was launched. This would eliminate the need to saturate the semibrine obtained from the sump leaching stage for a period of several months. Such a solution favours new investments (there are plans to build production and storage caverns) for which it is difficult to supplement semibrine or its discharge. Such a solution would allow for a reduction in investment costs because the start-up of such an investment is much shorter and it can sell industrial brine both from storage and service caverns after a relatively short time.
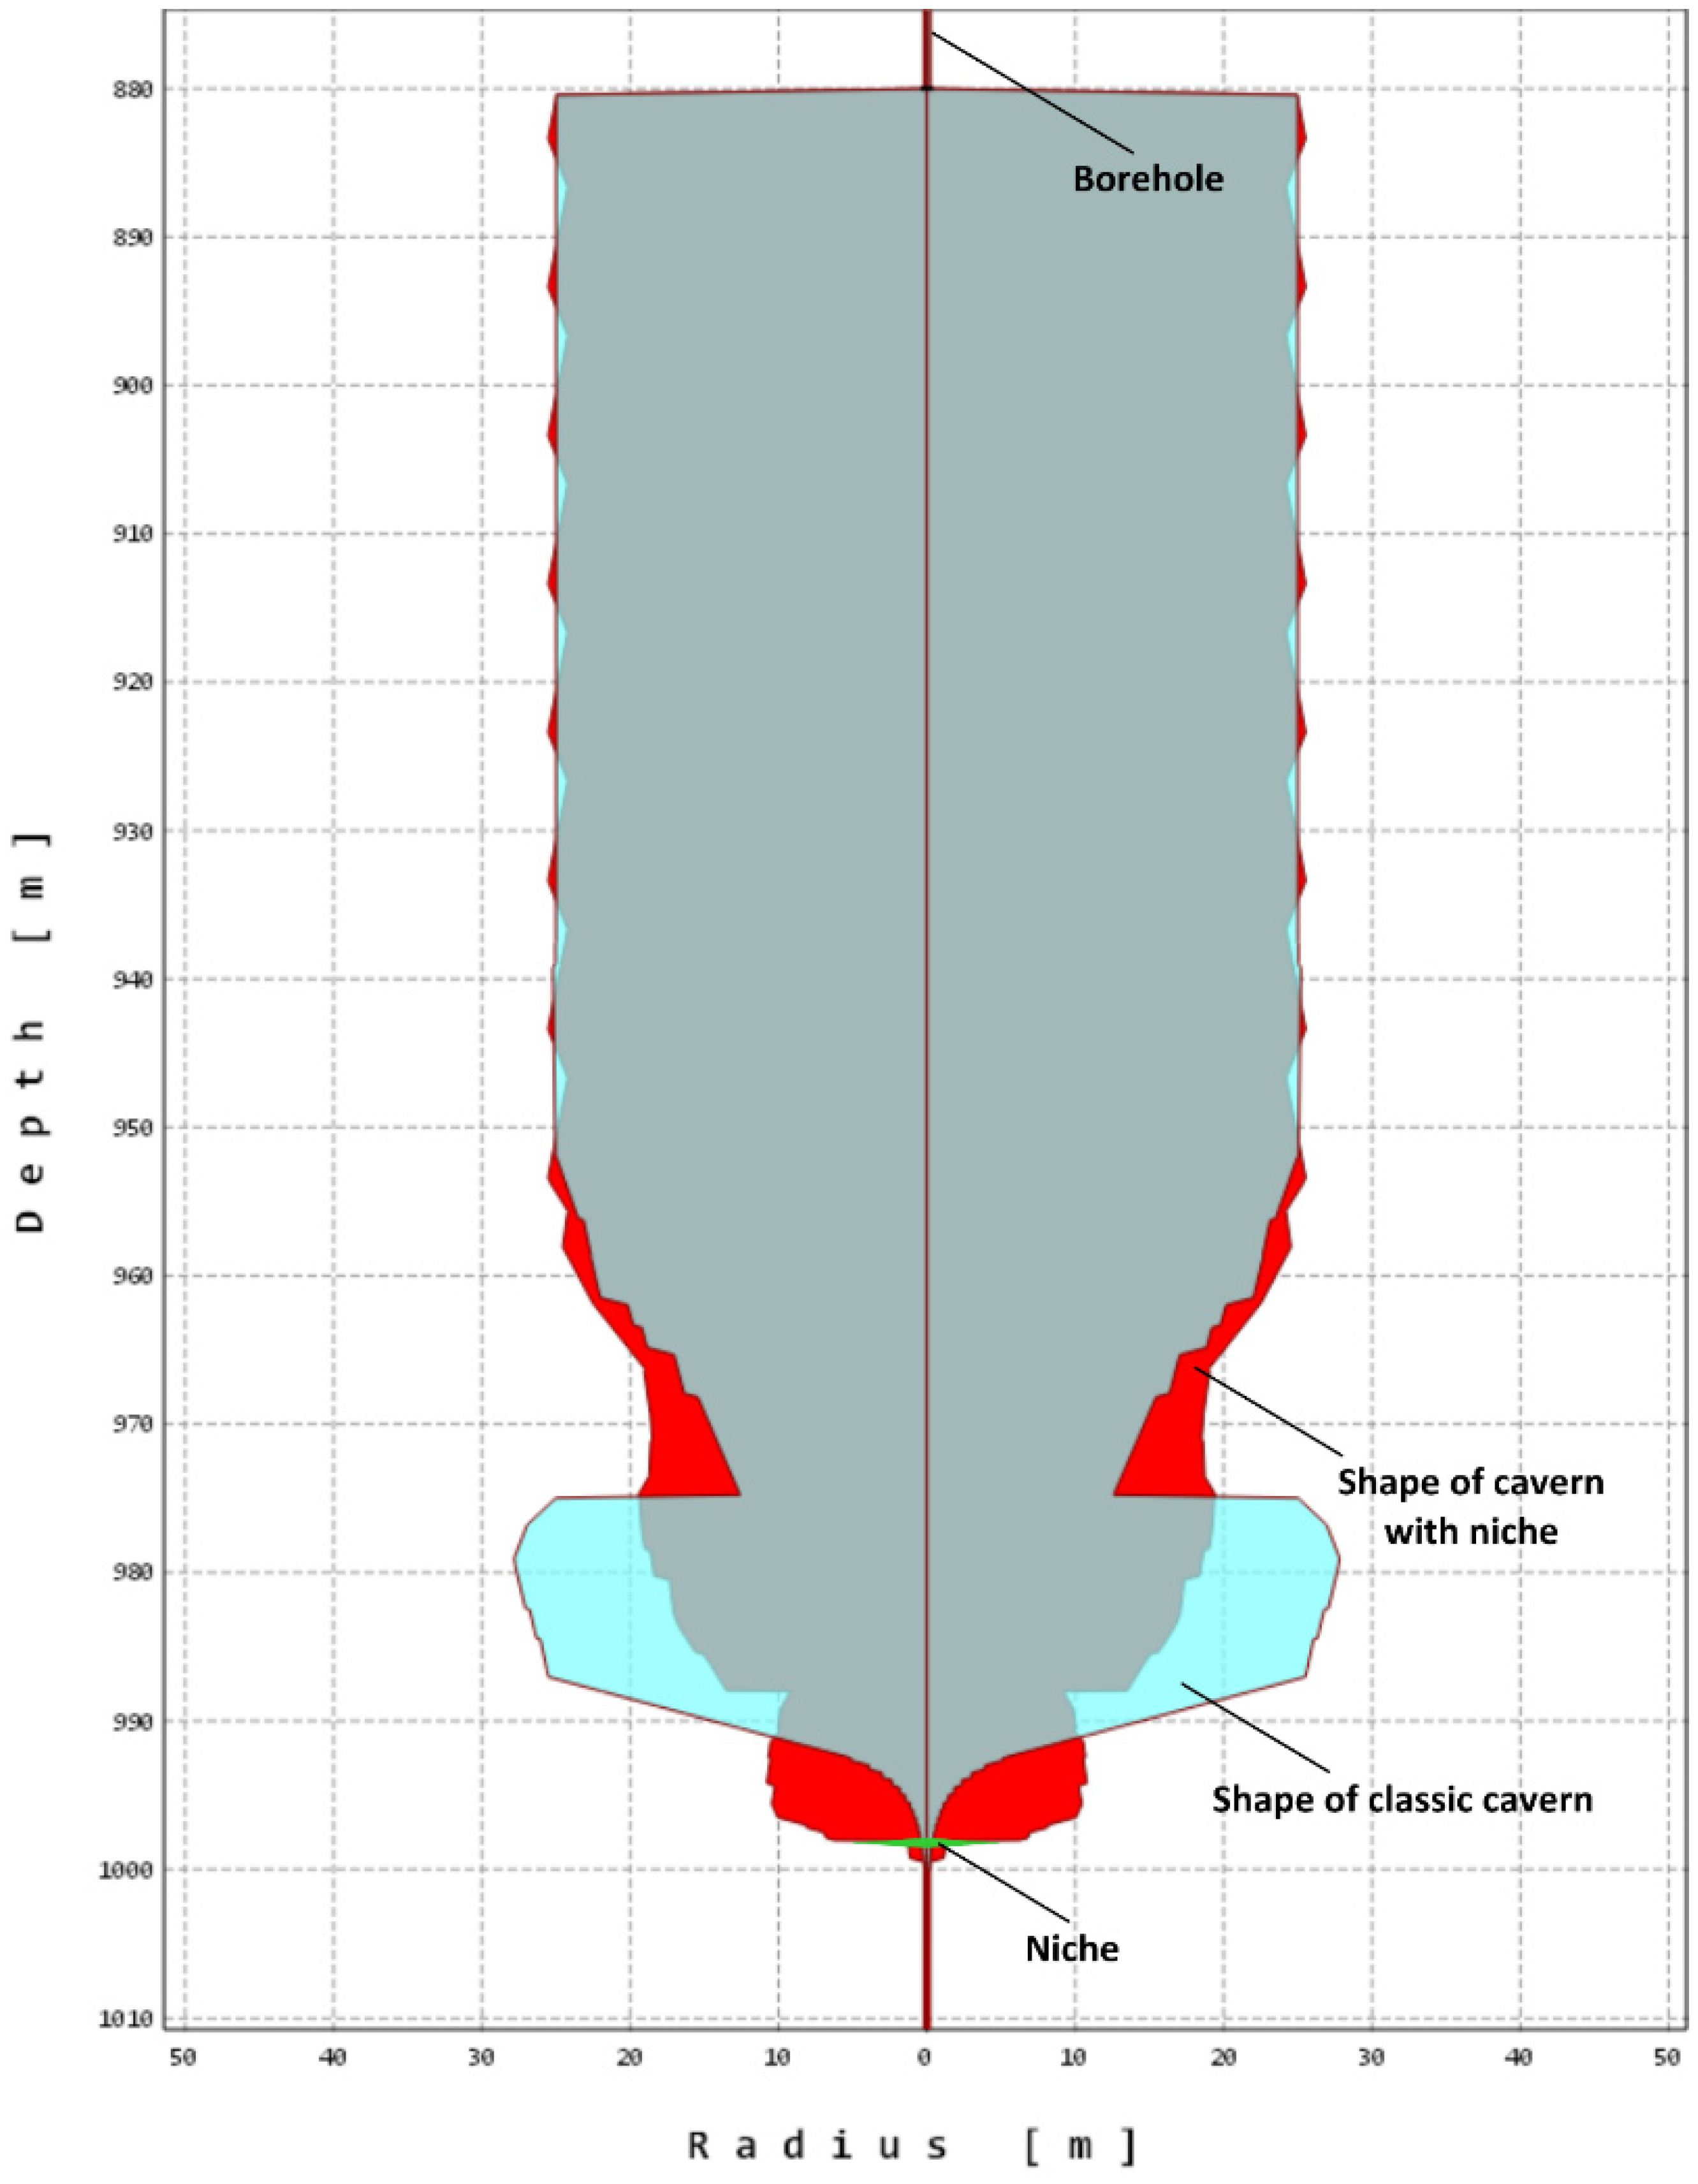
Figure 20 compares the shapes of the chamber zone with a height of approximately 100 m, made by the classic method (blue) and the chamber made with the use of niches (red). Both caverns leached to a diameter of 50 m in their upper zones.
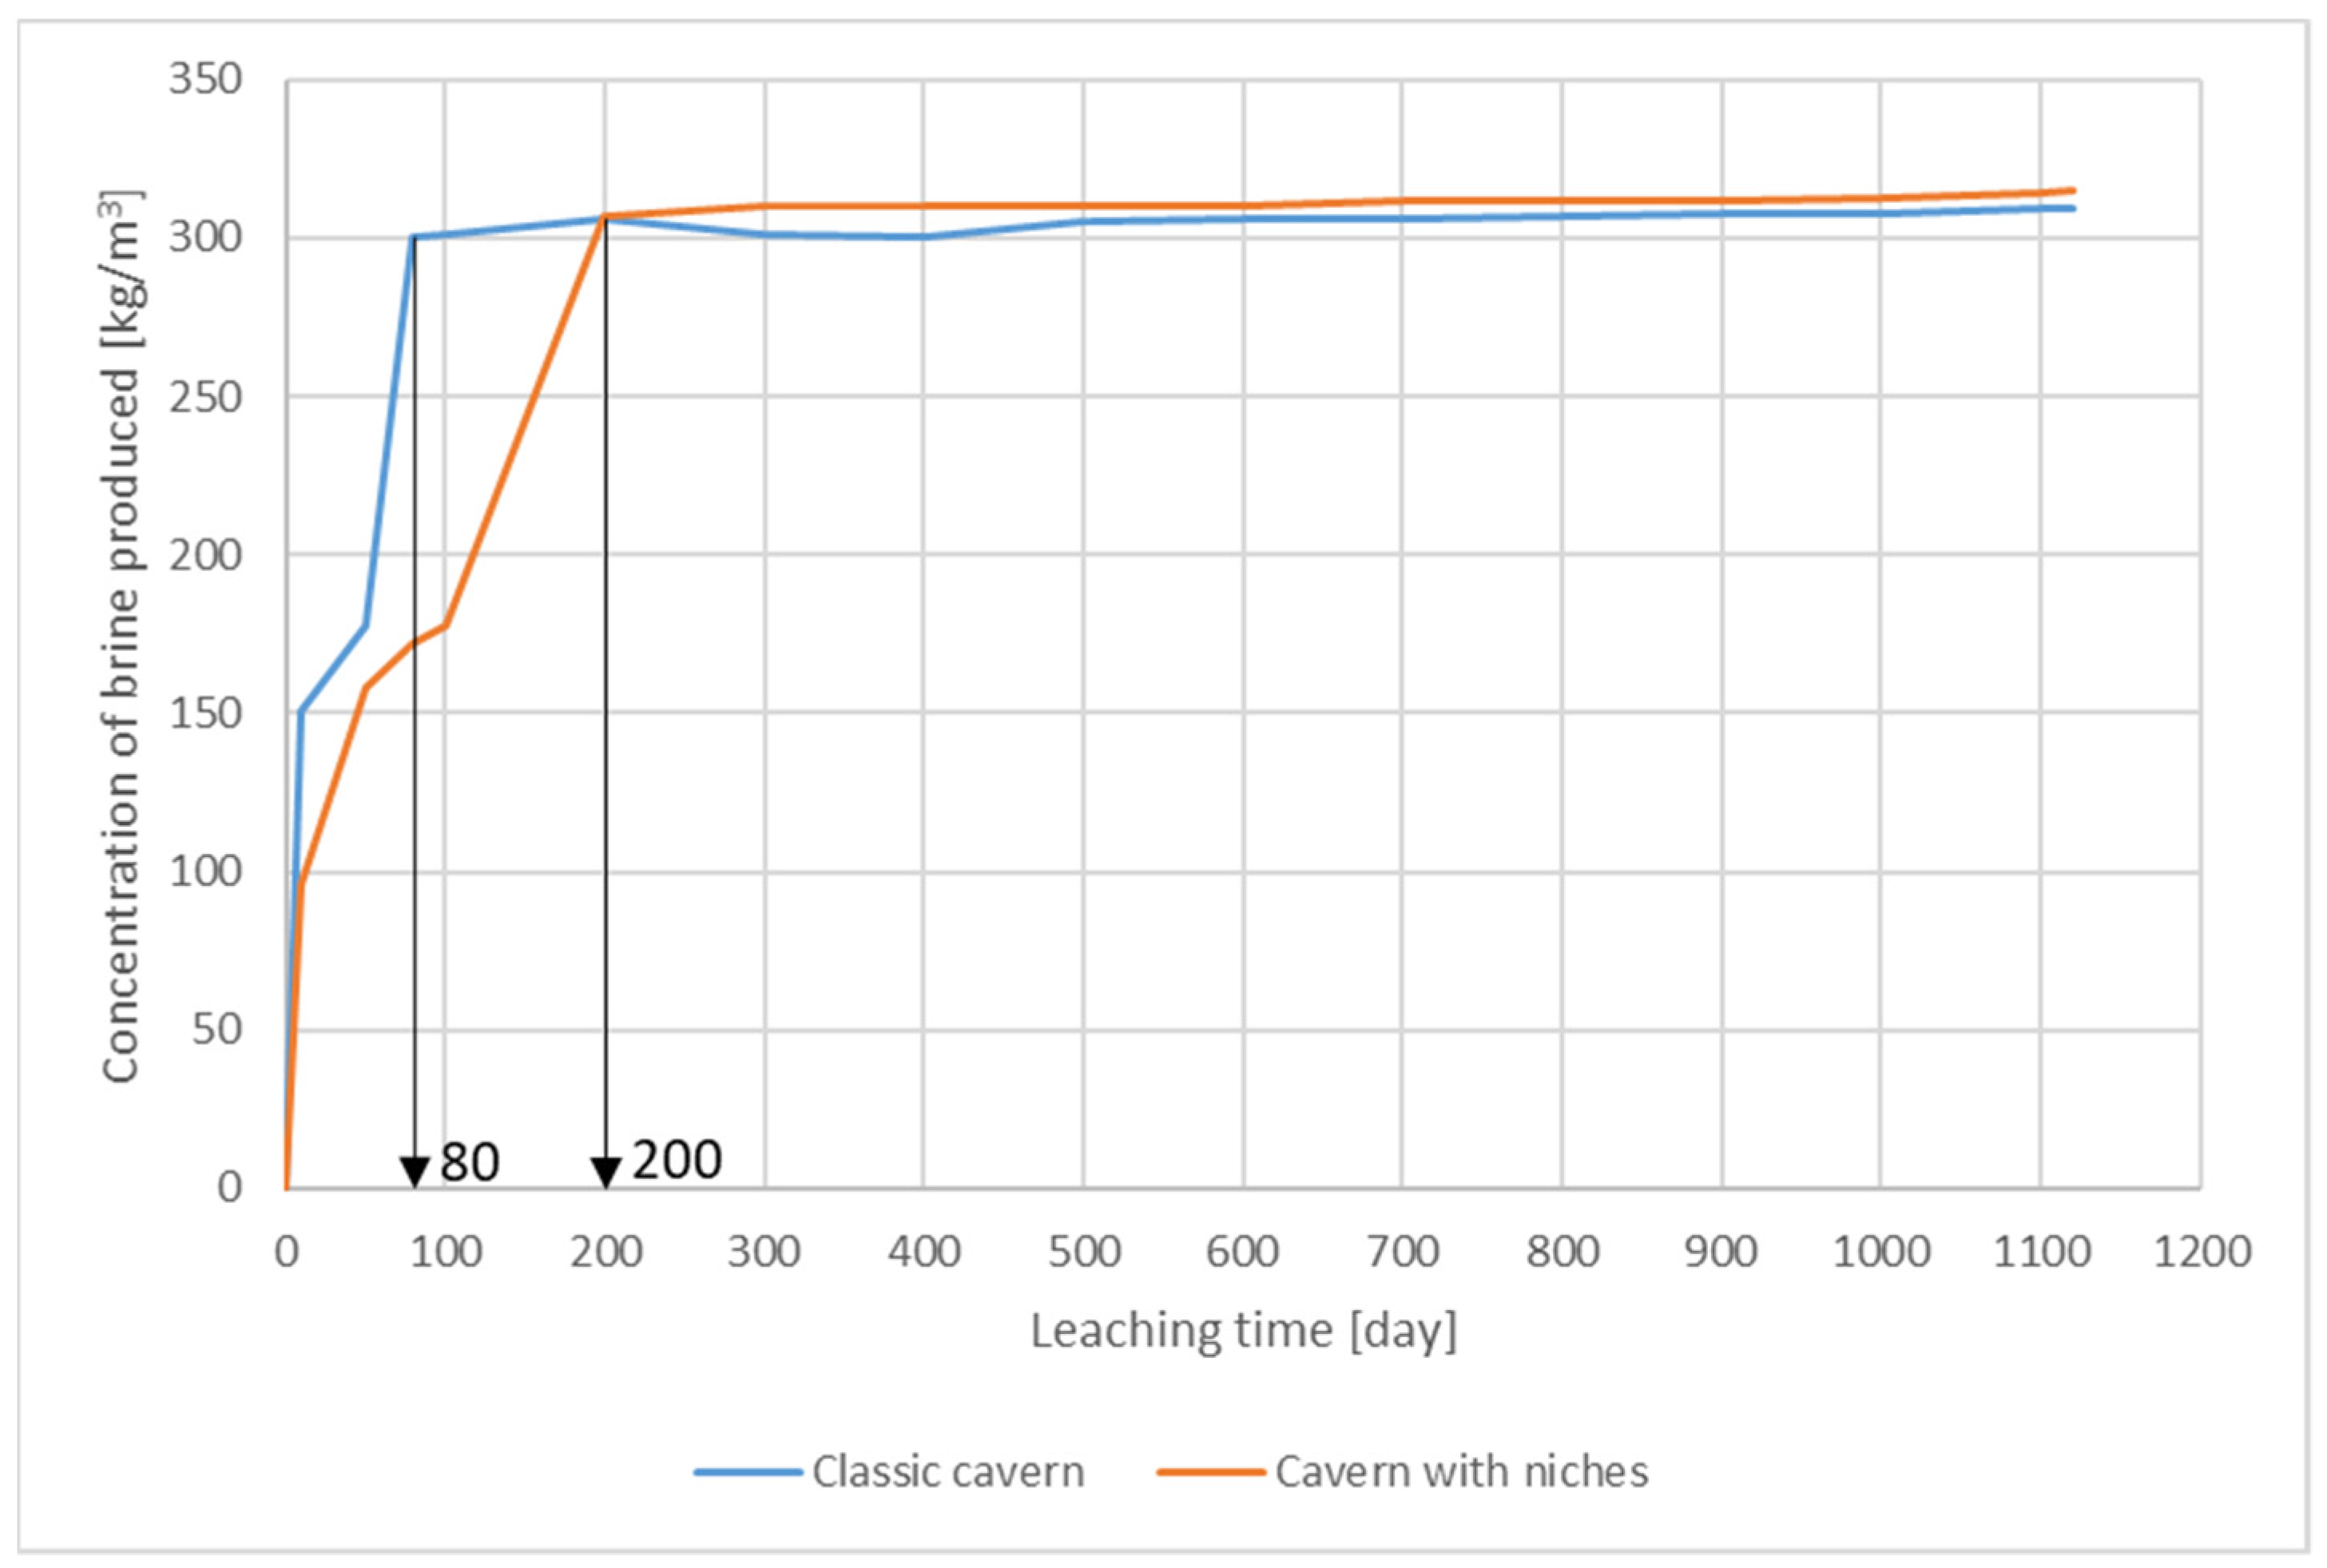
Table 11 shows the leaching results for both caverns and the graph (
Figure 21) shows the change in the concentration of the brine obtained.
The main difference between the methods of the leaching of mining caverns is the time taken to obtain industrial brine. In the case of the chamber in which the niches are made before the leaching began, industrial brine was already obtained on day 80, while for the classic leaching chamber, such brine was only obtained after 200 days. The other parameters are similar to each other.
7. Conclusions
In view of the increasing demand for storage space for hydrocarbons or hydrogen, related to the intensive development of renewable energy and the need to support it, measures are taken to improve the conditions and efficiency of storage techniques. The research conducted confirms the possibility of modifying the technologies that have been used to create underground caverns by the leaching of salt deposits. The proposed method accelerates the pace of obtaining the designed cavern and a more favourable shape, from the point of view of the long-term use of caverns. Based on the multivariate analyses of numerical models and the results of the simulation of the shape development of the caverns made according to the modified technology as a result of the prior execution of appropriate niches, the following conclusions can be drawn:
Making niches in the well before leaching has a positive effect on the cavern leaching process;
Making niches in the leaching well, from the economic point of view, provides the best results for the first stage of the leaching, i.e., the sump;
Making niches for Phase I after leaching the sump is not economically justified because the positive effect (shortening the time taken to obtain industrial brine) is completely eliminated by cutting out the niches;
In stage I (leaching of the cavern sump), creating the niches increases the final volume of the sump by about 17% and improves the shape of its lower part;
The construction of the niches increases the semibrine concentration of the obtained semibrine in the stage of sump leaching by at least 15% compared to the classically leached groove;
In stage I (sump leaching), with the use of one niche, after the first 30 days of leaching, the rate of growth of the sump capacity as a result of classic leaching is approx. 55% (up to 56.6 m3/day).
The leaching parameters of the chamber are improved by implementing a properly placed niche.
It is necessary to carry out a series of studies to determine how the parameters of the niches influence each other so that the arrangement of the niches and their dimensions can be properly designed before leaching begins.
A single niche should be designed in the lower zone of the chamber to maximize its advantages.
The foundation and parameters of the niches should be designed by considering their lithological profile.


