Article

Evaluation Method for Winding Performance of Distribution Transformer

1
College of Science, Kunming University of Science and Technology, Kunming 650504, China
2
College of Mechanical and Electrical Engineering, Kunming University of Science and Technology, Kunming 650504, China
*
Author to whom correspondence should be addressed.
Energies 2021, 14(18), 5832; https://doi.org/10.3390/en14185832
Submission received: 28 July 2021 / Revised: 3 September 2021 / Accepted: 10 September 2021 / Published: 15 September 2021
(This article belongs to the Topic Power System Modeling and Control)

Abstract

:
In order to ensure the safe and stable operation of a power system, the performance evaluation of transformer windings after a short-circuit test can predict whether the windings are deformed in order to provide a useful reference for the operation and maintenance of the power sector. This paper proposes a method for evaluating the performance of transformer windings in order to improve the overall effectiveness of a winding evaluation. The index data obtained based on a short-circuit impedance method, frequency response method, and oscillation wave method are used in the algorithm proposed in this paper. First, the transformer winding performance evaluation index system is constructed. Second, the weight of each index is determined by analytic hierarchy process, and then the fuzzy comprehensive assessment method is introduced, and the fuzzy evaluation matrix is established, the evaluation results are calculated using the evaluation formula. Finally, the maximum membership principle is used to determine the performance level of the transformer winding on the evaluation results, and the evaluation results of the transformer winding state are obtained. The example shows that the evaluation level of the measured transformer winding performance can be obtained by this method as “good”. Compared with the traditional method, this method can simplify the evaluation while maintaining higher accuracy.

1. Introduction

A distribution transformer is one of the most core equipment in a distribution network; its main function is to transfer power and convert voltage [1] throughout the entire distribution network. Its performance affects the safe and stable operation of the distribution network [2,3]. According to the statistical data of the National Bureau of Statistics, the annual output of distribution transformers in China has maintained a growth rate of about 8% in the past five years; the number of distribution transformers is increasing. With the increase of distribution network scale and equipment capacity year by year, the operation problem of distribution transformers is increasingly prominent. The failure rate of the sampling distribution transformer short-circuit test in the South China Grid from 2012 to 2018 is 43.73%, which will not only cause significant economic losses, but also affect the stable operation of power. Therefore, it is urgent to develop several transformer condition monitoring systems and fault diagnosis techniques to identify the critical degree of transformer health and its remaining life [4].
At present, the transformer evaluation after short-circuit test needs a hanging inspection, and the hanging inspection will consume huge manpower and material resources [5]. There is no unified standard for a winding quality evaluation after transformer short-circuit test, according to the national standard GB1094.5-2008: Transformers can withstand external short-circuit thermal and dynamic stability without damage. However, no quantitative standard threshold judgment is given for the definition of non-damage [6,7]. Therefore, evaluation of the integrity of the transformer windings after a short-circuit test has gradually attracted people’s attention [8].
Domestic and foreign scholars have performed considerable research on transformer winding fault diagnosis. In 1966, Poles proposed the low voltage pulse method [9], by comparing the waveform of the input signal and the output signal, it can detect whether the transformer passes the short-circuit test. However, this method is vulnerable to interference and has weak repeatability; the short-circuit impedance method [10] is used to determine whether winding deformation occurs by measuring the short-circuit impedance value of the transformer. This method is simple and easy to operate and has been included in the standard. But the detection sensitivity is low, and it is difficult to detect the slight deformation of the winding. Canadian expert E. P. Dick proposed the frequency response method [11] to determine the winding deformation by measuring the response characteristics of the winding network. It has become an accurate and effective method through numerous significant works [12,13,14,15,16,17]. This method is sensitive to slight winding deformation but susceptible to uncertainties. Since then, many other scholars [18,19] have conducted extensive work in this field> The vibration analysis method [20,21] uses the vibration sensor attached to the tank to obtain vibration characteristics to determine whether the winding is deformed. However, for high-power transformers, Saponara et al. [22] used a distributed measurement node network of the system to diagnose mechanical stress based on vibration. Wu zhenyu, a Chinese scholar, proposed the oscillation wave method [23] to realize the performance evaluation of transformer winding without sling by establishing the corresponding relationship between the oscillation wave index and the internal parameters of the system [24,25,26,27]. This method has a strong anti-interference ability and good repeatability, but it is difficult to detect slight deformations.
Different methods have different response and sensitivity to winding faults, such as slight deformation, moderate deformation, heavy deformation, short-circuit, and broken circuit. Based on this, the winding evaluation methods are: short-circuit impedance method [10], frequency response method [11], and oscillation wave method [23]. In this paper, the short-circuit impedance method, frequency response method and oscillation wave method are used to evaluate transformer winding. To evaluate the performance of distribution transformer winding after a short-circuit test, and in-depth study of the mechanism of this methods and finding the appropriate indicators will be performed.
In summary, in order to more accurately, reliably and effectively evaluate the performance of transformer winding, ensure the quality of transformer products, and maintain the safe and stable operation of distribution network, research on the winding performance evaluation method of distribution transformer based on short-circuit test is of great significance.

2. Methods and Experiment

2.1. Theoretical Basis of Evaluation Method

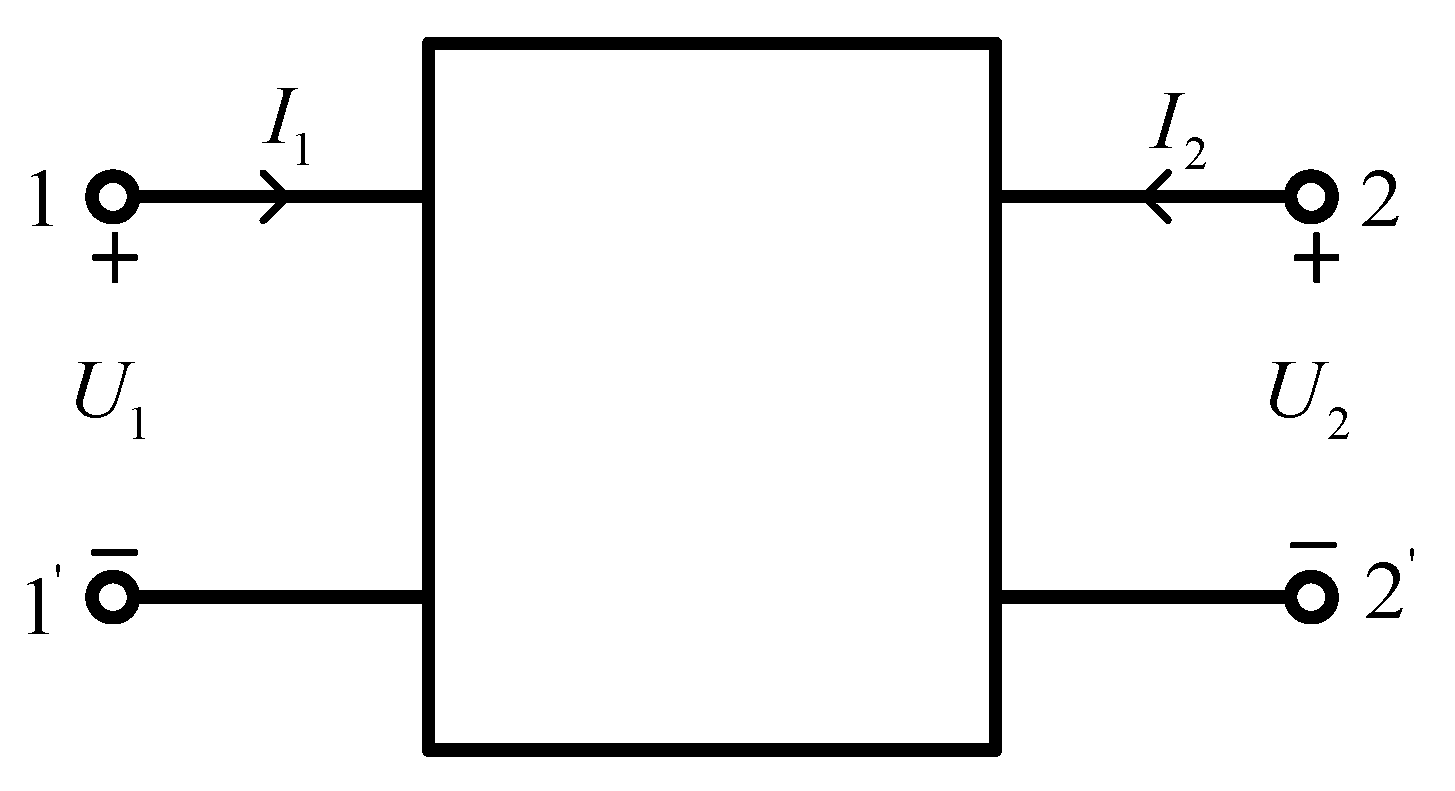
2.1.1. Measurement Principle of Transfer Function Method

When the transformer passes the short-circuit test, the performance evaluation of the transformer winding must be conducted. At this time, the transfer function method plays an important role [28]. The degree and type of transformer winding faults can be classified by extracting the corresponding parameters in transfer function [29]. At high frequency, the magnetic resistance of transformer iron core is almost equal to that of air. At this moment, R L C of transformer winding itself constitutes a two-port network, and the transfer function H ( j w ) is expressed as the transfer characteristics of the two-port network. When the transformer winding state changes, the R L C parameters in the transformer system are affected, and the transfer function is also changed. Thus, as long as the difference of transfer function before and after short-circuit test is compared, the internal situation of transformer can be understood, to realize the performance evaluation of transformer winding.
Two-port network means a network with a pair of input ports and a pair of output ports [30], as shown in Figure 1, satisfying:
I 1 = I 1 , I 2 = I 2
I 1 and I 1 are the currents at port 1 1 , the same as I 2 .
If there is no power inside the network, and only R L C is included; the network is a passive linear two-port network.
When using a two-port network to analyze a circuit, after determining the parameters that characterize the two ports (such as voltage and current), these parameters can be used to compare the performance of different two ports in transmitting electrical energy and signals, to evaluate their quality.

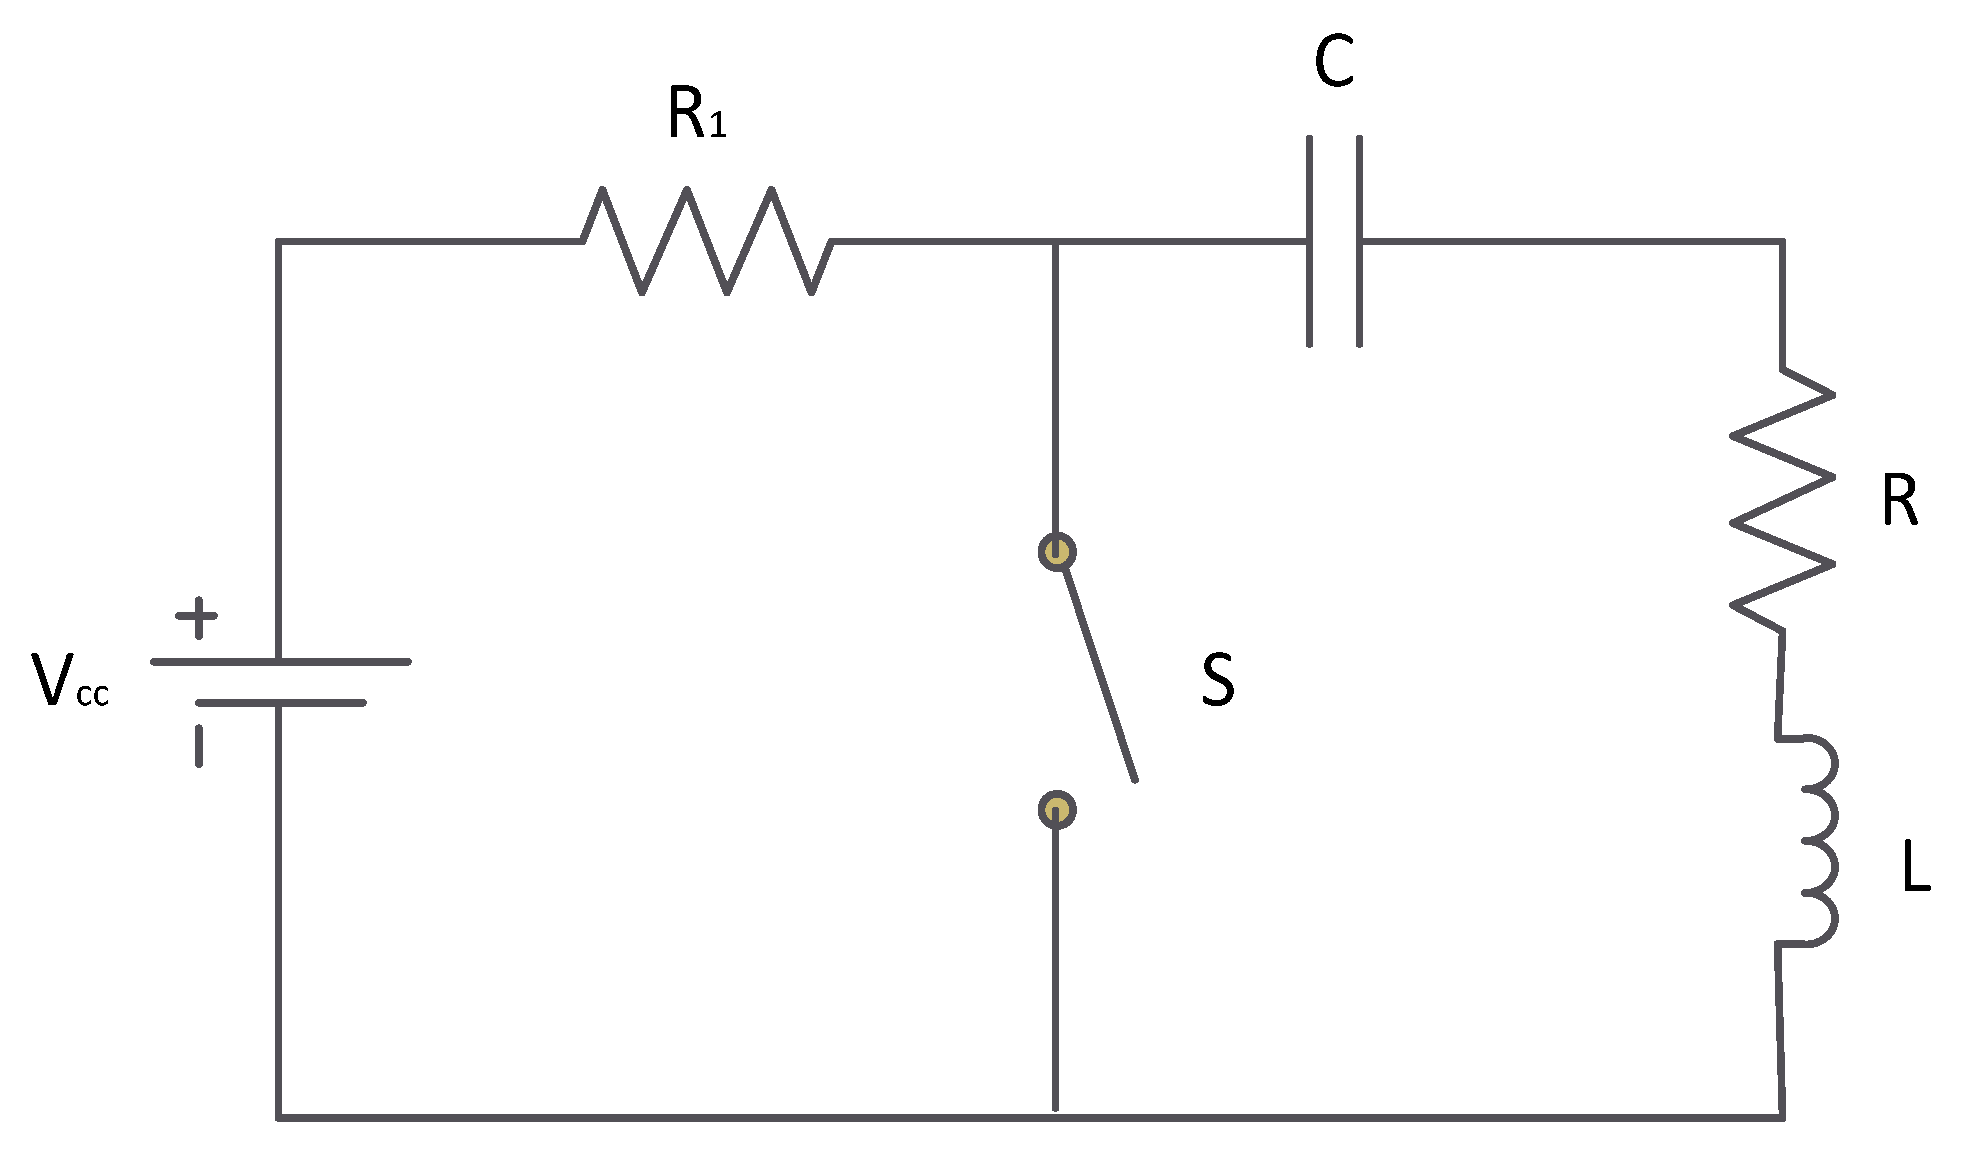
2.1.2. Transformer Equivalent Circuit Model

When the transformer winding is excited by a high-frequency voltage signal with a frequency greater than 2   kHz , the permeability of the inner core of the transformer is almost the same as that of the air medium, and the role of the core can be ignored at this time. Therefore, the entire winding of the transformer can be seen as a distributed parameter network composed of resistance, inductance and capacitance [31,32]. Figure 2 shows the equivalent circuit diagram of the n-level distributed parameter network studied in this paper. In Figure 2, L n and R n represent winding inductance and resistance respectively, n = 1 , 2 , 3 , C s n and R s n represent intercake or interturn capacitance and conductance, respectively, C g n and R g n represent earth capacitance and conductance of winding, respectively. The physical structure and insulation materials of the transformer determine the R L C parameters in the equivalent circuit. When the transformer winding is deformed or short-circuited, the value of R L C will change, such that the transfer function will also change.

2.1.3. The Calculation of Circuit Parameters in the Model

The key to the model parameter calculation of a power transformer is the distribution parameter calculation at high frequency [33]. To analyze the specific calculation process of the dielectric constant, distributed capacitance and distributed inductance parameters in the simplified equivalent model of transformer windings, we can use simulation software to build a distributed parameter network and perform circuit simulation on transformer windings. By changing the parameters of the equivalent circuit of the windings, we can simulate the transformer windings with different degrees of deformation and different types of faults, in order to evaluate the windings.
  • Calculation of dielectric constant.
The insulation medium of transformer capacitance between cakes is mainly the insulation of different potential parts of the same winding; thus, the equivalent dielectric constant calculation of capacitance between cakes:
ε d e = a d a 0 ε 0 e + a p ε p
In the form: a d is the insulation thickness between cakes; a 0 is the width of the oil channel; a p is the thickness of wire cake insulating paper; ε 0 e is the equivalent dielectric constant; ε p is the dielectric constant of insulating paper.
The equivalent dielectric constant ε w e of the main insulation gap between windings can be calculated according to the following formula:
ε w e = a w d w [ a p ε p d p + a o ε o e d 0 + a p b ε p b d p b + ]
In the form: a w is the main insulation distance between windings; d w is the average diameter of the main channel between windings; a p d is the thickness of each panel between windings; d p is the balanced diameter of the innermost layer of the outer winding and the outermost conductor turn insulation of the inner winding; ε p d is the oil gap dielectric constant between two windings; d 0 is the average diameter of each oil gap between windings; d p d is the average diameter of each panel between windings.
2.
Calculation of distributed capacitance.
Because the winding and the iron core are similar to the arrangement of coaxial cylinder, the capacitance C g w between the innermost winding and the iron core is [34]:
C g w = ε 0 π D m H ( t o i l ε o i l + t s o l i d ε s o l i d )
In the form: D m is the average diameter between two windings; t o i l is the thickness of oil between two windings; t s o i l d is the thickness of solid insulation between two windings; H is the average height of winding.
The capacitance between cylindrical conductor and ground is:
C = 2 π ε H cosh 1 ( s R )
In the form: R is the radius of cylindrical conductor; s is the distance from the center of the cylindrical conductor to the ground plane.
Therefore, the capacitance between the outermost winding and the fuel tank is:
C g t = 2 π ε 0 H cosh 1 ( s R ) × t o i l + t s o l i d ( t o i l ε o i l ) + ( t s o l i d   ε s o l i d   )
In the transformer, the distance between two turns and two cakes can be regarded as the calculation of parallel plate capacitor. Turn-to-turn capacitance is:
C T = ε 0 ε P × π D m ( w + t p ) t p
In the form: ε 0 is the dielectric constant of vacuum; ε p is the relative dielectric constant of paper insulation; D m is the average diameter of winding; w is the axial bare width; t p is the total thickness of paper insulation.
Similarly, only considering the structure, the total capacitance between the two axial continuous cakes is [35]:
C DA = ε 0 k π D m ( R + t s ) t p ε p + t s ε oil + ε 0 ( 1 k ) π D m ( R + t s ) t p ε p + t s ε s
3.
Calculation of distributed inductance.
When the frequency is high, the iron core of the transformer plays a smaller role, and the winding plays a larger role. Since the transformer winding can be regarded as a planar coil, the formula of the inductance is:
L 0 = μ 0 8 π d Ψ w 2
In the form: d is the average diameter of the coil; w is the number of turns between two adjacent line cakes; μ 0 is the vacuum permeability; Ψ is the correlation function.

2.2. Analysis of Evaluation Methods

A transformer winding needs to be tested after short-circuit test to evaluate its quality. The evaluation results can divide the transformer quality into two levels: qualified and unqualified. The qualified degree is subdivided into excellent, good and medium, and the unqualified degree is subdivided into poor, worse and very bad, as shown in Table 1.
For the quality of the transformer, the relationship between the three methods and the quality of the transformer can be established to evaluate the performance of the transformer winding.
According to the capacitance formula:
C = ε S 4 π k d
In the form: ε is the relative dielectric constant of the medium; S is the positive area of the bipolar plate; π is the circumference rate, k is the constant of electrostatic force, which is 8.9880 × 10 N m / C ; d is the vertical distance between the two plates. According to Formula (10), due to the dielectric constant inside the transformer containing insulation paper, insulation pad and strut, insulation oil and other composite insulation dielectric constant, the dielectric constant is basically unchanged. When the winding deformation occurs, the internal effective area almost does not change; then, the equivalent capacitance is inversely proportional to the distance between the two plates.
The quality index of evaluating transformers can be divided into 6 grades: excellent, good, medium, poor, worse, very bad. When the deformation degree of the transformer winding is 0%, the transformer has no deformation and the quality index is excellent. When the degree of deformation of the winding is 2–5%, the deformation of the transformer is not obvious, and the quality index is medium. When the degree of deformation of the winding is 5–10%, the transformer is slightly deformed and the quality index is poor. When the degree of deformation of the winding is 10–30%, the transformer is deformed and the quality index is worse. When the degree of deformation of the winding is 30% and above, the transformer is severely deformed, and the quality index is very bad. As shown in Table 2:

2.2.1. Index Analysis of Short-Circuit Impedance Method

Transformers with short-circuit impedance method generally have tap-changer, and the fractional value z of short-circuit impedance is expressed as:
z = Z k Z r e f × 100 %
In the form, Z k is the short-circuit impedance; Z r e f is the reference impedance; the virtual part of X k is Z k , which is short-circuit reactance, where Z r e f is expressed as:
Z r e f = U 2 S r
U represents the voltage of Z k and Z r e f windings; S r is the base value of rated capacity.
For the transformer winding, if one of the windings deforms, the inductance L k of the phase will change; thus, the values of X k , Z k and z will also change. At this time, the deformation of the winding can be speculated by measuring the values of the three parameters.
As shown in Figure 3, the transformer is performing a short-circuit test. According to the short-circuit impedance data of distribution transformer before and after short-circuit test provided by multiple power supply companies, the relationship between impedance change and winding deformation can be obtained, and the test is qualified or not, in order to realize the performance evaluation of transformer winding, as shown in Table 3.
In view of the above deformation, the law between the change rate of transformer short-circuit impedance and the degree of deformation is obtained, as shown in Figure 4.
In the short-circuit impedance method, the change rate of short-circuit impedance reflects the winding deformation of distribution transformer. Therefore, the short-circuit impedance method can be used to evaluate the performance of transformer winding in most cases. However, due to the overlapping data of no deformation and slight deformation, it is difficult to determine whether deformation occurs for the overlapping part. According to the Chinese electric power industry standard DL/T1093-2018 and the horizontal comparison method of circuit impedance, this paper obtains the following conclusions, as shown in Table 4.

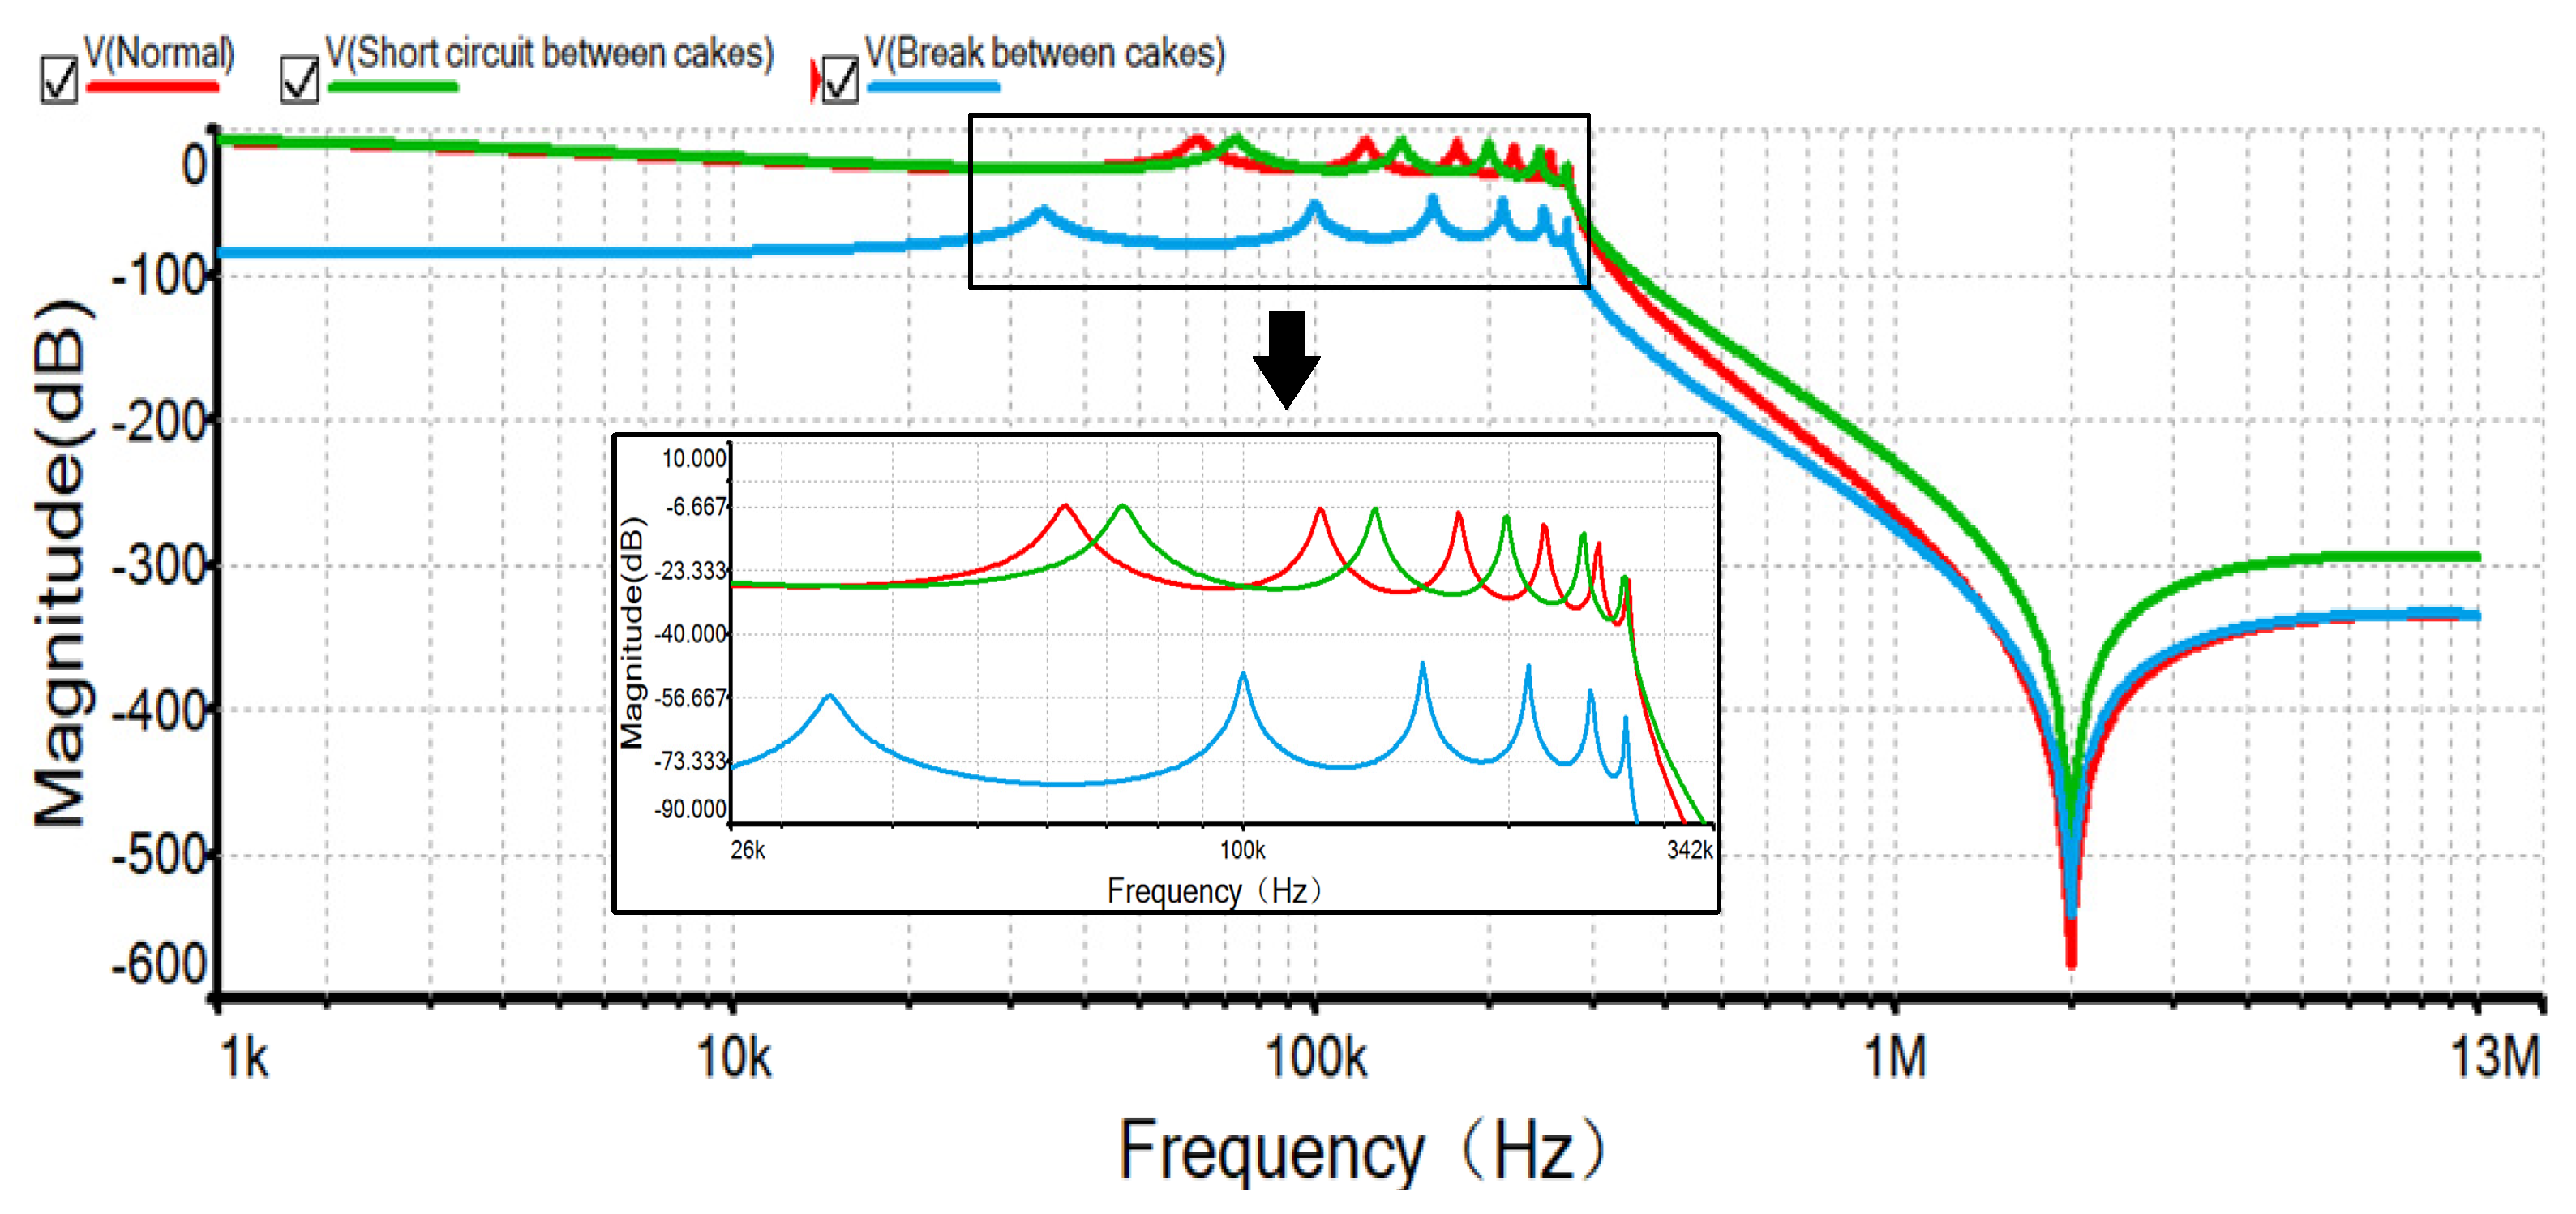
2.2.2. Indicator Analysis of Frequency Response Method
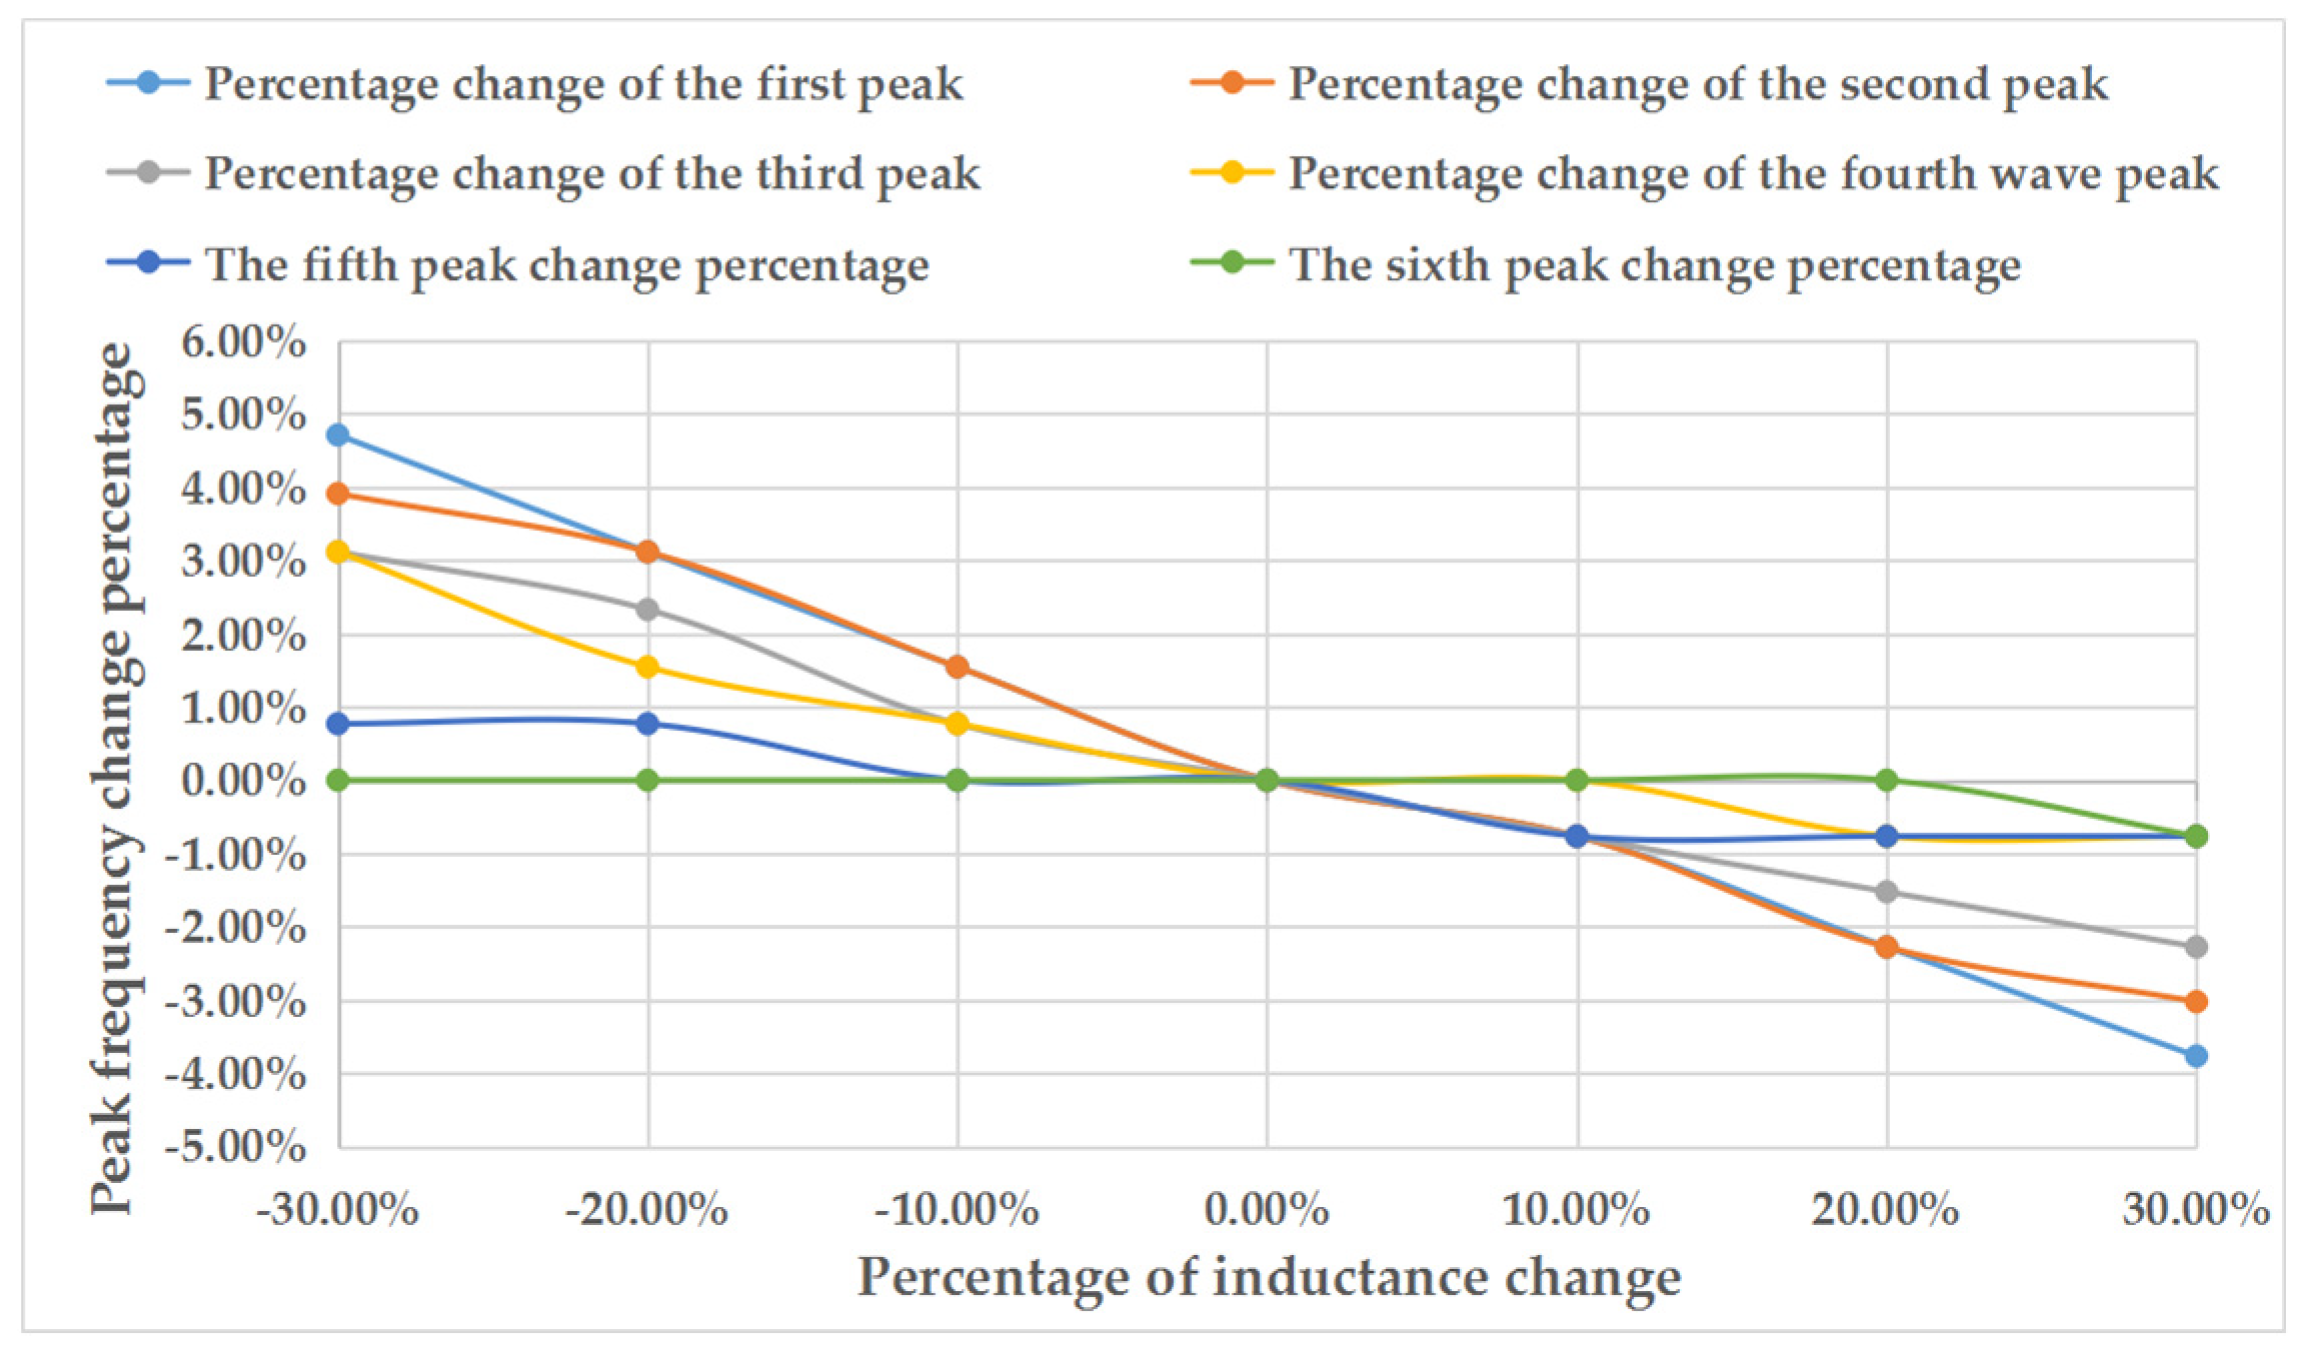
Figure 2 shows the simplified transformer model. It is assumed that the distributed inductance, distributed capacitance and self-resistance of transformer winding are uniformly distributed, L 1 = L 2 = = L n , R s 1 = R s 2 = = R s n , C s 1 = C s 2 = = C s n , C g 1 = C g 2 = = C g n , R g 1 = R g 2 = = R g n . According to the frequency response method, when the equivalent model of the transformer is selected as N turns, the frequency response characteristics of the transformer winding will appear as N 1 peaks and N valleys. In this paper, if N = 7 , there will be 6 peaks, 7 valleys showing alternating phenomenon. The transfer function can be calculated by Formula (13):
H ( f ) = 20 × lg | V 2 ( f ) V 1 ( f ) |
V 1 is the input signal and V 2 is the output signal.
When the transformer winding deformation and other abnormalities occur, the internal R L C parameter will change, which makes the peak and valley of the frequency response obtained by the frequency response method change. In M u l t i s i m simulation, by changing the distribution parameters in the simulation model, we observe the relationship between the parameters and the frequency response, and then compare the FRA results in normal and fault conditions [36]. Therefore, the frequency variation percentage of the peak valley is used to evaluate the winding performance of the transformer. The formula is:
Δ f = f n 2 f n 1 f n 1 × 100 %
Among them: Δ f is the peak valley frequency change percentage; f n 1 is the n resonant frequency of a winding without deformation; f n 2 is the n resonant frequency of the deformed winding.
1.
Influence of inductance parameter variation on frequency response results of transformer.
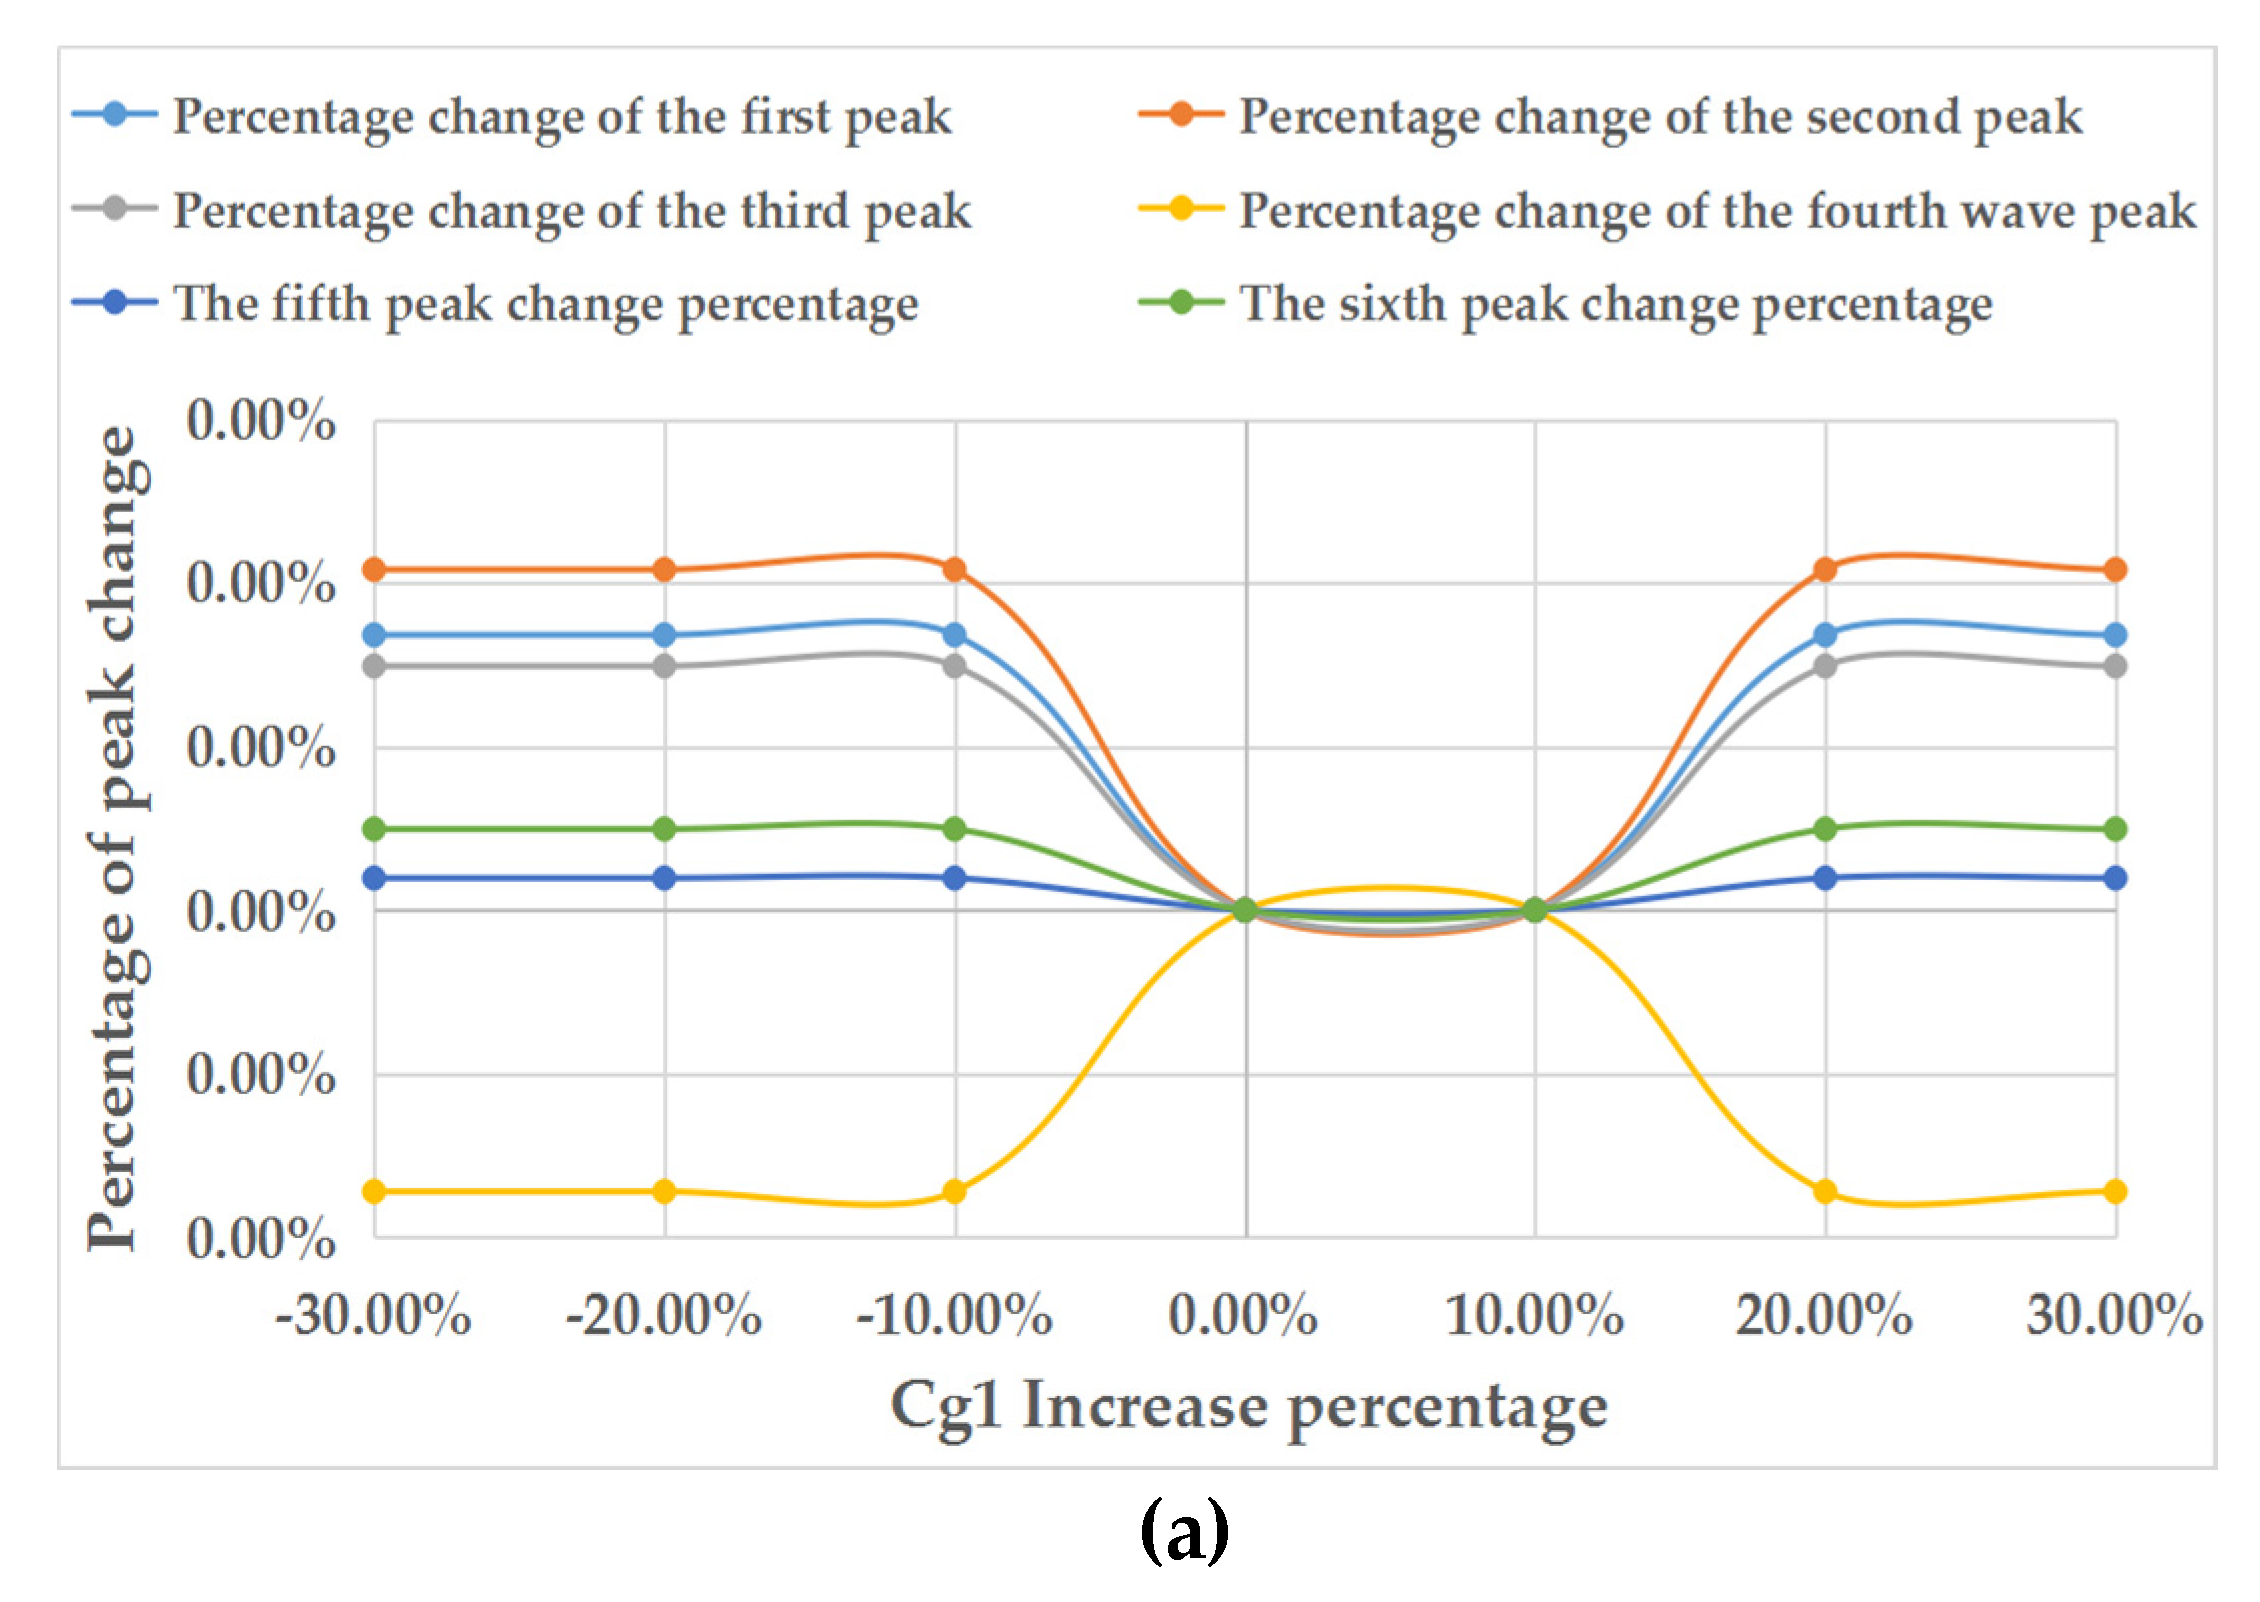
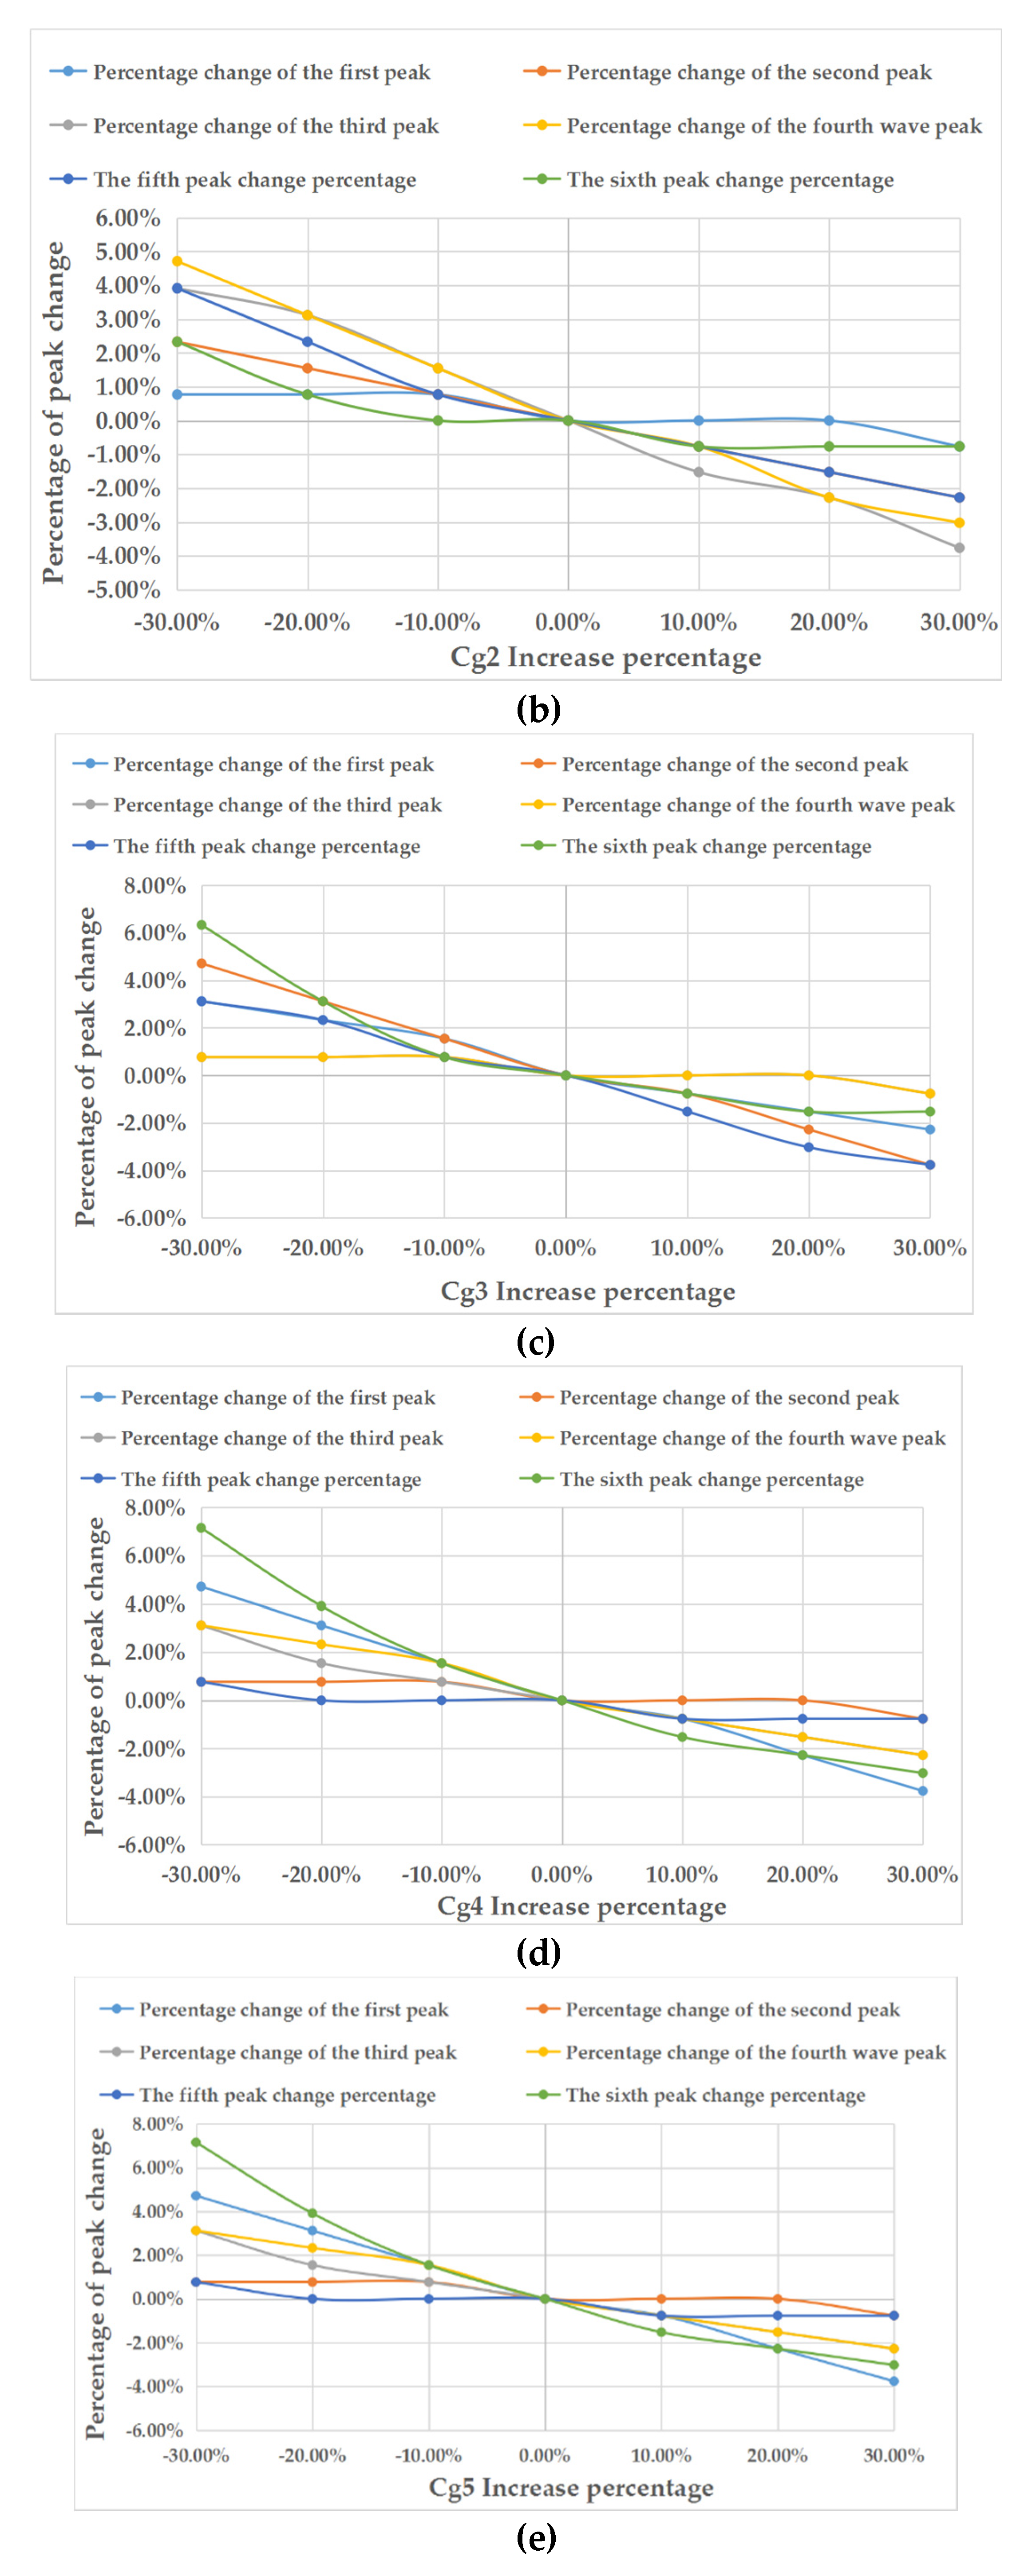
According to the simulation, the influence data of the frequency response of the transformer when the inductance is broken or short-circuit is extracted and processed, as shown in Figure 5.
As shown in the Figure 5, it can be clearly seen that the frequency response in the middle and low frequency is different from that of the normal winding when the transformer is short-circuited and broken. When the first cake inductance is short-circuited in the middle and low frequency bands, the peaks and valleys of the winding are less than those of the normal peak and valley, and the frequency value of the peak is larger than the percentage of the frequency change under the normal frequency. When the first inductance is broken, the frequency relative to the normal value changes to decrease, and the peak value of the whole wave is shifted downward. Therefore, the frequency response method is easy to distinguish between the winding short-circuit and broken.
The influence data of the change of the first cake inductance of the transformer winding from −30% to 30% on the frequency response results of the transformer are extracted and processed, as shown in Figure 6.
With the increase of inductance parameters, the frequency response of the transformer shows that the frequency of the resonant point peak becomes smaller. Similarly, with the decrease of inductance parameters, the frequency response of the transformer shows that the frequency of the resonant point peak increases.
2.
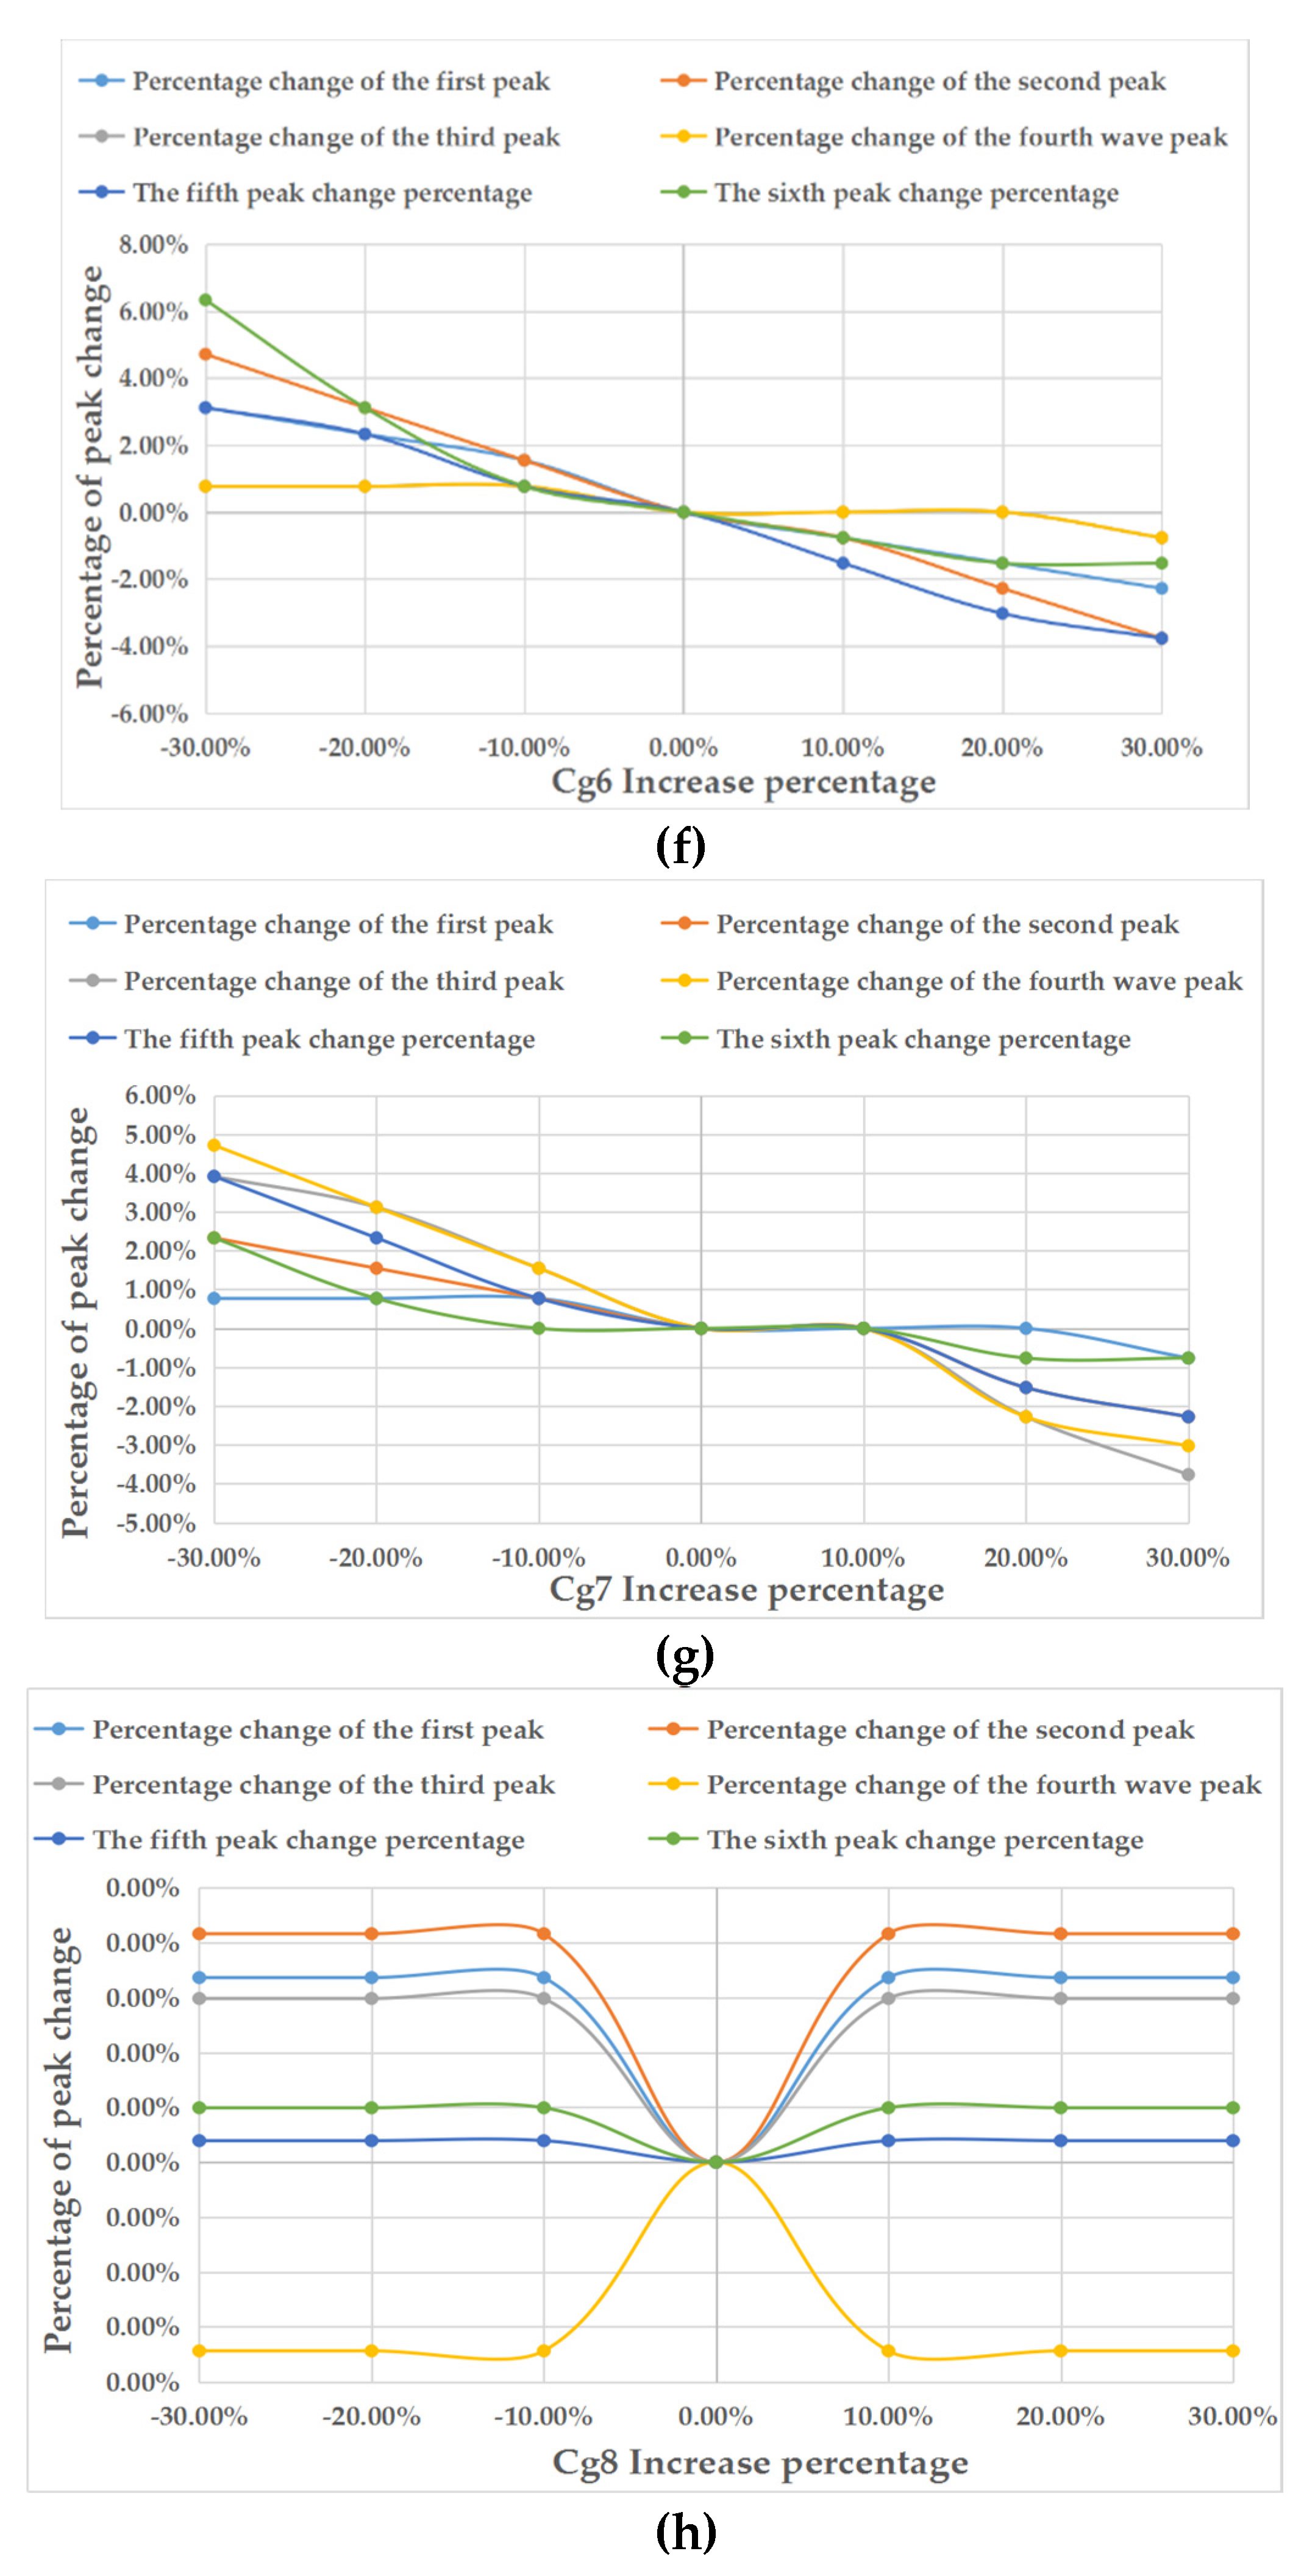
Influence of capacitance parameter variation on frequency response results of the transformer.
The ground capacitance values of the first to seventh turns are changed from −30% to 30%, and the influence of the ground capacitance changes on the transformer peak changes is obtained, as shown in Figure 7:
It can be seen from the figure that when the ground capacitance parameter changes, the law of peak frequency change is a symmetrical relation between the end winding and the head winding. For the winding wire cake at the head and tail ends, the increase of the ground capacitance is not obvious for the frequency change of the peak. For the middle line cake, when the ground capacitance changes, the change percentage of the peak frequency decreases linearly.
For the internal equivalent model of the transformer, when the parameters of the transformer simulation model change, the frequency response will also change. As shown in Table 5.

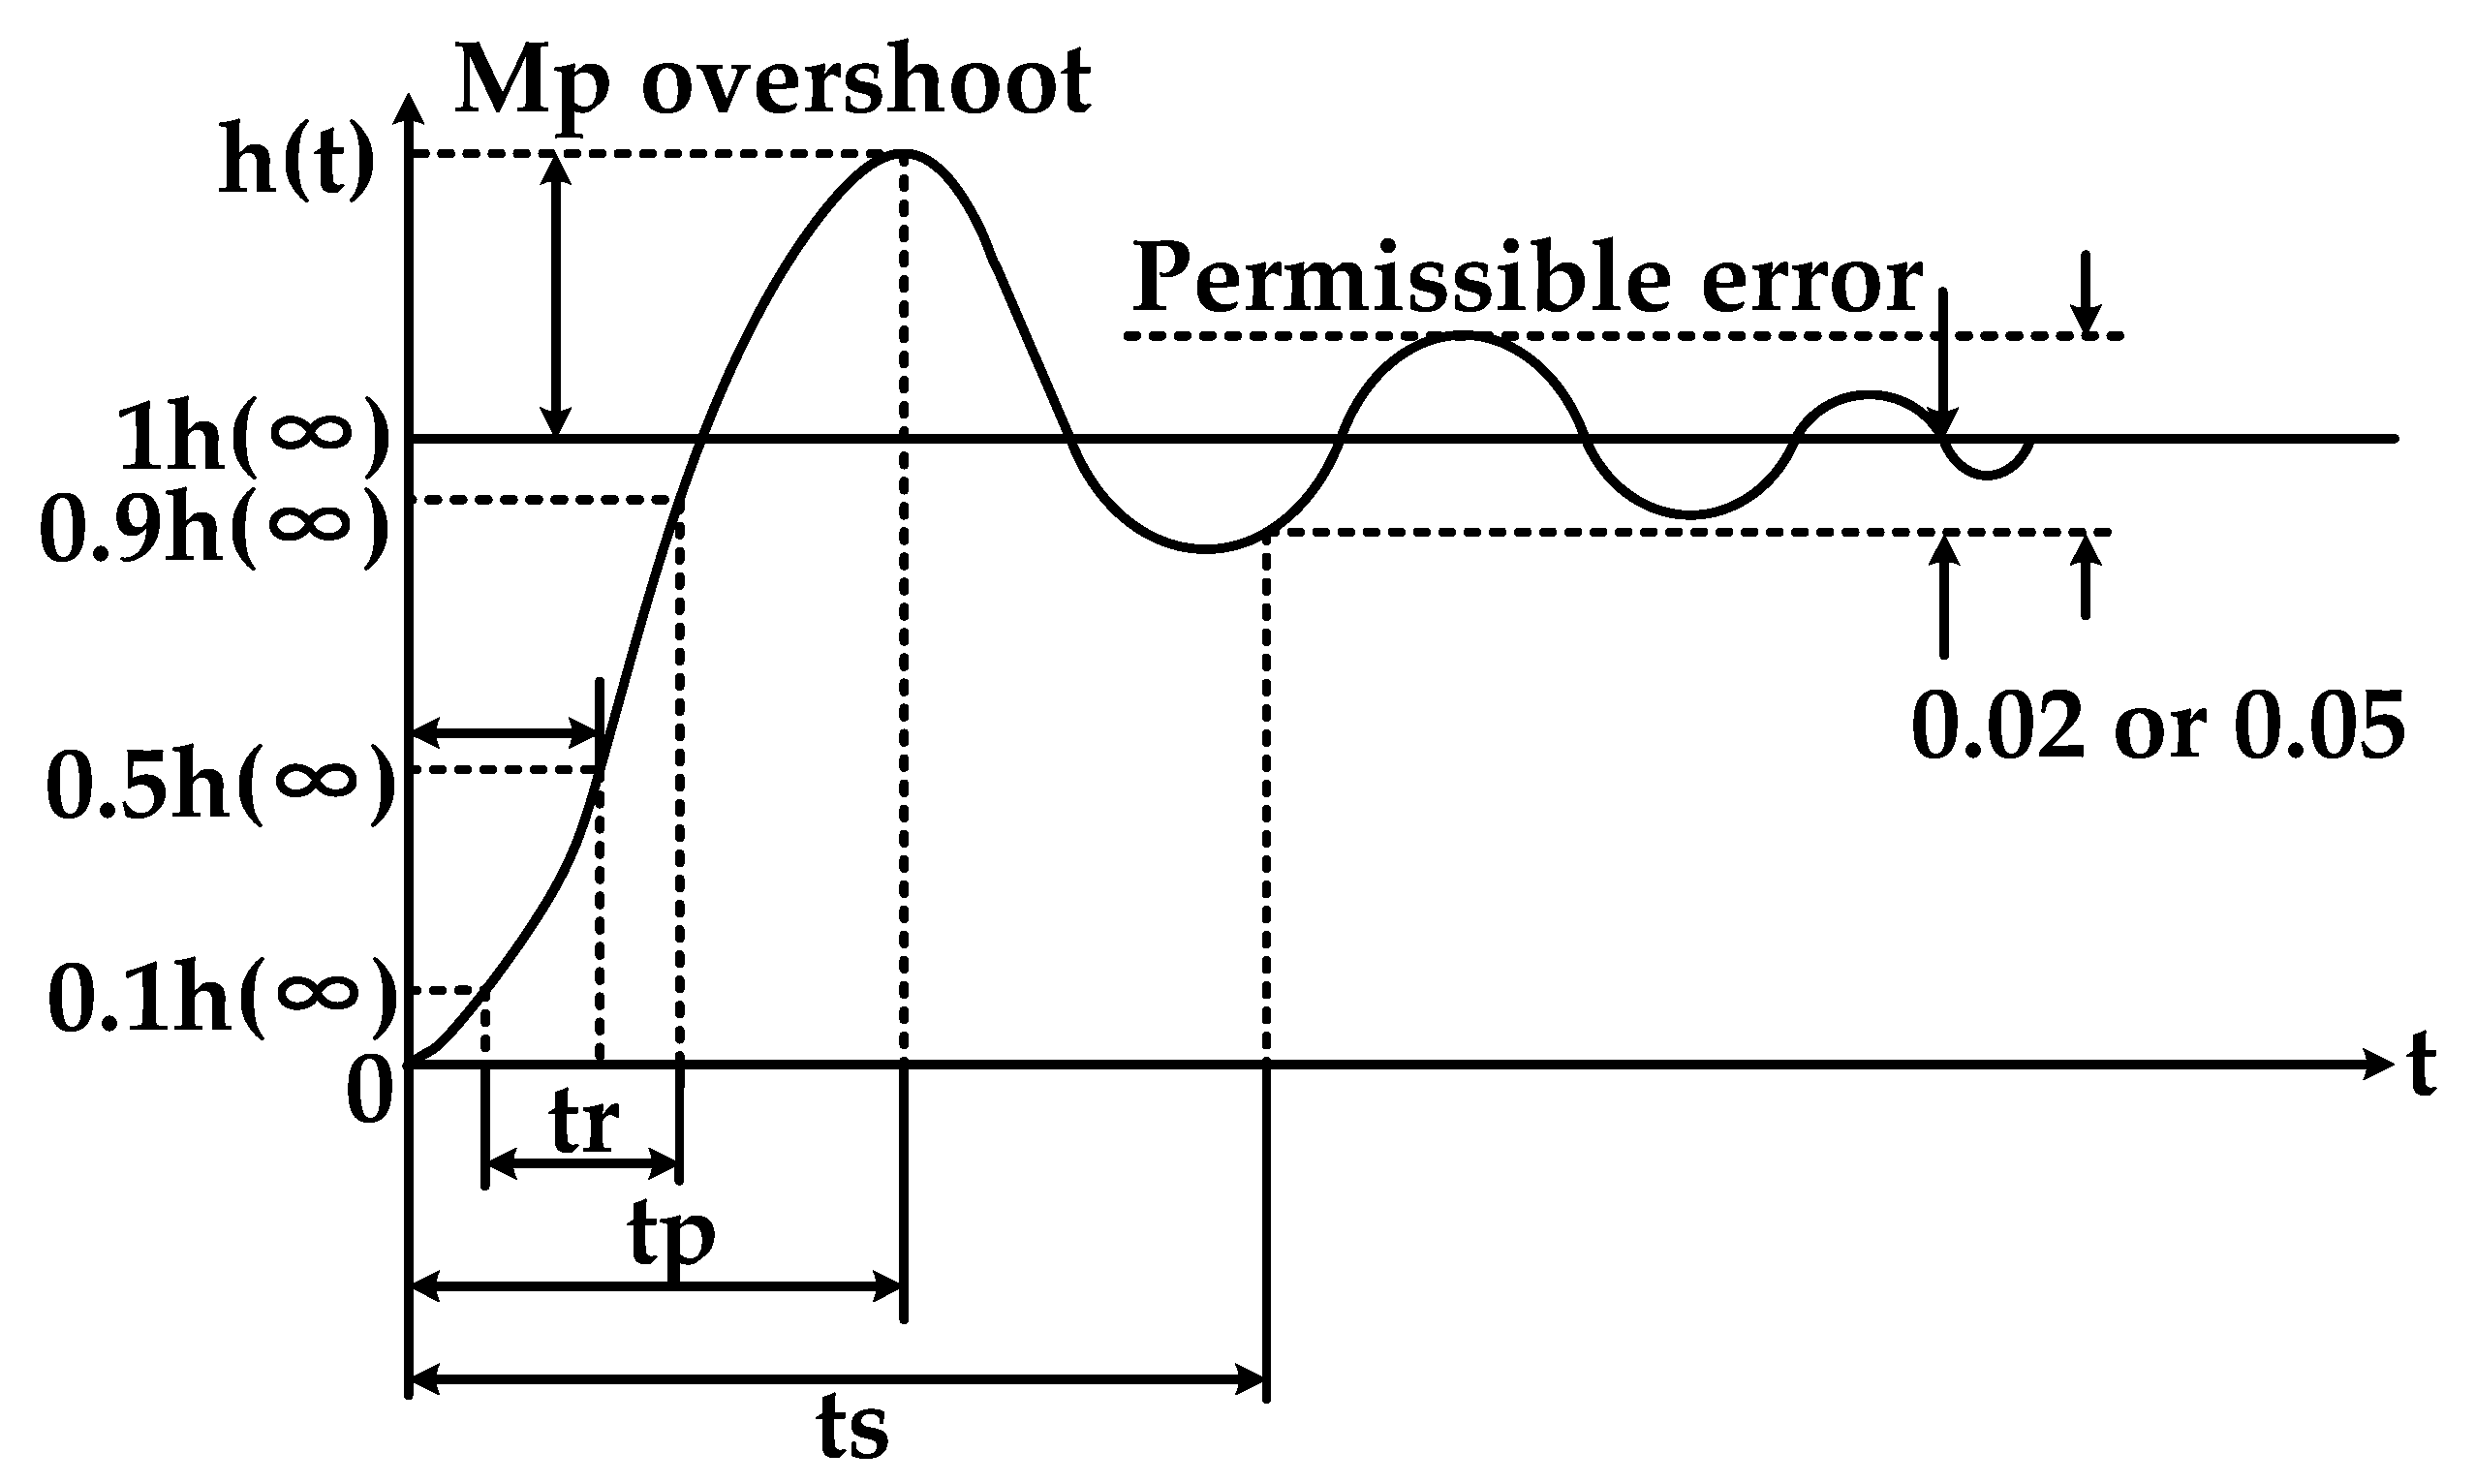
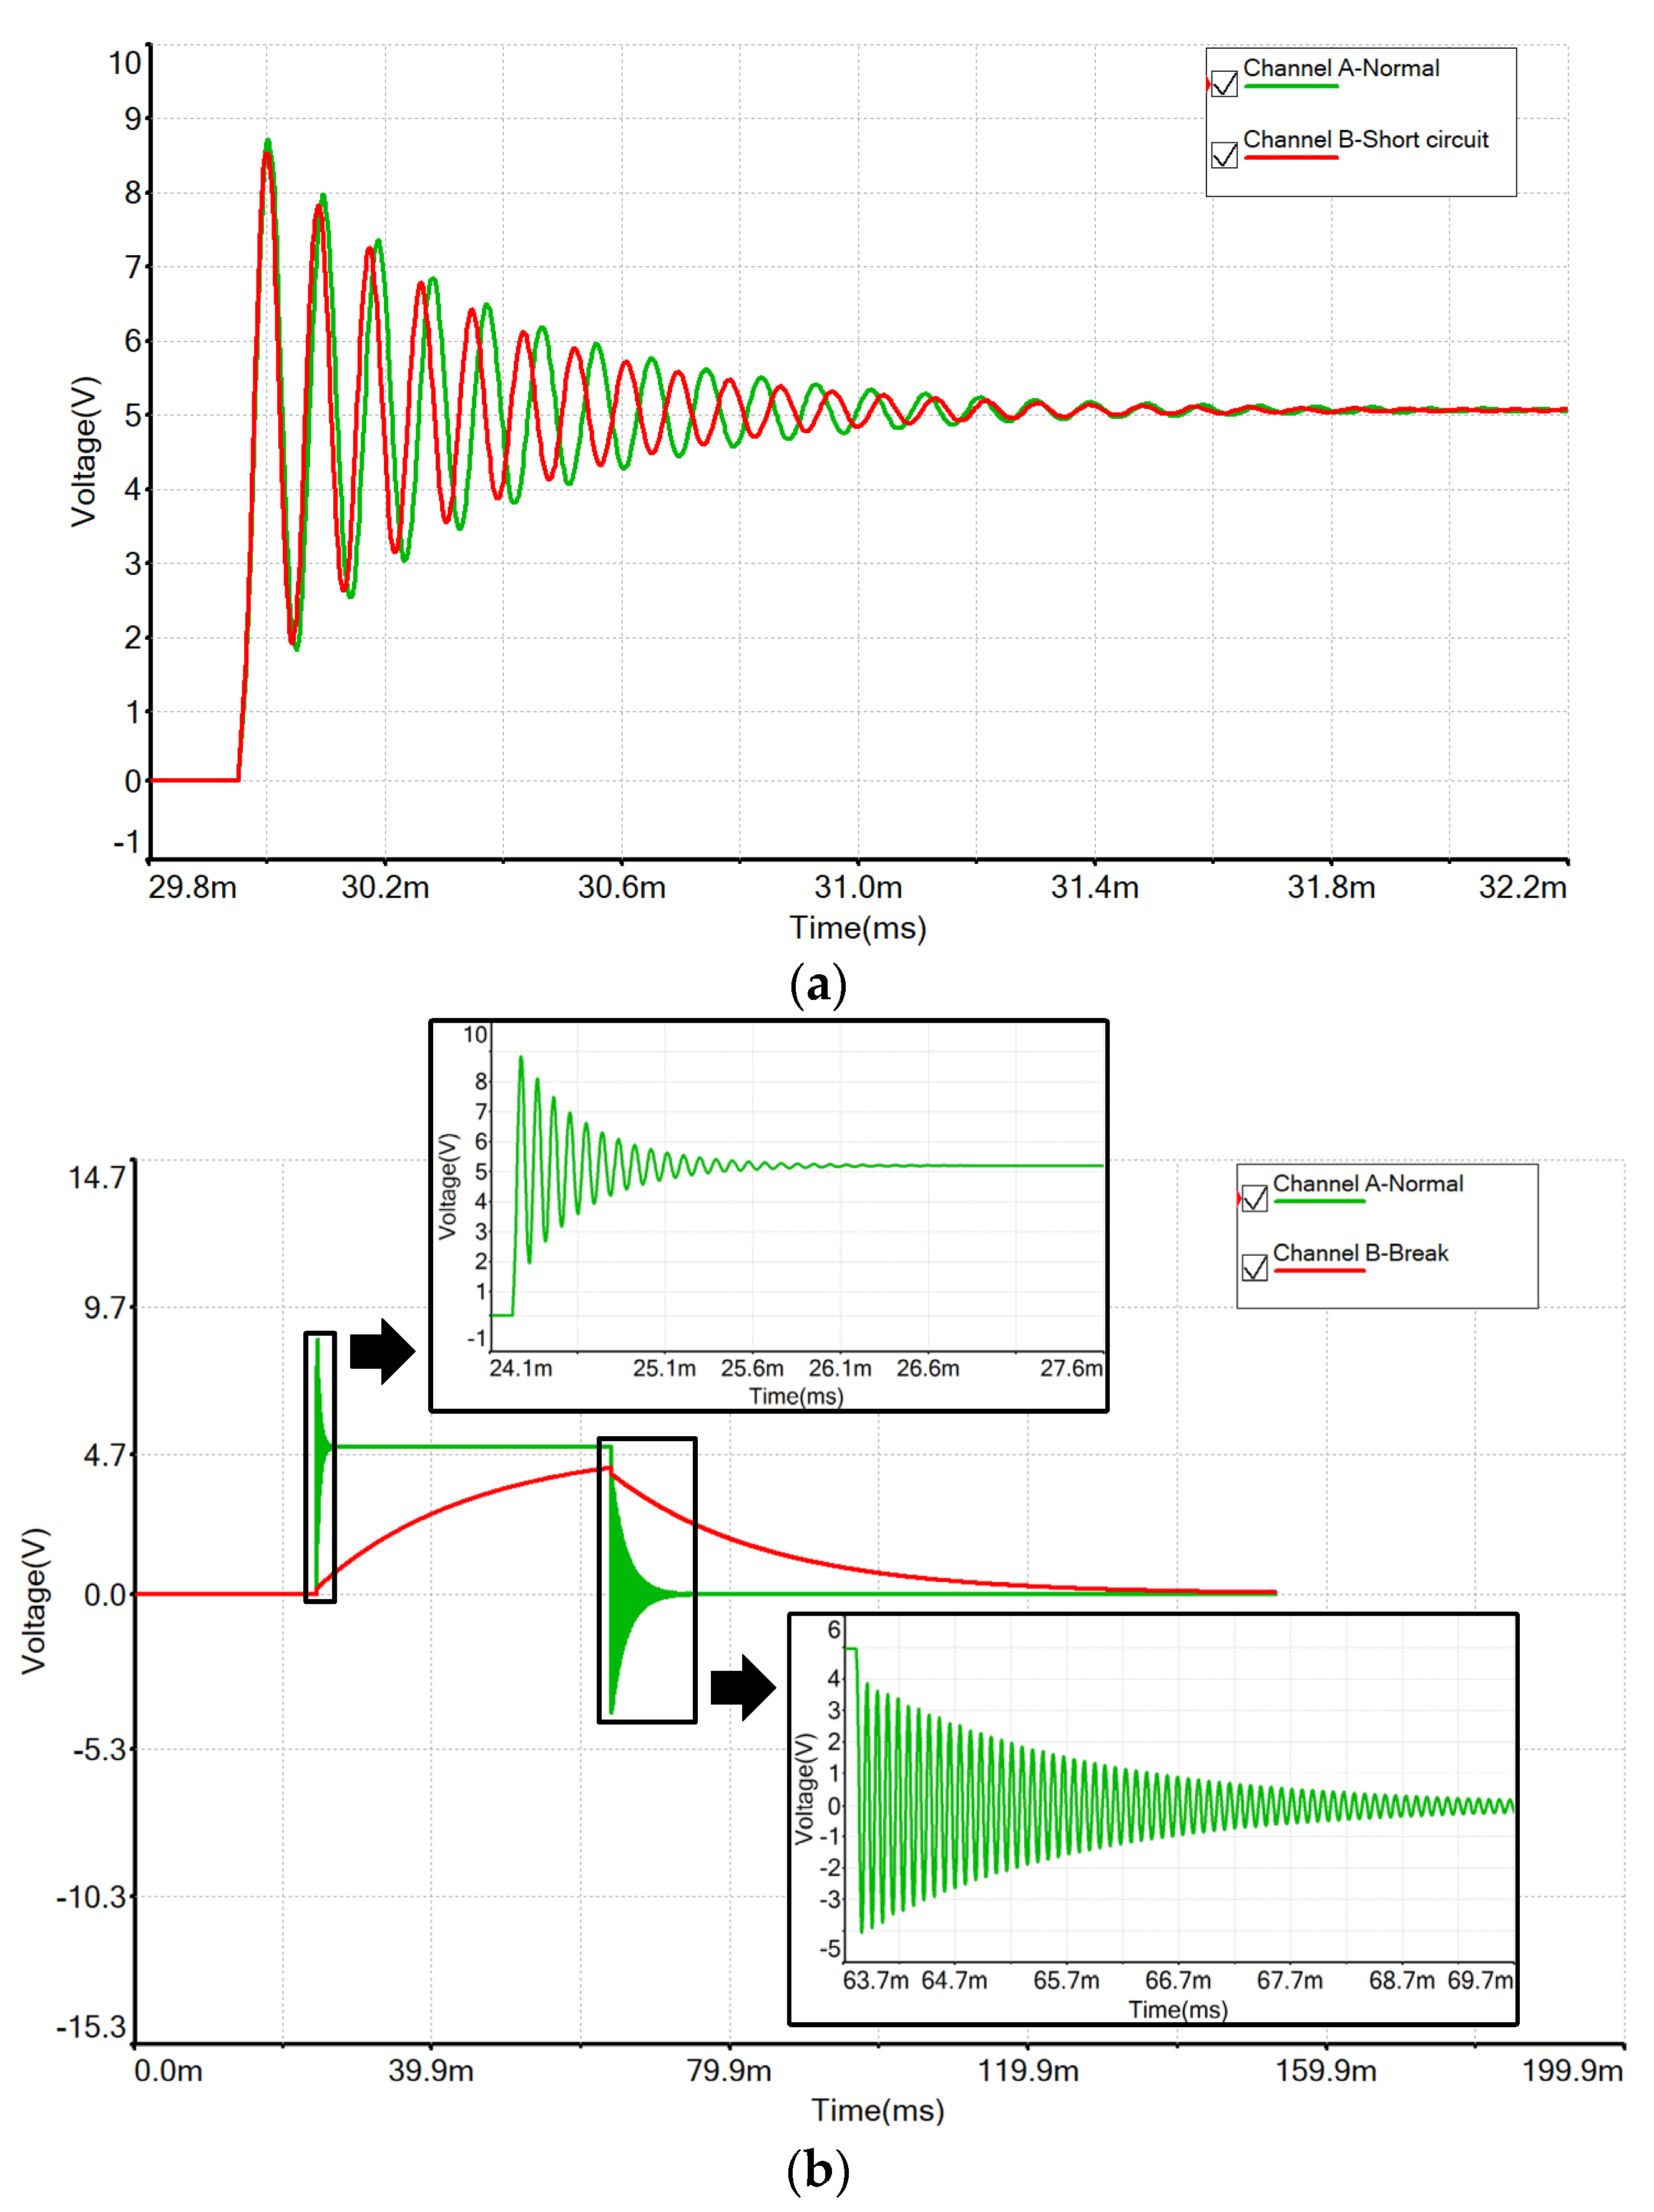
2.2.3. Indicator Analysis of Oscillation Wave Method
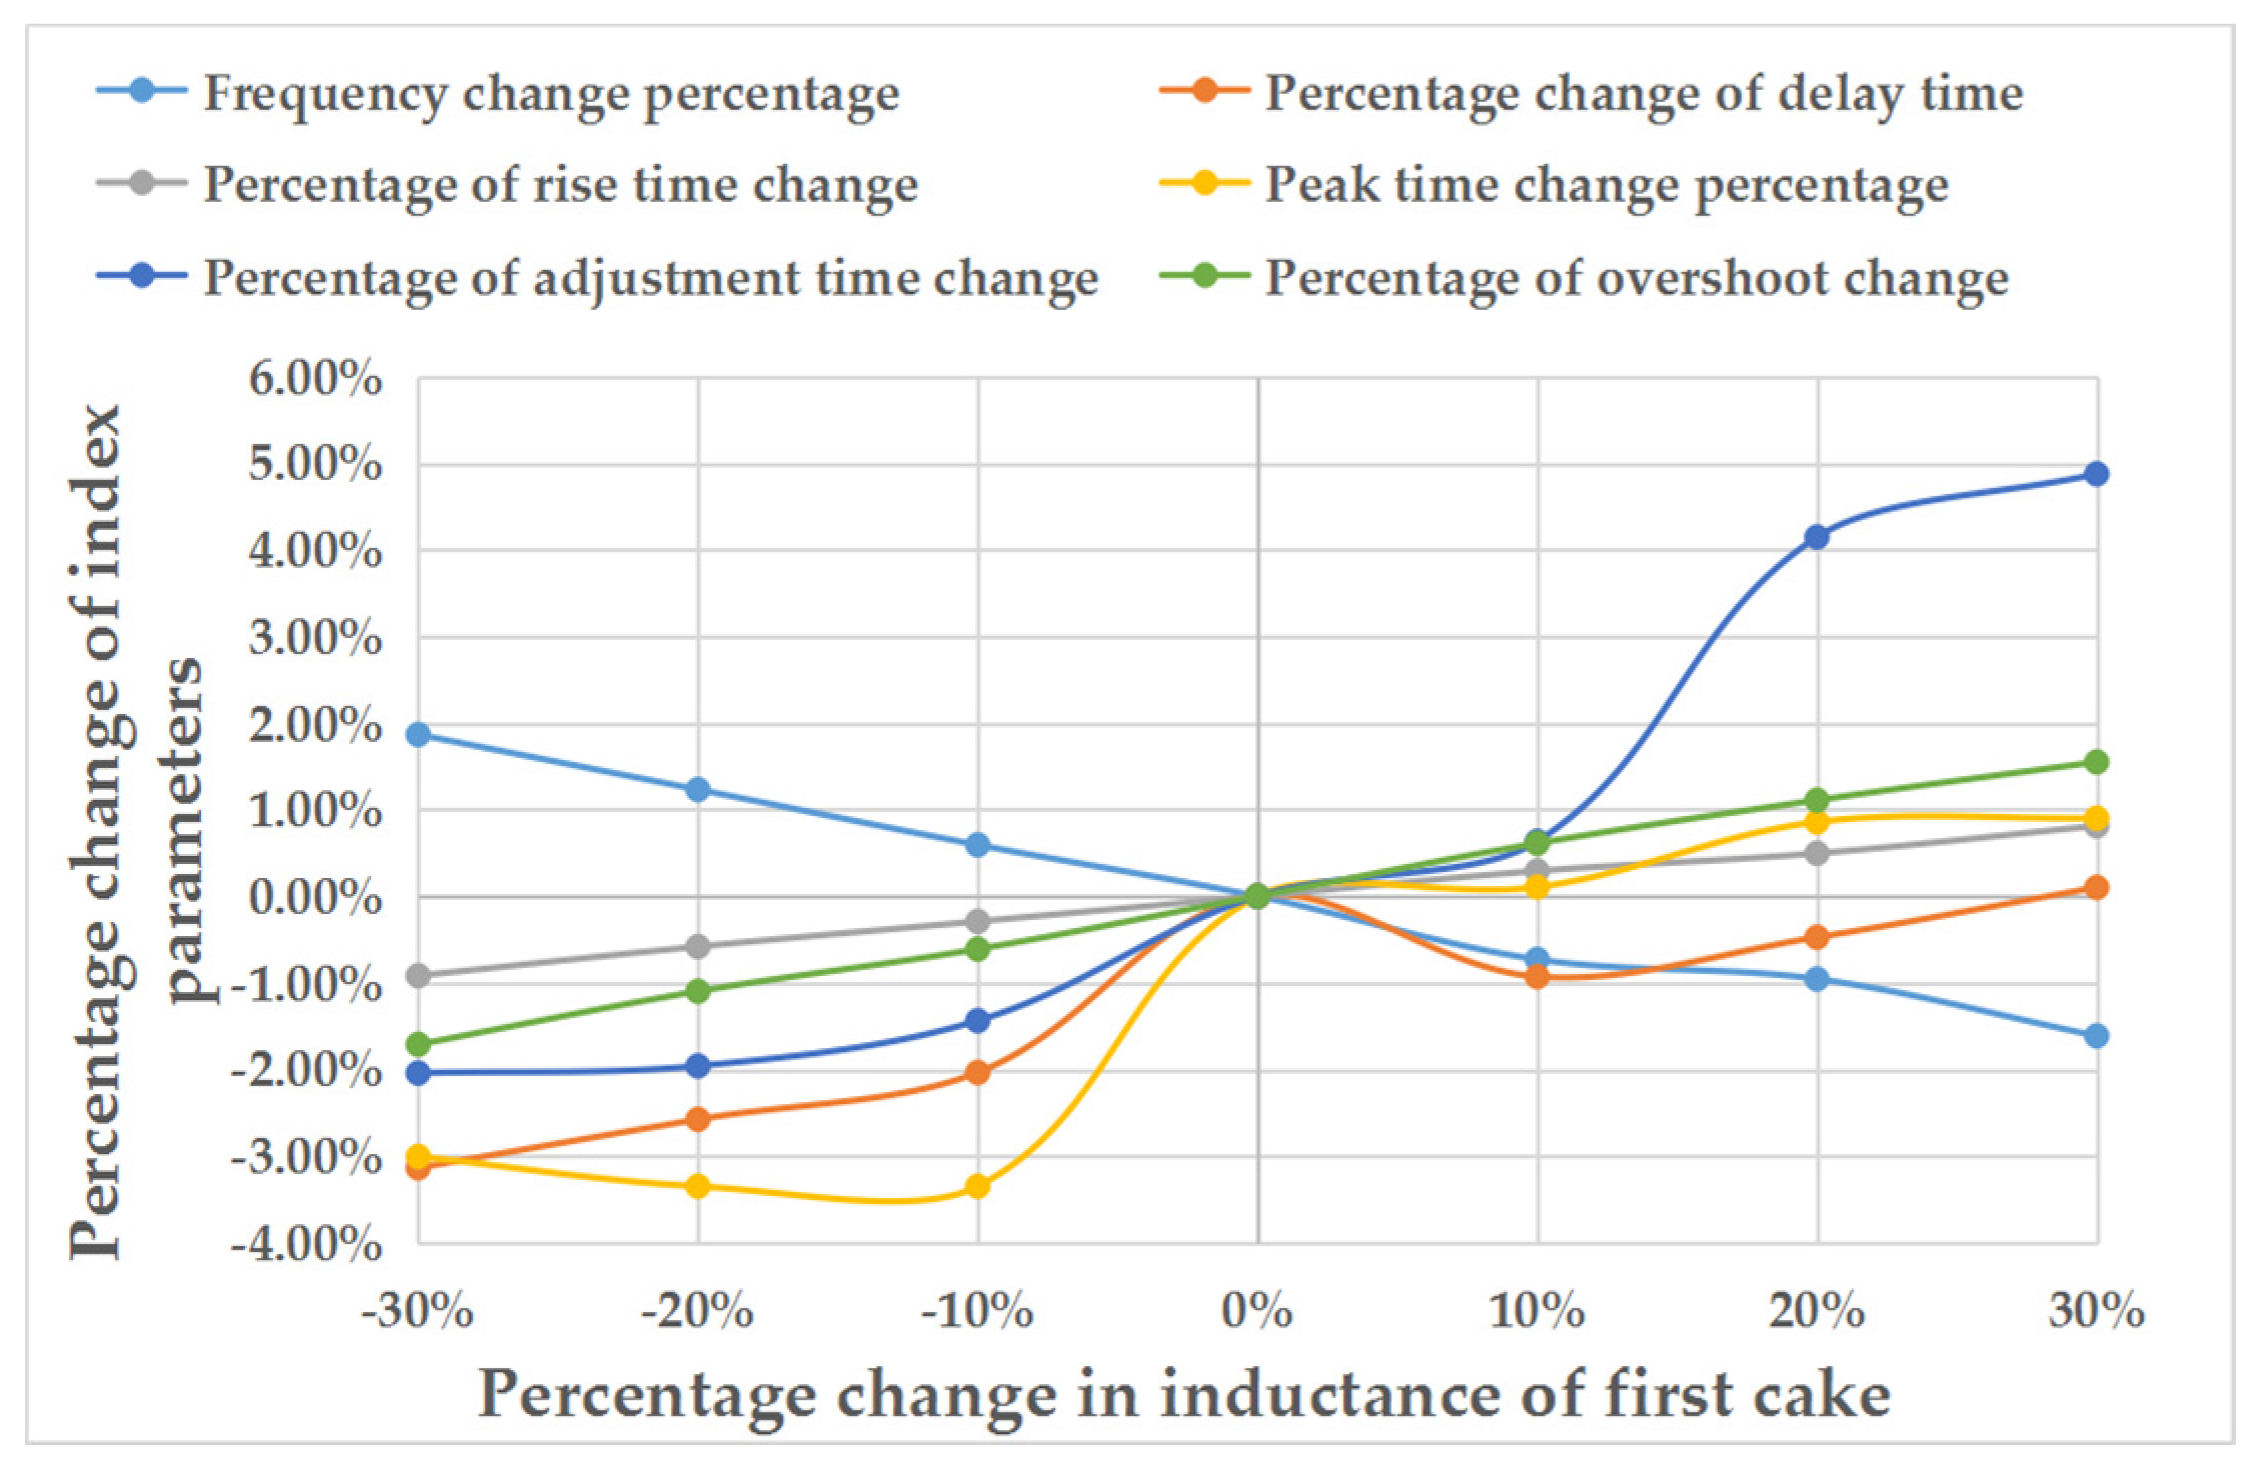
The performance evaluation of transformer winding is realized by the oscillation wave impact method. In the case of no impact on the system, a step or pulse signal is injected into the transformer to produce an impulse response or a step response [37]. In the case of no influence on the system, the step or pulse signal is injected into the transformer to produce the impact response or step response. The internal characteristics of the electrical equipment are identified by the various parameters of the system, and the relationship between the parameters of the oscillation wave and the deformation of the system is established in order to form a transformer winding performance evaluation system based on the oscillation wave.
The internal structure of the transformer at high frequency can be regarded as a series circuit composed of distributed parameters such as R L C [38,39]. As shown in Figure 8:
When t = 0 , the switch S is closed, applying the K V L and V C R theorem:
R i + u L + u c = u S ( t )
Its characteristic root is:
p = R 2 L ± ( R 2 L ) 2 1 L C
When the circuit is under damped, it will oscillate:
R < 2 L C
Then, u C is:
u C = A e δ t sin ( w t + β )
The performance of transformer winding is evaluated by oscillation wave method, as shown in Figure 9:
In the form: f is the oscillation frequency of the response curve; t d is the time required for the response curve to rise from zero to 50% of the steady-state value; t r is the time required to increase the response curve from 10% to 90%; t p is the time required for the response curve to rise to zero at the first peak; t s is the shortest time to keep the response curve within the allowable error range. M p is the difference between the maximum peak value of the response curve and the steady-state value.
1.
Influence of inductance parameter variation on oscillation wave system index.
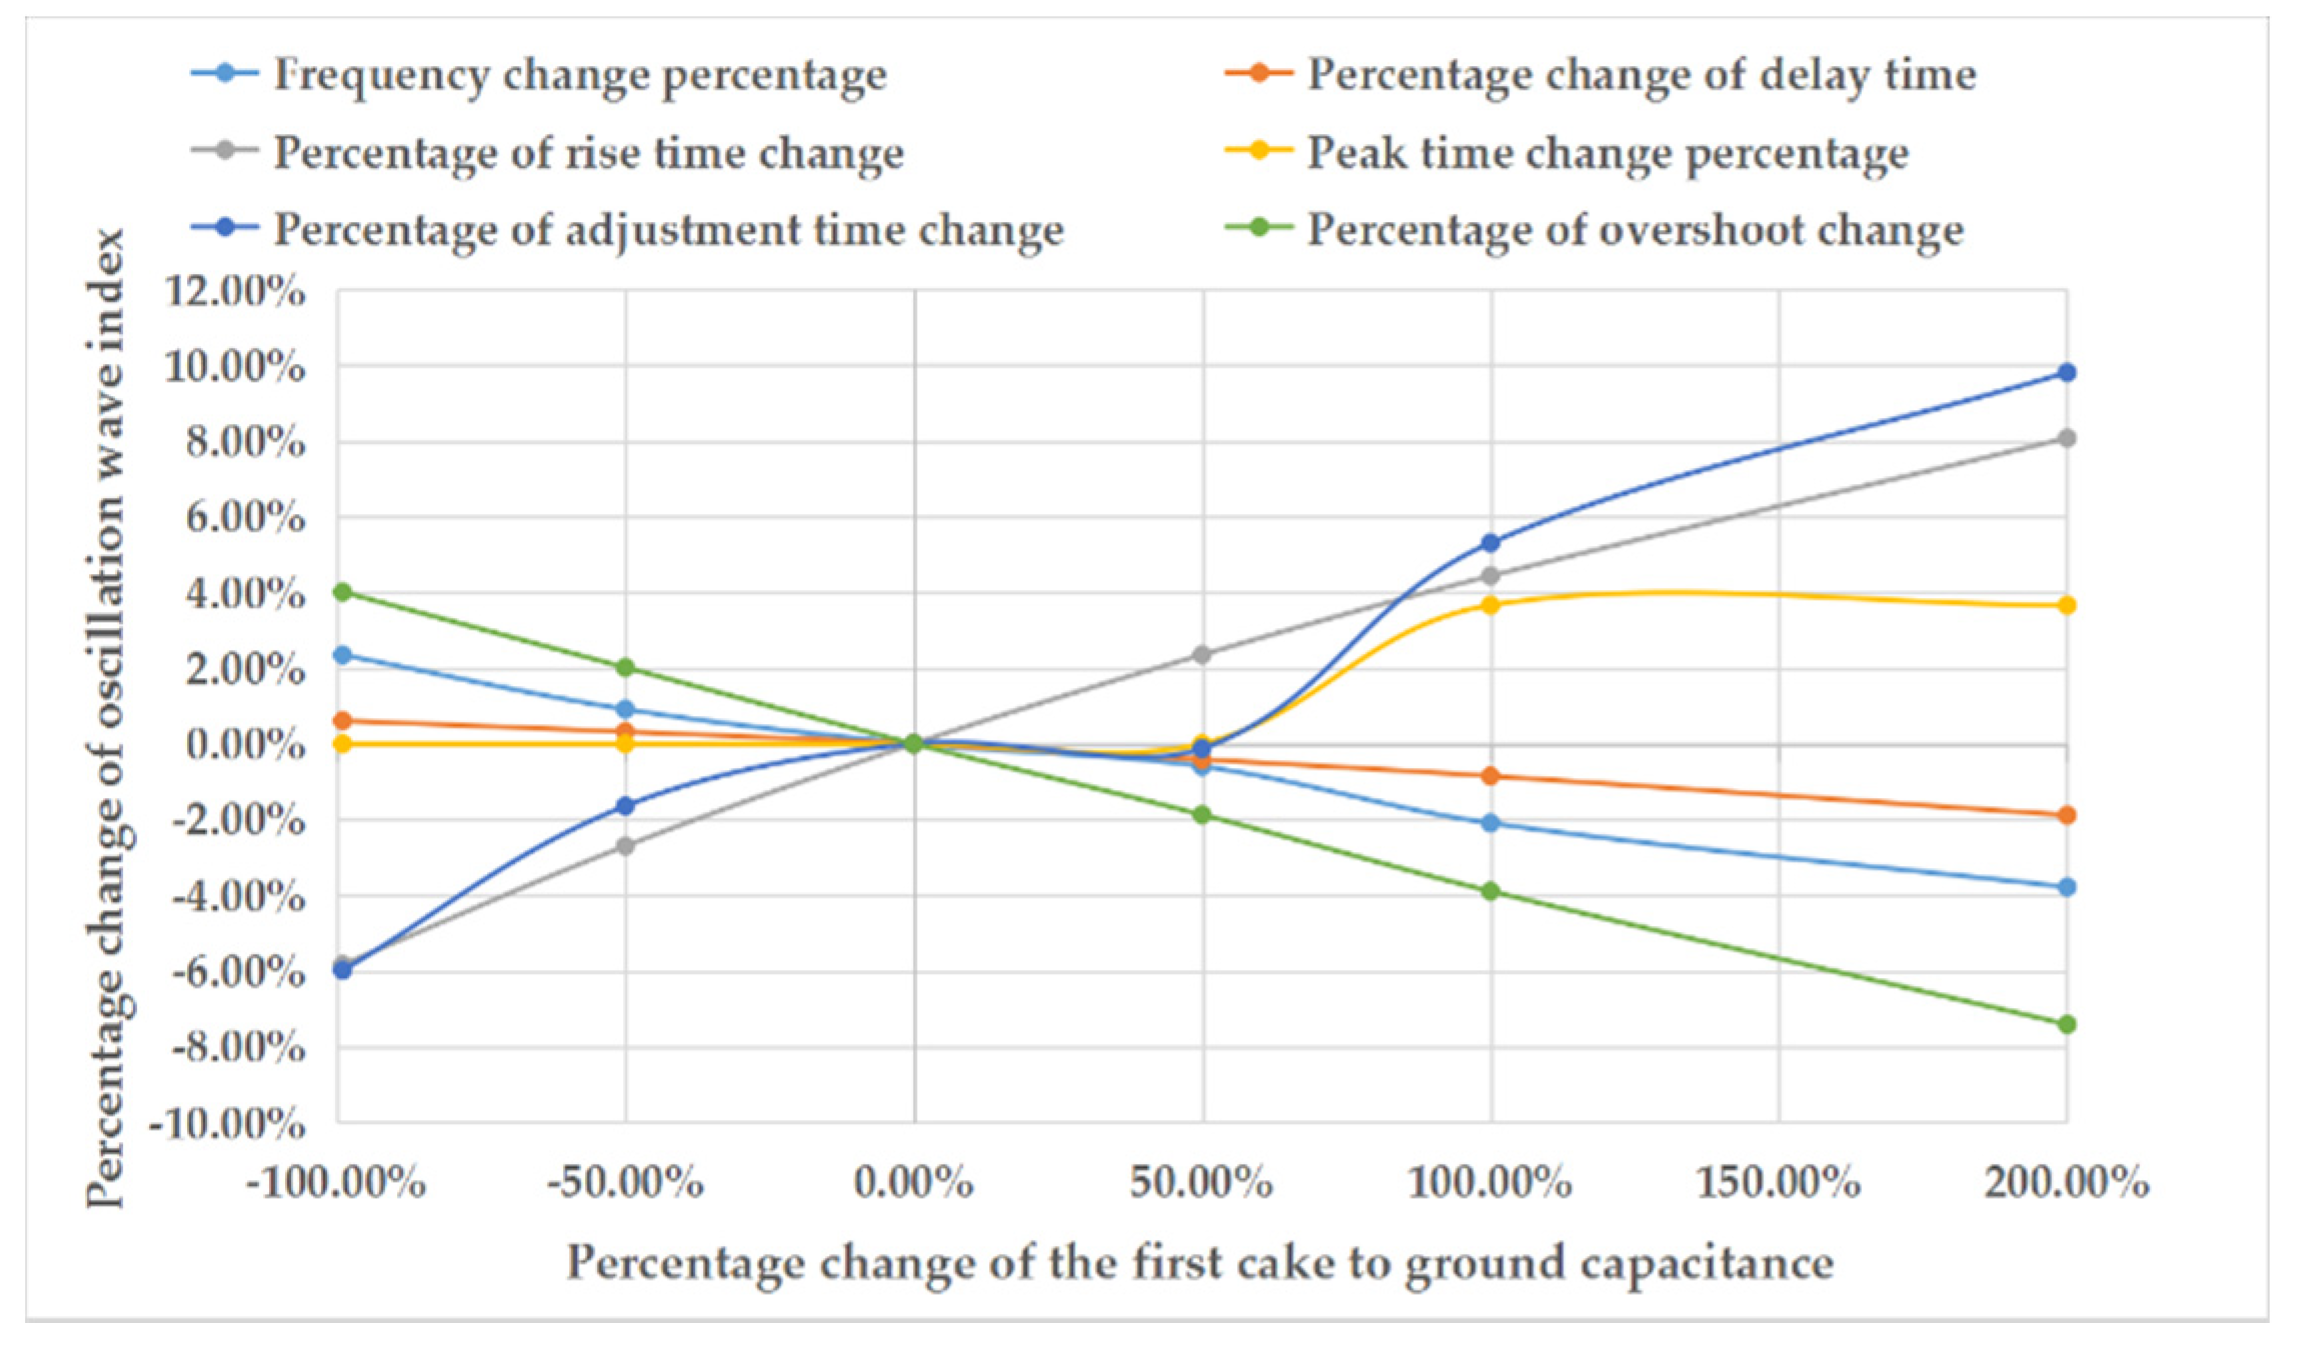
When the first inductance is short circuited or broken, it can be judged that the waveform indexes of the oscillation wave are different under normal conditions and short circuited or broken conditions, as shown in Figure 10:
When L short circuits, the frequency changes greatly, while t d , t r , t p , t s , M p are decreased; when L is broken, the oscillation wave cannot start to vibrate, t d becomes smaller, t r , t p , t s and the M p becomes larger.
The effect of changing the inductance of the first disc of the transformer winding from −30% to 30% on the index data of the oscillating wave system is shown in Figure 11.
By changing the inductance parameters, the following conclusions are obtained, as shown by Table 6 shows.
2.
Influence of ground capacitance parameter variation on the index of oscillation wave system.
The equivalent parameters of each cake ground capacitance are increased by 10%, and the index data of the transformer oscillation wave system are extracted and processed, as shown in Figure 12.
The equivalent parameters of the ground capacitance of the first cake increased from −100% to 200%. The index data of the transformer oscillation wave system are extracted and processed, as shown in Figure 13.
By changing the capacitance parameters, the following conclusions are obtained, as shown by Table 7.
For the degree of deformation of transformer winding to take the principle of large, considering the selection of the threshold of ground capacitance change, the frequency changes percentage and the rise time changes percentage value as the threshold of transformer quality index. The percentage of frequency change and the percentage of rise time are considered as the transformer quality index, as long as one index is set as a low quality gear. As shown in Table 8.

3. Discussion and Results

In this paper, the method of combining the analytic hierarchy process (AHP) and the fuzzy comprehensive assessment (FCA) is used to comprehensively evaluate the performance of the transformer winding [40]. AHP uses multiple criteria decision-making methods; it uses the factors contained in the system and related situations to express a complex problem as an orderly hierarchical structure, determines the relative importance of each factor in the hierarchy through mutual comparison, and then integrates human judgments to determine the order of the relative importance of the factors [40]. Since the index corresponding to each method is unique, the standard for evaluating the winding performance score is also unique. Appropriate selection can significantly improve the efficiency of analysis [41]. The combination of the two methods is used to discuss the indicators obtained from the transformer windings in order to realize the comprehensive evaluation of the transformer winding performance.

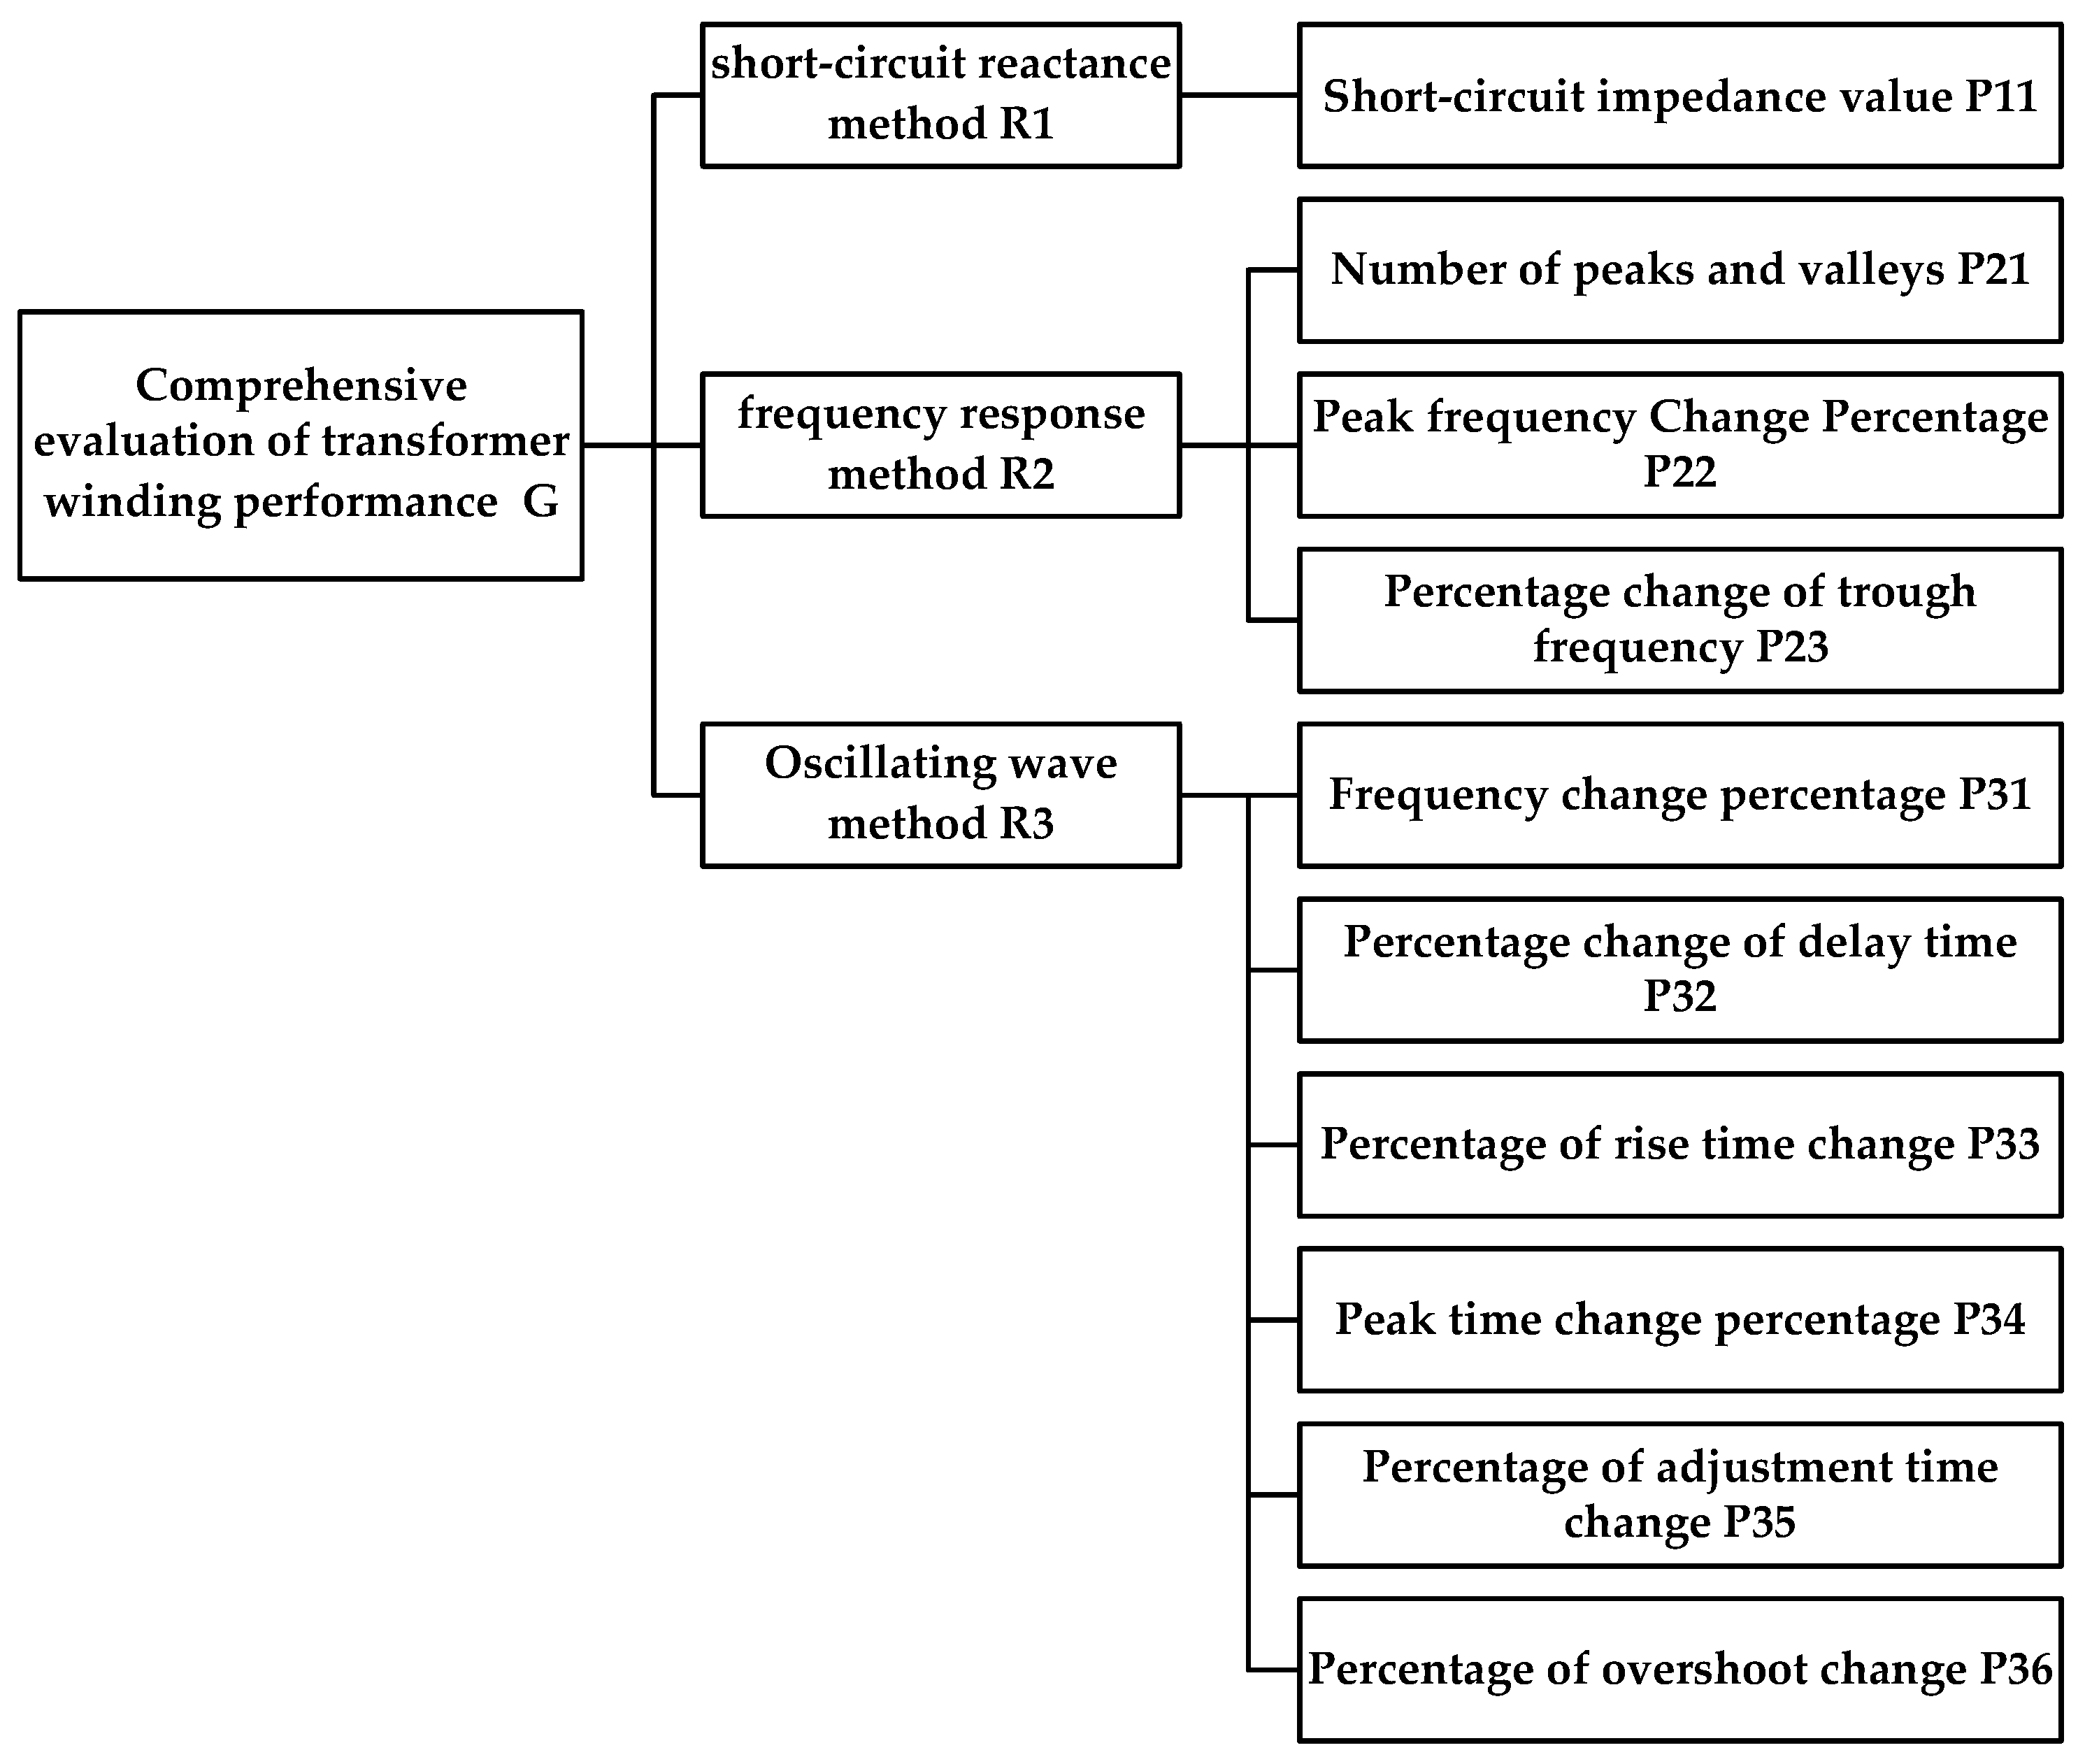
3.1. Establish Hierarchical Structure of Comprehensive Evaluation Influencing Factors

When AHP is used to analyze the comprehensive evaluation factors, it is necessary to group them and form different levels to build a hierarchical model. As shown in Figure 14, the target layer is to evaluate the performance of transformer winding; the criteria layer is the three methods to realize the evaluation; index layer is to obtain the corresponding evaluation index through the test of three methods.

3.2. Construct a Judgment Matrix and Calculate the Weights

By comparing the relative importance of each factor with respect to the factors of the previous layer, we used a scale of 1–9. We established a judgment matrix to obtain the maximum eigenvalue λ max , feature vector W , consistency index C I and consistency ratio C R of the judgment matrix. The meaning of the 1–9 scale is shown in Table 9.
In R , a i j is the ratio of the importance of i to j .
For the evaluation of transformer winding performance, the evaluation matrix of the criterion layer R to the target layer G is calculated. As shown in Table 10.
In the same way, the judgment matrix of the index layer P to the criterion layer R can be calculated, as shown in Table 11, Table 12 and Table 13.
We calculated the relative weight of each factor under a certain criterion according to the judgment matrix. This paper uses the square root method to calculate the feature vectors W and maximum eigenvalue λ max of the judgment matrix.
First, calculate the square root:
v i = n j = 1 n a i j
Then, normalize it:
w i = v i i = 1 n v i
Let the approximate feature vectors W be:
W = [ w 1 , w 2 , w n ]
Calculate the maximum eigenvalue of the judgment matrix A:
λ max = 1 n i = 1 n ( A W ) w i
Finally, use the Formula (23) to calculate the consistency target:
C I = λ max n n 1
The λ G max of the maximum eigenvalue of R to G is:
λ G max = 3.0536
Weights ( W R 1 G , W R 2 G , W R 3 G ) = ( 0.5278 , 0.3325 , 0.1396 ) .
The λ R 1 max of the maximum eigenvalue of P to R 1 is:
λ R 1 max = 1
Weights ( W P 1 R 1 ) = ( 1 ) .
The λ R 2 max of the maximum eigenvalue of P to R 2 is:
λ R 2 max = 3.0536
Weights ( W P 1 R 2 , W P 2 R 2 , W P 3 R 2 ) = ( 0.5936 , 0.2493 , 0.1571 ) .
The λ R 3 max of the maximum eigenvalue of P to R 3 is:
λ R 3 max = 6.0806
Weights ( W P 1 R 3 , W P 2 R 3 , W P 3 R 3 , W P 4 R 3 , W P 5 R 3 , W P 6 R 3 ) = ( 0.38 , 0.1489 , 0.252 , 0.0351 , 0.0351 , 0.1489 ) .
Finally, calculate the consistency ratio:
C R = C I C R
If CR < 0.1, then the judgment matrix A reaches the consistency condition; if CR ≥ 0.1, then A is not reached the consistency condition. Calculate the positive and negative matrix 1000 times to obtain R1, as shown in the following Table. As shown in Table 14.
Calculation by the Formula (28):
Criterion layer R to target layer G, C I = 0.0268 , C R = 0.0515 < 0.1 ; Index layer P to criteria layer R 1 , C I = 0 , C R = 0 < 0.1 ; index layer P to criteria layer R 2 , C I = 0.0268 , C R = 0.0515 < 0.1 ; Index layer P to criteria layer R 3 , C I = 0.0161 , C R = 0.062 < 0.1 .
The corresponding consistency ratio is:
C R = j = 1 3 W R j G C I j j = 1 3 W R j G R I j = 0.0179 < 0.1

3.3. Construction of a Fuzzy Evaluation Matrix for Comment Sets

There are six comments in the comment set for transformer winding performance evaluation: {excellent, good, medium, poor, worse, very bad}.The corresponding score set is {6, 5, 4, 3, 2, 1}. Through the questionnaire or the expert group according to the above-mentioned principles, the score statistics of the test comprehensive evaluation indicators shown in Table 15 are obtained.
Obtain the fuzzy evaluation matrix according to Table 15:
S i = [ r i 11 r i 12 r i 1 n r i 21 r i 22 r i 2 n r i m 1 r i m 2 r i m n ] ,     i = 1 , 2 , 3
In the formula, m is the number of indicators in the indicator layer; n is the number of comment sets; i is the serial number of a single factor, which represents a certain stage of testability design.
Therefore:
S T = [ S 1 S 2 S 10 ] T = [ 0.05 0.07 0.01 0.05 0.02 0 0.05 0.03 0.03 0.04 0.84 0.71 0.48 0.63 0.65 0.75 0.74 0.70 0.78 0.89 0.08 0.10 0.21 0.07 0.12 0.10 0.06 0.09 0.05 0.04 0.02 0.09 0.13 0.20 0.11 0.09 0.14 0.10 0.08 0 0.01 0 0.14 0.03 0.10 0.03 0 0.08 0.04 0.02 0 0.01 0 0.02 0 0.03 0.01 0 0.01 0 ]
The comprehensive evaluation value B is obtained by calculating the comprehensive index of fuzzy evaluation:
B = W P G = [ 0.0476 , 0.7581 , 0.0951 , 0.0631 , 0.0254 , 0.0065 ]
Calculate the score according to the principle of maximum membership:
U = 0.0476 × 6 + 0.7581 × 5 + 0.0951 × 4 + 0.0631 × 3 + 0.0254 × 2 + 0.0065 × 1 0.0476 + 0.7581 + 0.0951 + 0.0631 + 0.0254 + 0.0065       = 4.7031
The U value is close to 5. According to the comment score set, the comprehensive evaluation of the quality of the transformer winding performance is close to the level “good”.

4. Conclusions

According to the performance of transformer windings after short-circuit test, this paper defines a set of reviews of transformer winding performance: {excellent, good, medium, poor, worse, very bad}; the corresponding score set is {6, 5, 4, 3, 2, 1}. Based on the short-circuit impedance method, frequency response method, and oscillating wave method, the quantitative relationship between the performance of the transformer and the respective indicators of the three methods is obtained, and the performance of the transformer winding is evaluated through AHP and FAC. The conclusions are as follows:
(1)
The short-circuit impedance method, frequency response method, and oscillating wave method are used to evaluate the performance of the distribution transformer windings that have undergone short-circuit tests. There is no need for hanging cover inspection, which solves the subjectivity of human observation and thus the objective, accurate, and quantitative description of the performance status of the transformer winding;
(2)
Transformer after short-circuit test and evaluation of transformer winding performance by short-circuit impedance method quantitatively obtain the short-circuit impedance change rate threshold of the transformer winding quality, and set the winding quality level for different thresholds. The frequency response method is used to evaluate the performance of transformer winding, and the percentage threshold of peak-valley frequency change is quantitatively obtained, setting the winding quality level for different thresholds. The oscillation wave method is used to evaluate the performance of transformer winding, and the threshold values of frequency change percentage and rise time change percentage are obtained quantitatively, setting the winding quality level for different thresholds. Thus, the problem of quantitative evaluation of transformer winding performance after short-circuit test is solved;
(3)
The evaluation language of transformer winding performance evaluation after short-circuit test is proposed, and the method of analytic hierarchy process and fuzzy evaluation method are combined to obtain the score of transformer winding performance evaluation quantitatively, and the evaluation language is given according to the score. Finally, the evaluation of transformer winding performance after short-circuit test is realized.

Author Contributions

Conceptualization, C.S. and W.Z.; methodology, Y.R. and Y.K.; software, Y.R. and Y.W.; validation, Y.R. and Y.L.; formal analysis, Y.W.; investigation, Y.R., Y.L. and Y.K.; resources, C.S. and W.Z.; data curation, Y.R., Y.L. and Y.K.; writing—original draft preparation, Y.R. and Y.W.; writing—review and editing, Y.R. and Y.K.; supervision, C.S. and W.Z.; project administration, C.S. and W.Z. All authors have read and agreed to the published version of the manuscript.

Funding

This research received no external funding.

Institutional Review Board Statement

Not applicable.

Informed Consent Statement

Not applicable.

Data Availability Statement

Not applicable.

Acknowledgments

The authors thank the reviewers and editors for the revision of this paper and the suggestions of English editors, which will help improve the English expression, readability and quality of the article. The authors thank C.S. and W.Z. for their support and contribution to this study.

Conflicts of Interest

The authors declare no conflict of interest.

References

  1. Tang, Z.P. Simulation Analysis of Winding Deformation Characteristics and Interturn Short Circuit Fault Diagnosis of Power Transformer; Hunan University: Changsha, China, 2018. [Google Scholar]
  2. Guo, S.F. Transformer Condition Assessment Method Based on Fuzzy Comprehensive Evaluation and Support Vector Machine Regression; North China Electric Power University: Beijing, China, 2013. [Google Scholar]
  3. Arri, E.; Carta, A.; Moeei, F.; Tosi, M. Diagnosis of the state of power transformer windings by on-line measurement of stray reactance. IEEE Trans. Instrum. Meas. 1993, 42, 372–378. [Google Scholar] [CrossRef]
  4. Banaszak, S.; Szoka, W. Cross Test Comparison in Transformer Windings Frequency Response Analysis. Energies 2018, 11, 1349. [Google Scholar] [CrossRef] [Green Version]
  5. Wang, M.L. Research on Winding Deformation Evaluation and Loss Monitoring Method of Distribution Transformer; Chongqing University: Chongqing, China, 2015. [Google Scholar]
  6. Tahir, M.; Tenbohlen, S.; Miyazaki, S. Analysis of Statistical Methods for Assessment of Power Transformer Frequency Response Measurements. IEEE Trans. Power Deliv. 2021, 36, 618–626. [Google Scholar] [CrossRef]
  7. Tahir, M.; Tenbohlen, S.; Samimi, M.H. Evaluation of Numerical Indices for Objective Interpretation of Frequency Response to Detect Mechanical Faults in Power Transformers. In Proceedings of the 21st International Symposium on High Voltage Engineering, Budapest, Hungary, 26–30 August 2019; Németh, B., Ed.; Springer International Publishing: Cham, Switzerland, 2020; Volume 598, pp. 811–824, ISBN 978-3-030-31675-4. [Google Scholar]
  8. Tenbohlen, S.; Coenen, S.; Djamali, M.; Müller, A.; Samimi, M.; Siegel, M. Diagnostic Measurements for Power Transformers. Energies 2016, 9, 347. [Google Scholar] [CrossRef]
  9. Wang, Y.; Xu, D.K.; Li, Y.M.; Zhang, C. Research on low voltage pulse test system for detecting transformer winding deformation. High Volt. Technol. 1998, 24, 24–28. [Google Scholar]
  10. Huang, H.; Zhou, J.G.; Jiang, Y.M.; Chen, G.E. Diagnosis of winding deformation of power transformer by impedance method and frequency response method. High Volt. Technol. 1999, 25, 70–73. [Google Scholar]
  11. Xia, H.G. Research on Nanosecond Impulse Response Analysis Method for Detecting Slight Deformation of Transformer Winding; Chongqing University: Chongqing, China, 2010. [Google Scholar]
  12. Hashemnia, N.; Abu-Siada, A.; Islam, S. Improved Power Transformer Winding Fault Detection using FRA Diagnostics-Part1: Axial Displacement Simulation. IEEE Trans. Dielectr. Electr. Insul. 2015, 22, 556–563. [Google Scholar] [CrossRef]
  13. Aljohani, O.; Abu-Siada, A. Application of Digital Image Processing to Detect Short Circuit Turns in Power Transformers using Frequency Response Analysis. IEEE Trans. Ind. Inform. 2016, 12, 2062–2073. [Google Scholar] [CrossRef]
  14. Zhang, Z.; Gao, W.; Kari, T.; Lin, H. Identification of Power Transformer Winding Fault Types by a Hierarchical Dimension Reduction Classifier. Energies 2018, 11, 2434. [Google Scholar] [CrossRef] [Green Version]
  15. Gonzales, J.C.; Mombello, E.E. Fault Interpretation Algorithm Using Frequency-Response Analysis of Power Transformers. IEEE Trans. Power Deliv. 2016, 31, 1034–1042. [Google Scholar] [CrossRef]
  16. Ma, H.; Saha, T.K.; Ekanayake, C.; Allen, D. Modern Machine Learning Techniques for Power Transformer Condition Assessment. CIGRE Session 44; CIGRE: Paris, France, 2012. [Google Scholar]
  17. Banaszak, S.; Gawrylczyk, K.M.; Trela, K. Frequency Response Modelling of Transformer Windings Connected in Paraller. Energies 2020, 13, 1395. [Google Scholar] [CrossRef] [Green Version]
  18. Saleh, A.; Yasin, K.; Abderrahmane, B.; Nazar, M. A review of frequency response analysis methods for power transformer diagnostics. Energies 2016, 9, 879–896. [Google Scholar]
  19. Khalili Senobari, R.; Sadeh, J.; Borsi, H. Frequency response analysis (FRA) of transformers as a tool for fault detection and location: A review. Electr. Power Syst. Res. 2018, 155, 172–183. [Google Scholar] [CrossRef]
  20. Xu, C.B.; Wang, F.G.; Huang, H.; Jin, Z.J. Transformer vibration monitoring information modeling and implementation based on IEC 61850. Power Syst. Autom. 2014, 38, 60–64. [Google Scholar]
  21. Xie, P.A. Application of Vibration Analysis Method in Condition Monitoring of Power Transformer Winding; Shanghai Jiao Tong University: Shanghai, China, 2008. [Google Scholar]
  22. Saponara, S.; Fanucci, L.; Bernardo, F.; Falciani, A. Predictive diagnosis of high-power transformer faults by networking vibration measuring nodes with integrated signal processing. IEEE Trans. Instrum. Meas. 2016, 65, 1749–1760. [Google Scholar] [CrossRef]
  23. Wu, Z.Y.; Zhou, L.J.; Zhou, X.Y.; Lin, T.; Guo, L.; Liu, H.W.; Jiang, J.F. Research on fault diagnosis method of transformer winding based on oscillation wave. J. Electr. Eng. China 2020, 40, 348–357, 401. [Google Scholar]
  24. Yousof, M.; Ekanayake, C.; Saha, T.K. Frequency response analysis to investigate deformation of transformer winding. IEEE Trans. Dielectr. Electr. Insul. 2015, 22, 2359–2367. [Google Scholar] [CrossRef]
  25. Ludwikowski, K.; Siodla, K.; Ziomek, W. Investigation of transformer model winding deformation using sweep frequency response analysis. IEEE Trans. Dielectr. Electr. Insul. 2012, 19, 1957–1961. [Google Scholar] [CrossRef]
  26. Jiang, J.; Zhou, L.; Gao, S.; Li, W.; Wang, D. Frequency response features of axial displacement winding faults in autotransformers with split windings. IEEE Trans. Power Deliv. 2018, 33, 1699–1706. [Google Scholar] [CrossRef]
  27. Zhou, L.; Jiang, J.; Li, W.; Wu, Z.; Gao, S.; Guo, L.; Liu, H. FRA modelling for diagnosing axial displacement of windings in traction transformers. IET Electr. Power Appl. 2019, 13, 2121–2127. [Google Scholar] [CrossRef]
  28. Su, P.Y. Transformer Winding Fault Diagnosis Based on Lightning and Oscillating Impulse Voltage Excitation; Chongqing University: Chongqing, China, 2018. [Google Scholar]
  29. Tarimoradi, H.; Gharehpetian, G.B. Novel calculation method of indices to improve classification of transformer winding fault type, location, and extent. IEEE Trans. Ind. Informat. 2017, 13, 1531–1540. [Google Scholar] [CrossRef]
  30. Qiu, G.Y. Circuit, 5th ed.; Higher Education Press: Beijing, China, 2006. [Google Scholar]
  31. Florkowski, M.; Furgal, J.; Kuniewski, M.; Pajak, P. Comparison of transformer winding responses to standard lightning impulses and operational over voltages. IEEE Trans. Dielectr. Electr. Insul. 2018, 25, 965–974. [Google Scholar] [CrossRef]
  32. Preis, K.; Renhart, W.; Rabel, A.; Biro, O. Transient behavior of large transformer windings taking capacitances and eddy currents into account. IEEE Trans. Magn. 2018, 54, 1–4. [Google Scholar] [CrossRef]
  33. Bai, G.X. Measurement and estimation of radial geometric capacitance of transformer winding. Transformer 2007, 44, 32–36. [Google Scholar]
  34. Wu, J.L. A Theoretical Study on the Detection of Transformer Winding Deformation by Frequency Response Analysis; Wuhan University: Wuhan, China, 2004. [Google Scholar]
  35. Hou, M.Q. Lightning Modeling and Simulation Analysis of Distribution Transformer; Shandong University: Jinan, China, 2016. [Google Scholar]
  36. Javed, M.; Aftab, H.; Qasim, M.; Satter, M. RLC circuit response and analysis (using state sopace method). IJCSNS Int. J. Comput. Sci. Netw. Secur. 2008, 8, 48–54. [Google Scholar]
  37. Wu, Z.; Zhou, L.; Lin, T.; Zhou, X.; Wang, D.; Gao, S.; Jiang, F. A New Testing Method for the Diagnosis of Winding Faults in Transformer. IEEE Trans. Instrum. Meas. 2020, 69, 9203–9214. [Google Scholar] [CrossRef]
  38. Banaszak, S.; Gawrylczyk, K.M. Computer modeling in the diagnostics of transformers’ windings deformations. Comput. Appl. Electr. Eng. 2020, 8, 132–140. [Google Scholar]
  39. Al-Ameri, S.; Yousof, M.F.M.; Azis, N.; Avinash, S.; Talib, M.A.; Salem, A.A. Frequency response of transformer winding to investigate the influence of RLC. Indones. J. Electr. Eng. Comput. Sci. 2019, 14, 219–229. [Google Scholar] [CrossRef]
  40. Zhu, C.S.; Zhang, Q.; Ran, H.L.; Jiao, Y.M. Research on comprehensive evaluation method of engineering equipment testability. China Mech. Eng. 2011, 22, 1044–1048. [Google Scholar]
  41. Bohatyrewicz, P.; Płowucha, J.; Subocz, J. Condition Assessment of Power Transformers Based on Health Index value. Appl. Sci. 2019, 9, 4877. [Google Scholar] [CrossRef] [Green Version]
Figure 1. Current–voltage relationship of linear two-port.
Energies 14 05832 g001
Figure 2. Simplified equivalent model of winding.
Energies 14 05832 g002
Figure 3. Short-circuit testing transformer.
Energies 14 05832 g003
Figure 4. Relationship between short-circuit impedance change rate and deformation degree of transformer winding.
Energies 14 05832 g004
Figure 5. The frequency response of the transformer under the condition of inductance short-circuit breaking.
Energies 14 05832 g005
Figure 6. Breakline diagram of peak change of wave with inductance change.
Energies 14 05832 g006
Figure 7. Influence of ground capacitance change on transformer peak frequency change: (a) The influence of Cg1 change on the change of wave peak frequency; (b) The influence of Cg2 change on the change of wave peak frequency; (c) The influence of Cg3 change on the change of wave peak frequency; (d) The influence of Cg4 change on the change of wave peak frequency; (e) The influence of Cg5 change on the change of wave peak frequency; (f) The influence of Cg6 change on the change of wave peak frequency; (g) The influence of Cg7 change on the change of wave peak frequency; (h) The influence of Cg8 change on the change of wave peak frequency.
Energies 14 05832 g007aEnergies 14 05832 g007bEnergies 14 05832 g007c
Figure 8. Series circuit.
Energies 14 05832 g008
Figure 9. Oscillation wave curve of unit step response representing performance index.
Energies 14 05832 g009
Figure 10. Waveforms of oscillation waves in normal and first cake short circuit and break: (a) short-circuit; (b) break.
Energies 14 05832 g010
Figure 11. Influence of inductance variation of first cake on oscillation wave index parameters.
Energies 14 05832 g011
Figure 12. The broken line diagram of the influence of the increase of the ground capacitance of each cake winding of the transformer on the index of the oscillation wave system.
Energies 14 05832 g012
Figure 13. The variation law of oscillation wave parameter index with the first cake to ground capacitance.
Energies 14 05832 g013
Figure 14. Analytic hierarchy process model for comprehensive evaluation of transformer winding performance.
Energies 14 05832 g014
Table 1. Transformer quality and its definition.
Qualification of TransformerLevelDefinition
QualificationexcellentTransformer after short-circuit test, using various methods for transfer function comparison, no change, no insulation damage, a variety of excellent performance.
goodAfter the short-circuit test of the transformer, various methods are used to compare the transfer function, which basically does not change and has good performance.
mediumAfter the short-circuit test of the transformer, the transfer function is compared by various methods. There is slight change and slight deformation of the winding, but it does not affect the performance of the transformer.
DisqualificationpoorTransformer insulation damage and winding deformation
worseSerious damage to insulation, winding damage, winding deformation.
very badWinding breakup of transformer.
Table 2. Percentage of winding displacement corresponding to changes of capacitance or inductance parameters and transformer quality.
Quality IndexExcellentGoodMediumPoorWorseVery Bad
Percentage of winding displacement00–2%2–5%5–10%10–30%30% and above
Percentage of capacitance change00–1.96%1.96–4.76%4.76–9.09%9.09–23.08%23.08% and above
Table 3. Comparative analysis of short-circuit impedance of distribution transformer before and after short-circuit test.
Rate of Change of Reactance (%)Deformation DegreeQualified Test
−8.4DeformationPoor
−5DeformationPoor
−6.3DeformationPoor
33Serious deformationVery bad
45Serious deformationVery bad
−2No deformationMedium
0No deformationExcellent
4.5Slight deformationPoor
0.42No deformationGood
44Serious deformationVery bad
71Serious deformationVery bad
45Serious deformationVery bad
17.7Serious deformationVery bad
−0.94No deformationMedium
0.92No deformationMedium
1.6Slight deformationWorse
1.5DeformationWorse
−1.1Slight deformationWorse
0.36No deformationGood
3.6Slight deformationWorse
0.36No deformationGood
0No deformationExcellent
2.3Slight deformationWorse
0No deformationExcellent
25Serious deformationVery bad
−1.1Slight deformationWorse
Table 4. Short-circuit impedance change rate threshold of distribution transformer winding quality.
ExcellentGoodMediumPoorWorseVery Bad
Change rate of short-circuit impedance (%)00–0.50.5–2.51–55–1515 and above
Table 5. Frequency response frequency change and test qualification analysis.
Percentage of Parameter ChangeFrequency Change PercentageQuality Index
00Excellent
0–1.96%0–0.27%Good
1.96–4.76%0.27–0.65%Medium
4.76–9.09%0.65–1.25%Poor
9.09–23.08%1.25–3.18%Worse
23.08% and above3.18%Very bad
Table 6. Threshold of inductance parameter variation on quality index.
Percentage Change of Transformer Equivalent Inductance ParameterFrequency Change PercentagePercentage of Rise Time ChangeQuality Index
000Excellent
0–1.96%0–0.11%0–0.06%Good
1.96–4.76%0.11–0.27%0.06–0.13%Medium
4.76–9.09%0.27–0.52%0.13–0.26%Poor
9.09–23.08%0.52–1.33%0.26–0.65%Worse
23.08% and above1.33% and above0.65% and aboveVery bad
Table 7. The threshold value of transformer equivalent capacitance parameter variation on quality index.
Percentage Change of Transformer Equivalent Capacitance ParametersFrequency Change PercentagePercentage of Rise Time ChangeQuality Index
000Excellent
0–1.96%0–0.04%0–0.09%Good
1.96–4.76%0.04–0.09%0.09–0.21%Medium
4.76–9.09%0.09–0.18%0.21–0.41%Poor
9.09–23.08%0.18–0.45%0.41–1.03%Worse
23.08% and above0.45% and above1.03% and aboveVery bad
Table 8. Frequency change percentage or rise time percentage threshold.
Frequency Change PercentagePercentage of Rise Time ChangeQuality Index
00Excellent
0–0.11%0–0.09%Good
0.11–0.27%0.09–0.21%Medium
0.27–0.52%0.21–0.41%Poor
0.52–1.33%0.41–1.03%Worse
1.33% and above1.03% and aboveVery bad
Table 9. Scale meaning.
Scale a i j The Meaning of Index i to j
1Two factors are equally important
3The former factor is slightly more important than the latter
5The former factor is obviously more important than the latter
7The former factor is more important than the latter
9The former factor is more important than the latter factor
2,4,6,8Median value between adjacent factors
reciprocalIn the degree of importance, the ratio of i to j is a i j ,then the ratio of j to i is a j i = 1 a i j
Table 10. Judgment matrix of R layer to G layer.
G R 1 R 2 R 3
R 1 122
R 2 1/213
R 3 1/21/31
Table 11. Judgment matrix of the index layer P to the criterion layer R 1 .
R 1 P 11
P 11 1
Table 12. Judgment matrix of the index layer P to the criterion layer R 2 .
R 2 P 21 P 22 P 23
P 21 133
P 22 1/312
P 23 1/31/21
Table 13. Judgment matrix of the index layer P to the criterion layer R 3 .
R 3 P 31 P 32 P 33 P 34 P 35 P 36
P 31 132883
P 32 1/311/2551
P 33 1/221772
P 34 1/81/51/7111/5
P 35 1/81/51/7111/5
P 36 1/311/2551
Table 14. Average stochastic index R1.
The Order of the Matrix 12345678910
RI000.520.891.120.260.360.410.460.49
Table 15. Score statistics of each index of comprehensive testability evaluation.
Evaluation IndexExcellentGoodMediumPoorWorseVery Bad
P 11 5848210
P 21 77110901
P 22 1482113143
P 23 56372032
P 31 2651211100
P 32 07510933
P 33 57461401
P 34 37091080
P 35 3785841
P 36 4894020
Publisher’s Note: MDPI stays neutral with regard to jurisdictional claims in published maps and institutional affiliations.

