Abstract
Eliminating environmental and air pollution is one of the European Union’s priority actions in the field of transport. Poland, as a member of the European Community, is also actively involved in these activities. The flagship project, the implementation of which is expected to bring tangible effects in this respect, is the “Sustainable Transport Development Strategy until 2030”. It states that in 2030 there should be 600,000 BEVs (battery electric vehicles) on Polish roads. At present, the share of such vehicles in the automotive market in Poland is small, which is a result of a number of barriers. One of them, very important considering the preferences of Poles, is the cost of buying such a car, which is currently at least 40% higher than its counterpart with a combustion engine. Meanwhile, popularizers of electric cars believe that the cost of buying such a vehicle is offset by the subsequent costs associated with its operation. Hence, this paper determines and then compares the total purchase and operating costs of cars of the same make, same model, differing in the source of propulsion, to category M1. Cars in this category represent the largest share of the automotive market in Poland—over 75%. The main objective of the analysis conducted was to determine if a current electric passenger vehicle can be competitive with an internal combustion car in everyday use. Therefore, a relationship was developed to calculate the total cost of ownership, which takes into account all the key criteria from the point of view of private vehicle use. The utilitarian value of this research may be supported by the fact that the example of Poland and its problems concerning the issue in question may serve as a source of preliminary analysis for other countries.
1. Introduction
The idea of sustainable and balanced development is currently a valid postulate, a way of human activity in all developed and developing countries of the world.
According to [1], sustainable and balanced development aims to permanently improve the quality of life of present and future generations by properly shaping the proportions between the different types of capital: economic, human, and natural. One of the basic tenets of this concept is the principle: “think globally—act locally”.
The paradigm of sustainable development—equal treatment of the economic, social, environmental, and cultural spheres—is the basis of the development strategy and current economic policy of the European Union as well [2].
Currently, the aspect of eco-friendliness, i.e., the necessity to reduce the negative impact on the environment, is the main factor leading to the development of techniques and technologies and organizations in all fields of economy, including especially transport.
This is of great importance, since among the sectors of the economy, transport has the greatest adverse impact on the environment, and within the transport sector itself, road transport is the significant source responsible for greenhouse gas emissions.
According to the European Environment Agency, transport, together with the energy and industrysectors, has for many years been the main source of greenhouse gas emissions in the European Union (Figure 1) and accounted for 25% of GHG emissions in 2018 (Figure 2).
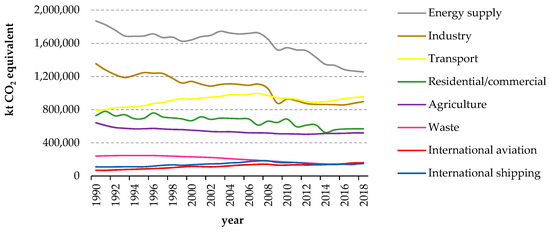
Figure 1.
Greenhouse gas emission trends in the European Union from 1990 to 2018.
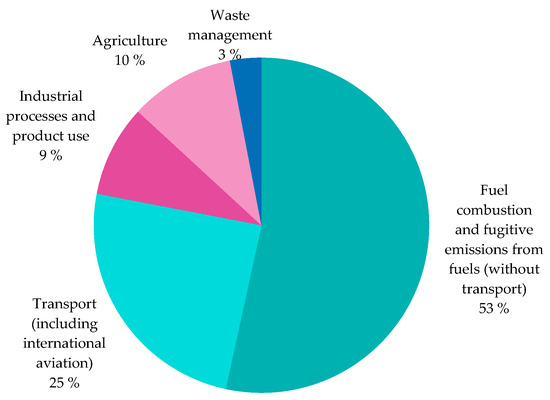
Figure 2.
Greenhouse gas emissions, by source sector in the EU, 2018 (percentage of total).
Its negative impact on the environment is mainly related to [3]:
- ✓
- Greenhouse gas emissions contributing to climate change;
- ✓
- Emission of air pollutants with negative impact on human health and natural environment;
- ✓
- Occupation of valuable natural areas and cutting their continuity (fragmentation) with newlybuilt technical infrastructure routes, contributing to the loss of biodiversity;
- ✓
- Emission of noise hazardous to human health.
Hence, the 21st century brings many questions about the future of the automotive industry. The last three decades have provided a rapid development in internal combustion engine technology. This was a consequence of improved manufacturing techniques and the introduction of electronics to the automotive industry. While manufacturers previously focused on improving engine performance and efficiency, growing environmental awareness and new regulatory requirements have resulted in a focus on technology to optimize performance and economy. As a result, modern combustion units have an increasingly low environmental impact and reduced noise emissions, while maintaining excellent engine characteristics.
According to the European Automobile Manufacturers’ Association, noise from passenger cars has been reduced by 90% since 1970 [4]. Ninety-five percent of vehicle components are recovered for use as spare parts, recyclable materials, or in energy production. In addition, road transport has seen a greater reduction in emissions compared to other modes of transport. One car in 1970 produced as much pollution as 100 cars do today. The emission limits for gaseous and particulate pollutants laid down in the European Euro 6 standard are many times lower than those previously in force. Today, particulate matter filters can reduce particulate emissions from diesel vehicles by more than 99%. In 1995, 89% of new cars emitted more than 161 g/km of CO2, and only 3% of vehicles emitted 140 g/km or less. In 2008, already 42% of new cars emitted less than 140 g/km of CO2 and only 31% more than 161 g/km. Due to stringent regulations, the exhaust gas emitted by new vehicles is already cleaner than the ambient air in some urban environments [4].
Figure 3 shows the average of CO2 emissions generated by newly sold cars in the European Union [5].
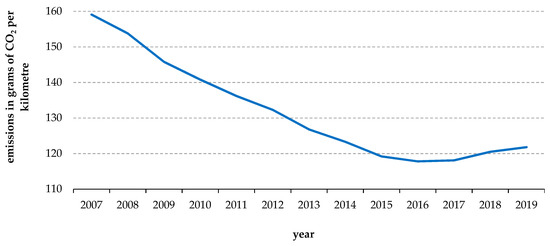
Figure 3.
Average CO2 emissions [g/km] from new vehicle passenger cars in the European Union from 2007 to 2019.
However, on a sectoral basis, the impact remains significant, due in part to the ever-increasing number of vehicles on the road [6] (Figure 4). The continuous growth in demand for transport therefore requires further measures to limit its negative effects.
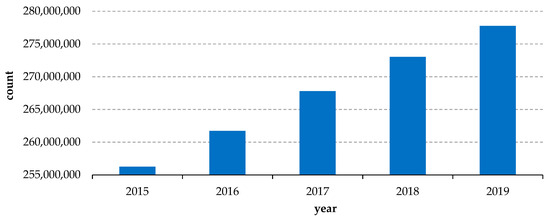
Figure 4.
Vehicles in use in the European Union.
As a result, car manufacturers are, among other things, looking for other sources of propulsion than the internal combustion engine. It should not be forgotten that oil resources—the raw material for the production of fuels used in cars—are limited, and most deposits are present in politically unstable areas. Both of these factors carry the threat of an automotive crisis. Vehicle manufacturers are aware that the one who comes up with an alternative solution that is cheaper and no less reliable than the internal combustion vehicle can become the leader of the automotive industry.
Currently, apart from the threats posed by the oil market, the ecological brand image is also very important and has a direct impact on sales results. This is due to increasing public awareness and effective lobbying by environmental organizations. Battery electric vehicles (BEVs) seem to be an alternative to internal combustion engines, especially when electricity is obtained from renewable sources [7,8,9,10].
According to the transport policy currently being implemented by the European Union, such cars are to be the most important means of transport in the future. According to the most optimistic forecasts [11], in 2035 all new passenger cars sold at that time will be fully electric (Figure 5). This is to be driven primarily by the fulfilment of specific objective 1 of the White Paper 2011, which aims to halve the number of conventionally fueled cars in urban transport by 2030 and eliminate them from cities by 2050, and to achieve essentially CO2-free logistics in major urban centers by 2030 [12].
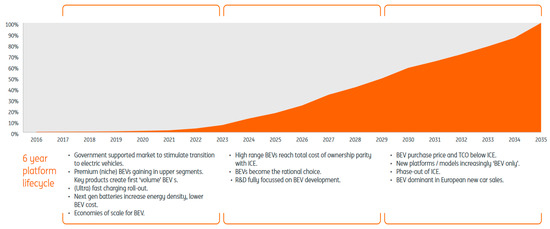
Figure 5.
BEV market development forecasts in the European Union through 2035.
More cautious assumptions were made by the European Automobile Manufacturers’ Association, which assumes that electric vehicles will account for 3–10% of new car sales in 2020–2025. However, the European Environment Agency, analyzingcurrent market data, predicts that the market share of such vehicles in those years will be at the level of 2–8%.
Electrification of the transport sector is also one of the priorities of transport policy in Poland—a member of the European Union.
To meet the high expectations towards the transport sector, the Ministry of Energy in cooperation with the Ministry of Development presented the “Package for Clean Transport”, a set of three documents that define the strategy for electromobility development in Poland [13,14,15,16], namely:
- −
- The Electromobility Development Plan;
- −
- A national policy framework for alternative fuel infrastructure development;
- −
- The Low-Emission Transport Fund.
Complementing the cited regulations is the project adopted in September 2019 entitled “Sustainable Transport Development Strategy until 2030”, which indicates, in particular, modern solutions facilitating the functioning of the entire transport sector and reducing its negative impact on the environment and climate, so as to be able to create a sustainable transport system of the country by 2030. The strategy anticipates that the number of passenger cars will remain at 26–27 million units from 2022 onwards, but the structure will change, i.e., the electric vehicle fleet will grow to reach over 600,000 units in 2030 [17].
At present, the share of BEVs on the automotive market in Poland is insignificant, amounting to 0.03% (6556 units) in 2020 (Figure 6).
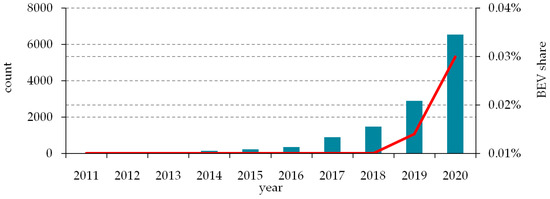
Figure 6.
BEV market in Poland.
At present, the factors that particularly impede the development of the electric vehicle market in Poland are the relatively poorly developed charging infrastructure available widely for such vehicles, long battery charging time, and a large variety of connectors.
In addition, concerns of potential BEV users relate to the potential cost and location of vehicle servicing. At present, there are no independent service points for electric cars as a result of the lack of access to service procedures for this category of vehicles. This situation may give rise to consumer concerns about increasing the price of BEV service.
The development of electromobility is also affected by the limited number of electric vehicle models that potential buyers have at their disposal, e.g., in 2020, consumers in Poland had a choice of only forty-two BEV models [18], which, in addition, could often not be seen at a car showroom and, once purchased, had to reckon with a longer waiting time for collection. In addition, not all dealers sell such cars. For example, a Volkswagen with an electric drive can be bought in Poland and then serviced only in 4 out of 85 dealerships of this concern [19].
However, the most important factors impeding the development of zero-emission transport remain the high purchase costs of electric cars compared with their combustion-ignition counterparts [20,21,22,23,24,25,26]. The catalogue purchase price of a new electric car is about 80% higher than a similarly equipped model offered with an internal combustion engine within each brand. This is some averaging because depending on the brands, the price difference can range from about 40% to as much as 140%.
Table 1 compares the prices of BEVs with conventionally powered cars of similar power and equipment.

Table 1.
Price of selected new passenger cars with different engines in Poland [PLN].
Meanwhile, the automotive market in Poland is dominated by internal combustion vehicles (Figure 7) [27]), of which only 8% were at most 3 years old in 2019. Cars between 10 and 20 years old constituted at that time 43% of the total number of passenger cars, and cars over 20 years old—38%, i.e., the total number of passenger cars over 10 years old constituted 81% of the total number of passenger cars in Poland (Figure 8) [28].
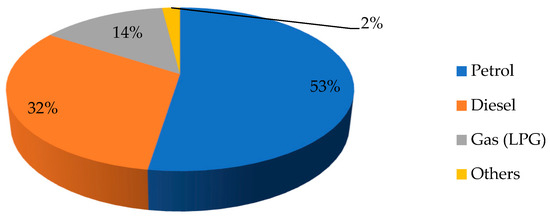
Figure 7.
Passenger cars in use, by fuel type in Poland, 2019.
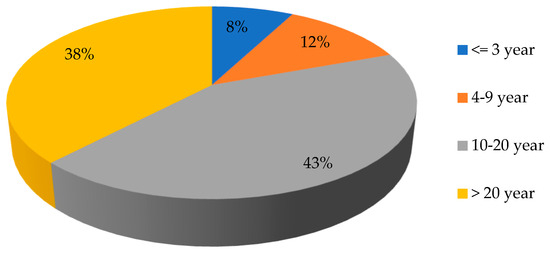
Figure 8.
Age structure of Poland’s car fleet in 2019.
The average age of a car on Polish roads is about 14 years [29]. In 2019, about twice as many used passenger cars were bought in Poland as new ones, and this proportion has remained the case since Poland joined the European Union, as the price of the vehicle and the significant decrease in the initial value of new vehicles over time are the most important factors for the buyer.
According to companies selling used passenger cars, the average purchase price of such a vehicle in Poland in 2019 was PLN 17,000 [30], the median price of a used car was PLN 18,900 [31,32].
Meanwhile, analyzing the prices of electric cars on the secondary market, the average price of an accident-free BEV in Poland, with no damage, is currently PLN 140,982, while the median price is PLN 122,900. The cost of purchasing the BEVs most frequently bought in Poland has been presented in Table 2.

Table 2.
Aftermarket of electric cars in Poland [PLN].
However, enthusiasts of such vehicles believe that the high purchase price is offset by the relatively small costs associated with operating a BEV. They argue that a simplistic approach to cost-effectiveness, emphasizing purchase cost, may lead to the conclusion that a more expensive electric vehicle a priori will not be worthwhile at this time. According to them, this simplification is unjustified and may lead to wrong conclusions as it does not take into account the numerous cost components other than purchasing. Therefore, they propose a holistic approach, reflected in total cost of ownership (TCO), which takes into account the actual, total costs associated with buying, commissioning, using, maintaining, and selling assets. This was the approach chosen as the most reliable and appropriate for the purposes of this research. As a result, one of the first comparisons in Poland was made of the economics of an electric passenger car relative to a conventional vehicle under conditions of long-term, everyday use. In determining the TCO, the actual total purchase cost, fuel cost, insurance, maintenance and repairs, taxes, and surcharges were considered (Figure 9).
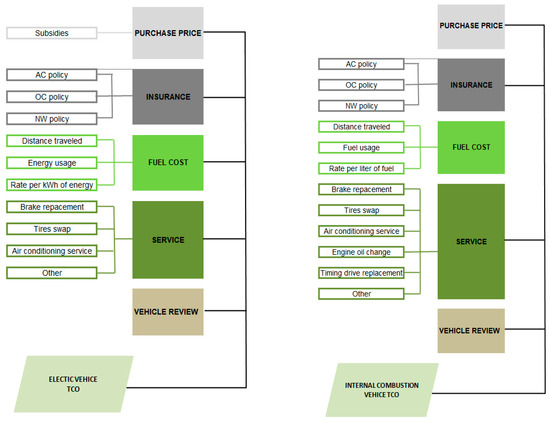
Figure 9.
TCO model for the vehicles analyzed.
The analysis made it possible to determine whether the electric passenger car can currently compete with a combustion engine car in common use in Polish conditions. Similar analyses have already been conducted by authors in other countries. However, the results of individual calculations differ even when the analyses are carried out for vehicles of the same type and, as a consequence, they arrive at divergent conclusions that favor electric vehicles to various degrees [33]. Authors make different initial assumptions and use different methods to calculate total vehicle operating costs. In addition, economic and political conditions significantly affect the results of calculations; therefore, the results of analyses with the same initial assumptions made for different countries may differ (the presence and amount of subsidies, different electricity and fuel rates, different regulations on allowances for electric vehicles, depreciation charges, and taxes).
In their analyses, authors usually compare the TCO of vehicles with different propulsion types from one market segment (mini, city, compact, or premium cars). For each segment, the total cost of ownership curves for the multi-year analysis are different. For example, for an analysis performed under Belgian conditions, vehicles were divided into three classes: city cars, mid-range cars, and premium cars [34]. According to the results of this analysis, electric city cars are not economically attractive without enabling battery leasing, which only select manufacturers’ offers. In the remaining vehicle classes, the differences in TCO are smaller, but again, the TCO of electric vehicles does not equal that of conventionally powered vehicles after the assumed analysis period (7 years). Another analysis, conducted for Swedish conditions, showed that the electric vehicle analyzed could be cost-effective with appropriately chosen amounts of government subsidies [35]. By subsidizing the purchase of an electric car with 22% of the initial price, the TCO of an electric car can be more than 5% lower than a conventional or hybrid car after just 3 years of use.
The authors of another publication [36] demonstrate that plug-in hybrid cars are the most cost-effective type of vehicles in Germany because the variable costs related to their operation are relatively low and the purchase price is not as high as for electric cars. According to another study, the profitability of electric cars strongly depends on the distance traveled per year. According to the authors, electric cars are a cost-effective solution when considering urban vehicles that travel at least 41.6 km per day. Vehicles from other segments of the market may be worthwhile for covering a greater daily distance of 77.9 km [37].
2. Case Study
The confronted vehicles are models of one brand, differing in propulsion sources and systems assigned to the same market segment (SUV), having the same or comparable total power, the same type of body, type of drive (cars with a conventional engine—on four wheels, with an electric motor—on the rear wheels), and automatic transmission.
The variants considered were:
Variant 1—a car with a spark-ignition engine (ZI);
Variant 2—a car with a compression ignition engine (SI);
Variant 3—a car with an electric motor (EV).
Table 3 contains technical parameters, costs related to, among others, purchase and other indicators related to the vehicles considered.

Table 3.
Technical parameters and purchase costs of the analyzed vehicles.
2.1. Description of the Analysis Methodology Adopted
In determining the TCO, for the purposes of this study, an attempt was made to take into account as many cost components as possible, which, irrespective of the type of vehicle analyzed, were divided into:
- −
- One-off: purchase cost, purchase subsidy;
- −
- Recurrent: costs of fuel, service, maintenance, etc.
2.1.1. One-Off Costs
Taking advantage of the experience of other countries, where the catalyst for electromobility development proved to be financial support instruments for electric vehicle buyers, on 26 June 2020 the National Fund for Environmental Protection and Water Management and the Ministry of Climate launched the only program for individual customers to date, i.e.,“Green car—financing the purchase of an electric passenger car (M1)” under which it was possible to apply for co-financing to purchase a fully electric, brand new passenger car of M1 category. Purchased vehicles may not be used for commercial activities within the meaning of EU competition law, including agricultural activities. Moreover, they cannot be entered in the records of fixed assets used in business activities [38].
Individuals could apply for a subsidy of 15% of the purchase price of an electric car, i.e., a maximum of PLN 18,750 for a maximum price of PLN 125,000.
In the conducted analysis, the purchase cost of the tested vehicles was determined based on the data provided by the manufacturer. The purchase price of the electric car analyzed is PLN 268,900 and it is too high to take into account the financial subsidy in force in Poland.
2.1.2. Recurring Costs
Recurring costs are all costs that the vehicle owner incurs over the life of the vehicle. Of these, operating costs related to the consumption of the energy carrier used to power the vehicle have the greatest impact on the final TCO [39].
In order to make a comparative analysis of the vehicle operating costs, the energy consumption and fuel consumption were averaged so that the value was the same for the entire period of analysis, and the annual distance traveled by the vehicles was assumed to be the same. The costs of filling up internal combustion engine vehicles and charging electric vehicles were determined for normal driving (15,000 km/year) in a mixed cycle, according to fuel prices, charger network, and average energy prices for individual consumers applicable in Poland in 2021.
Charging costs were calculated based on the car’s initial and final charging parameters (current battery state of charge—20%, expected battery state of charge—80%), the operator’s offered tariffs and its components (energy consumed, charging time, if any), while average energy consumption was based on battery capacity data and the manufacturer’s declared average range WLTP (Worldwide Harmonized Light-Duty Vehicles Test Procedure).
The cost of driving 100 km by an electric car was calculated by assuming that charging is performed by the amount of energy according to the average energy consumption needed to cover 100 km, based on the calculation elements of the selected tariff and the maximum charging power characteristic for the tested vehicle.
Table 4 presents the costs related to fueling/charging of the surveyed vehicles at public filling stations in Poland, while Figure 10 presents the cumulative costs related to fueling/charging of the surveyed vehicles during the 10-year period under analysis.

Table 4.
Cost of driving 100 km for the analyzed vehicles [PLN].
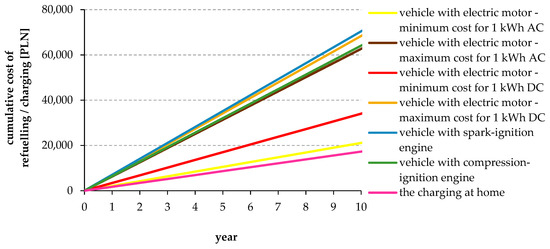
Figure 10.
Cumulative charging/refueling costs of the surveyed vehicles [PLN].
For reasons of clarity, in the case of the charging costs determined for charging at public charging points, we have limited ourselves to present the cumulative charging costs determined for the minimum and maximum price per 1 kWh at public AC and DC charging stations.
The insurance rate for a given vehicle is determined on the basis of many factors, i.e., the value of the vehicle, the owner’s data (age, driver’s seniority, years of harmless driving, place of residence), the engine power, the vehicle version, and its intended use. The third-party liability premium is obligatory, but in order to ensure full insurance of the vehicle against damage due to collision, natural elements, vehicle theft or its devastation, as well as protection of life and health of the driver and passengers, it is necessary to pay also the AC (Autocasco) and NNW (Personal Accident Consequence) premiums. All of these components were included in the analysis.
Currently, insurance premiums for electric vehicles are higher than their conventional counterparts, primarily due to the higher initial value of the vehicle. In the analysis performed, the actual amounts for the tested vehicles were assumed, according to the data from their insurance policies.
Service costs depend on the type of car, the intended use and the annual distance traveled. This covers all repairs and replacements of consumable items on the vehicle (brake pads, tires, fluids, etc.) for the life of the vehicle.
Service costs are lower for electric cars due to the fact that electric vehicles have fewer moving parts, e.g., engine oil and fuel filters are not changed (Table 5). Brake discs and pads also wear much more slowly due to the ability of the electric machine to brake significantly [34,35].

Table 5.
Maintenance of an electric and internal combustion vehicle.
In the study, sample market rates for individual repairs were assumed and the expected frequency of their replacement was estimated based on manufacturer’s data and service companies’ recommendations. Maintenance costs were then spread evenly across all years of analysis.
The costs of the inspection were assumed in accordance with the binding rate, which amounts to PLN 99 per year (including the registration fee). However, due to the fact that newly purchased vehicles are subject to analysis, it has been taken into account that such a vehicle has to undergo inspection only after 3 years of operation, then within 2 years from the first technical inspection. After this period, further inspections are performed annually [40].
2.2. Scenarios Analyzed
The total cost of using an electric car was calculated for the following scenarios:
Scenario 1—The electric car is charged only at home from an electrical outlet (price per 1 kWh—PLN 0.73);
Scenario 2—Electric vehicle charging is carried out only at public AC charging stations (calculations take into account the lowest price per 1 kWh (PLN 14.08));
Scenario 3—Electric vehicle charging is carried out only at public AC charging stations (calculations take into account the maximum amount per 1 kWh (PLN 41.8));
Scenario 4—Electric vehicle charging is carried out only at public DC charging stations (calculations take into account the lowest price per 1 kWh (PLN 22.7));
Scenario 5—Electric vehicle charging is carried out only at public DC charging stations (calculation takes into account the maximum price per 1 kWh (PLN 45.58)).
2.3. Results of the Analysis
- −
- Scenario 1 (charging an electric car only at home from an electrical outlet). For the analyzed scenario, Figure 11 demonstrates the total cost of BEV ownership over 11 years, while Figure 12 compares it with the TCO for vehicles with an internal combustion engine.
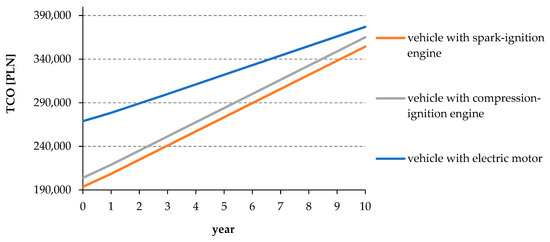 Figure 11. Total cost of ownership over the life of the vehicle.
 Figure 12. Total cost of ownership.
 - −
- Scenario 2 (charging of an electric car is carried out only at public AC charging stations (the calculation takes into account the minimum amount per 1 kWh). For the analyzed scenario, Figure 13 demonstrates the total cost of BEV ownership over 10 years, while Figure 14 compares it with the TCO for vehicles with an internal combustion engine.
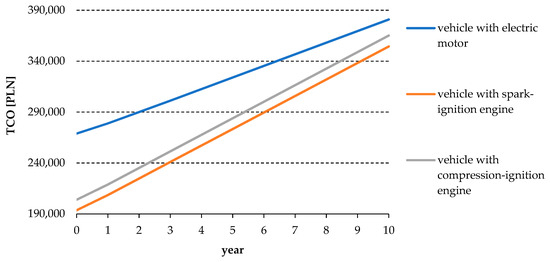 Figure 13. Total cost of ownership over the life of the vehicle.
 Figure 14. Total cost of ownership.
 - −
- Scenario 3 (charging of an electric car is carried out only at public AC charging stations (the calculation takes into account the maximum amount per 1 kWh). For the analyzed scenario, Figure 15 demonstrates the total cost of BEV ownership over 10 years, while Figure 16 compares it with the TCO for vehicles with an internal combustion engine.
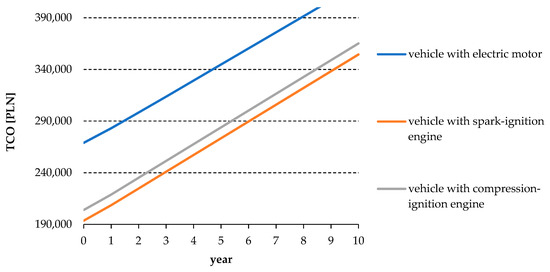 Figure 15. Total cost of ownership over the life of the vehicle.
 Figure 16. Total cost of ownership.
 - −
- Scenario 4 (charging of an electric car is carried out only at public DC charging stations (the calculation takes into account the minimum amount per 1 kWh). For the analyzed scenario, Figure 17 demonstrates the total cost of BEV ownership over 10 years, while Figure 18 compares it with the TCO for vehicles with an internal combustion engine.
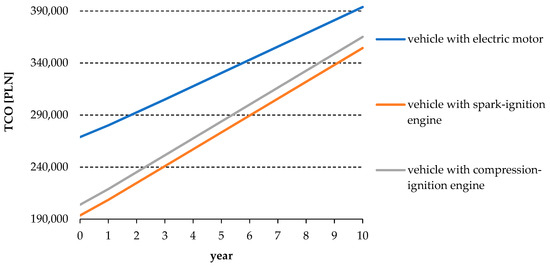 Figure 17. Total cost of ownership over the life of the vehicle.
 Figure 18. Total cost of ownership.
 - −
- Scenario 5 (charging of an electric car is carried out only at public DC charging stations (the calculation takes into account the maximum amount per 1 kWh). For the analyzed scenario, Figure 19 demonstrates the total cost of BEV ownership over 19 years, while Figure 20 compares it with the TCO for vehicles with an internal combustion engine.
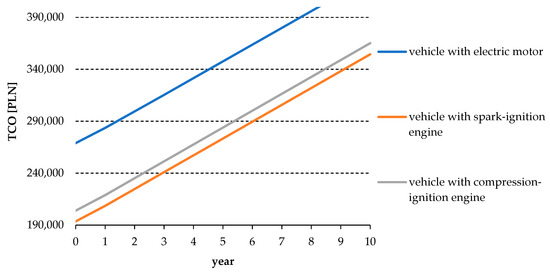 Figure 19. Total cost of ownership over the life of the vehicle.
 Figure 20. Total cost of ownership.
3. Results
Analyzing the results obtained, it should be stated that irrespective of the charging method used (home charging, AC or DC charging at public charging stations), for each of the scenarios analyzed the total costs of car ownership TCO is always higher for an electric vehicle (Table 6) than for its combustion-engine counterpart. The biggest difference between the two is when BEV charging is done with DC chargers, while the smallest difference is when electric car charging is done solely at home from an electrical outlet. The lowest total costs of vehicle ownership for the period analyzed were determined for a car with a spark-ignition engine (ZI).

Table 6.
The difference between the total cost of ownership of an electric car and the TCO of an internal combustion vehicle [%].
The biggest influence on the TCO of an electric car of all the components is the purchase cost. In the analyses conducted, the acquisition cost of an electric vehicle represents about 70% of the total cost. Therefore, it is crucial to support the purchase of passenger electric vehicles, irrespective of the amount of the purchase price of such a vehicle (at present, natural persons could apply for a subsidy amounting to 15% of the purchase price of an electric car, i.e., a maximum of PLN 18,750 at a maximum price of PLN 125,000). This is important and it would bring the expected results, since the total operating costs in the period under analysis, i.e., the costs of charging/refueling, insurance, and maintenance, are lower for an electric vehicle than for a car with a conventional engine, irrespective of the method used to charge the BEV. Figure 21 shows the total costs associated with the use of the analyzed vehicles over 10 years. The total operating cost of the BEV was determined for different ways of charging it.
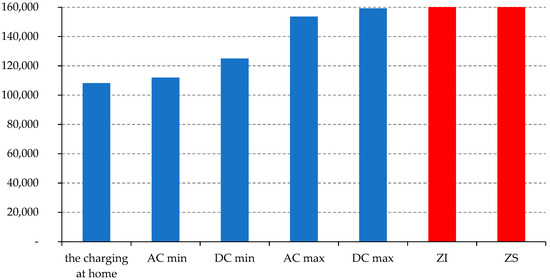
Figure 21.
Total operating costs of the analyzed vehicles over 10 years [PLN].
If a subsidy of PLN 18,750 is applied to all BEVs, irrespective of their purchase price, the total cost of ownership of a BMW ×3 would equal that of its conventional counterpart, i.e., a car with a compression-ignition engine (ZS), after at least 8 years. It is a condition that BEV charging only takes place at home or at public AC charging stations for a minimum rate per 1 kWh (Figure 22).
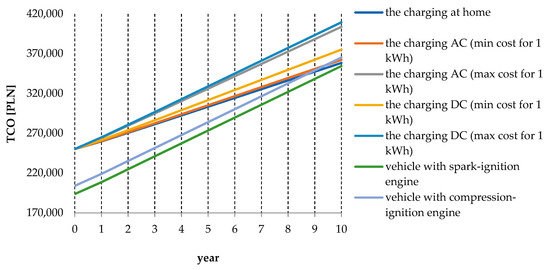
Figure 22.
Total cost of ownership over the life of the vehicle. Support for purchase of an electric car—PLN 18,750.
On the other hand, when the support for the purchase of all electric vehicles would amount to 15% (in the case of the vehicle under analysis: PLN 40,335), this would result in the total costs of operating a BMW x3 becoming equal to that of its conventional counterpart much faster—in the case of a car with a diesel engine after 5 years, and with a petrol engine after 7 years (Figure 23). In both cases, as above, charging must only be done at home or at public AC charging stations.
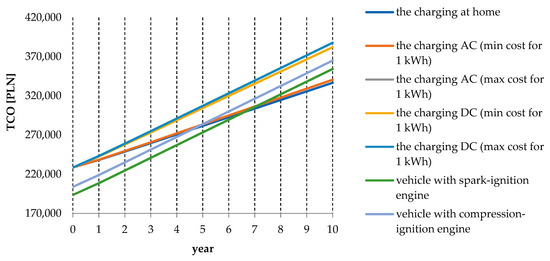
Figure 23.
Total cost of ownership over the life of the vehicle. Support for the purchase of an electric car—15%.
4. Conclusions
The future of the automotive market is linked to the use of electric motor technology. Due to increasing restrictions on CO2 emissions and the growing uncertainty of the oil market, manufacturers are forced to look for alternative automotive solutions. An electric motor seems to be the best solution.
At present, the market of electric passenger vehicles in Poland is poorly developed, which is undoubtedly related to their purchase price. It is such that despite the lower costs associated with their use compared to their internal combustion engine counterparts, the total cost of ownership is higher than for conventional vehicles. Therefore, in order for electric cars to be economically competitive with their combustion counterparts, appropriate steps need to be taken to lower the TCO. Admittedly, there are already privileges that reduce the costs associated with operating a BEV, but the reduction is insignificant.
Electric cars are exempt from fees in paid parking zones. Assuming daily parking in the paid parking zone for 1 h, the annual saving will be about PLN 750. For those who are forced to leave their vehicle in such a zone for the time of work (8 h), the annual saving may amount to about PLN 6000.
According to the Act on Electromobility and Alternative Fuels, drivers of conventionallypropelled vehicles are required to pay a fee, which may be up to PLN 2.50 per hour, to be able to drive in the Clean Transport Zone. Assuming the maximum possible rate, it will cost PLN 1260 per year for a combustion car to stay in this zone for an average of two hours per day. With this assumption, using an electric car will also bring an additional financial benefit. However, in Poland, so far the only city that has introduced a clean transport zone was Krakow, and it was in force in the required form for only two months. It was protested by inhabitants and entrepreneurs conducting business in its area, and as a result it was replaced with a limited traffic zone, which made it practically meaningless. The local authority has extended access to the zone for suppliers to 10 h a day, and will allow access from 9 a.m. to 5 p.m. to any vehicle whose driver indicates that they are a customer or contractor of any business operating in the zone.
Electric vehicles have the advantage of using bus lanes. This enables more efficient mobility in conurbations with heavy traffic and can reduce the energy consumption of an electric vehicle, thus reducing charging costs. Meanwhile, in Poland, electric car drivers enjoy the privilege of driving on bus lanes, as long as they drive in the four largest cities, namely Warsaw, Krakow, Wroclaw, and Lodz.
So, in order to encourage consumers to buy an electric car it seems reasonable to introduce:
- −
- Subsidies for their purchase regardless of their price;
- −
- Tax relief, i.e., a significant reduction in the price of the vehicle already at the time of purchase
So that their purchase price is leveled out, compensating to a degree approaching the purchase price of a conventional car. This is very important considering the fact that after 8 years or 160,000 km it is recommended to replace the battery in an electric car, which generates an additional cost of PLN 86,000 to 100,000.
Such subsidies for electric vehicles are being successfully implemented, among others, in the countries of Central and Eastern Europe, where electromobility is also in its initial phase of development. One example is Romania, where under the “Rabla Plus” program (2017) subsidies for fully electric cars amount to approximately PLN 40,000. According to data from the European Automobile Manufacturers’ Association, in 2018 the country recorded the largest (at over 220% y/y) increase in electric car registrations of all EU member states, apart from Denmark.
Buyers of electric cars are supported financially in other countries of the community, including those where the electromobility market is at a much higher level of development than in Poland. For example, there are currently over 300,000 electrically powered cars on the road in Germany, compared to 40 times less in Poland. Despite this fact, they decided to increase subsidies for zero- and low-emission vehicles there in November 2019. In the case of BEV models costing less than PLN 171,000, the support was increased to PLN 26,000, while for BEV models costing more than PLN 171,000 it was decided to increase the subsidies to PLN 21,000.
In addition, electric cars in Germany registered before 31 December 2020 are exempt from motor vehicle tax for 10 years.
A similarly expansive benefits package is available to EV buyers in France, which for the first nine months of 2019 ranked third in terms of EV registrations in the European Union. Since 2008, a bonus-malus system has been in force in France, under which the purchase of vehicles with the highest emission levels is charged with additional fees exceeding PLN 43,000. On the other hand, buyers of electric cars can count on environmental bonus at the level of about PLN 26,000, which, however, cannot exceed 27% of the value of subsidized vehicle. Additionally, those who decide to scrap their old car with a petrol or diesel engine and replace it with an EV are entitled to PLN 11,000. As a result, the total amount of subsidies that buyers of electric vehicles can count on may be as high as PLN 36,000. Taking into account the fees charged to combustion models, buying an EV in France becomes even more profitable, which is reflected in the dynamic development of the electromobility market there.
Author Contributions
Conceptualization, E.S.-M. and K.G.; methodology, E.S.-M.; software, E.S.-M.; validation, E.S.-M. and K.G.; formal analysis, E.S.-M.; investigation, E.S.-M.; resources, E.S.-M.; data treatment, E.S.-M.; writing—preparing an original project, E.S.-M.; writing—review and editing, E.S.-M. and K.G.; visualization, E.S.-M.; supervision, E.S.-M.; project administration, E.S.-M.; obtaining financing, E.S.-M. All authors have read and agreed to the published version of the manuscript.
Funding
This research received no external funding.
Institutional Review Board Statement
Not applicable.
Informed Consent Statement
Not applicable.
Data Availability Statement
Not applicable.
Conflicts of Interest
The authors declare no conflict of interest.
References
- Piontek, F. Controversies and dilemmas around sustainable and balanced development. Economics and sustainable development. Theory Educ. 2001, 1, 17–44. [Google Scholar]
- Koreleski, K. Semantic, theoretical and practical problems of sustainable development-eco-development. Sci. J. Agric. Acad. Kraków 1999, 18, 61–68. [Google Scholar]
- Merkisz, J.; Jacyna, M.; MerkiszGuranowska, A.; Pielecha, J. Exhaust emissions from modes of transport under actual traffic conditions. In Energy Production and Management in the 21st Century; WIT Press: Southampton, UK, 2014; Volume 190. [Google Scholar]
- European Environment Agency. Transport and Environment, On the Way to a New Common Transport Policy; Office for Official Publications of the European Communities: Copenhagen, UK, 2007. Available online: https://www.eea.europa.eu/publications/eea_report_2007_1/file (accessed on 3 June 2021).
- JATO. Available online: https://www.jato.com/ (accessed on 3 June 2021).
- European Automobile Manufacturers’ Association. Available online: https://www.acea.be/uploads/publications/report-vehicles-in-use-europe-january-2021.pdf (accessed on 3 June 2021).
- Sendek-Matysiak, E. Electric cars as a new mobility concept complying with sustainable development principles, Computational technologies in engineering (TKI’2018). In Proceedings of the 15th Conference on Computational Technologies in Engineering, Almaty, Kazakhstan, 19–23 August 2019; Volume 2078, pp. 1–6. [Google Scholar]
- Eberle, U.; von Helmolt, R. Sustainable transportation based on electric vehicle concepts: A brief overview. Energy Environ. Sci. 2010, 3, 689–699. [Google Scholar] [CrossRef]
- Omahne, V.; Knez, M.; Obrecht, M. Social Aspects of Electric Vehicles Research—Trends and Relations to Sustainable Development Goals. World Electr. Veh. J. 2021, 12, 15. [Google Scholar] [CrossRef]
- Faria, R.; Moura, P.; Delgado, J.; de Almeida, A.T. A sustainability assessment of electric vehicles as a personal mobility system. Energy Convers. Manag. 2012, 61, 19–30. [Google Scholar] [CrossRef]
- ING Economics Department. Raport ING-Breakthrough of Electric Vehicle Threatens European Car Industry. Available online: https://www.ing.nl/media/ing_ebz_breakthrough-of-electric-vehicle-threatens-european-car-industry_tcm162-128687.pdf (accessed on 3 June 2021).
- European Commission. White Paper on Transport, Roadmap to a Single European Transport Area—Towards a Competitive and Resource-Efficient Transport System. Available online: https://ec.europa.eu/transport/sites/transport/files/themes/strategies/doc/2011_white_paper/white-paper-illustrated-brochure_en.pdf (accessed on 2 June 2021).
- Ministry of Energy. Available online: https://seo.org.pl/ministerstwo-energii-pakiet-na-rzecz-czystego-transportu/ (accessed on 2 June 2021).
- Ministry of Energy. Available online: https://www.gov.pl/attachment/75d21d4a-fd28-400e-b480-a3bbc3f7db5e (accessed on 3 June 2021).
- Ministry of Energy. Available online: http://www.subregioncentralny.pl/downloadnews/krajowe-ramy-polityki-rozwoju-infrastruktury-paliw-alternatywnych.pdf (accessed on 3 June 2021).
- Ministry of State Assets. Available online: https://www.gov.pl/web/aktywa-panstwowe/fundusz-niskoemisyjnego-transportu (accessed on 3 June 2021).
- Gov.pl Web Portal. Available online: https://www.gov.pl (accessed on 3 June 2021).
- Polish Alternative Fuels Association. Available online: https://pspa.com.pl (accessed on 3 June 2021).
- Volkswagen Poland. Available online: https://www.volkswagen.pl (accessed on 3 June 2021).
- Zaniewska-Zielińska, D. Problems of electromobility development in Poland. Eur. Reg. 2018, 35, 63–78. [Google Scholar] [CrossRef]
- Krawiec, S.; Krawiec, K. Development of electromobility in Poland. Determinants, objectives and barriers. Sci. J. Univ. Econ. Katow. 2017, 332, 17–24. [Google Scholar]
- Nikołajewka, A.; Adey, P.; Cresswell, T.; Lee, J.Y.; Nóvoa, A.; Temenos, C. Commoning mobility: Towards a new politics of mobility transitions. Trans. Inst. Br. Geogr. 2019, 44, 346–360. [Google Scholar]
- Correa, D.F.; Beyer, H.L.; Fargionec, J.E.; Hill, J.D.; Possingham, H.P.; Thomas-Hall, S.R.; Schenka, P.M. Towards the implementation of sustainable biofuel production systems. Renew. Sustain. Energy Rev. 2019, 107, 250–263. [Google Scholar] [CrossRef]
- Standing, C.; Standing, S.; Biermann, S. The implications of the sharing economy for transport. Transp. Rev. 2018, 39, 226–242. [Google Scholar] [CrossRef]
- Pisonia, E.; Christidis, P.; Thunis, P.; Trombetti, M. Evaluating the impact of “Sustainable Urban Mobility Plans” on urban background air quality. J. Environ. Manag. 2019, 231, 249–255. [Google Scholar] [CrossRef] [PubMed]
- Sendek-Matysiak, E. Key barriers to electromobility development in Poland. Transp. Overv. 2020, 3, 8–14. [Google Scholar]
- European Automobile Manufacturers’ Association. Available online: https://www.acea.be/statistics/tag/category/passenger-car-fleet-by-fuel-type (accessed on 3 June 2021).
- Statistics Poland. Available online: https://stat.gov.pl/ (accessed on 7 June 2021).
- European Automobile Manufacturers’ Association. Available online: https://www.acea.be/statistics/tag/category/average-vehicle-age (accessed on 3 June 2021).
- AAA AUTO. Available online: https://www.aaaauto.pl (accessed on 3 June 2021).
- OTOMOTO. Available online: https://www.otomoto.pl (accessed on 3 June 2021).
- Samar; Automotive Market; Research Institute. Available online: https://www.samar.pl (accessed on 3 June 2021).
- Żebrowski, K.; Detka, T.; Małek, K. Comparative analysis of report data on CO2 emissions and total cost of ownership (TCO) of an electric vehicle with respect to a conventionally powered vehicle. Electr. Mach. Probl. Pap. 2018, 3, 161–170. [Google Scholar]
- Lebeau, K.; Lebeau, P.; Macharis, C.; Van Mierlo, J. How expensive are electric vehicles? A total cost of ownership analysis. World Electr. Veh. J. 2013, 6, 996–1007. [Google Scholar] [CrossRef]
- Hagman, J.; Ritzen, S.; Janhager, J.; Susilo, Y. Total cost of ownership and its potential implications for battery electric vehicle diffusion. Res. Transp. Bus. Manag. 2016, 18, 11–17. [Google Scholar] [CrossRef]
- Plotz, P.; Gnann, T.; Wietschel, M. Total Ownership Cost Projection for the German Electric Vehicle with Implications for Its Future Power and Electricity Demand, 7th Conference on Energy Economics and Technology Infrastructure for the Energy Transformation. 2021. Available online: https://www.researchgate.net/publication/267825503_Total_Ownership_Cost_Projection_for_the_German_Electric_Vehicle_Market_with_Implications_for_its_Future_Power_and_Electricity_Demand (accessed on 3 June 2021).
- Wu, G.; Inderbitzin, A.; Bening, C. Total cost of ownership of electric vehicles compared to conventional vehicles: A probabilistic analysis and projection across market segments. Energy Policy 2015, 80, 196–214. [Google Scholar] [CrossRef]
- Sendek-Matysiak, E.; Łosiewicz, Z. Analysis of the Development of the Electromobility Market in Poland in the Context of the Implemented Subsidies. Energies 2021, 14, 222. [Google Scholar] [CrossRef]
- Palmer, K.J.; Tate, E.; Wadud, Z.; Nellthorp, J. Total cost of ownership and market share for hybrid and electric vehicles in the UK, US and Japan. Appl. Energy 2018, 209, 108–119. [Google Scholar] [CrossRef]
- ISAP. Internet System of Legal Acts. Regulation of the Minister of Infrastructure of 29 September 2004 on the Fees Associated with Running a Vehicle Inspection Station and Carrying out Technical Inspections of Vehicles. Available online: http://isap.sejm.gov.pl/isap.nsf/DocDetails.xsp?id=WDU20042232261 (accessed on 3 June 2021).
Publisher’s Note: MDPI stays neutral with regard to jurisdictional claims in published maps and institutional affiliations. |
© 2021 by the authors. Licensee MDPI, Basel, Switzerland. This article is an open access article distributed under the terms and conditions of the Creative Commons Attribution (CC BY) license (https://creativecommons.org/licenses/by/4.0/).