Article

Open-Pit Mine Dewatering Based on Water Recirculation—Case Study with Numerical Modelling

by
Kazimierz Różkowski
1,*,
Robert Zdechlik
2 and
Wojciech Chudzik
3
1
Faculty of Civil Engineering and Resource Management, AGH University of Science and Technology, al. Mickiewicza 30, 30-059 Krakow, Poland
2
Faculty of Geology, Geophysics and Environmental Protection, AGH University of Science and Technology, al. Mickiewicza 30, 30-059 Krakow, Poland
3
Lafarge Aggregates and Concrete, Aleje Jerozolimskie 142B, 02-305 Warsaw, Poland
*
Author to whom correspondence should be addressed.
Energies 2021, 14(15), 4576; https://doi.org/10.3390/en14154576
Submission received: 12 May 2021 / Revised: 22 July 2021 / Accepted: 26 July 2021 / Published: 28 July 2021
(This article belongs to the Special Issue Mining Innovation)

Abstract

:
The layout of the dewatering system in open-cast mining must be adapted to mining assumptions and to the size of expected inflows, which, in turn, depend on natural conditions and the operation of other mines and groundwater intakes, affecting the arrangement of the hydrodynamic field. This case study analyses possible dewatering solutions related to a change in the mining drainage system: decommissioning by flooding of a depleted deposit and dewatering of a new one located in the vicinity. As part of numerical modelling, a solution was sought to minimise the environmental impact of drainage. Forecast calculations for two drainage alternatives were made. One of the solutions follows the classic approach: independent dewatering of the new excavation. The second solution assumes the recirculation of waters from dewatering of the new mine through their discharge into a closed and flooded pit located in the vicinity. The results of the forecasts for both variants point to the modification of the hydrodynamic field resulting from expected volumes of inflows and different environmental effects. The use of numerical simulations assisted the selection of the optimal dewatering solution.

Graphical Abstract

1. Introduction

The proper exploitation of mineral resources requires the exploitation project and subsequent mining works to be adjusted to the natural conditions identified during the documentation of the deposit. One of the analysed factors includes water conditions (hydrogeological and hydrological), which, in view of the growing environmental awareness, are among the most important ones—both in the course of obtaining a mining license and at the operational stage.
In most cases, the dewatering of open-cast mine workings is necessary to ensure the safety of preparatory works and mining operations. In the case of waterlogging of a section to be mined, a drainage system is constructed, which drains the rock mass up to the depth of the bottom of the planned mining level. As a result, a zone of lowered groundwater pressure (depression cone) is created, sometimes covering the area at a considerable distance from the boundaries of the excavation. The size of inflows depends on a number of factors, including the size of the excavation, the depth of mining and dewatering, hydrogeological parameters of the rock mass, location of the excavation in relation to surface watercourses, flow barriers, or climatic conditions [1]. Therefore, significant amounts of water may have to be pumped out as part of dewatering. The problem is further exacerbated by a high temporal variability of inflows, which also depends on the irregular variability of precipitation, which sometimes may even be short-term in the form of torrential rainfall. That is why it is necessary to select parameters of the used dewatering system properly, which must be able to cope with pumping out increased inflows to ensure operation under specified design conditions. Sample characteristics of inflows to mines are presented, among others, in [2,3,4,5].
Mine working dewatering generates additional costs of mine exploitation. The expenses are connected with the purchase of particular components of the dewatering system, their servicing, and, directly, with costs of electricity consumed. Therefore, a proper selection of dewatering system parameters—not only in strictly technical terms (e.g., parameters of pumps) but also in environmental terms (proper spatial and depth location of pumping devices, optimal use of water, and soil conditions by, e.g., water transfer)—is of great importance. When it comes to cost calculation, it becomes increasingly necessary to include the minimisation of negative environmental effects of drainage, as lowering the groundwater level around the excavation significantly can cause, e.g., problems with vegetation, problems with water supply, etc., often determining the possibility of mining works.
In order for large-scale dewatering operations to be carried out in an optimal manner, they should be preceded by a multivariate and multicriteria analysis considering various dewatering scenarios depending on the objective to be achieved. One of the ways of limiting environmental costs of dewatering may include the recirculation of pumped waters, which consists in their reintroduction to the rock mass directly (e.g., by injection) or indirectly (by discharge into, e.g., inactive mine workings). Although the accumulation of water in the reservoir and, consequently, in the rock mass may lead to the intensification of inflows to the operating mine, the total effect, especially the environmental one, despite the necessity of pumping increased amounts of water, may turn out to be more beneficial. The scale of inflow increase will depend on rock mass parameters, distance of the flooded pit and damming water level, and on the quantity of recycled water. An additional advantage of this recirculation method is the use of the existing excavation with a specified capacity, which is first filled with pumped water. The essence of the proposed solution is to achieve the assumed environmental effects and to specify the optimum parameters for the operation of such a combined system.
To make reliable predictions, methods of mathematical modelling of groundwater flow processes should be used. Groundwater flow modelling is considered one of the most accurate methods in hydrogeology related to the analysis of the hydrodynamic field, taking into account various stresses [6,7,8,9]. Numerous examples equally demonstrate the usefulness of this method in solving inflow issues in underground [10,11,12,13,14] and open-pit mining [15,16,17,18,19,20,21]. The reliability of forecast calculations greatly depends on the correct recognition of the water–soil environment. Methods for the assessment of hydrogeological parameters and their use in mine flooding predictions are presented in [15,22], while the possibilities of using groundwater flow modelling to optimise water abstraction are presented in [23,24].
In practical applications, both the finite difference method—based on simulators of the MODFLOW family [25]—and the finite element method—the FEFLOW programme [26]—are used to model inflows in mining. Simulation calculations may be carried out for steady-state or transient conditions. The calibrated model is used to carry out simulation calculations with the aim to assess the impact of the conducted exploitation on the groundwater environment and to predict changes in the hydrodynamic field as a result of the application of new stresses resulting from the considered changes in the horizontal and depth range of exploitation and dewatering. At the same time, analyses are carried out in terms of the process of flooding workings as a result of rising waters in the rock mass after shutting down the dewatering system.
In the case under consideration, the application of model tests made it possible for the proposed mining solutions to assess the expected environmental effects (associated with both dewatering and flooding of excavations). The ability to compare the results of the forecasts with the actual effect of flooding the workings, which started after conducting this study and has been in progress for over 2 years, is also very valuable.

2. Materials and Methods

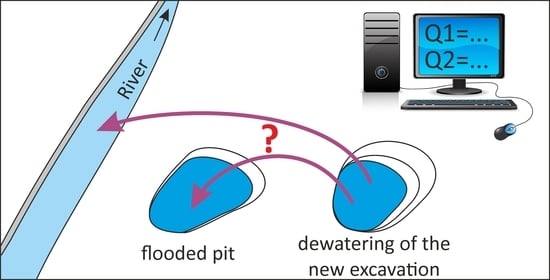
2.1. Characteristics of the Problem
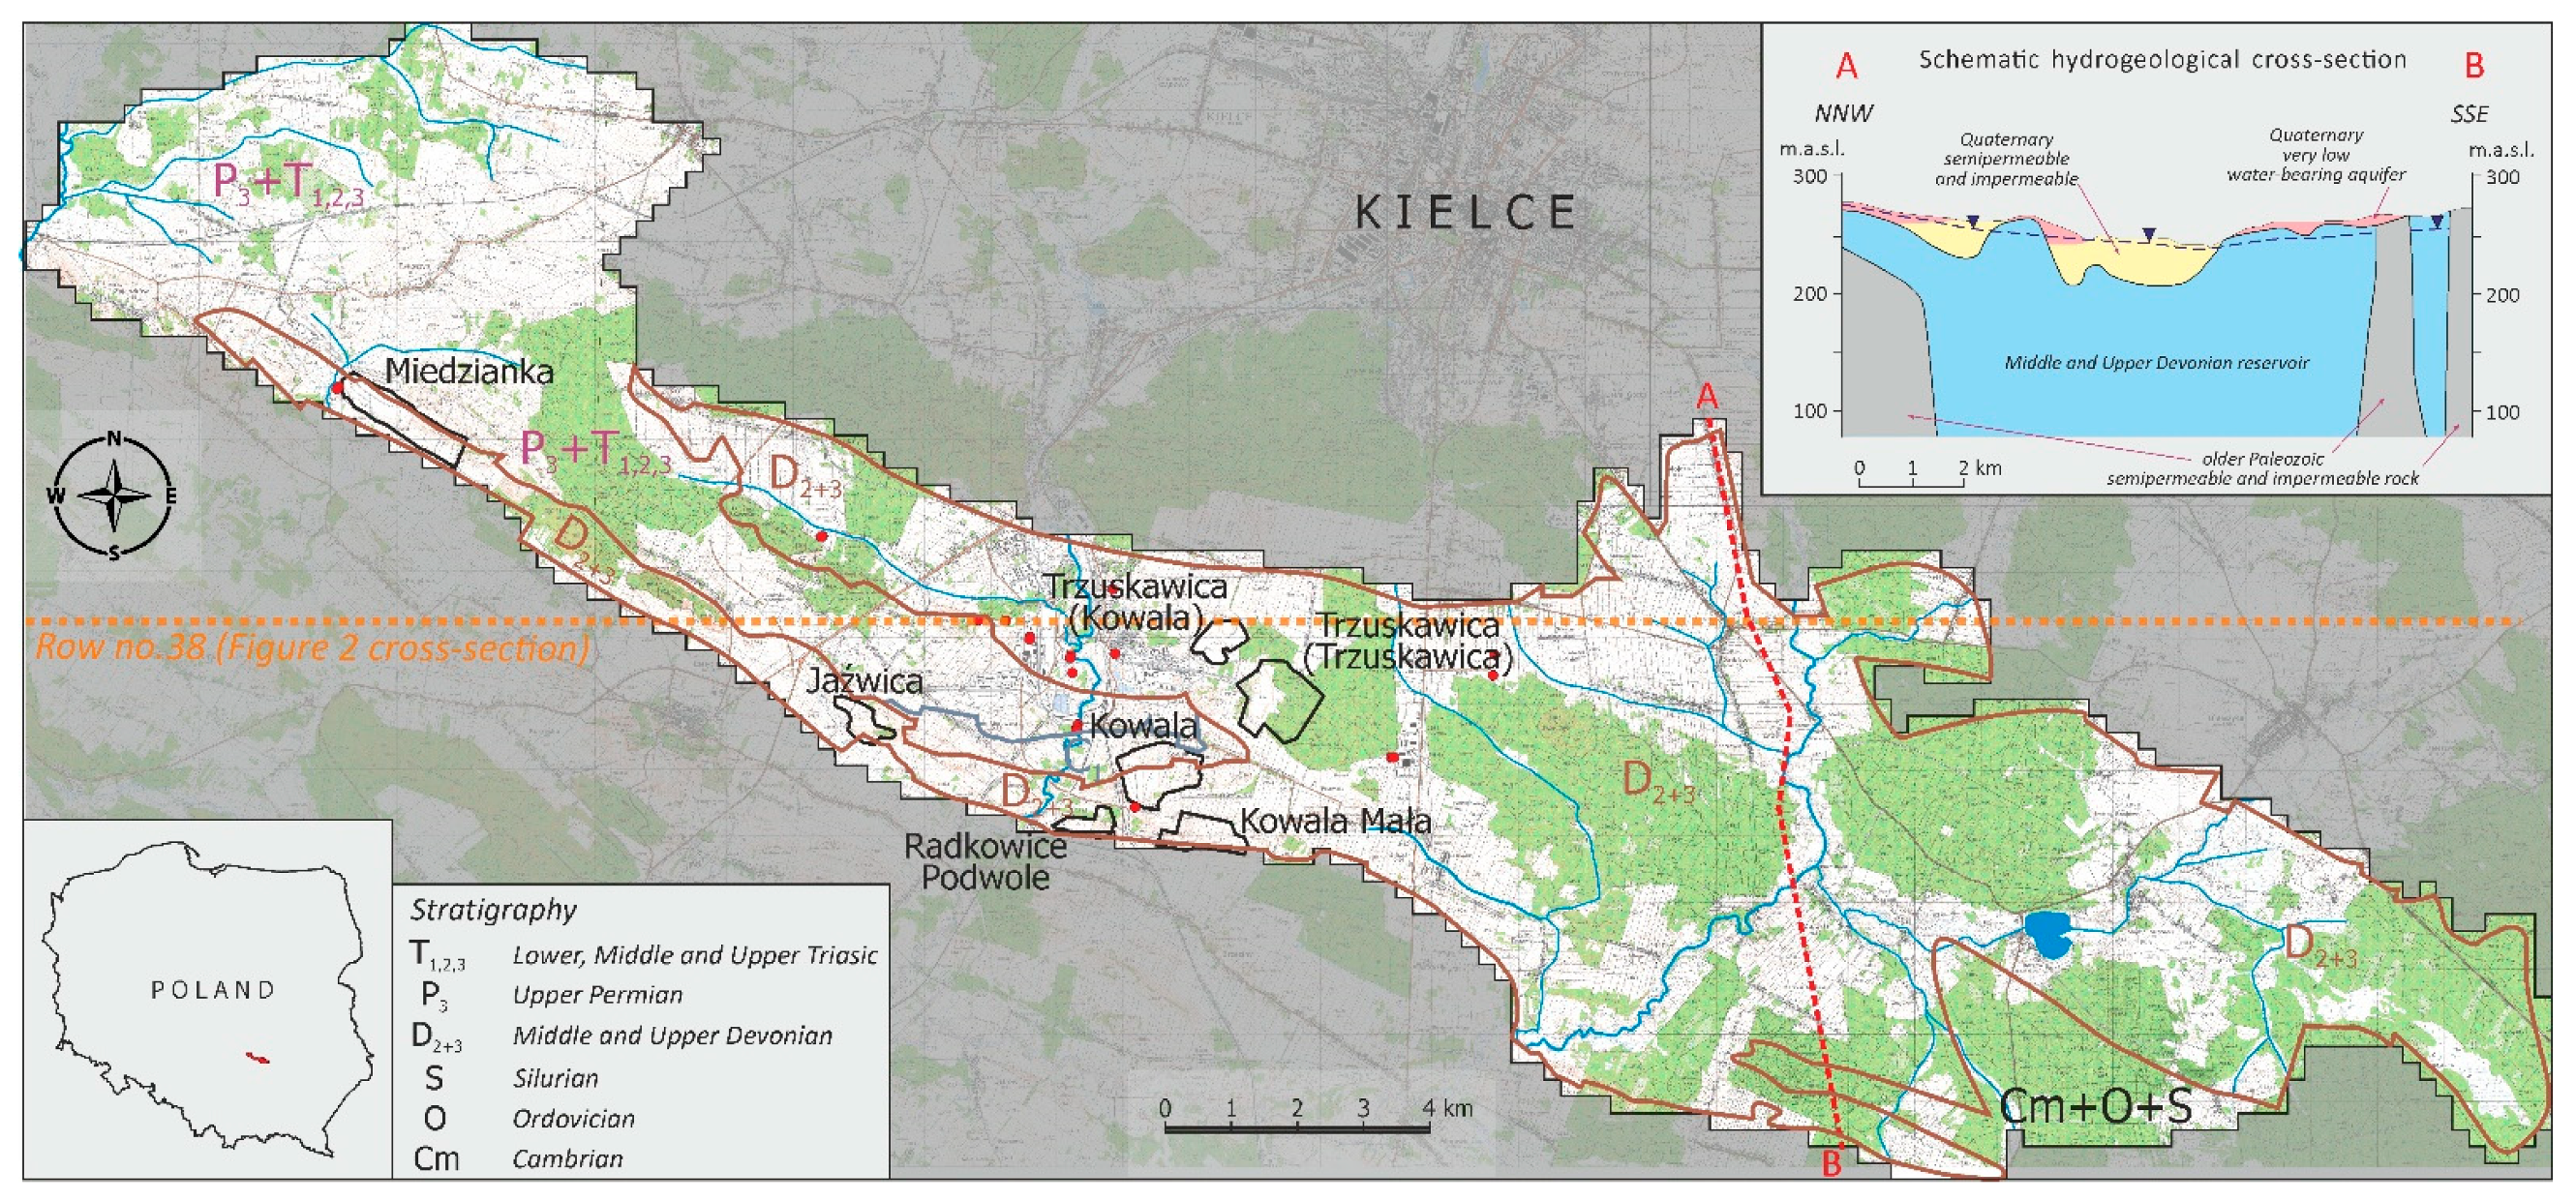
Numerical modelling applied to simulate the effects of the designed technical solutions was used to analyse changes in water relations in the surroundings of two adjacent deposits—Radkowice-Podwole and Kowala Mała, located in the vicinity of Kielce in the central southern part of Poland (Figure 1). In the case of the Radkowice-Podwole deposit, the depletion of resources led to a decision to terminate exploitation and commence preparations for water reclamation. On the other hand, exploitation was continued in the Kowala Mała deposit opened in 2010, which is located approximately 700 m to the east of the Radkowice-Podwole deposit. Until now (2021), access and exploitation works have been carried out to the depth corresponding to the ordinate of +230 m above sea level, within the drained rock mass remaining in the range of a depression cone created as a result of dewatering the neighbouring deposit to a level located 40 m below (+190 m above sea level). In the final stage of the exploitation and dewatering of the Radkowice-Podwole deposit, about 27,000 m3/day of water was drained, as a result of which the excavation had the status of the largest drainage object in the area, exerting significant pressure on the groundwater environment and distinctly lowering the groundwater table across a considerable area.
Along with the plans of deepening the exploitation of the Kowala Mała deposit and simultaneous termination of the drainage of the Radkowice-Podwole deposit, it became necessary to start draining the Kowala Mała deposit. Taking into account previous drainage conditions, two alternative scenarios were considered. One of the scenarios assumed the application of a “classic” solution, which was to flood the Radkowice pit with water coming from the natural inflow (open-pit liquidated by self-sinking-natural groundwater inflow from the aquifer only) and to dewater the Kowala Mała pit independently. The second scenario also considered flooding the Radkowice pit, but with water from two sources: from natural inflow and piped from the dewatering of the Kowala Mała pit. This assumption, through partial recirculation of water, makes it possible to limit the negative impact on the environment. The analysis of the obtained model prognosis results supported the process of making decisions concerning the designed dewatering system of the Kowala Mała mine.

2.2. Study Area

The Kowala Mała dolomite deposit is one of several neighbouring rock deposits intensively exploited within the boundaries of the Gałęzice–Bolechowice–Borków syncline (Figure 1). The syncline is a structural unit of the Świętokrzyskie Mountains, about 4–6 km wide and 30 km long, filled mostly with permeable Devonian sediments, locally with Carboniferous, Permian and Quaternary cover. The Dyminy and Chęciny anticlines that surround it to the north and south are made up of low-permeability Lower Palaeozoic sediments. In the north-western part, there are Triassic sediments, which are permeable in a part of the profile.
The Gałęzice–Bolechowice–Borków syncline is a productive aquifer system characterised by good water quality. The resources are used by water intakes that supply, among others, a significant part of the nearby city of Kielce (population of about 200,000 inhabitants). Carbonate water-bearing formations form a fissure-karstic aquifer with hydraulic conductivity in the range of 2 × 10⁻⁶ ÷ 9 × 10⁻⁴ m/s [27]. Due to good hydrogeological parameters, Major Groundwater Reservoir (MGR) No. 418 (Gałęzice–Bolechowice–Borków) was identified within the boundaries of the syncline. According to the national Polish classification [28], an MGR is a geological structure or its fragments with the highest water-bearing and storage capacity in the scale of hydrogeological regions. Within the boundaries of MGR No. 418, covering an area of 132.5 km2, disposable resources of 63,816 m3/day were documented [27].
The groundwater of the Devonian aquifer belongs to low mineralised ones with the specific electrolytic conductivity in the range of 550–650 µS/cm. Due to the carbonate environment, it is characterised by a weakly alkaline reaction. With the predominance of ions originating from the dissolution of dolomites and limestones, the water is described to be of a bicarbonate–calcium (HCO3–Ca) or bicarbonate–calcium–magnesium (HCO3–Ca–Mg) type. The sulphate concentrations observed throughout the region reach slightly elevated values in the 50–70 mg/dm3 range. Incidentally, increases in chloride ion concentrations can be observed. Concentrations of inorganic nitrogen compounds remain at low levels. In conclusion, water from the network of observation wells in the vicinity of the pit should be considered of good quality. Unfortunately, water quality analyses are not conducted directly in the flooded pit.
Within the boundaries of the syncline, carbonate sediments—dolomites, limestones, and marls—are mined. Intensive mining works are currently carried out by several mining plants (Figure 1): Miedzianka, Jaźwica, Trzuskawica (two pits), Kowala, Kowala Mała, and until recently also Radkowice. The first one is located at the north-western end of the structure, while the other four are adjacent to each other in the central part of the syncline.
The Radkowice-Podwole dolomite deposit was cut by five excavation levels up to the ordinate of +190 m a.s.l., descending over 60 m below the surface of the ground. Along with the exhaustion of the Radkowice-Podwole deposit, the nearby Kowala Mała deposit was explored, with its resources documented in 2005. Deposit exploitation commenced in 2010 and a few years later it was decided to terminate works within the Radkowice-Podwole deposit. In the Kowala Mała excavation, at particular levels up to the level four inclusive, which correspond to the ordinates: I +270 m a.s.l., II +255 m a.s.l., III +240 m a.s.l., and IV +230 m a.s.l., works were carried out “dry” (without dewatering), as a result of the pit remaining within the depression cone of the neighbouring Radkowice mine. In the second quarter of 2020, works commenced at the next level–V (+215 m a.s.l.). Ultimately, in accordance with the assumptions made on the model, exploitation will be carried out up to +200 m a.s.l.
In the vicinity of the adjacent mines in the central part of the syncline, exploiting raw materials from levels located below the original groundwater table and ongoing dewatering operations led to the formation of depression cones, which over time merged and lowered the water table on a regional scale. In 2016 (for which the hydrodynamic state was reconstructed on the model), the total water abstraction from groundwater intakes reached 6037 m3/day, with a simultaneous volume of water abstracted by mine drainage systems being almost 12 times higher (about 70,000 m3/day). The total volume pumped out by intakes and drainage systems of the mines exceeds the disposable resources of the aquifer (63,816 m3/day) [27], which is a very safe estimation. However, it should be taken into account that a part of the water discharged within the drainage system also originates from mostly forced river infiltration into rock mass. When planning further mining activities in functioning opencast mines, the question of their impact on the water and ground environment is crucial. This aspect may prevail in the decision-making process of appropriate authorities and institutions and may determine the possibilities of further mine exploitation.

2.3. Numerical Model of Hydrogeological Conditions

The numerical model of groundwater flow was prepared using the Processing Modflow programme [29,30]. The geometry of the hydrogeological structure was represented in the model by division into layers for which top and bottom elevations of lithostratigraphic units were determined. Tables containing values of hydraulic conductivity (Table 1) and effective recharge from the infiltration of precipitation were run on the model in a similar way. The nature of changes in pressure or flow in individual cells is defined by determining the so-called boundary condition, which allows stresses affecting groundwater (e.g., exchange with surface water, drainage, etc.) to be mapped.
The developed model was prepared on the basis of a multilayered hydrogeological model of the Gałęzice–Bolechowice–Borków syncline [31,32,33], which has been in use for several years [34]. It was updated to include the amount of the discharged mine water from 2016 and the ordinates of drainage in mine workings as of mid-2017. Subsequently, recalibration was carried out using the current inflows to mines and measurements of the water table position. The completed study covered the area of the Gałęzice–Bolechowice–Borków syncline (Figure 1) spanning over 215 km2. The adopted range of the model makes it possible to study groundwater flow in a regional system, which considers the interaction between groundwater and surface water and local stresses caused by the existing drainage centres related to the extraction of groundwater or mining drainage.
Groundwater recharge results mainly from the infiltration of precipitation and, to a lesser extent, the infiltration of surface water from rivers and streams. Groundwater and surface water are hydraulically connected with each other, which leads to their mutual exchange. Under natural conditions, surface watercourses were drainage zones for groundwater. As a result of the exploitation of groundwater intakes and the dewatering of opencast mines, the original hydrodynamic field saw a transformation. In the vicinity of the dewatered mine workings, the groundwater table dropped considerably, forcing an increased infiltration of water from precipitation and surface watercourses.
The extent of the area covered by the model study was determined on the basis of geological structure and hydrogeological conditions. The boundaries of the model comprised mining pits and groundwater intakes whose activities shape the hydrodynamic field within the considered water-bearing structure. The model is constrained from the south, north, and east by impermeable formations of the Middle Devonian and older Palaeozoic. In the north-western direction, the boundary is based on the course of the Łososina and Czarne Stoki Rivers (Figure 1).
Horizontally, the model study area was discretised based on an irregular grid. A basic division into 250 m × 250 m square cells was adopted. In the central part of the modelled area featuring numerous mine workings and groundwater intakes, the grid was linearly doubled: the objects of larger importance (contours of dewatered pits and intake wells) were mapped on the grid with a block size of 125 m × 125 m. The modelled area was contained in a rectangle comprising of 85 rows and 196 columns, which corresponded to the real size of 17.5 km × 38.25 km.
Vertically, the modelled area was divided into 4 numerical layers (Figure 2). Layer 1 comprises Quaternary water-bearing sediments (mainly sands and gravels in river valleys and glacial deposits; the stratum is discontinuous, locally reaching the thickness of over 50 m). Layer 2 comprises formations occurring in the roof part of the older bedrock, with lower values of filtration parameters (limestones of the lower part of the Upper Devonian, mostly approximately 30 m thick). Layer 3 represents the main aquifer in the studied area (mostly limestones and dolomites of the Middle Devonian; thickness within the model boundaries ranges from approximately 80 to nearly 130 m). Within this layer, groundwater is exploited using deep wells and mining excavations are drained. Layer 4 represents the Devonian part of the aquifer below the primary layer, with lower filtration parameters. For Layer 1, unconfined groundwater flow conditions were assumed. For the remaining layers (2, 3, and 4), mixed confined/unconfined conditions with variable transmissivity were adopted. This way best represents the existing hydrogeological conditions influenced by changes in mining conditions (mine drainage). However, a side effect may be numerical problems associated with rewetting of dry cells during the iterative solution, the minimization of which may require the use of a MODFLOW-NWT solver.
For the contours of mine workings within Layer 3, first-type (Dirichlet) boundary conditions were assumed, allowing inflow to workings of a known drainage ordinate to be simulated. This implementation method serves to correctly represent the functioning dewatering systems. By assuming a known ordinate of the ongoing dewatering (lowest exploitation level), the model was adjusted to actual measurements and observations at the stage of calibration (in this case, the amount of pumped waters). Application of first-type boundary conditions requires control and proper balancing of inflows to mines, obtained in simulations. Alternatively, third-type (Robin) boundary conditions may be used (drain module), but this in turn enforces the necessity of the correct assumption of the values of drain hydraulic conductance.
Forecast calculations were performed under steady-state flow simulation. This research method comes down to the determination of the target state resulting from the assumed stresses, without indicating any intermediate states that characterise the temporal variability of the considered phenomenon. This assumption does not require the use of discretisation of the duration of the considered process and the presented results concern the state after stabilisation of the hydrodynamic field in the simulated system of stresses.
In the table of initial hydraulic heads, corrections were required in blocks with first-type boundary conditions, assumed for Layer 3, corresponding to the contours of dewatered pits. They were assigned values corresponding to the ordinates of the bottom of dewatered levels of active open-cast mines, located within the modelled area, averaged according to the state as of the middle of 2017. In the case of the Radkowice mine, the level of +190 m a.s.l. was assumed.
The values of hydraulic conductivity (horizontal and vertical) corresponding to the modelled aquifers were introduced in zones of cells and then modified during model calibration. Karst phenomena, which are typical of carbonate aquifers, were obviously documented, although their recognition is irregular and only local. Taking into account the regional scale of the study and the adopted degree of discretisation (cell sizes), the model calculations were based on parameter values typical of pore and fracture aquifers. Modifications of filtration parameters were rather limited in some locations where archival studies point to the local presence of karst phenomena.
The distribution of hydraulic conductivity of individual layers obtained after model calibration is presented in the form of synthetic statistics in Table 1.
The average amount of effective recharge from infiltration of atmospheric precipitation reached 4.64 × 10⁻⁴ m3/day/m2 after model calibration, which is about 27% of the volume of mean annual precipitation recorded for Kielce (629 mm, [35]). Recharge from the infiltration of precipitation was assumed as a second-type boundary condition, with the option of recharge being applied to the highest active cells. The magnitude of the infiltration rate varies depending on the permeability of rocks present in near-surface layers, degree of land development, and location within the range of depression cones of mines and groundwater intakes.
Within Layer 1, the rivers located in the study area were simulated (Figure 3). Due to the limited hydraulic contact between surface water and groundwater, watercourses were simulated with third-type boundary conditions. This way of modelling requires information about the hydraulic conductance of the riverbed (including width and length of watercourse sections) in individual cells and the representation of the hydraulic head. During model calibration, the hydraulic conductance of the riverbed, which determines the contact between surface water and groundwater, was slightly modified.
Intake wells with a constant yield were simulated using second-type boundary conditions. The model included numerous deep wells, from which regular water abstraction was carried out in 2016. Constant well yields, defined as daily averages based on the actual registered abstraction in 2016, were assumed to a total of 6037 m3/day, of which 1089 m3/day was within Layer 1 and 4948 m3/day in the boundaries of Layer 3. In each of the variants, the majority of wells operate under conditions of cooperation, remaining under the hydrodynamic influence of neighbouring intakes or dewatered pits.

3. Results

3.1. Model Calibration

For the numerical computation of groundwater filtration equations, a finite difference method (FDM)-based simulator from the widely used MODFLOW family [8] was used, with MODFLOW-2005 [25] being the most commonly used version at present. The GMG iterative method (solver) was chosen. This method of implementation in the case of an aquifer with significant filtration parameter variability ensures stable numerical calculations [9]. The prepared model was subjected to a calibration process using the results of the authors’ own field measurements of the groundwater table depth conducted in mid-2017 in 53 boreholes where no direct water abstraction was carried out (3 boreholes filtered within the Quaternary aquifer and 50 within the Devonian one) and using information on the actual amounts of water discharged as part of dewatering operations performed by individual mines (averaged for 2016). The trial-and-error method [8] was applied to perform the calibration. The original model was previously calibrated to a different hydrodynamic state. Therefore, it can be considered that the calibration was verifying in nature with respect to the earlier version of the model, calibrated to a different state. During the calibration, the spatial distribution of hydraulic conductivity (mainly within Layer 3) was modified and, to a lesser extent, parameters of the riverbed were modified. Only slight changes to the recharge from precipitation were made.
As a result of the calibration, a numerical hydrogeological model was developed, which generates results (water table arrangement and inflows to dewatered excavations) similar to those observed in reality (the so-called Variant 0—the current hydrodynamic state after model calibration). For the adopted calibration points, the differences between the measured water table and that obtained as a result of the interpolation of the resulting matrix distribution from the model were insignificant and, in principle, did not exceed the value of a single meter. The arrangement of the measurement pointed directly in the vicinity of the diagonal of the calibration plot (Figure 4), meaning that there was a good fit of the model response to the actual observations.
Considered as the calibration criteria, the error rates were: mean error ME = 0.23 m and mean absolute error MAE = 1.91 m. The normalised value, i.e., related to the amplitude of the water table fluctuation in the considered structure (138 m), of the mean absolute error was calculated to 1.39%. The volumes of inflows to individual pits obtained from the model after the calibration (QM) in relation to the observed actual inflows, collected from the operators of the pits (QR), differed to a very small degree (Table 2). Absolute differences QM–QR did not exceed several tens of m3/day.
The total amount of water circulating in the considered structure for Variant 0 (reconstructed current state) was about 131,000 m3/day (Table 3). On the inflow side, this value was primarily determined by the effective infiltration of precipitation (about 97,000 m3/day—74% of total inflow), while the remaining part was formed by the infiltration of waters from surface watercourses (about 34,000 m3/day). The rivers, mapped within the Quaternary layer, were rather draining in character, changing to infiltrating in the areas where mines had a drainage effect. On the outflow side, the dominant factors included the drainage of open-cast mine workings (about 70,000 m3/day—53.6% of the entire structure drainage), outflow to surface watercourses (about 55,000 m3/day), and, to a much lesser extent, exploitation of groundwater intakes (about 6000 m3/day)—both Quaternary (Layer 1 of the model) and Devonian (Layer 3).
The arrangement of the groundwater table in the Middle Devonian aquifer (Layer 3), obtained after model calibration, was determined by the operation of rock mine drainage systems. The exploitation and, simultaneously, drainage levels of the mines acted as drainage bases for groundwater inflow (Figure 5). The dewatering ordinates assumed in the model, corresponding to the actual state in mid-2017, were significantly lower compared to the original water table position before the dewatering started, which translates into the volume of inflows to the dewatered workings.
The water balance and hydroisohypse arrangement show that the magnitude of inflow to the Radkowice mine depended on the ordinates of exploitation and the extent of the dewatered mine workings, but infiltration of water from the nearby Bobrza River also had a significant impact. Exploitation and related dewatering operations carried out in mine workings of neighbouring mines situated in groundwater flow directions also produced a considerable effect on inflow to the Radkowice mine. The central and north-western parts of the syncline make a particular contribution to the inflow.

3.2. Assumptions of Prognostic Variants

Forecast simulations were conducted for two variants (numbered 1 and 2). The key objective of both variants was to predict the hydrodynamic field distribution and inflows to the mine workings assuming that the exploitation and dewatering of the Radkowice mine are abandoned and, at the same time, the Kowala Mała mine starts to be drained. A common assumption for all variants was that the remaining mines continue to operate within the horizontal extent of the workings and at dewatering ordinates consistent with the status quo (model calibration stage—mid-2017). The same assumption was also made for groundwater exploitation by intakes.
Both prognostic variants assume the discontinuation of the Radkowice pit dewatering, which means flooding the existing workings to a level corresponding to hydrodynamic equilibrium in the rock mass, taking into account the operation and drainage in other mines. The dewatering of the workings was also considered in view of the planned deepening of mining operations at the Kowala Mała mine to a level below the water table. The adopted dewatering contour, in the form of first-type boundary conditions, corresponded to the horizontal extent of the designed excavation. The ordinate of the lowered water table reflected the assumed ordinate of the lowest exploitation level (+200 m a.s.l.). The main difference between the variants was a different structure of the dewatering system of the Kowala Mała mine and the course of flooding the Radkowice mine. Variant 1 assumes a typical solution, which is to discharge drainage water from the Kowala Mała mine into ditches and surface watercourses, while their further fate was not subject to analysis. In this solution, the Radkowice pit would be self-sinking with waters coming from natural inflow from the aquifer. Variant 2 includes the pumping of waters coming from the dewatering of the Kowala Mała mine to the abandoned pit of the Radkowice mine. In the Radkowice open pit, additional water accumulation would occur, which would result in an increase in the hydraulic gradient in the rock mass and, consequently, in an intensification of inflows to the Kowala Mała mine.

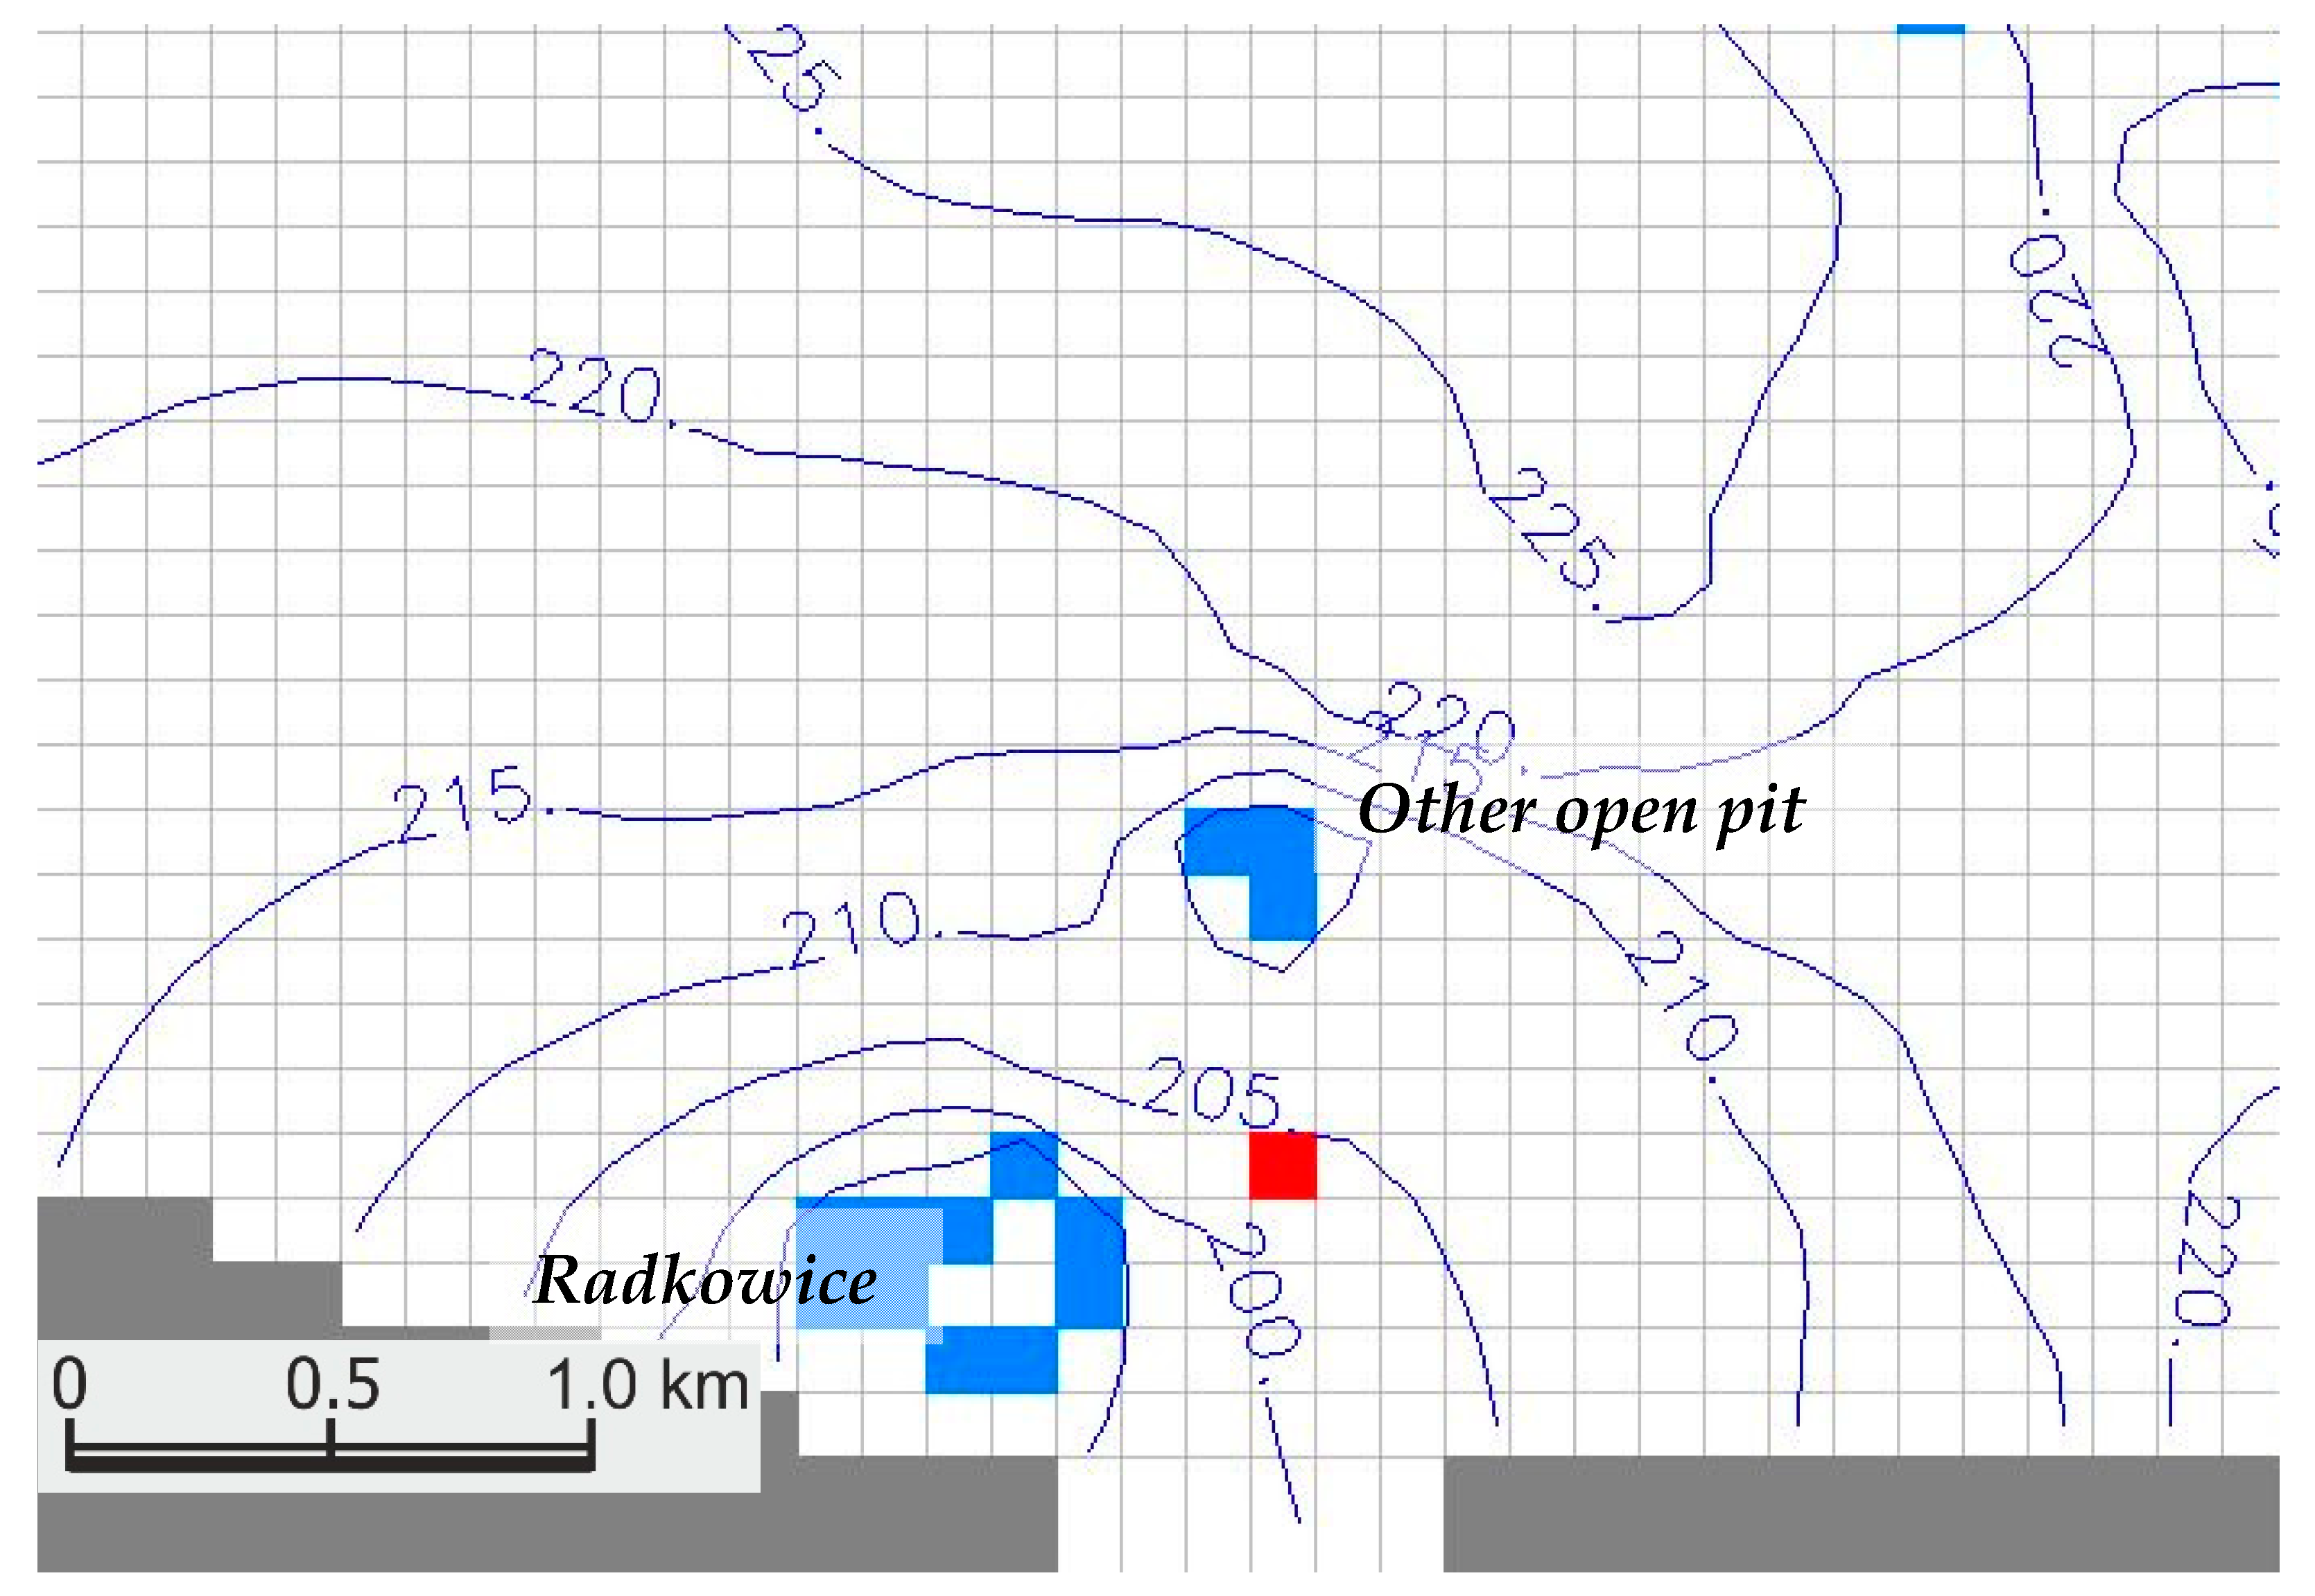
3.3. Results of Prognostic Variants
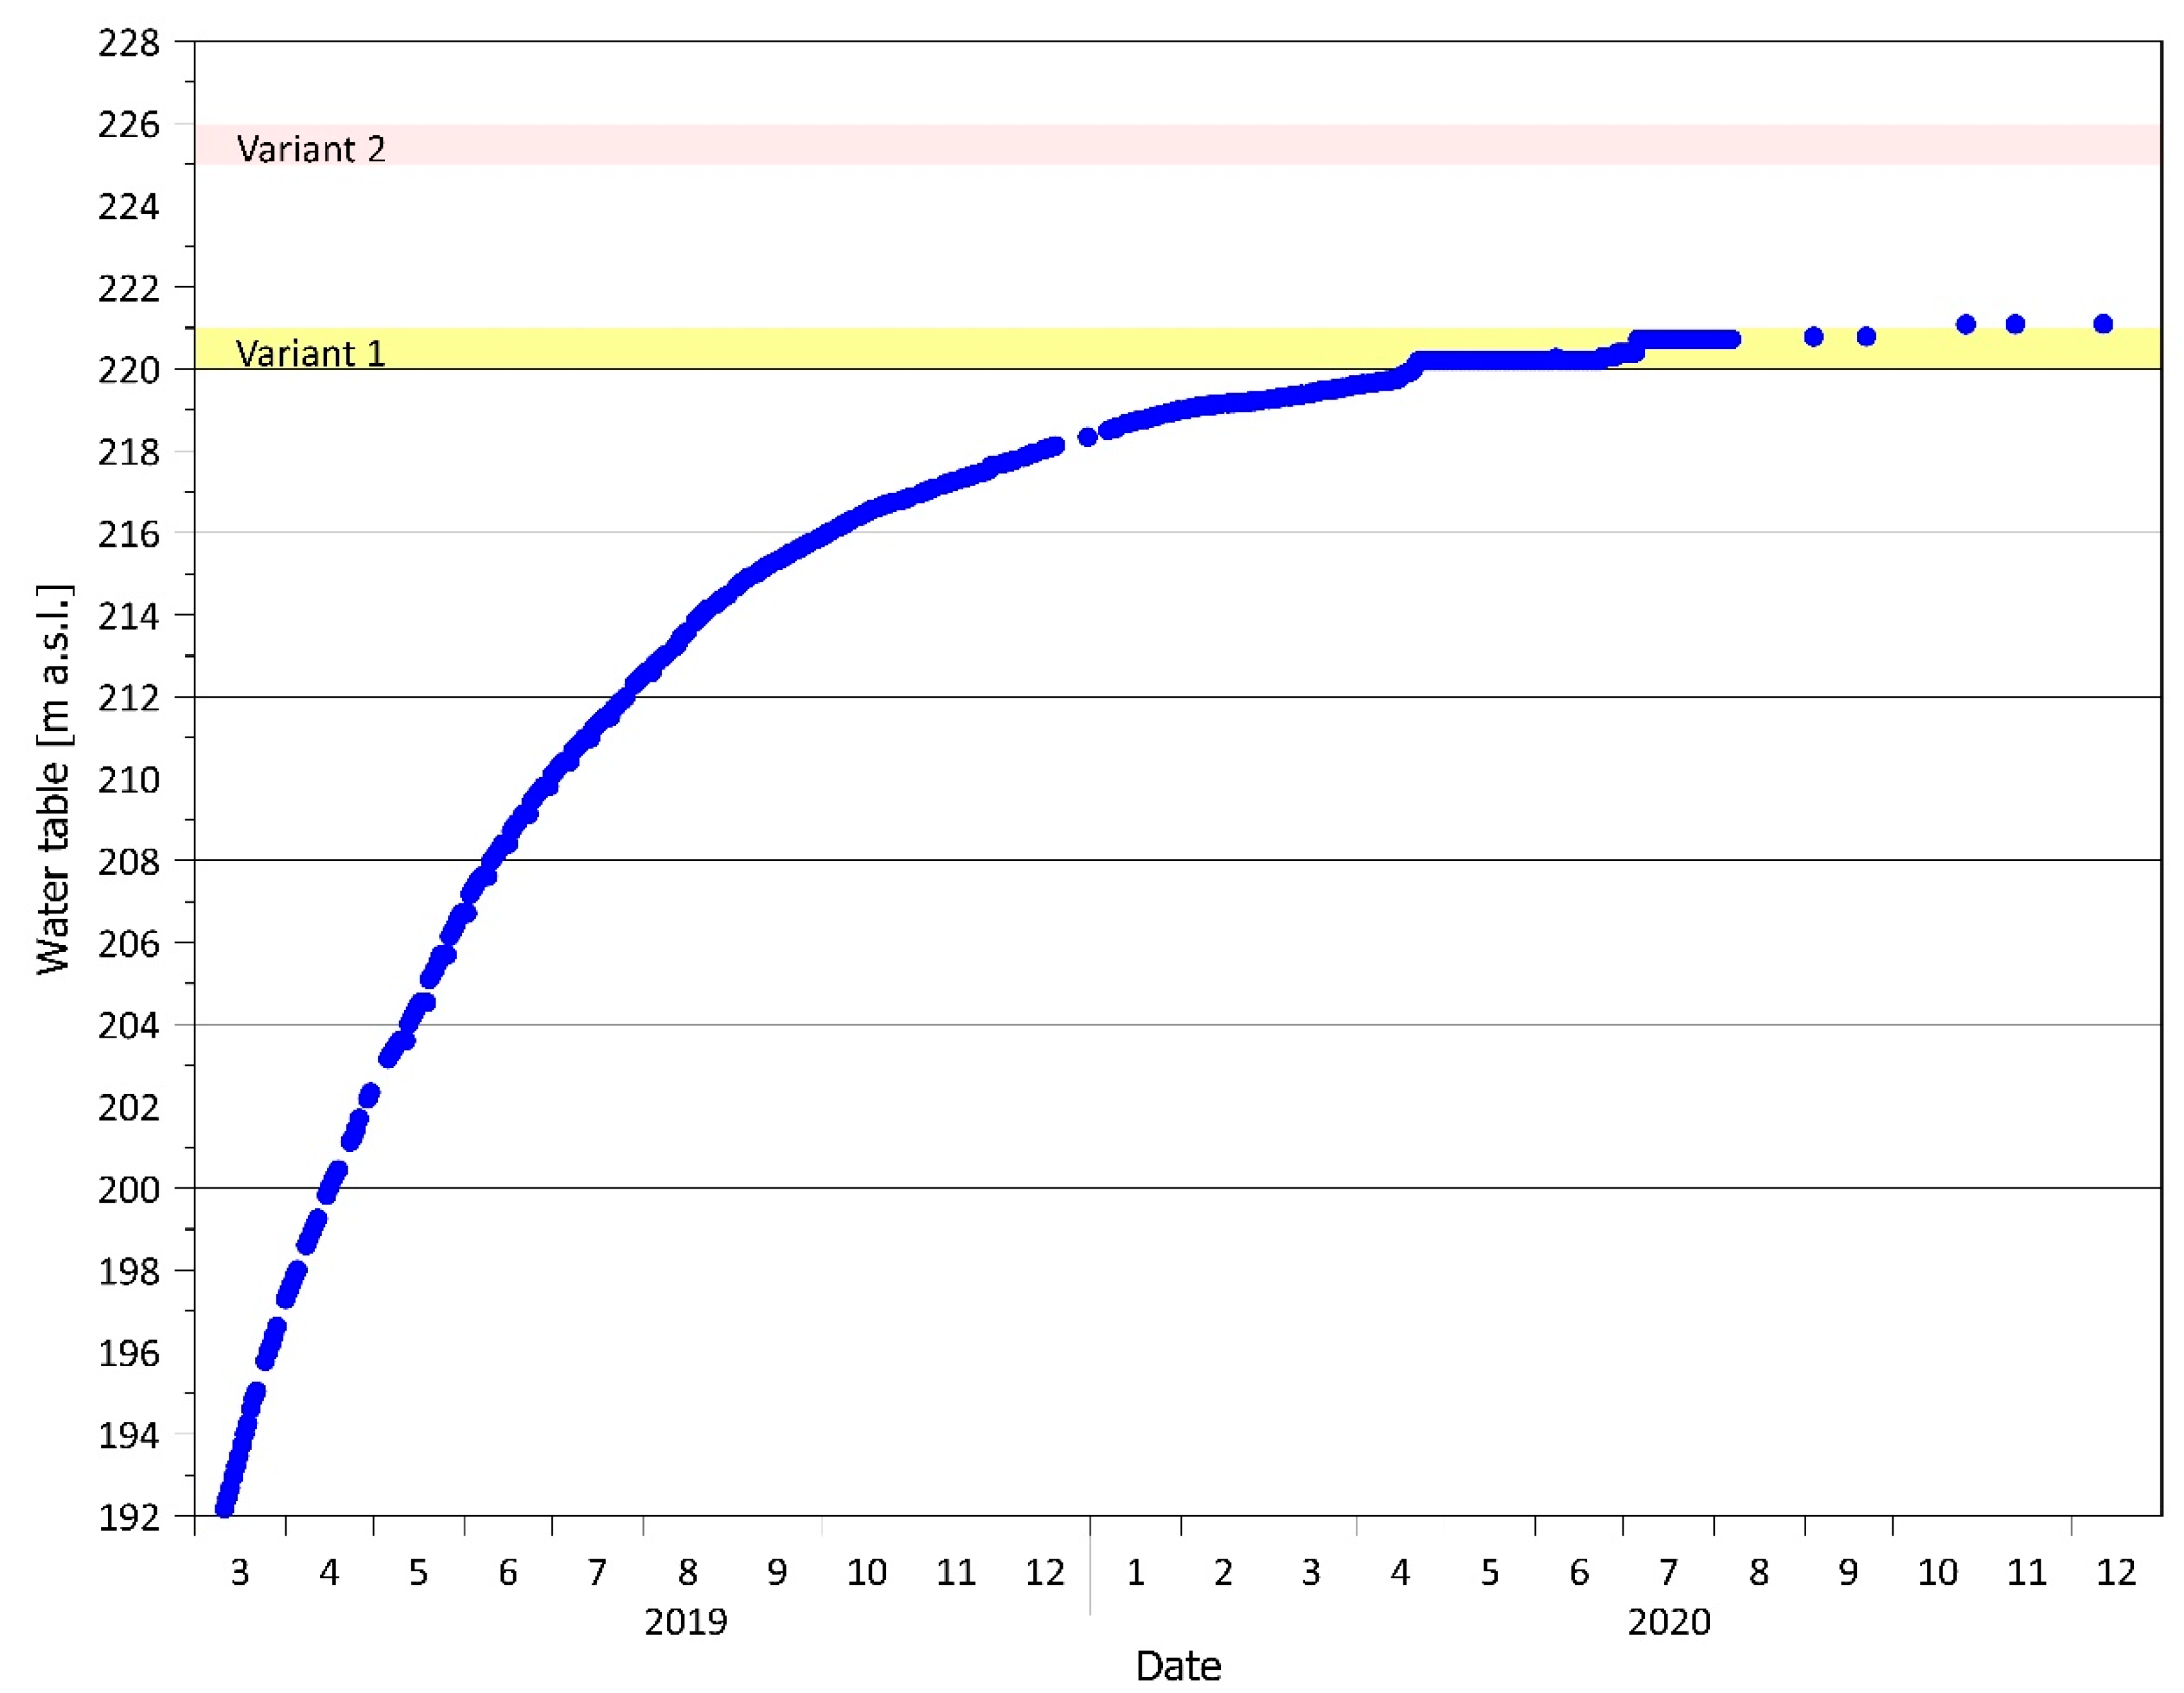
3.3.1. Variant 1

A major change in groundwater pressure distribution would occur in the vicinity of the abandoned Radkowice pit and in the neighbourhood of the deepened Kowala Mała mine (Figure 6). The discontinuation of the Radkowice pit dewatering would result in the damming of groundwater and flooding of the pit to the level of about +220 ÷ +221 m a.s.l. Quite a large difference in groundwater pressure would be created between the flooded Radkowice pit and the drained Kowala Mała pit at an ordinate of +200 m a.s.l. Due to a relatively short distance between the nearest edges of both pits (about 700 m), a significant hydraulic gradient could lead to the intensification of inflows to the Kowala Mała pit, making it a local drainage base. The abandonment of the Radkowice pit dewatering would result in a noticeable increase in the groundwater table in the Middle Devonian aquifer on the side of the previously dominant inflows (N and NW).
The balance of inflows to particular mines (Table 2) revealed that the abandonment of mining and dewatering operations at the Radkowice mine would result in the intensification of inflows to almost all other mines. The highest increase in inflows would be seen for the Kowala Mała mine (6909 m3/day). However, the total inflow to all mines would be considerably lower (about 51,000 m3/day), meaning that the value of the decrease compared to the calibrated state would amount to 19,000 m3/day (about 27%).
In the aggregated balance of water circulation in the Gałęzice–Bolechowice–Borków syncline obtained from the model for Variant 1 (Table 3), the total amount of water (about 116,000 m3/day) would see a considerable decrease in comparison with the calibrated state—by about 15,000 m3/day (11.6%). Recharge would originate mainly from unchanged effective infiltration of precipitation (about 97,000 m3/day) and, to a lesser extent, from river infiltration (about 19,000 m3/day). On the drainage side, apart from mine drainage systems (about 51,000 m3/day), rivers would play an important role (about 59,000 m3/day), with deep groundwater intakes playing a secondary role in the balance (about 6000 m3/day). A significant decrease in inflows to the mines in the regional groundwater circulation system means that less water has to be pumped (and discharged), bringing measurable economic and environmental benefits. In relation to the summary of the water circulation balance for the reproduced present conditions (Variant 0), a significant reduction of water quantity from river infiltration (nearly halved) was noticeable. This would be a direct effect of abandoning the exploitation and dewatering of the Radkowice pit situated in a close vicinity of the Bobrza River.

3.3.2. Variant 2

As in the case of Variant 1, a substantial change in groundwater head distribution would be seen in the vicinity of the abandoned (flooded) Radkowice pit and in the vicinity of the deepened Kowala Mała mine (Figure 7). The impact of the assumed changes in dewatering systems on the distribution of the hydrodynamic field would be additionally intensified as a result of the transfer of waters from the Kowala Mała mine dewatering to the flooded pit of the Radkowice mine. As a result, the water table in the Radkowice reservoir would stabilise several meters higher in relation to the prognosed value for Variant 1—at the level of about +225 ÷ +226 m a.s.l. The Kowala Mała excavation would still be drained at the ordinate of +200 m a.s.l., as a result of the difference in hydrostatic pressures between the Radkowice reservoir and the Kowala Mała excavation that could reach approximately 25 m. Due to a relatively short distance between the nearest edges of both pits (about 700 m), a significant hydraulic gradient (3.5%) could contribute to the intensification of inflows to the Kowala Mała pit in the long run.
The analysis of the detailed water balance of particular mines (Table 2) points to a further intensification of inflows to almost all remaining pits as a result of the discontinued exploitation and dewatering of the Radkowice mine. In the most distant mines, the increase in inflows would be small. The largest increase in inflows would occur at the Kowala Mała mine, up to about 8000 m3/day, i.e., 1000 m3/day more than for Variant 1. The simulation for Variant 2 assumes that the total amount of water flowing from the rock mass into the Kowala Mała workings is to be treated as a supply (inflow to the rock mass) in cells mapping the contour of the water reservoir in the abandoned Radkowice pit. This approach corresponds to the inflow of waters coming from the dewatering of the Kowala Mała mine into the water reservoir forming in the flooded Radkowice pit. The total inflow to the workings of all mines would be considerably smaller than at the model calibration stage, reaching about 53,000 m3/day. As a result of the water transfer to the Radkowice reservoir, the total inflow to all mine workings simulated for Variant 2 would be slightly higher than for Variant 1.
The total amount of circulating waters in the Gałęzice–Bolechowice–Borków syncline (Table 3) obtained from model tests under Variant 2 would reach about 124,000 m3/day. In relation to the calibrated state, this would mean a decrease in the amount of circulating waters by approximately 7600 m3/d, while in relation to Variant 1, the total amount of circulating waters would be higher by 7700 m3/day. The inflow side would be quantitatively dominated by effective infiltration of precipitation (approximately 97,000 m3/day), with the rest coming from river infiltration (nearly 19,000 m3/day). On this side of the balance, the amount of water discharged into the flooded Radkowice pit from the dewatering of the Kowala Mała mine should also be considered (almost 8000 m3/day). On the side of the rock mass drainage, the outflow of groundwater to rivers would dominate—about 65,000 m3/day, but a very significant contribution to the predicted drainage levels would be made by the dewatering of mine workings—amounting to almost 53,000 m3/day in total. As in the case of Variant 1, a significant decrease in the amount of waters originating from river infiltration is observed in the water circulation balance for Variant 2, which should be associated with the new arrangement of the hydrodynamic field in the vicinity of the flooded Radkowice pit.

4. Discussion

The obtained prognostic variants were based on assumptions—both target (Kowala Mała and Radkowice mines) or simulated at the model calibration stage—related to mine drainage (extents of workings and their ordinates, Radkowice mine—drainage discontinuation). The presented results of the predictions do not consider intermediate states, but only the final state resulting from the assumed stresses. In fact, until the new conditions are fully established, both inflows and groundwater levels could reach intermediate values between the reconstructed and forecasted ones for the target conditions. A precise determination of the times of reaching intermediate and target conditions would require model tests in transient flow simulation. Such predictive simulations are much more sophisticated and require knowledge of rock mass capacitance parameters (porosity and specific yield). The results of additional laboratory and tracer tests may form the basis for supplementing the model with information on rock mass capacitance parameters, making it possible to recalibrate the model. The model completed in this way is the only one that could be used for the prognostic evaluation of the course of the considered hydrodynamic processes, allowing for time schedules of mining works in individual mines to be taken into account.
The obtained results of the model tests support the arguments that led the investor to opt for the second variant, i.e., transferring water from the deepened pit at the Kowala Mała deposit to the flooded Radkowice pit. The self-sinking process began in March 2019. The relatively stable hydrodynamic field formed as a result of long-term mine exploitation was strongly disturbed as a result of the discontinuation of the Radkowice mine dewatering. Observations carried out since then point to a gradual recovery of the groundwater table in the neighbouring rock mass of the flooded pit (Figure 8). At the end of July 2019, the observed water table in the formed reservoir reached the ordinate of about 212 m above sea level, with the sinking process itself slightly slowing down (increase in the water table in the reservoir by about 0.07 m per day). In the last quarter of 2020, the water table in the flooded reservoir slightly exceeded +221 m a.s.l. The gradually conducted observations indicate that the state of hydrodynamic equilibrium in the rock mass is yet to be achieved and the process of the water table rise is still underway, with the rate of these processes being already very limited.
Currently (the first quarter of 2021), the water table elevation in the flooded Radkowice pit rose to the level corresponding to the height predicted for Variant 1. At present, the extraction of dolomite from the Kowala Mała deposit was conducted at level IV (+230 m a.s.l.). Works on an excavation to gain access to level V (+215 m a.s.l.) were commenced in mid-2020 and the opening pit was formed in the first quarter of 2021. This means that current dewatering operations were performed at a level higher than assumed in the predicted variants.
The implemented dewatering system used a gradually developed system of drainage ditches (both permanent and temporary) within the excavation level to feed, by gravity, the sump with water from the rock mass. Outside the excavation area, water is transported through two 400 mm diameter pumping pipelines, one of which has a backup function. The water is then transported to the neighbouring Radkowice pit, which is in the process of flooding, via a 700 m long transfer pipeline. Works on the transmission system and the sump at a level of +215 m a.s.l were completed recently. The target sump will be created for the exploitation of the next level—+200 m a.s.l. Only then, after the conditions have stabilised, the actual state will correspond to that modelled for Variant 2 and the comparison of the actual ordinates in the flooded excavation to the predicted ones will be justified.
The completion of installation works in recent months did not make it possible to collect reliable data on actual inflows. However, no significant volumes are expected in the current phase. The exploitation level of +230 m a.s.l. is above the present water table ordinate, originally formed at 226.7 ÷ 228.6 m a.s.l. The opening pit of small dimensions, made to the level of +215 m a.s.l., will cause only slight inflows whose recirculation through redirecting to the reservoir in the recultivated Radkowice excavation will not significantly affect the rate of flooding and the ordinate of the water surface.
The actual inflow to the Kowala Mała pit may slightly differ from the numerical prognoses. It will be determined by pressure differences between the flooded Radkowice pit and the dewatered Kowala Mała mine and by filtration parameters of the rock mass (mainly in the zone between the two pits). In reality, a significant hydraulic gradient between the workings (3.5%; approximately 25 m difference in the water table position at a distance of about 700 m) would lead to the saturation of the vadose zone that reactivated preferential flow paths. The prognostic simulations were carried out on the basis of the calibrated variant, without making any modifications to rock mass filtration parameters. It is not possible to precisely and clearly determine to what extent the intensification of the flow between the workings will affect the reactivation of formerly inactive flow paths. Working simulations, which hypothetically assume the intensification of water flow through additional migration routes to a different extent, estimate that the actual inflows may increase by 20–25% in comparison with the quantities obtained in the prognoses (Variants 1 and 2). This applies mainly to the Kowala Mała open pit, where care should be taken to ensure an adequate drainage system reserve. The possibility of an increase in inflows to the mine workings also results from the possible occurrence of karst phenomena in the rock mass, which cannot be excluded in the case of geological data from the studied area.
The results of the predictive calculations were obtained using a model calibrated to assume that inflows to the drainage systems averaged over the actual 2016 inflow. However, the effective recharge from precipitation infiltration was determined based on multiyear average precipitation. In reality, inflows to the pits considered over short time intervals may differ from the projected average inflows. This is due to the relatively fast response of the aquifer system to not exactly predictable changes in precipitation. The predicted inflows to the mine workings should be considered the average inflows for a longer time interval, corresponding to the average meteorological conditions, generally for medium states. In periods of increased precipitation, the actual inflows to the mine workings may temporarily exceed the predictions as a result of both direct surface runoff and increased infiltration into aquifers. Due to the uneven spatial and temporal intensity of precipitation and the probability of short-term heavy rainfall, which is possible in the long run, the necessity to ensure appropriate reserve capacity for draining or retaining excessive water inflow should be taken into account when designing the drainage system of the mine workings.
The fact that actual inflows to individual mines will, to a large extent, depend on the exploitation and drainage conditions of the neighbouring mines should also be considered. With this in mind, the presented results obtained with the use of model research should be treated as representative for a longer time horizon assuming that the mining and operation conditions of the neighbouring open-pit mines do not change.
The presented results of the prognoses apply to the state of full hydrodynamic equilibrium in the entire aquifer after complete water table stabilisation. In reality, the state of this type will most probably not be fully achieved within a certain period of time as a result of further changes in the exploitation and drainage of individual mines and changes in the volumes of exploited groundwater for municipal purposes. It can be assumed that the actual water table will reach a quasi-steady state close to the steady state obtained in the prediction only after some time from the occurrence of the stresses provided that there are no considerable changes in the range of exploitation and dewatering in other mines.

5. Conclusions

The variant analysis of changes in hydrogeological conditions in the vicinity of the Kowala Mała deposit in the perspective of deepening the exploitation and flooding of the neighbouring depleted Radkowice-Podwole deposit contributed to the selection of the drainage concept. Among the considered factors, the impact of the forecast mining drainage on the surrounding groundwater environment was of particular importance.
As an extensive and productive aquifer, the Gałęzice–Bolechowice–Borków syncline has, for several decades, been subject to intensive drainage, primarily due to the development of the exploitation of rock materials and, to a lesser extent, the intake of water for municipal purposes. MGR No. 418, covering most of the syncline, is yet to be provided with hydrogeological documentation establishing available resources. The calculations from a decade ago [27] estimate the available resources to be 63,816 m3/day. In the light of further research [34], this value seems to be underestimated. The total consumption resulting from both mine drainage systems and groundwater intakes (e.g., from 2016—Table 3) seem to indicate that the available resources of the aquifer were being overexploited. In light of this knowledge, the environmental decision-making process of relevant offices and institutions pays particular attention to further plans for the operation of mines in the context of their impact on the aquatic environment.
The consequences of water discharge from dewatering carbonate resource deposits are not particularly threatening to the environment. Discharged waters originate from natural inflow with neutral physicochemical parameters (having no negative impact on the quality of receiving waters). The practicality of the proposed changes comes down to the possibility of using existing drainage infrastructure (Variant 2 vs. Variant 1) in order to reduce investment costs. Fundamental environmental problems result from drainage. The combined depression cones formed around the neighbouring mines created a zone of the groundwater table that was lowered more than the local range. Diverting pumped waters to the neighbouring flooded pit, within the same aquifer, limited the spread of the depression cone by increasing the disposable resources of the aquifer and decreasing river infiltration. On a regional scale, the amount of circulating water decreased significantly, resulting in an overall improvement to the aquatic environment of the overexploited reservoir. The mining entity, to a less measurable extent, became better perceived by state institutions dealing with environmental protection issues, which, in the future, should translate into a better negotiating position when obtaining subsequent environmental decisions.
Through the termination of the Radkowice-Podwole deposit exploitation and the decision to flood the existing excavation, both prognostic variants pointed to a significant improvement in water balance on a local scale, which was a significant benefit for the natural environment. With a considerable reduction in the total mining water consumption from about 70,000 m3/day to just over 50,000 m3/day, the total amount of water involved in the circulation in the aquifer was reduced, and the amount of river infiltration almost halved. Due to the more favourable environmental effect, the second variant was selected for implementation, which assumes the transfer of water from the deepened excavation in the Kowala Mała deposit to a water reservoir formed as a result of self-sinking in the Radkowice excavation. The cessation of discharging waters from drainage to the Bobrza River by directing them to the adjacent water reservoir will result in an increase in the water table level in the reservoir and in the surrounding rock mass in line with the predictions. The resulting depression cone will be limited in the west and north-west directions, as a result of which the Bobrza River will regain its drainage function to a considerable extent. At the same time, with the increased hydraulic gradient, the inflows to the Kowala Mała mine will rise due to the increased seepage of recirculated waters through the pillar between the workings. The projected growth in inflows of about 1000 m3/day will further burden the mine drainage system and directly contribute to higher operating costs. Still, the assumed environmental benefits related to the reduction of the negative drainage effects and the simplification of the drainage system combined with a simultaneous reduction in investment outlays (shorter transmission pipelines as water is discharged into the reservoir rather than the river) were prioritised and ultimately prevailed in the analysis of benefits and losses of the proposed solutions.

Author Contributions

Conceptualisation, K.R. and R.Z.; methodology, K.R. and R.Z.; software, R.Z.; validation, K.R. and R.Z.; formal analysis, K.R. and R.Z.; investigation, K.R. and R.Z.; resources, W.C.; data curation, K.R., R.Z. and W.C.; writing—original draft preparation, K.R. and R.Z.; writing—review and editing, K.R. and R.Z.; visualisation, K.R. and R.Z.; supervision, K.R. and R.Z. All authors have read and agreed to the published version of the manuscript.

Funding

The APC was funded by the AGH University of Science and Technology in Poland (scientific subsidy number: 16.16.100.215, 16.16.140.315) and by the “Excellence Initiative–Research University” programme for the AGH University of Science and Technology.

Institutional Review Board Statement

Not applicable.

Informed Consent Statement

Not applicable.

Conflicts of Interest

The authors declare no conflict of interest.

References

  1. El Idrysy, H.; Connelly, R. Water-the Other Resource a Mine Needs to Estimate. Procedia Eng. 2012, 46, 206–212. [Google Scholar] [CrossRef] [Green Version]
  2. Hawkins, J.W.; Dunn, M. Hydrologic Characteristics of a 35-Year-Old Underground Mine Pool. Mine Water Environ. 2007, 26, 150–159. [Google Scholar] [CrossRef]
  3. Unsal, B.; Yazicigil, H. Assessment of Open Pit Dewatering Requirements and Pit Lake Formation for the Kışladağ Gold Mine, Uşak, Turkey. Mine Water Environ. 2016, 35, 180–198. [Google Scholar] [CrossRef]
  4. Motyka, J.; d’Obyrn, K.; Kasprzak, A.; Szymkiewicza, A. Sources of groundwater inflows into the “Czatkowice” limestone quarry in southern Poland. Arch. Min. Sci. 2018, 63, 417–424. [Google Scholar]
  5. Chunhu, Z.; Dewu, J.; Qiangmin, W.; Hao, W.; Zhixue, L.; Xiaolong, S.; Mingpei, L.; Shaofeng, W. Water inflow characteristics of coal seam mining aquifer in Yushen mining area, China. Arab. J. Geosci. 2021, 14, 1–12. [Google Scholar] [CrossRef]
  6. Spitz, K.; Moreno, J. A Practical Guide to Groundwater and Solute Transport Modelling; John Wiley & Sons Inc.: New York, NY, USA, 1996; p. 480. [Google Scholar]
  7. Kresic, N. Hydrogeology and Groundwater Modeling, 2nd ed.; CRC Press: Boca Raton, FL, USA, 2006. [Google Scholar] [CrossRef]
  8. Anderson, M.P.; Woessner, W.W.; Hunt, R.J. Applied Groundwater Modeling: Simulation of Flow and Advective Transport, 2nd ed.; Elsevier: Amsterdam, The Netherlands, 2015. [Google Scholar]
  9. Zdechlik, R. A Review of Applications for Numerical Groundwater Flow Modeling. In Proceedings of the 16th International Multidisciplinary Scientific GeoConference SGEM, Vienna, Austria, 2–5 November 2016; Book 3; Volume 3, pp. 11–18, ISBN 978-619-7105-81-0. [Google Scholar] [CrossRef]
  10. Bukowski, P.; Haładus, A.; Zdechlik, R. The Process of Mine Workings Flooding on the Example of Selected Hard Coal Mines in the Upper Silesian Coal Basin; [In Polish: Zatapianie wyrobisk górniczych na przykładzie wybranych kopalń węgla kamiennego w Górnośląskim Zagłębiu Węglowym]; Sadurski, A., Krawiec, A., Eds.; Współczesne Problemy Hydrogeologii, t.XII, Wydawnictwo Uniwersytetu Mikołaja Kopernika: Toruń, Poland, 2005; pp. 85–90. [Google Scholar]
  11. Rapantova, N.; Grmela, A.; Vojtek, D.; Halir, J.; Michalek, B. Ground Water Flow Modelling Applications in Mining Hydrogeology. Mine Water Environ. 2007, 26, 264–270. [Google Scholar] [CrossRef]
  12. Haładus, A.; Zdechlik, R.; Bukowski, P. Numerical Modeling of Flooding Process in the Part of the Janina Hard Coal Mine; [In Polish: Modelowanie przebiegu zatapiania Ruchu II ZG Janina]; Szczepański, A., Kmiecik, E., Żurek, A., Eds.; XIII Sympozjum Współczesne Problemy Hydrogeologii. Krakow-Krynica: Krakow, Poland, 21–23 June 2007; pp. 789–795. [Google Scholar]
  13. Hu, L.; Zhang, M.; Yang, Z.; Fan, Y.; Li, J.; Wang, H.; Lubale, C. Estimating dewatering in an underground mine by using a 3D finite element model. PLoS ONE 2020, 15, e0239682. [Google Scholar] [CrossRef] [PubMed]
  14. Surinaidu, L.; Rao, V.G.; Rao, N.S.; Srinu, S. Hydrogeological and groundwater modeling studies to estimate the groundwater inflows into the coal Mines at different mine development stages using MODFLOW, Andhra Pradesh, India. Water Resour. Ind. 2014, 7–8, 49–65. [Google Scholar] [CrossRef] [Green Version]
  15. Szczepiński, J. The Significance of Groundwater Flow Modeling Study for Simulation of Opencast Mine Dewatering, Flooding, and the Environmental Impact. Water 2019, 11, 848. [Google Scholar] [CrossRef] [Green Version]
  16. Brown, K.; Trott, S. Groundwater Flow Models in Open Pit Mining: Can We Do Better? Mine Water Environ. 2014, 33, 187–190. [Google Scholar] [CrossRef]
  17. Niedbalska, K.; Haładus, A.; Bukowski, P.; Augustyniak, I.; Kubica, J. Modelling of Changes of Hydrodynamic Conditions in the Aquatic Environment of the Maczki-Bor Sand Pit due to the Fact of Planned Closure of Mining Operations (NE part of Upper Silesian Coal Basin -Poland). In Proceedings of the International Mine Water Association Congress, Aachen, Germany, 4–11 September 2011; pp. 231–234. [Google Scholar]
  18. Niedbalska, K.; Bukowski, P.; Haładus, A. Using of Groundwater Flow Modeling to Optimize the Methods of Liquidation of Open Pit Mine Reclaimed by Post-Mining Wastes. In Proceedings of the 14th International Multidisciplinary Scientific Geoconference SGEM, Geoconference on Science and Technologies in Geology, Exploration and Mining, Albena, Bulgaria, 17–26 June 2014; Volume II, pp. 1035–1042. [Google Scholar]
  19. Zhao, L.; Ren, T.; Wang, N. Groundwater impact of open cut coal mine and an assessment methodology: A case study in NSW. Int. J. Min. Sci. Technol. 2017, 27, 861–866. [Google Scholar] [CrossRef]
  20. Aryafar, A.; Ardejani, F.D.; Singh, R.; Shokri, B.J. Prediction of Groundwater Inflow and Height of the Seepage Face in a Deep Open Pit Mine Using Numerical Finite Element Model and Analytical Solutions. In IMWA Symposium 2007; Cidu, R., Frau, F., Eds.; Water in Mining Environments, International Mine Water Association: Cagliari, Italy, 2007. [Google Scholar]
  21. Sayit, A.P.; Cankara-Kadioglu, C.; Yazicigil, H. Assessment of Dewatering Requirements and their Anticipated Effects on Groundwater Resources: A Case Study from the Caldag Nickel Mine, Western Turkey. Mine Water Environ. 2015, 34, 122–135. [Google Scholar] [CrossRef]
  22. Bukowski, P.; Augustyniak, I.; Niedbalska, K. Some Methods of Hydrogeological Properties Evaluation and Their Use in Mine Flooding Forecasts. In Proceedings of the 15th International Multidisciplinary Scientific Geoconference SGEM, Science and technologies in geology, exploration and mining, Albena, Bulgaria, 18–24 June 2015; Volume II, pp. 717–724. [Google Scholar]
  23. Wu, Q.; Hu, B.X.; Wan, L.; Zheng, C. Coal mine water management: Optimization models and field application in North China. Hydrol. Sci. J. 2010, 55, 609–623. [Google Scholar] [CrossRef] [Green Version]
  24. Treichel, W.; Haładus, A.; Zdechlik, R. Simulation and optimization of groundwater exploitation for the water supply of Tarnów agglomeration (southern Poland). Bull. Geogr. Phys. Geogr. Ser. 2015, 9, 21–29. [Google Scholar] [CrossRef] [Green Version]
  25. MODFLOW and Related Programs. Available online: https://water.usgs.gov/ogw/modflow (accessed on 16 April 2021).
  26. Diersch, H.-J. FEFLOW Finite Element Modeling of Flow, Mass and Heat Transport in Porous and Fractured Media; Springer: Berlin/Heidelberg, Germany, 2014; p. 996. [Google Scholar] [CrossRef]
  27. Prażak, J. Position of Hydrodynamic and Economic Significance of Devonian Groundwater Reservoirs in the Holy Cross Mountains; [In Polish: Pozycja hydrodynamiczna i znaczenie gospodarcze dewońskich zbiorników wód podziemnych w Górach Świętokrzyskich]; Prace PIG, Polish Geological Institute—National Research Institute: Krakow, Poland, 2012; Volume 198, p. 72. [Google Scholar]
  28. Available online: https://www.pgi.gov.pl/en/phs/tasks/8878-gzwp-major-groundwater-reservoirs.html (accessed on 3 June 2021).
  29. Chiang, W.-H. 3D-Groundwater Modeling with PMWIN; Springer: Berlin/Heidelberg, Germany, 2005. [Google Scholar] [CrossRef]
  30. Kulma, R.; Zdechlik, R. Groundwater Flow Modeling; [In Polish: Modelowanie Procesów Filtracji]; The AGH University of Science and Technology Press: Krakow, Poland, 2009. [Google Scholar]
  31. Herman, G. Hydrogeological Map of Poland, Scale 1:25 000, No. 851 Morawica; Polish Geological Institute: Warsaw, Poland, 1997. [Google Scholar]
  32. Herman, G. Hydrogeological Map of Poland, Scale 1:25 000, No. 852 Daleszyce; Polish Geological Institute: Warsaw, Poland, 1997. [Google Scholar]
  33. Prażak, J. Hydrogeological Map of Poland, Scale 1:25 000, No. 814 Piekoszów; Polish Geological Institute: Warsaw, Poland, 1997. [Google Scholar]
  34. Różkowski, K.; Zdechlik, R.; Polak, K.; Pawlecka, K.; Bielec, B. Hydrogeological Documentation Specifying the Hydrogeological Conditions in Connection with the Drainage of the Kowala Mała Deposit to +200 m a.s.l; [In Polish: Dokumentacja hydrogeologiczna określająca warunki hydrogeologiczne w związku z odwodnieniem złoża „Kowala Mała” do rzędnej +200 m n.p.m.]; Fundacja Nauka i Tradycje Górnicze, z siedzibą Wydział Górnictwa i Geoinżynierii AGH w Krakowie: Krakow, Poland, 2016; not published. [Google Scholar]
  35. Kielce Climate. Available online: https://pl.climate-data.org/location/764743/ (accessed on 1 April 2021).
Figure 1. Modelled area of the Gałęzice–Bolechowice–Borków syncline with schematic geological boundaries, location of open pit mines, and exploitation wells marked with red dots (geology and cross-section according to [27]).
Energies 14 04576 g001
Figure 2. Scheme of vertical discretisation into model layers (example cross-section along row 38, vertical exaggeration—20).
Energies 14 04576 g002
Figure 3. Mapping of rivers within Layer 1 (light blue blocks—rivers with limited hydraulic contact with groundwater, third-type boundary condition).
Energies 14 04576 g003
Figure 4. Comparison of the water table ordinates (m a.s.l.) obtained from the model (calculated values) and observed in reality (observed values) for the adopted calibration points (blue—middle Devonian and red—Quaternary).
Energies 14 04576 g004
Figure 5. Hydrodynamic field distribution of the middle Devonian aquifer in the central part of Layer 3. Variant 0—calibrated state (mid-2017). Blue cells—contours of open-pits, red cell—exploitation well.
Energies 14 04576 g005
Figure 6. Hydrodynamic field distribution of the middle Devonian aquifer (Layer 3 in the model)—Variant 1. Blue cells—contours of open-pits, red cell—exploitation well.
Energies 14 04576 g006
Figure 7. Hydrodynamic field distribution of the middle Devonian aquifer (Layer 3 in the model)—Variant 2. Blue cells—contours of open-pits, red—exploitation well, purple cells—flooded pit of the Radkowice mine.
Energies 14 04576 g007
Figure 8. Water table elevation in the flooded Radkowice pit.
Energies 14 04576 g008
Table 1. Variation of hydraulic conductivity in different model layers—after model calibration.
LayerHydraulic Conductivity (m/Day)
MinimumAverageMedianMaximum
12.59 × 10−24.212.6886.06
28.54 × 10−41.25 × 10−12.59 × 10−22.59
31.10 × 10−34.241.5543.20
48.64 × 10−32.75 × 10−18.64 × 10−243.20
Table 2. Magnitudes of inflows to mine workings: actual, obtained after the model calibration, and prognosed in individual variants.
Open-Pit MineInflow to Open Pit Mine (m3/Day)
ActualCalibratedPrognosed
QRVariant 0 (QM)
QM-QR
Variant 1 (Q1)
Q1-QM
Variant 2 (Q2)
Q2-QM
Radkowice26,909.826,960.8
+51.0
0.0
−26,960.8
0.0
−26,960.8
Kowala Mała--6908.6
+6908.6
7934.6
+7934.6
Other open-pit mines43,482.243,438.8
−43.4
44,345.0
+906.2
44,614.4
+1175.5
Total70,392.070,399.6
+7.5
51,253.6
−19,146.0
52,549.2
−17,850.4
Table 3. Summary of the water circulation balance in the Gałęzice–Bolechowice–Borków syncline, obtained on the basis of the model research.
ComponentInflow/Outflow (m3/d)
CalibratedPrognosed
Variant 0Variant 1Variant 2
InOutInOutInOut
Effective infiltration of atmospheric precipitation97,311097,258097,2580
River infiltration/drainage34,11654,99818,84158,81718,58865,203
Exploitation of groundwater intakes060370603706037
Drainage of open-pit mines070,400051,2547935 152,549
Total131,427131,435116,099116,108123,781123,789
1 The amount of water from the drainage of the Kowala Mała mine, recirculated to the Radkowice mine.
Publisher’s Note: MDPI stays neutral with regard to jurisdictional claims in published maps and institutional affiliations.

