1. Introduction
Around three billion people worldwide cook using traditional cookstoves (TCS) such as open fires or simple stoves fueled by kerosene, biomass (charcoal, wood, animal dung, and crop waste), and coal [
1]. Close to four million people die prematurely from illnesses that are attributable to household air pollution from stoves that use solid fuels and kerosene [
1]. Lack of access to clean cooking methods is an acute and growing problem in the sub-Saharan Africa region, with the International Energy Agency (IEA) estimating that only 17% of the population had clean cooking access in 2017 [
2].
Electric cooking has the potential to reduce household air pollution, reduce the labor of cooking activities (predominantly managed by women), and can even reduce cooking costs under certain conditions [
3,
4]. Despite the potential for health and social impacts, electric cooking remains at a nascent stage of adoption. According to the Tanzanian Household Budget survey [
5], only 2.1% of households use electricity as a main energy source for cooking, with 61% of the Tanzanian population using firewood, and 29% using charcoal as their main energy source for cooking.
A lack of access to electricity is one potential barrier to the increased adoption of electric cooking. Electricity access remains low in the sub-Saharan Africa region, with almost 600 million people (54%) lacking electricity access in 2018, according to data from the IEA and the World Bank [
2,
6]. In Tanzania, only 29% of households were connected to grid electricity in 2018 [
5]. One emerging method of household electrification is through small-scale renewable energy generation in off-grid areas. One example of this is mini-grids, which are defined as a form of integrated energy infrastructure with distributed energy generation resources and loads [
7] and which currently provide electricity for 14.9 million people in Africa [
8]. Similar to clean cooking, mini-grids are also at a nascent stage of adoption, electrifying a small percentage of the 111 million households that could be connected to min-grids by 2030 [
9]. In Tanzania, there were 209 operational mini-grids in 2020 [
9].
Achieving access to both clean cooking and electricity are targets of Sustainable Development Goal (SDG) 7. In recent years, various research publications [
4,
10,
11] have explored the opportunity for both aspects of SDG 7 to be achieved simultaneously through the proliferation of electric cooking solutions using renewable energy sources such as mini-grids.
While existing research has shown that electric cooking with renewables may be feasible, critical questions surrounding SDG 7 remain either unanswered or have little experimental data. This research contributes to the investigation of a pathway to SDG 7 that couples the topics of access to electricity and access to clean cooking with ground-based evidence. This paper addresses questions related to the scaling of electric cooking in off-grid areas to inform strategies for achieving SDG 7.
Specifically, this paper contributes to this investigation by describing a pilot study which introduced electric pressure cookers (EPCs) to 100 households across six remote mini-grids in northern Tanzania. The main research question motivating this study is:
Are EPCs socially acceptable, useful, technically feasible, and financially viable as a clean cooking solution for mini-grid customers?
The sub-questions which this paper seeks to answer are:
How are EPCs adopted by mini-grid customers after being introduced into households?
How does the introduction of EPCs change the composition of meals cooked?
How does the introduction of EPCs change the usage of TCSs and traditional fuels?
How does the introduction of EPCs benefit households in terms of time and fuel savings?
This study is novel in terms of the combination of the context (mini-grid connected households), the cooking appliance investigated (the EPC), the depth of the data gathered (remote monitoring of household and stove usage profiles; a deep dive into the menu and associated cooking practices), and the study duration (a 1-year study, of which 10 months have been examined in this initial analysis). It offers the opportunity to synthesize quantitative and qualitative data to gain insights into the impacts of electric cooking adoption on mini-grid energy systems.
2. Literature Review
Studies of electric cooking on mini-grids are few and have previously focused on smaller numbers of customers with less intensive data-gathering. A2EI did an initial scoping study to investigate the desirability of EPCs for off-grid customers by examining the time, ease of use, cost of biomass cooking, and the dishes cooked on the EPCs by customers. The study was conducted over seven to ten days of monitoring nine households in peri-urban Arusha [
12]. The households were provided with solar systems and EPCs, kept food journals during the study, and were surveyed on their experiences at the start and end of the study. The authors found large reductions in cooking time and a high ease of use associated with cooking on EPCs rather than biomass but also observed that despite there being no cost associated to the electricity supply, users preferred to cook certain dishes using the EPC. This suggested that off-grid users would continue to fuel stack even with no affordability barriers associated with using EPCs. However, the small sample size and short-term nature of the study meant that broad conclusions were not possible, and it is likely that over longer durations and with more training, participants could have shifted more of their cooking to the EPC. The present study extends this scoping study in terms of sample size, study duration, and by employing more detailed and varied data collection methods to allow a more robust analysis and more meaningful conclusions to be drawn.
Another partner in the present study—the mini-grid company PowerGen Renewable Energy—have also previously investigated the potential for EPCs for mini-grid customers [
11]. Working across two mini-grids in Tanzania (selected due to their lower tariff than most rural mini-grids at
$0.30 USD/kWh), PowerGen conducted awareness-raising and training workshops, resulting in 25 early adopters purchasing EPCs (some of whom made use of a loan initiative facilitated by PowerGen to overcome affordability barriers). Over the study duration, customers were surveyed by SMS, and phone interviews and household load profile data were monitored. Analysis of the load profile data showed that household electricity consumption increased by 20% due to EPC use. This study did not conduct a detailed survey of stove and fuel stacking or insights into the menu and cooking practices of these mini-grid customers, but it did show that EPC purchase was attractive and viable for mini-grid customers (with the microfinancing option available). The study concluded with a call for a wider variety of mini-grid customers to be surveyed and the implementation of longer timescales to assess how EPC adoption changes over time. Both calls to action are addressed by the present study.
Both the aforementioned A2EI and PowerGen studies examined off-grid systems with solar PV generation (the former considered household level solar PV, and the latter considered solar PV mini-grids). A total of three studies in Nepal have examined electric cooking practices among micro-hydro power (MHP) mini-grids customers as well as monitored the effect of the cooking load on the performance of the off-grid energy systems. The scope of the appliances in question diverges from previous studies, and the present trial also differs in that the customers were trialing induction hobs rather than EPCs. In Clements et al. [
13], 10 households used induction stoves on a 30 kW MHP mini-grid in western Nepal. The authors used a version of the cooking diary methodology employed in this research to gather detailed data about stove use, fuel use, and cooking practices during a two-week baseline phase and a two-week electric cooking phase. Time series electricity demand and supply data were also monitored and showed that for this already constrained MHP mini-grid, the widespread adoption of electric cooking would not have been feasible; just three households continued to cook with the induction stoves after the study due to the instability of the mini-grid.
Working on the same MHP mini-grid, Silwal et al. [
14] did a further study using a more diverse set of appliances to analyze the effect of the appliances on the mini-grid performance in more detail. A total of eight households were given one of four electric cooking appliances (one of which was an EPC), and a cooking diary was again used to monitor cooking practices. Unfortunately, the constrained mini-grid limited the customers’ use of the appliances, as customers experienced frequent power failures when cooking.
The third study in Nepal focused on a larger, less constrained MHP mini-grid in eastern Nepal, which had a capacity of 100 kW [
15]. Fifteen households participated and were given induction hobs and rice cookers, and a more detailed version of the cooking diaries method was again used to gather cooking practices data over baseline and electric cooking phases. This trial found that the menu became narrower in the electric cooking phase, but that participants managed to cook 83% dishes using the electric appliances. After two months, an exit survey showed that some households had gone back to using wood stoves due to space heating requirements. This study also gathered time series demand and supply data to assess mini-grid performance and found that the MHP mini-grid’s given supply was less than its expected rated power due to the dry season. Consequently, the mini-grid struggled to support the 15 customers using the electric cooking devices despite being of adequate rated capacity. This data enabled the authors to model how increased centralized or distributed battery storage could impact the electric cooking capacity of the grid, suggesting the technical infrastructure and power control modifications that would be required to make electric cooking more feasible.
Other studies conducted in urban on-grid environments reached similar levels of detail in monitoring cooking practices, menu changes, and fuel/stove choice for the same magnitude of participants but have never been conducted over a long duration with many participants to uncover more “steady-state” cooking habits. Early cooking diary studies that laid the foundations for MECS were undertaken for 19–22 households in capital cities in Tanzania, Kenya, and Zambia and in rural and urban households in Myanmar [
16,
17,
18,
19]. The studies were six weeks in length, consisting of a two-week baseline phase to establish a traditional menu and cooking practices and a four-week phase where participants tried to cook as much as possible on electric cooking appliances. The studies showed that electric cooking was compatible with the cuisines of the countries, and the participants in the East African countries managed to cook 90% of their menu using the electric cooking appliances.
Studies with larger participant numbers have not reached the same level of detail in data collection as described above or have had to rely on customer recall for cooking practices over the previous year. For example, Gould et al. surveyed 808 households in Ecuador to assess cooking fuel choices after decades of subsidies for liquid petroleum gas (LPG) and a recent government program promoting induction stoves [
20]. Fuel use was self-reported and highlighted that LPG use was common, and the use of induction stoves were rare due to a lack of electricity infrastructure, broken stoves, or fears of high electricity bills. Banerjee et al. assessed a program where 4000 households were given induction stoves in India by surveying a quarter of these households one year after stove deployment, relying on participants to accurately estimate how their cooking practices have changed [
21]. Large surveys such as these can be helpful to illuminate trends in use as remembered or perceived by those surveyed. In this research, the monitoring of EPC use and a subset of biomass stove use, along with the household load profile data across all participants, provides confidence in the observed cooking practices and enables us to draw more robust conclusions than are possible through recall-based data.
3. Methods and Data
3.1. Pilot Description
The pilot study was conducted by the Access to Energy Institute (A2EI) in collaboration with Nexleaf Analytics, PowerGen Renewable Energy, and the Modern Energy Cooking Services (MECS) program. The study began in February 2020, and this paper uses data gathered from February until the end of December 2020. Additional research questions on affordability, price-sensitivity, and market viability were considered in the study, but these are not addressed in this preliminary paper. The study used three distinct datasets collected from different data-gathering methods to understand cooking behaviors:
Smart meter dataset: energy and power consumption data collected through the remote metering of EPCs and used to generate profiles of EPC usage;
Stovetrace dataset: temperature data collected from remotely monitored sensors attached to TCS and used to generate profiles of TCS usage;
Cooking Diary dataset: descriptions of cooked meals recorded in cooking diaries by users and collected by enumerators and used to understand what people cook.
The pilot included 100 participants from six different mini-grid villages in northwestern Tanzania. A total of three of the villages were on islands in Lake Victoria, and three were on the mainland in the Kagera region.
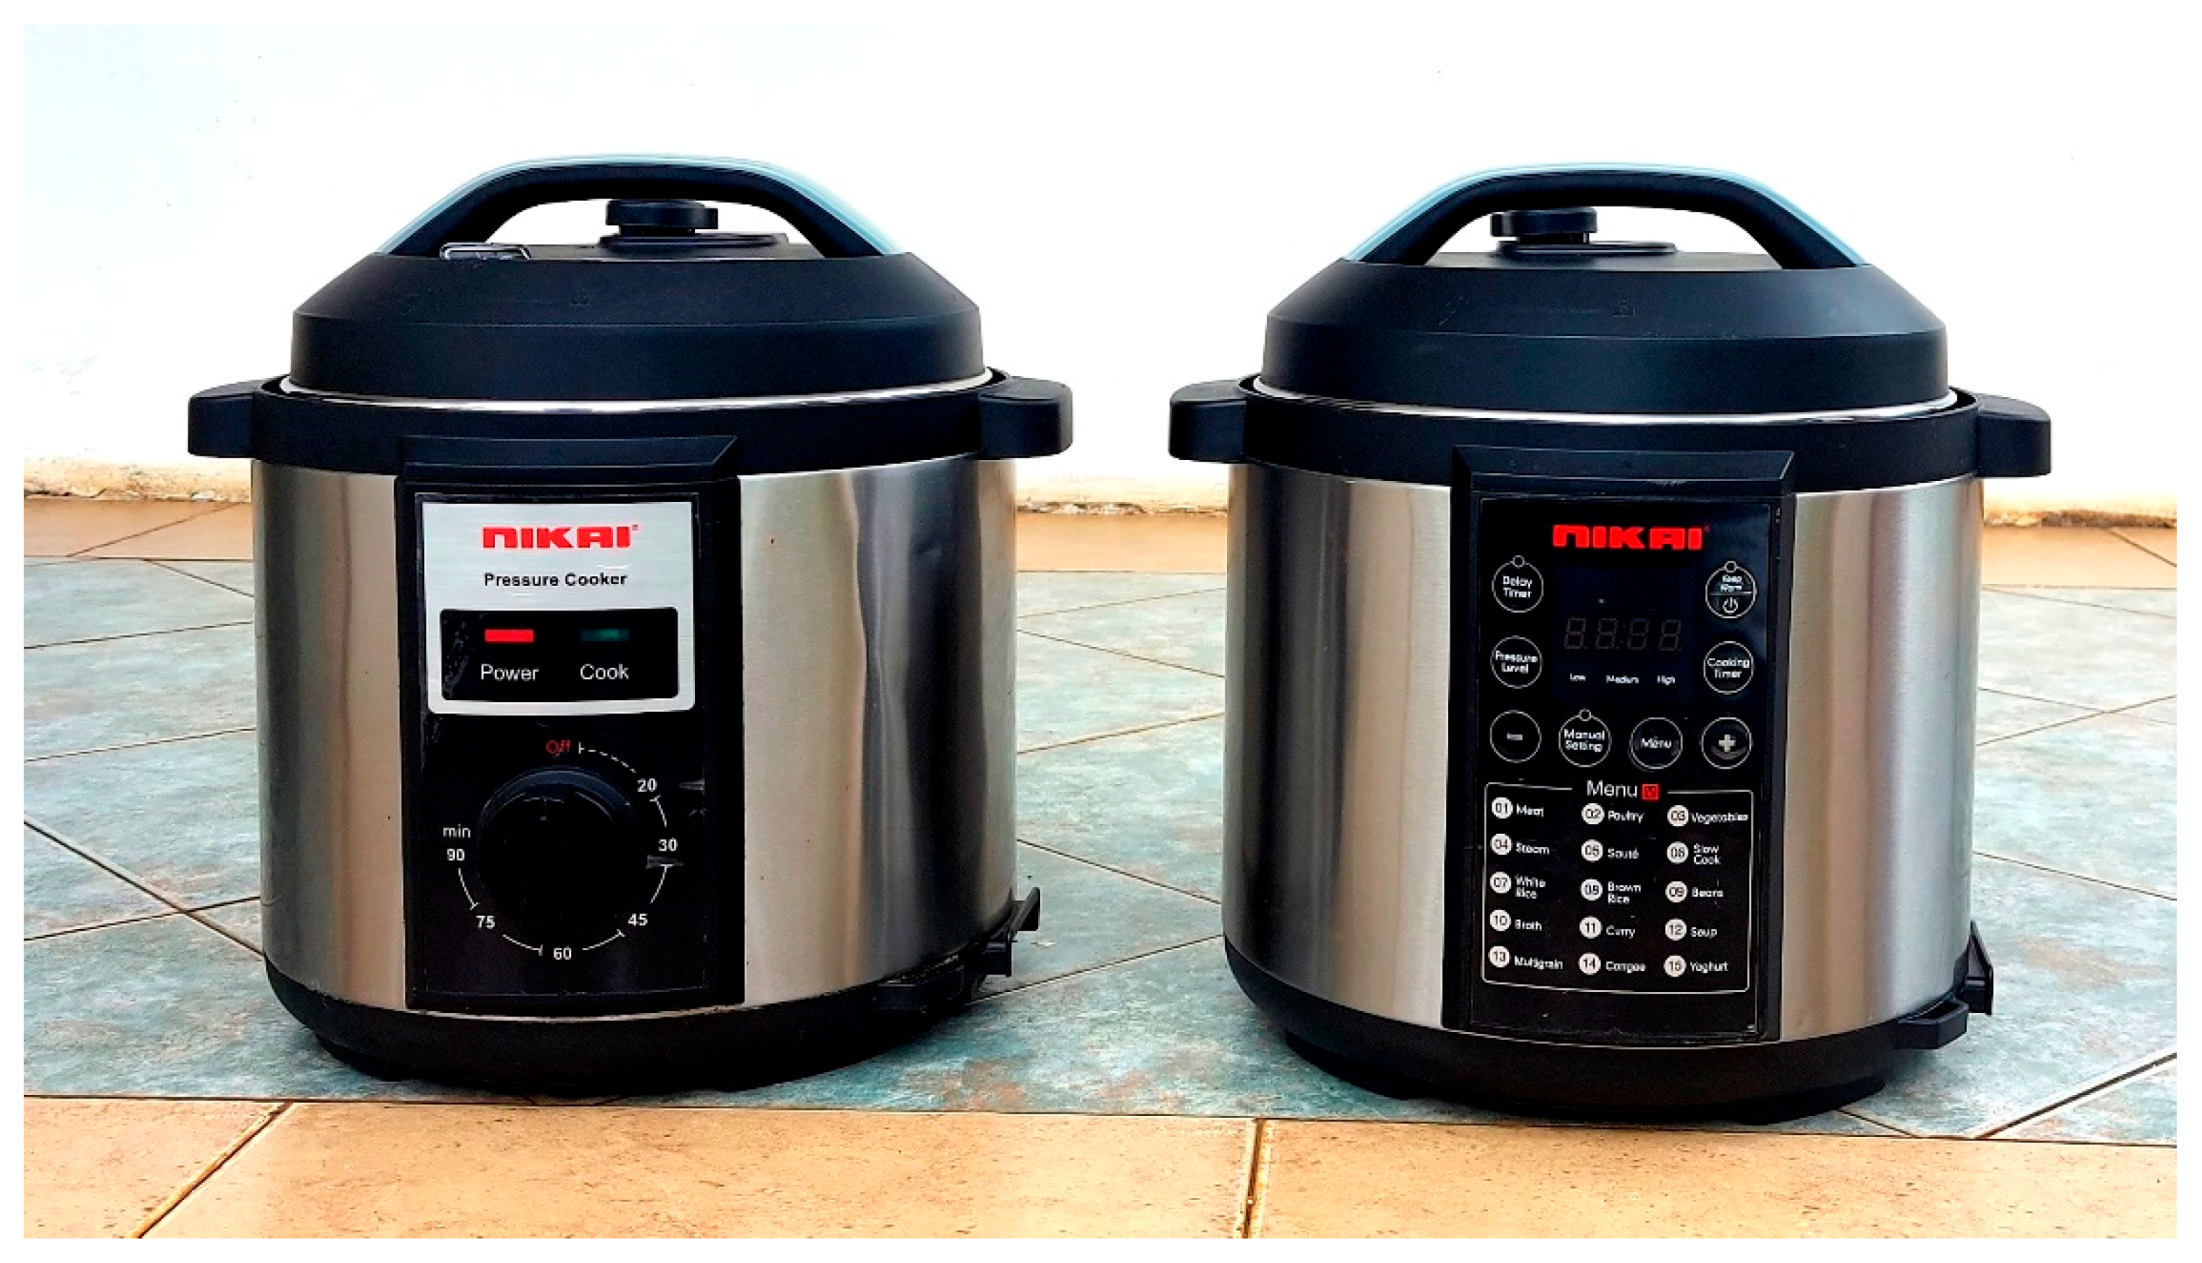
Table 1 summarizes some key data about the sites in terms of the size of the solar PV generation at the mini-grids, the number of connections, and the tariff structure in place. These sites were selected as being typical of many rural villages in the area and were split between islands and mainland sites to assess if EPC uptake and cooking practices differed in the different contexts. The EPCs that were used are described in
Table 2 and pictured in
Figure 1.
The participants were selected with the help of local community leaders and mini-grid agents. This sample size was set to draw clear and statistically significant insights without requiring too many resources. Estimating population parameters with a 10% margin of error at 90% confidence requires a sample of only 69, which is below the 92 valid users in the smart meter dataset (see
Table 3). Note that the Stovetrace and Cooking Diary datasets were drawn from small numbers of participants. Users were selected by considering only households that have more than three members.
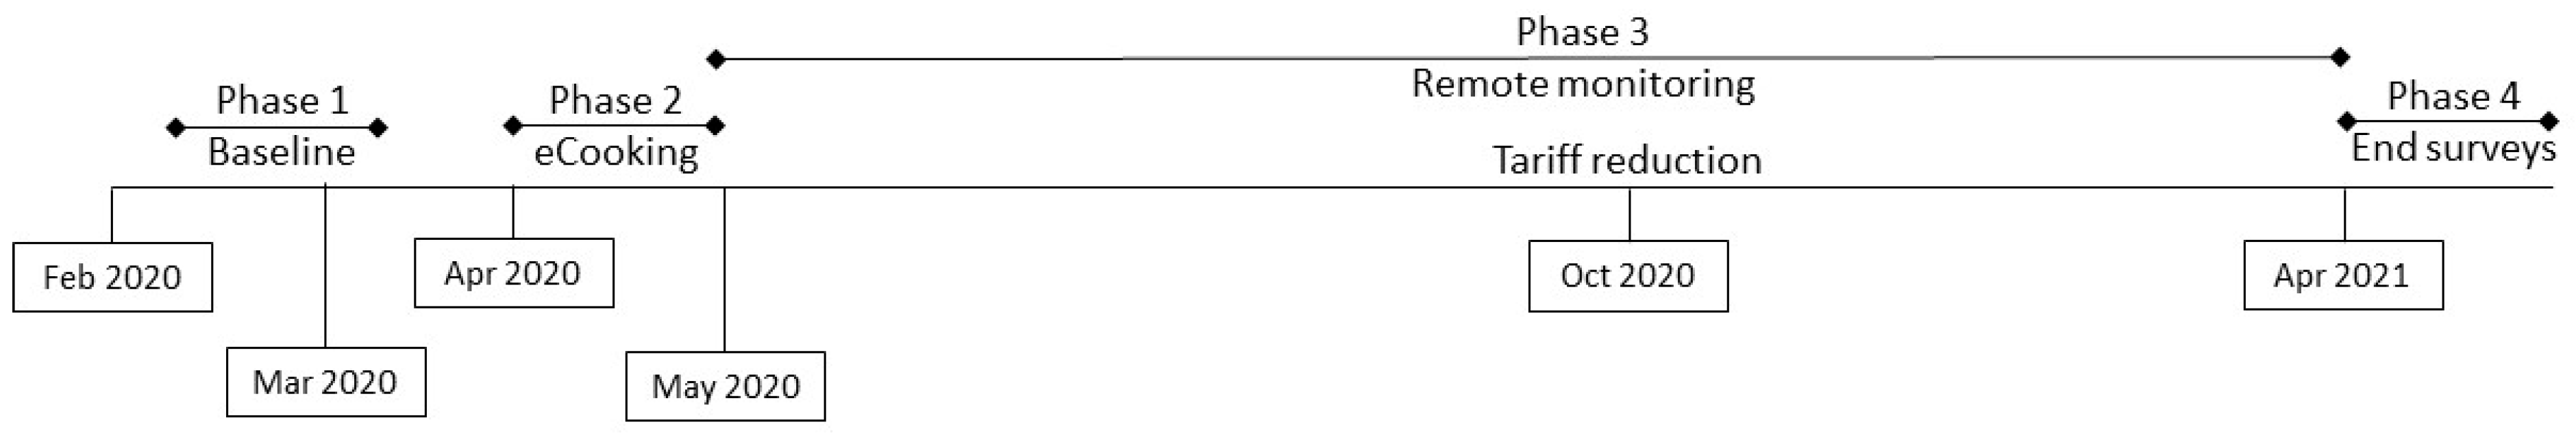
Broadly, the study consisted of four phases, of which the first three are considered in this paper:
The first phase consisted of baseline data gathering to understand existing cooking practices and was initiated in February 2020. During this phase, households completed cooking diaries and had their TCS monitored through temperature sensors;
The second phase of the study consisted of field work to promote the adoption of electric cooking appliances. The second phase started in March 2020, which is when participants received the EPCs and were trained on their usage. Each EPC was attached to a smart metering device that remotely collected power and energy data. Cooking diaries were again used during this phase, and TCS monitoring also continued throughout this phase;
The third phase of the study was focused on the remote monitoring of the devices with minimal contact between the researchers and participants to understand how the households cooked without external influence. The third phase began in April 2020 and lasted for 12 months; however, this paper only considers data collected until the end of December 2020. During this period, data was collected through a light version of the cooking diary and through the remote monitoring of the TCS and EPCs;
The fourth phase of this study occurred in April 2021 and consisted of field work to collect additional data from users through surveys. The fourth phase of the study is not included in this paper.
Changes in the legal frameworks around off-grid energy provision in Tanzania in the second half of 2020 led to an interesting event whereupon mini-grids and other electricity providers were regulated to provide electricity at tariffs no greater than those set by the national utility. This led to a sudden and unexpected reduction in electricity tariffs. Although highly disruptive to the industry, the effect of the price change on household cooking behavior was captured in this study, which gave interesting insights into the effect of price on appliance use. However, an analysis of how price affects usage is beyond the scope of this paper and will be presented in a future publication.
There are various research activities that were also part of the trial but are not in the scope of this paper and, as such, not included in
Figure 2. For example, a registration survey gathered demographic data for the subset of participants who took part in more intensive data collection to give the opportunity to match cooking practices to the demographics. A willingness to pay exercise was implemented at the end of the pilot for all 100 households to gauge the price point at which participants would purchase EPCs. Finally, an exit survey across all participants was planned for May 2021 in order to gain qualitative user experience feedback on the trial and EPC experience. These additional activities and the insights gained from them will be reported on in future published works.
Three datasets have been analyzed for this paper, two of which were only gathered for a subset of the 100 participants (see
Table 3). The smart meter dataset tracked the use of the EPCs and provides insight into the EPC usage patterns and energy consumption. Valid data were successfully acquired from 92 households. The Stovetrace dataset provides insight into the characteristics of fuel stacking throughout the course of the study as well as a comparison to EPC use and allows for a measurement of the impact of EPC use on TCS usage in terms of both duration and frequency. The Cooking Diary dataset tracked household cooking practices and how they changed in response to the introduction of the EPCs and throughout the rest of the study. The dataset includes the details of the dishes that make up the household menu along with estimates of biomass fuel usage to allow for energy comparisons. The following subsections provide more detail into how each dataset was gathered and what data points comprise each dataset.
3.2. Smart Meter Dataset
A2EI have developed smart meters with remote electric power monitoring capabilities and are deploying them across numerous electric cooking pilots to increase the evidence base for the uptake and impact of electric cooking. The meters are in-line (between electricity source and electric appliance) and within this pilot, had a time resolution of five minutes.
A2EI smart meters were installed in all 100 households in the study. Data were uploaded to a server, where a mobile network was readily available. For the few locations where there was no network coverage, data were stored in the smart meter’s internal storage, the meters were then periodically transported to areas with a good network to transfer all of the stored data.
An EPC cooking event is initiated by an increase in the cumulative energy counter in the smart meter, e.g., from 0.2 kWh to 0.7 kWh. The data are recorded at five-minute intervals. An event ends when there is no energy increase for more than 15 min. The algorithm to define a cooking event involves several checks to capture and verify every cooking event. These checks include whether each EPC cooking event longer than 5 min has a recording with a current above 3.5 A, whether the energy consumption of the event should be above 0.05 kWh, and whether the average power level should be above 0.05 kW (i.e., 5% of the nominal power of the 1 kW EPC).
3.3. Cooking Diary Dataset
The MECs used adapted versions of the cooking diary method, which generates data on how and what people cook and was originally developed to understand how compatible these practices might be with modern energy cooking products and services such as the EPC [
22]. An intensive cooking diary collects a robust dataset by monitoring cooking practices across all cooking devices but is a time-consuming process for the cooks (who record the data as they cook), the enumerators (who visit the cooks to collect the data), and the research team (who receive and clean the data). To keep participants motivated to continue recording data on their cooking behaviors and to avoid overwhelming or tiring them over the whole duration of the study, the trial introduced an innovative approach of a light cooking diary. A light cooking diary asks participants to record a limited set of data only when they use the EPCs and is thus suitable for trials of longer durations because it is less time-consuming.
In this study a total of 28 participants from one mainland site (Site 5) and one island site (Site 1), with 14 participants from each site, took part in the cooking diary exercise. The cooking diary was implemented over the three phases of the trial, thus:
Phase 1: Four-week intensive cooking diary to gather baseline cooking practices data. Participants were not asked to change their cooking habits;
Phase 2: Four-week intensive cooking diary to gather electric cooking practices data. Participants were free to use the EPC as they wished;
Phase 3: Eleven-month light cooking diary to monitor EPC use over the rest of the duration of the study. Participants continued to use the EPC as they wished.
Before Phase 1 started, participants were trained on how to keep a cooking diary. A total of three enumerators were recruited from each site and were trained on how to record the diary data using mobile tablets using an Android data collection platform (Kobo Toolbox) and how to then upload the recorded data to the server. The participants were given non-monetary incentives, which were selected to avoid influencing their menu choices, and enumerators were paid for their time. At the end of each phase, further training was provided to introduce the new cooking diary format and to help the participants and enumerators through the transition.
The intensive Cooking Diary dataset consists of:
What dish was cooked;
Why it was cooked (breakfast, lunch, dinner, snack);
Cooking device used;
Fuel measurements before and after cooking;
Time taken;
Time of day;
Cooking equipment used;
Who did the cooking;
For how many people it was cooked for;
Whether or not food was saved for later;
Reheating behavior.
Participants were asked to record information relating to each heating event on a separate printed form (e.g., preparing a meal such as lunch), which was then entered into the database by the enumerators as a single record. A heating event could cover either a meal (breakfast, lunch, dinner) or another heating purpose, such as heating water for bathing. A single heating event record could cover multiple purposes (e.g., food could be prepared for both breakfast and lunch (two purposes)). However, almost all of the data records comprised heating events covering only a single purpose (n = 3068). A single heating event purpose, such as preparing a dinner, could include several dishes and/or heating water as part of that meal.
The cooking diary light dataset consists of:
What dish was cooked;
Why it was cooked (breakfast, lunch, dinner, snack);
For how many people it was cooked for;
What time the EPC was switched on.
The calorific values of the fuels were calculated based on the measured usage of the fuel and the values given in
Table 4.
3.4. Stovetrace Dataset
Stovetrace sensors were developed by Nexleaf Analytics to monitor the use of biomass cookstoves through recording temperature variation with time. The sensors are secured to TCS via brackets and record temperature variations with a time resolution of 10 min. Data are stored on the sensors and extracted using a mobile application on a phone or tablet that connects to the sensors via Bluetooth. For the study, data collectors were hired to perform the data extraction on site periodically.
In Phase 1 of the study, Stovetrace sensors were installed on pre-existing stoves at the 28 households involved recording cooking diaries. The pre-existing stoves included various types of charcoal stoves, both improved and unimproved, as well as three-stone fires and kerosene stoves. Participants cooked as usual on these stoves, keeping the sensors in place. The data were extracted from the sensors by the cooking diary enumerators, allowing for simultaneous data collection of both datasets.
This Stovetrace dataset consists of the following:
A TCS cooking event is defined as the time period during which the stove temperature is in a cooking/heating range as opposed to an ambient temperature range. Cooking temperature ranges are distinguished using a temperature threshold, which is determined through historic temperature data from each stove, allowing for the seasonal variation of ambient temperature.
3.5. Limitations of Methodology and Potential Sources for Bias or Error
In conducting this research, several potential sources of bias or error were identified and are summarized in
Appendix A. Steps were taken to mitigate these limitations within the methodology within the constraints of the scope and budget of the research, but these should be borne in mind when considering the results. It is hoped that detailing these limitations should inform and guide the design of future studies into this topic.
4. Results and Analysis
4.1. Adoption of EPCs
In this section, we present information and findings from the smart meter dataset to examine how the EPCs were adopted by mini-grid customers after being introduced into households. The analysis highlights trends in usage over time and how users may be segmented.
4.1.1. General Trends in Adoption
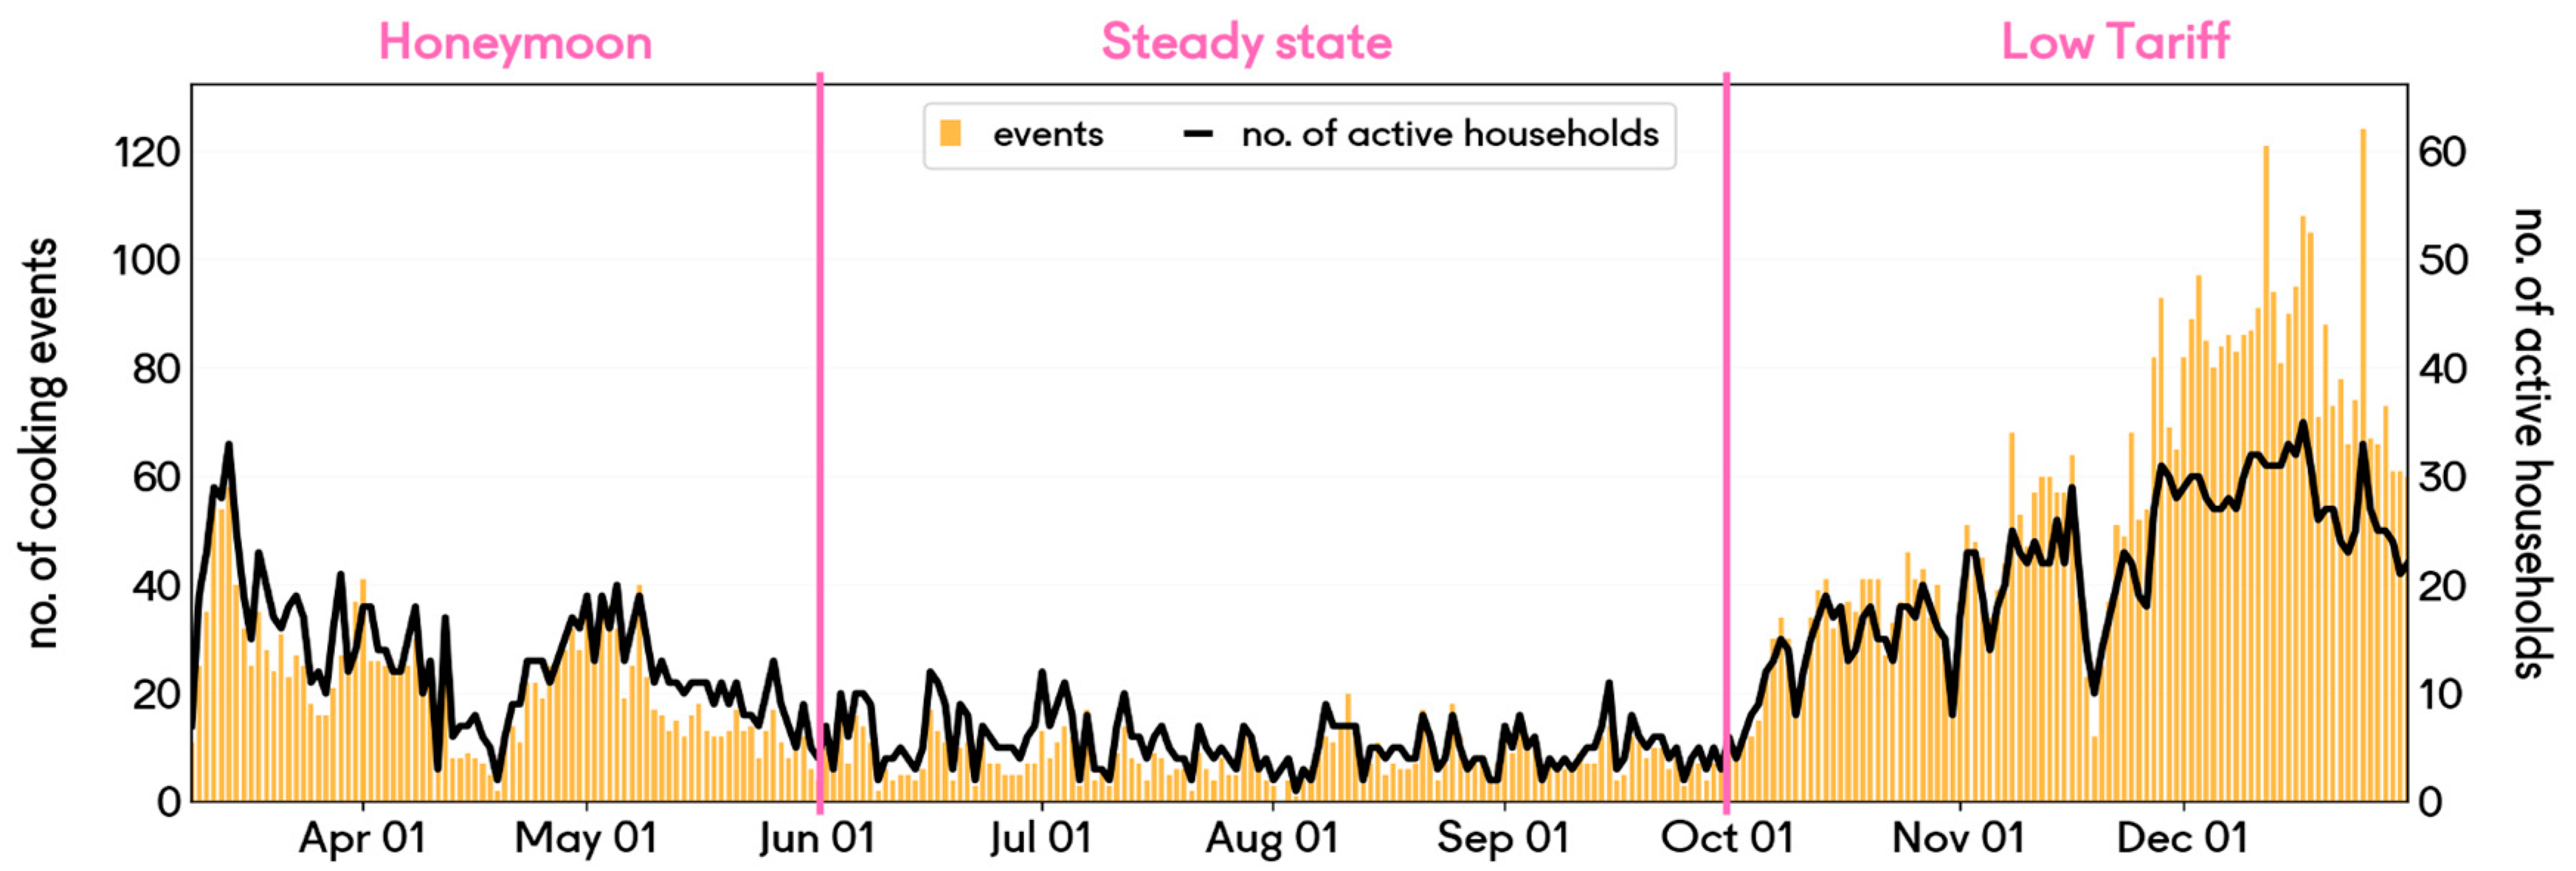
To understand the adoption of EPCs by households, we analyzed the EPC usage data over the study duration.
Figure 3 presents the aggregate of cooking events and number of active households, defined as households using the EPC in a given day. The graph is characterized by a U-shaped curve and can be broken into three periods:
Honeymoon Period: The first period observed is termed the “Honeymoon” period, which is characterized by a decline in usage between March and May. From the graph, we see that households used the EPCs frequently after first receiving them but that this usage dropped significantly after the first three months. We hypothesize that the initial spike was caused by the novelty and excitement of having the EPC. After users became familiar with the appliance, they had better insights into the cost of ownership and reduced their usage due to affordability issues.
Steady State Period: The second period observed is the “Steady State” period, which is characterized by a relatively flat usage between June and October. At this point, we hypothesize that users had gained sufficient familiarity with the appliance during the Honeymoon phase and could then made rational decisions as to whether to use it or not. Since the tariff structure was high, we believe many users found it too costly to cook with and thus usage remained low.
Low Tariff Period: The third period observed is the “Low Tariff” period, which is characterized by an increase in usage between October and December. At the beginning of October, changes in government regulations resulted in a tariff decrease from $1.00 USD/kWh to $0.04 USD/kWh. Following this change, it became more affordable to cook using electricity, and the participants began to use their EPCs frequently.
This adoption trend is evident in the monthly usage statistics, which are presented in
Table 5. The number of households cooking during any given month declined between March and September before rising again in October. Similarly, the average event consumption and the average number of events per household also increased from October. Thus, the tariff reduction corresponded with an increase in usage in three distinct ways: an increased number of users, an increase in usage frequency, and an increase in duration per usage event.
Across all three periods, we note that the EPCs were operated by a least a small subset of users, implying that their usage was not hindered by technical challenges to the users or the mini-grids. This suggests that they are technically feasible on a mini-grid of adequate sizing: the most notable technical challenge was power unavailability in December, when it was no longer financially viable to run back-up generators after the mandated tariff reductions.
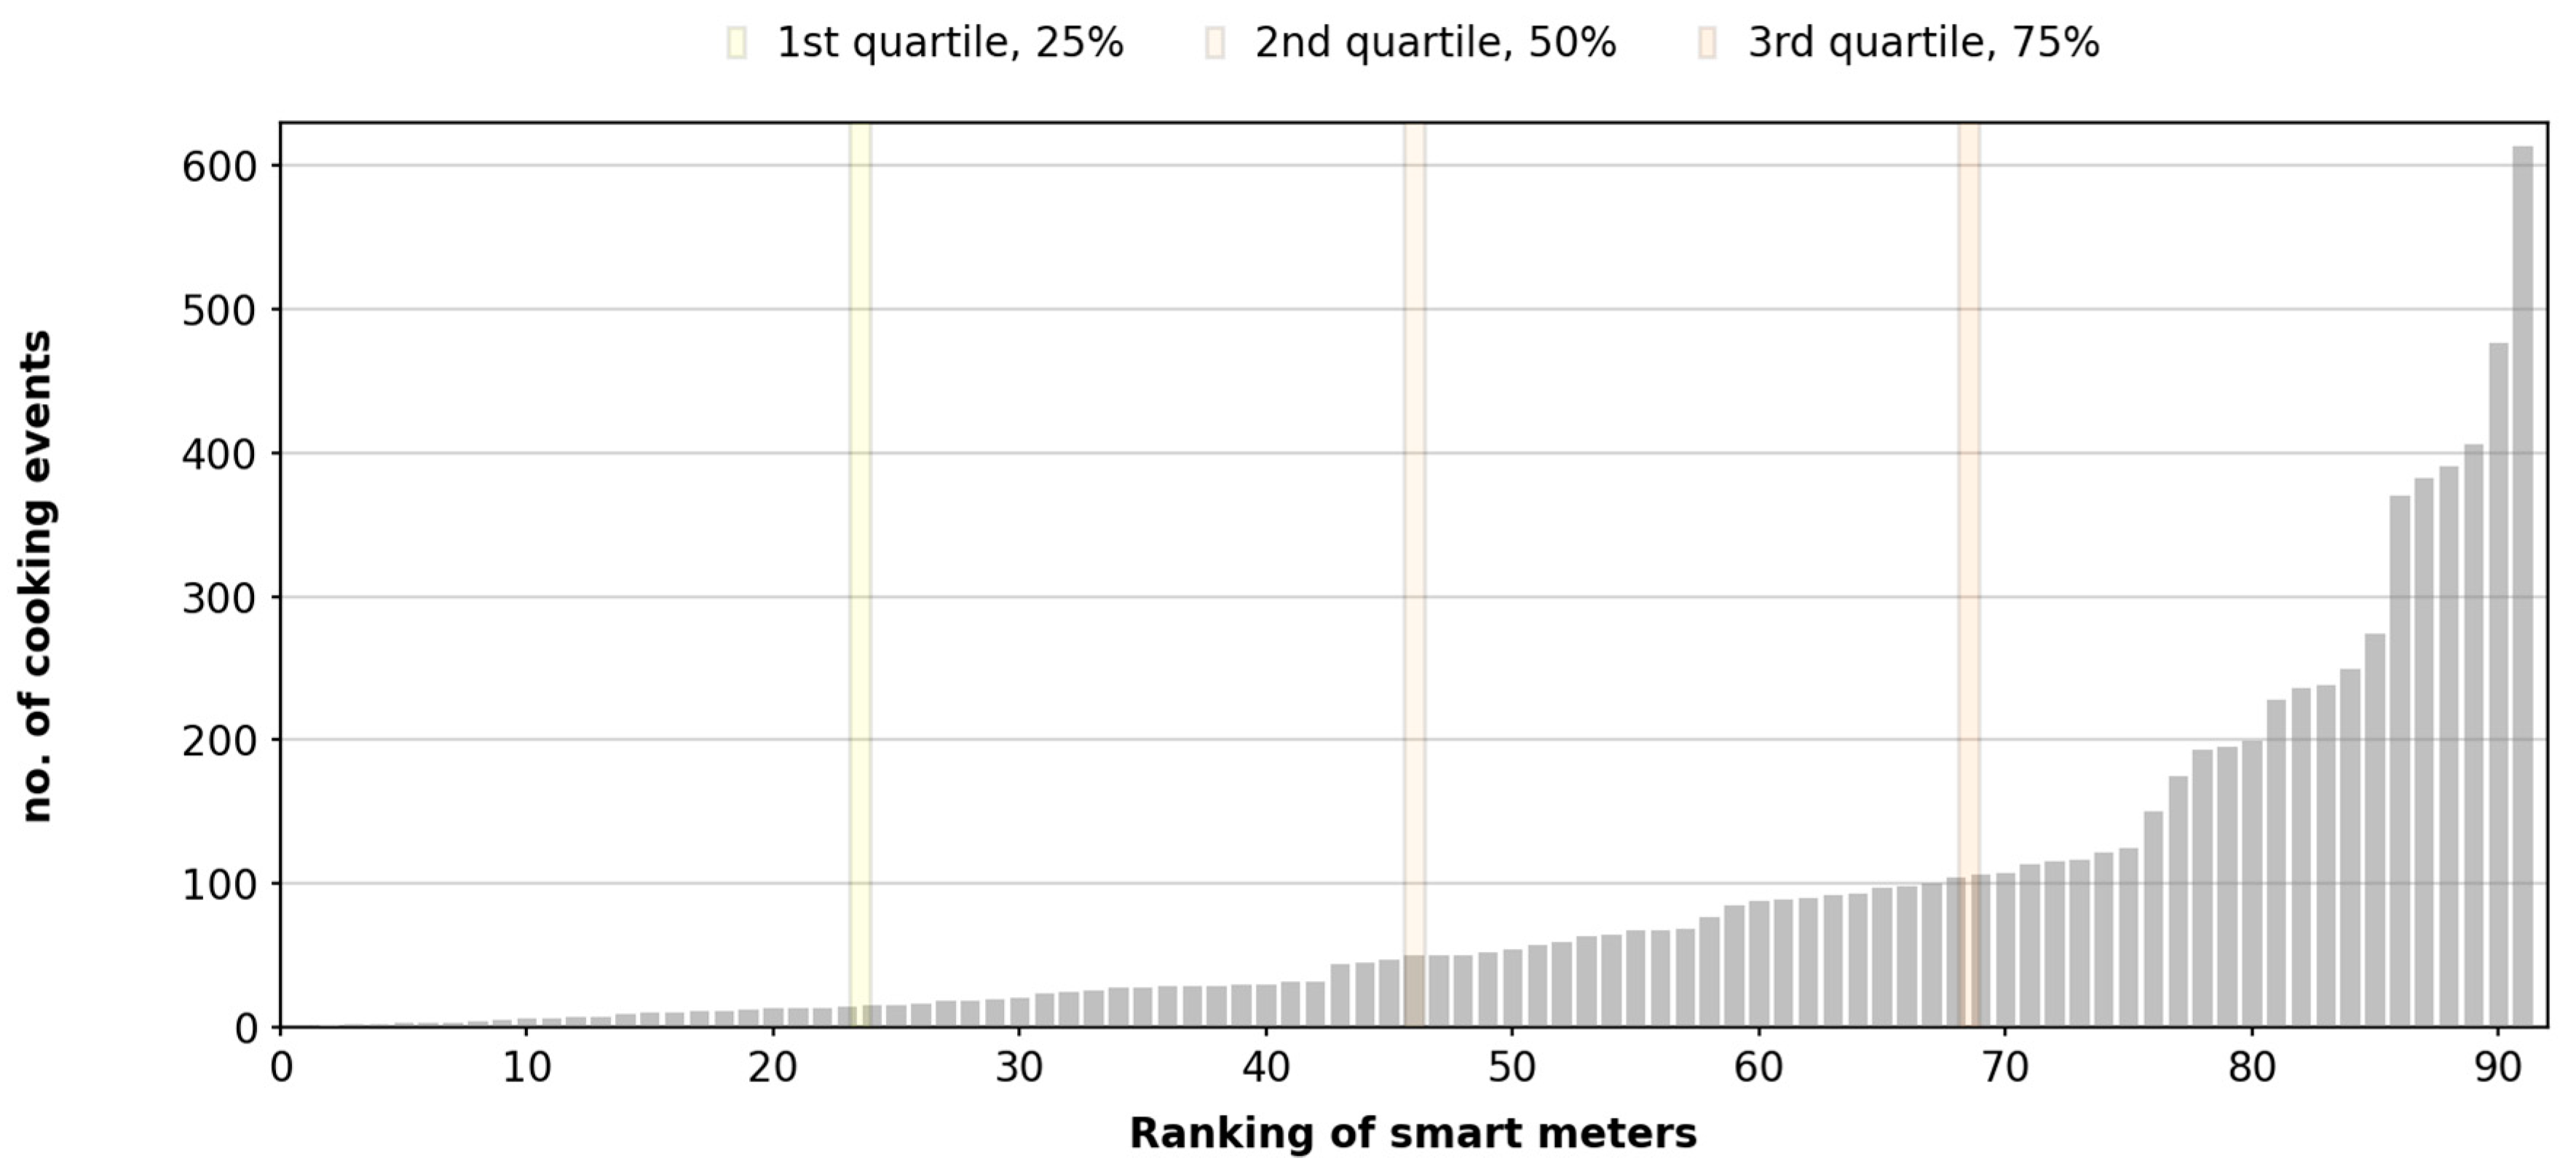
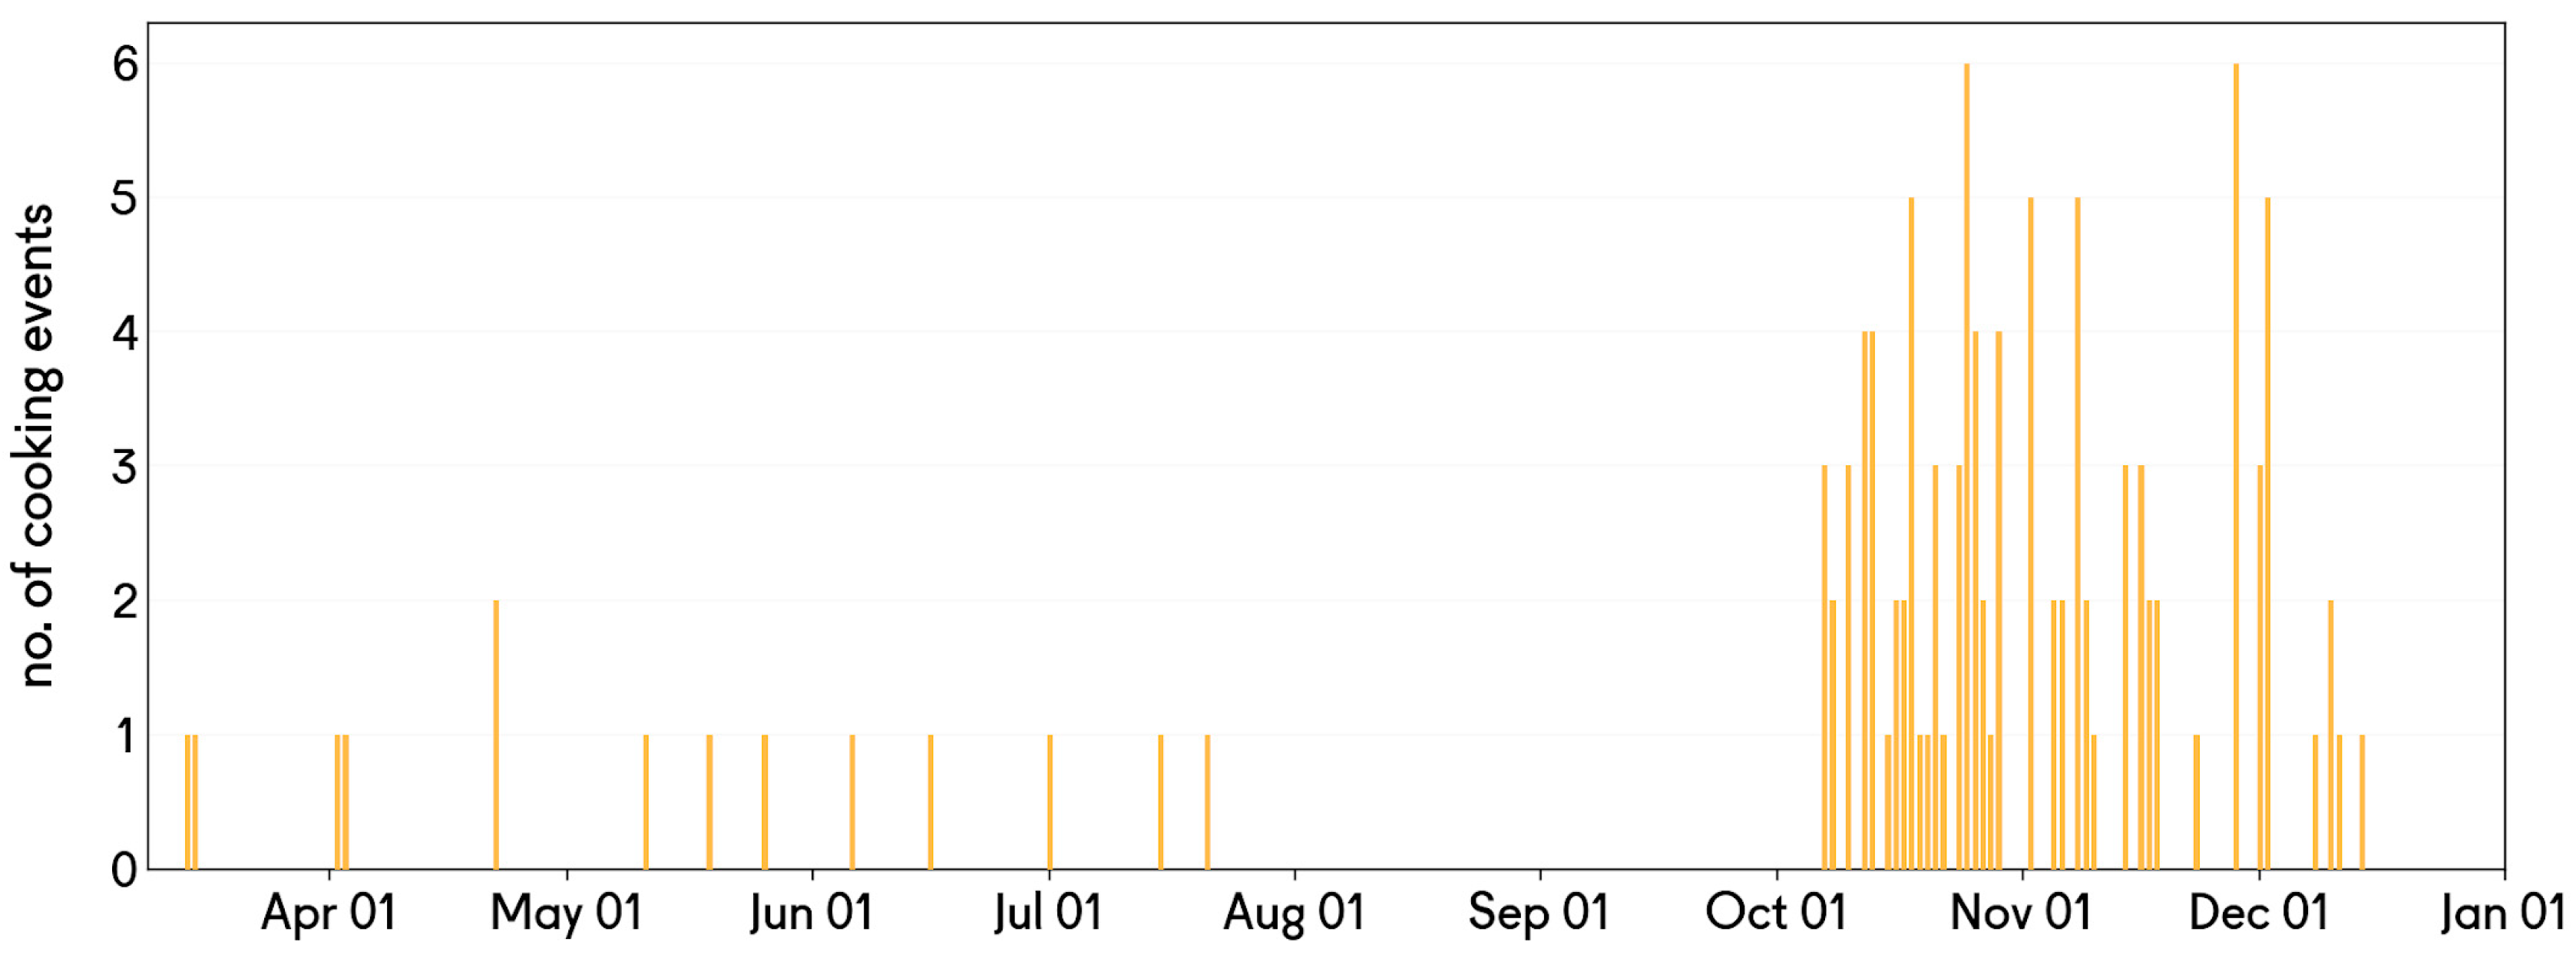
4.1.2. EPC Use by Individual Households
Figure 4 presents the number of cooking events per household over the study period ranked in ascending order. Most participants made little use of their EPC, with the 25th percentile of users accounting for less than 3% of all cooking events. The majority of the cooking events were attributed to a smaller subset of users, with the top 25% of users accounting for 74% of all cooking events. Moreover, 50% of the cooking events were attributed to just 16 users.
These data show that under the pre-existing tariff, a small number of users enjoy the benefits of the EPC while the majority do not. From this, we conclude that there is a market for electric cooking on solar mini-grids even under high tariff conditions: the users with the highest use rates are high-potential target customers for electricity suppliers. We also conclude that many users will not benefit from the introduction of EPCs if the tariff is too high, so initiatives to promote electric cooking must consider that a lack of affordability may well produce inequitable outcomes.
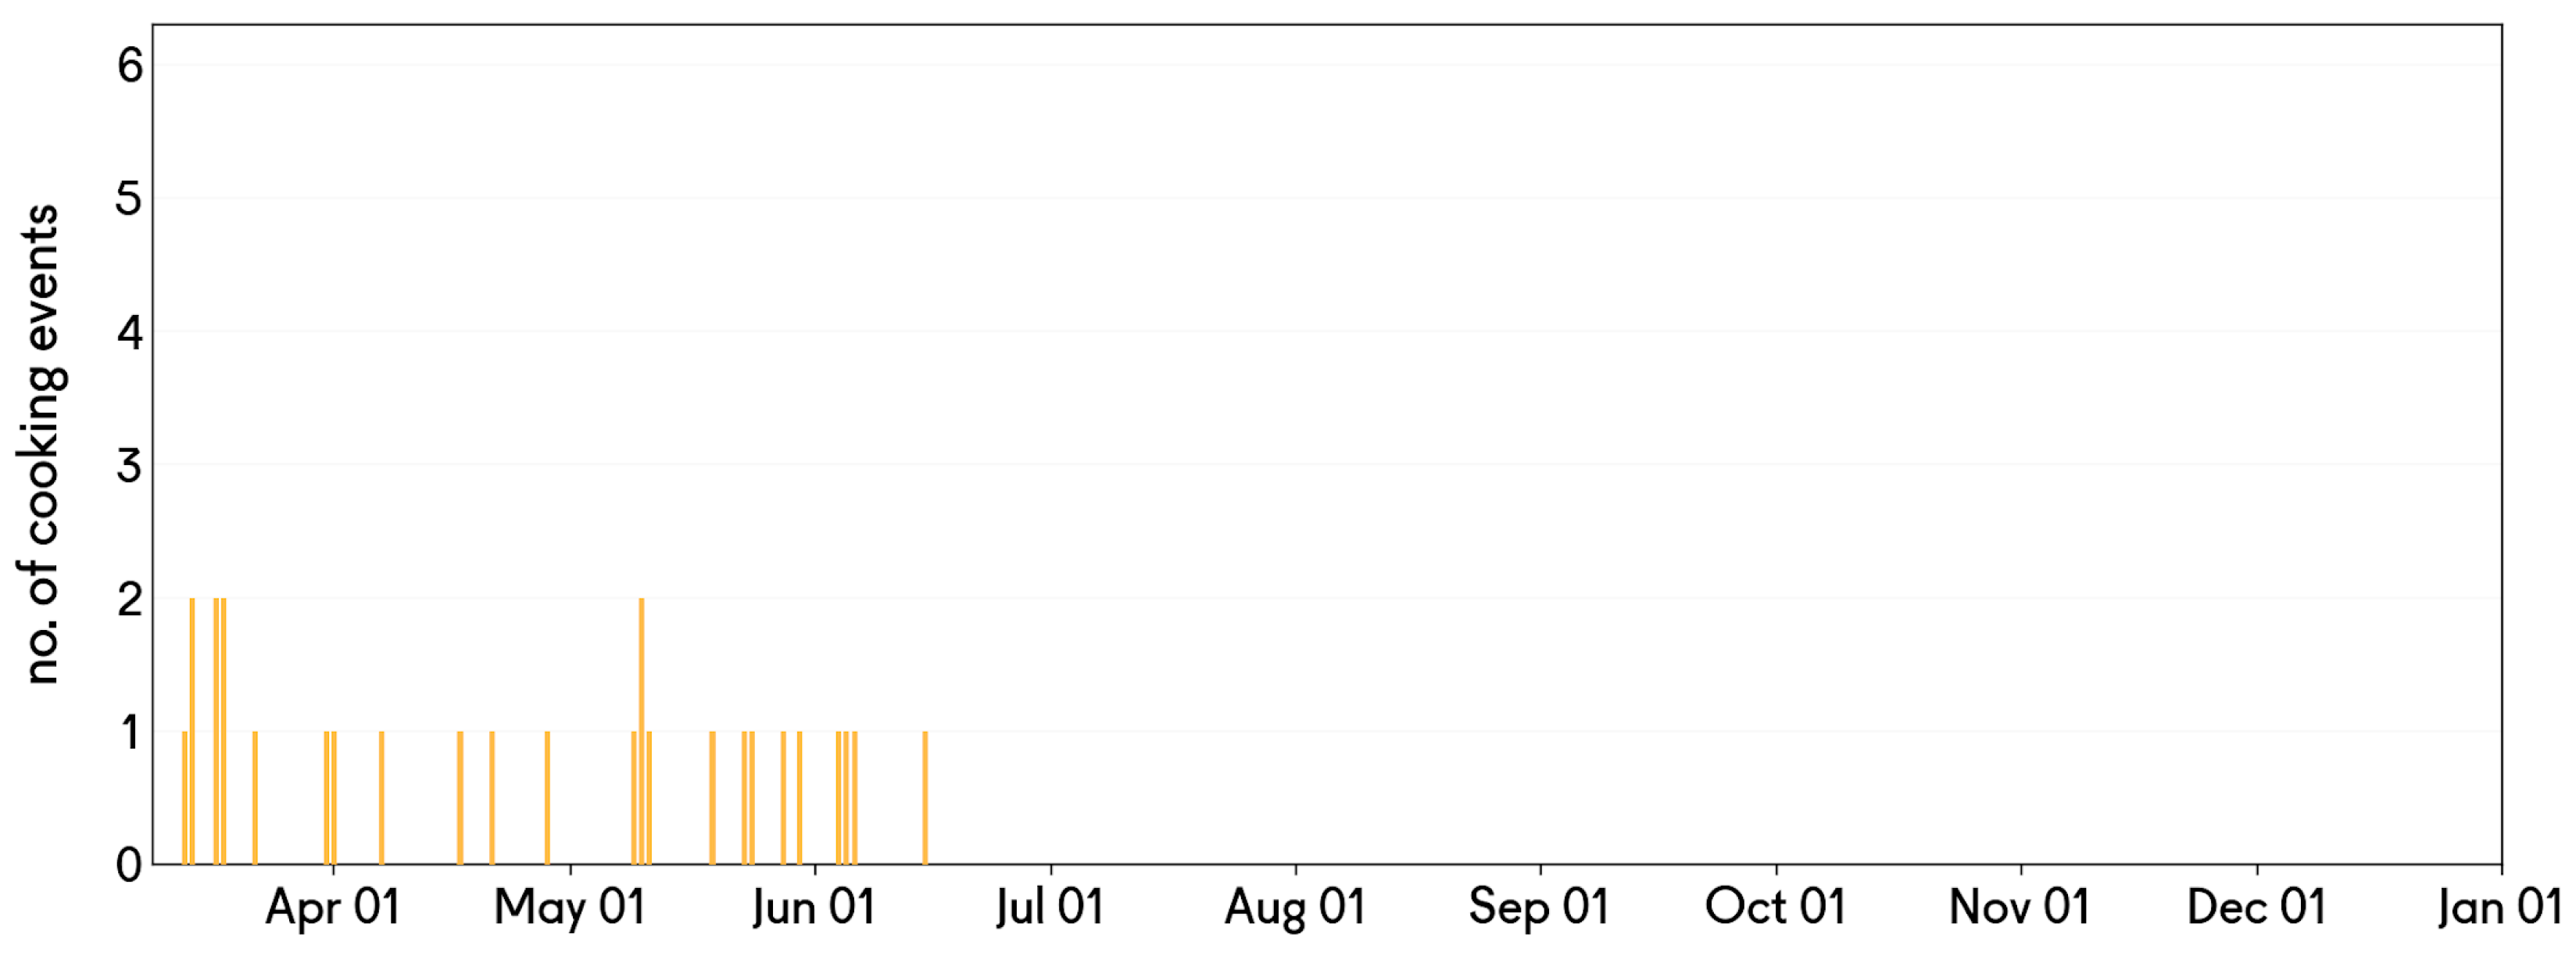
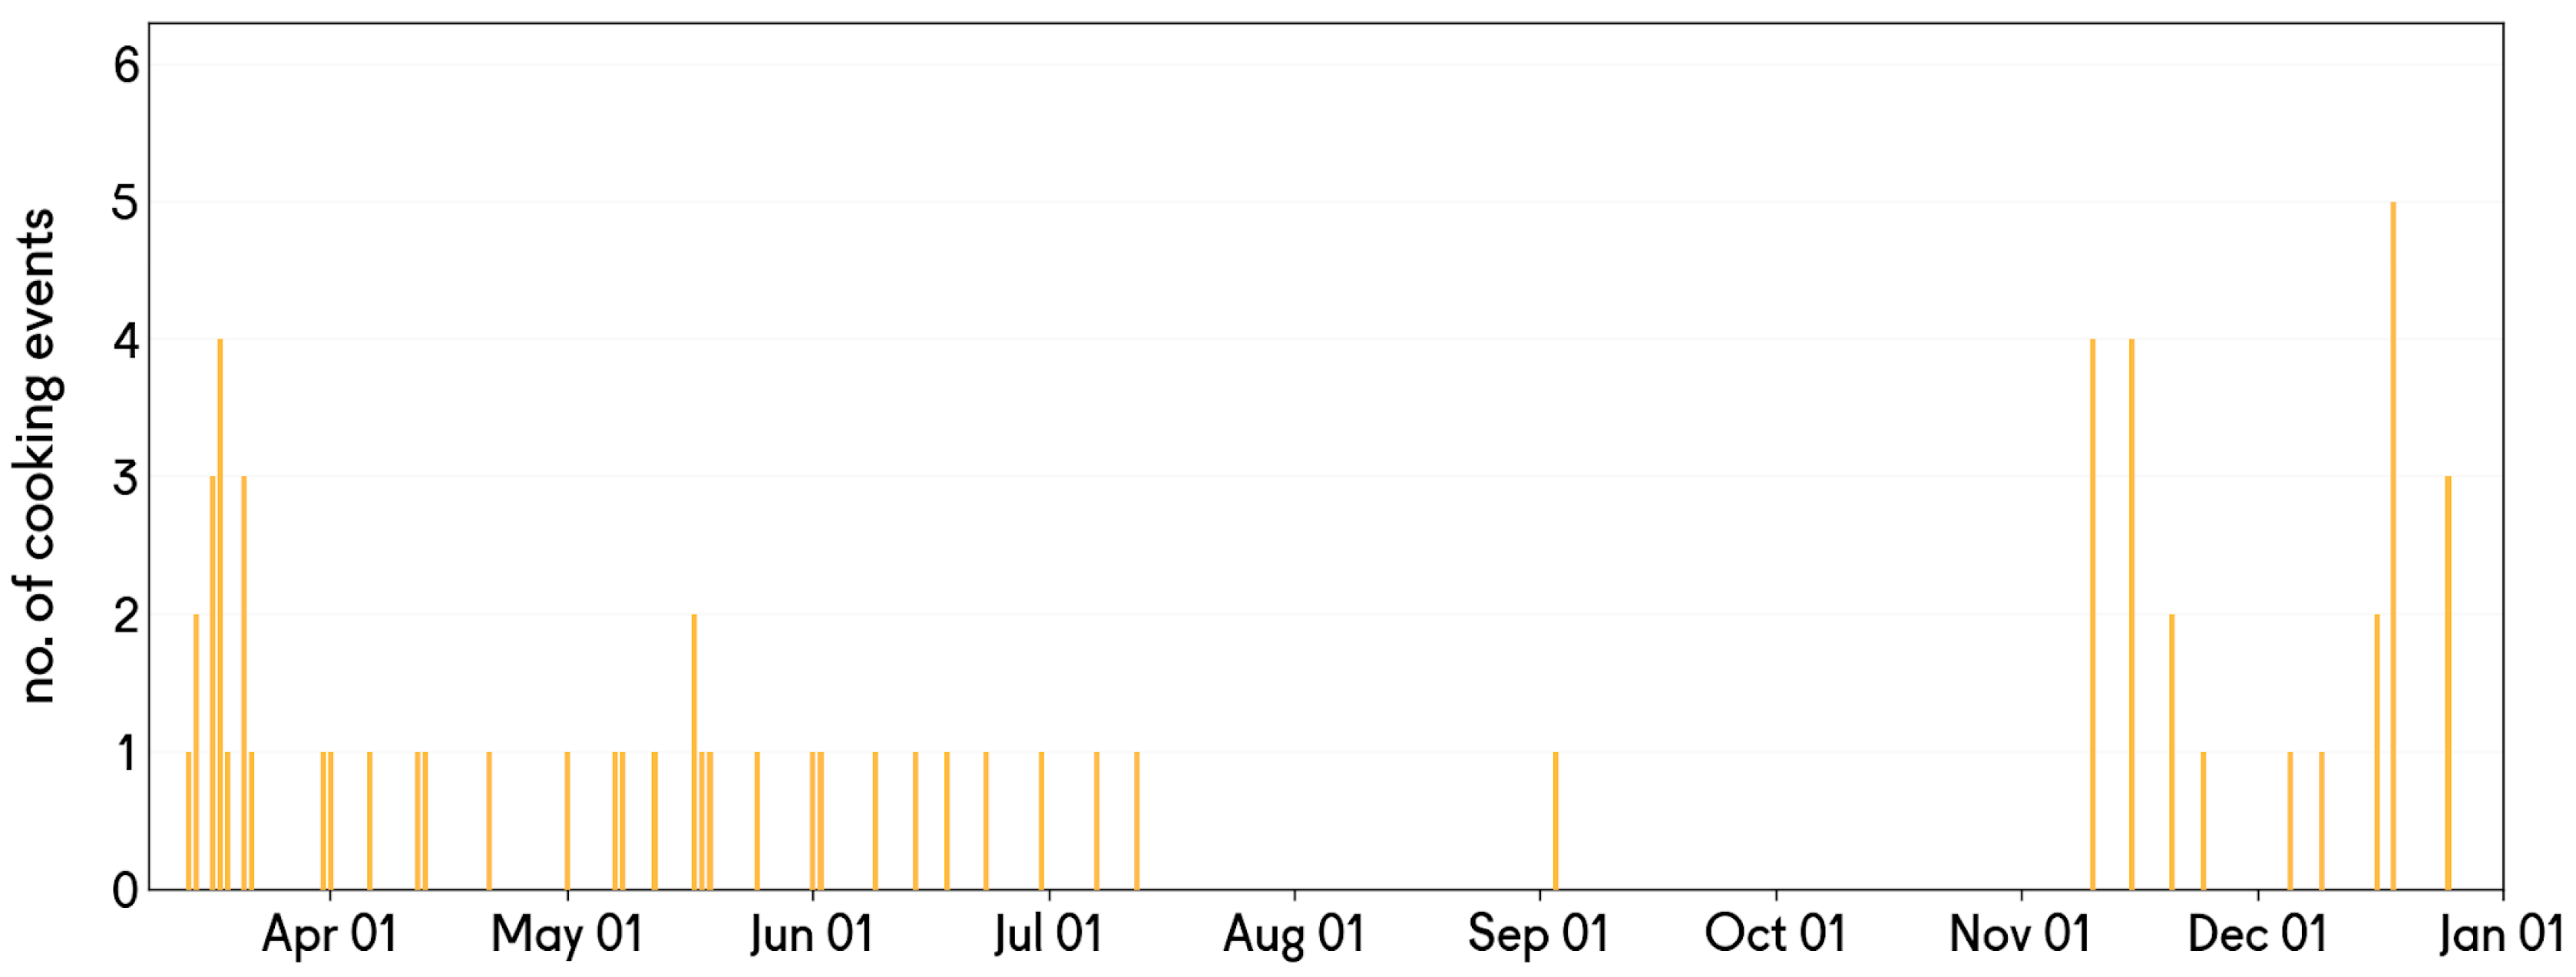
To explore differences between households, three example households have been selected to represent low (1st Quartile), medium (2nd quartile), and high usage users (3rd quartile). In all households, usage decreased after the Honeymoon period ended (
Figure 5,
Figure 6 and
Figure 7), and the low use household stopped using the appliance entirely.
Note the effect that the tariff change had on these three representative users. The striking finding from
Table 6 is that the high user, who made the least use of the EPC during the honeymoon period, started making the greatest use of it when the tariffs were reduced.
From this, we hypothesize that users who cooked with the EPC infrequently during the higher tariff periods are price sensitive. When the price of electricity was high, they cooked less, and when it dropped, their usage increased. This effect is more pronounced with the high-usage user presented in
Figure 7 than with the medium-usage user presented in
Figure 6. While tariff pricing was a major determinant of usage for the user in
Figure 7, we find that this is not consistent across all users: the user shown in
Figure 5 did not increase usage after the tariff drop, suggesting that their motivations for not using the EPC were not necessarily financial in nature.
The financial viability of mini-grid customers cooking with EPCs appears tenuous under current cost recovery tariffs. Use increased after the tariff was reduced as a consequence of regulatory changes, suggesting that customers felt that cooking with EPCs was not financially viable under the initial tariff. However, the low tariff is not financially viable for the mini-grid company. Further research is required to understand if there is a price point between the initial tariff and the low tariff where financial viability could be achieved for all stakeholders.
4.2. Effects of EPCs on Meal Composition
In this section, we present information and findings from the cooking diaries dataset to examine how the introduction of EPCs changed cooking practices related to meal composition, such as the choice to cook certain dishes or meals. The analysis highlights changes in the dishes and meals that were cooked following the introduction of the EPC by comparing Phase 1 and Phase 2 of the study.
4.2.1. Meals Cooked
Overall, breakfasts were prepared approximately half as often as lunches and dinners.
Table 7 shows that breakfasts were cooked less often and lunches more often after the introduction of the EPCs; however, overall differences remain modest.
Table 8 shows that the majority of meals were relatively simple, comprising only one or two dishes. It also shows that after the EPCs were introduced (Phase 2), participants were less likely to prepare complex meals consisting of multiple dishes—the incidence of one-dish meals rose from 22% to 25%.
The analysis shows that the introduction of EPCs did not have a particularly disruptive effect on the composition of meals. There was a small increase in the proportion of single dish meals prepared and a slight reduction in the proportion of breakfasts prepared.
4.2.2. Dishes Cooked
Table 9 shows the most commonly cooked dishes across Phases 1 and 2. This shows a high degree of consistency in the mix of dishes that were cooked in both phases, suggesting that participants were largely able to incorporate the EPCs into cooking their normal menus. There are a couple of exceptions, e.g., in Phase 2, participants were more likely to cook rice, sweet potatoes/cassava/taro root, and fish stew.
Table 10 shows that when participants were given the EPCs in Phase 2, they most commonly used them to cook rice and beans and to prepare hot drinks. Whereas ugali was the most commonly cooked dish in Phase 1 (29.7% of all TCS dishes), it only accounted for 11.6% of the dishes cooked in EPCs. Rice was the dish that was the most commonly cooked with the EPCs (21.0% of all EPC dishes in Phase 3), yet it accounted for only 5.7% of all TCS dishes cooked in Phase 1. Another common starch dish was sweet potatoes/cassava/taro root, which comprised only 2.7% of dishes cooked in Phase 1 but was frequently cooked using an EPC during Phase 2 and Phase 3 (9.6% and 7.6% respectively). Due to factors such as seasonal availability, we are unable to draw any conclusions on whether the introduction of EPCs changed which foods were cooked. However, it is clear that the EPC is favored for specific dishes.
The Cooking Diary dataset highlights the importance of heating water in the household energy budget. A total of 20% of the events recorded in the cooking diaries (Phase 1 and Phase 2) involved heating water, which was almost always heated as part of preparing a meal (mostly for preparing hot drinks). The figures in
Table 10 suggest that people were more likely to prepare hot drinks with an EPC than with a TCS.
Overall, the data confirm that introducing EPCs had only marginal effects on the dishes that were cooked (see
Table 9). Moreover,
Table 10 shows that the most common dishes were cooked in EPCs, confirming that EPCs are socially acceptable to users.
4.3. Impacts of EPCs on TCS and Fuel Usage
This section discusses how the introduction of the EPC impacts the usage of traditional fuels and TCSs in the household. The analysis considers how the EPC integrates into cooking behavior and either substitutes or stacks with biomass and TCS cooking. Understanding stacking behavior is key to understanding the impacts that EPCs can have on household cooking and, therefore, on health, time, and financial outcomes.
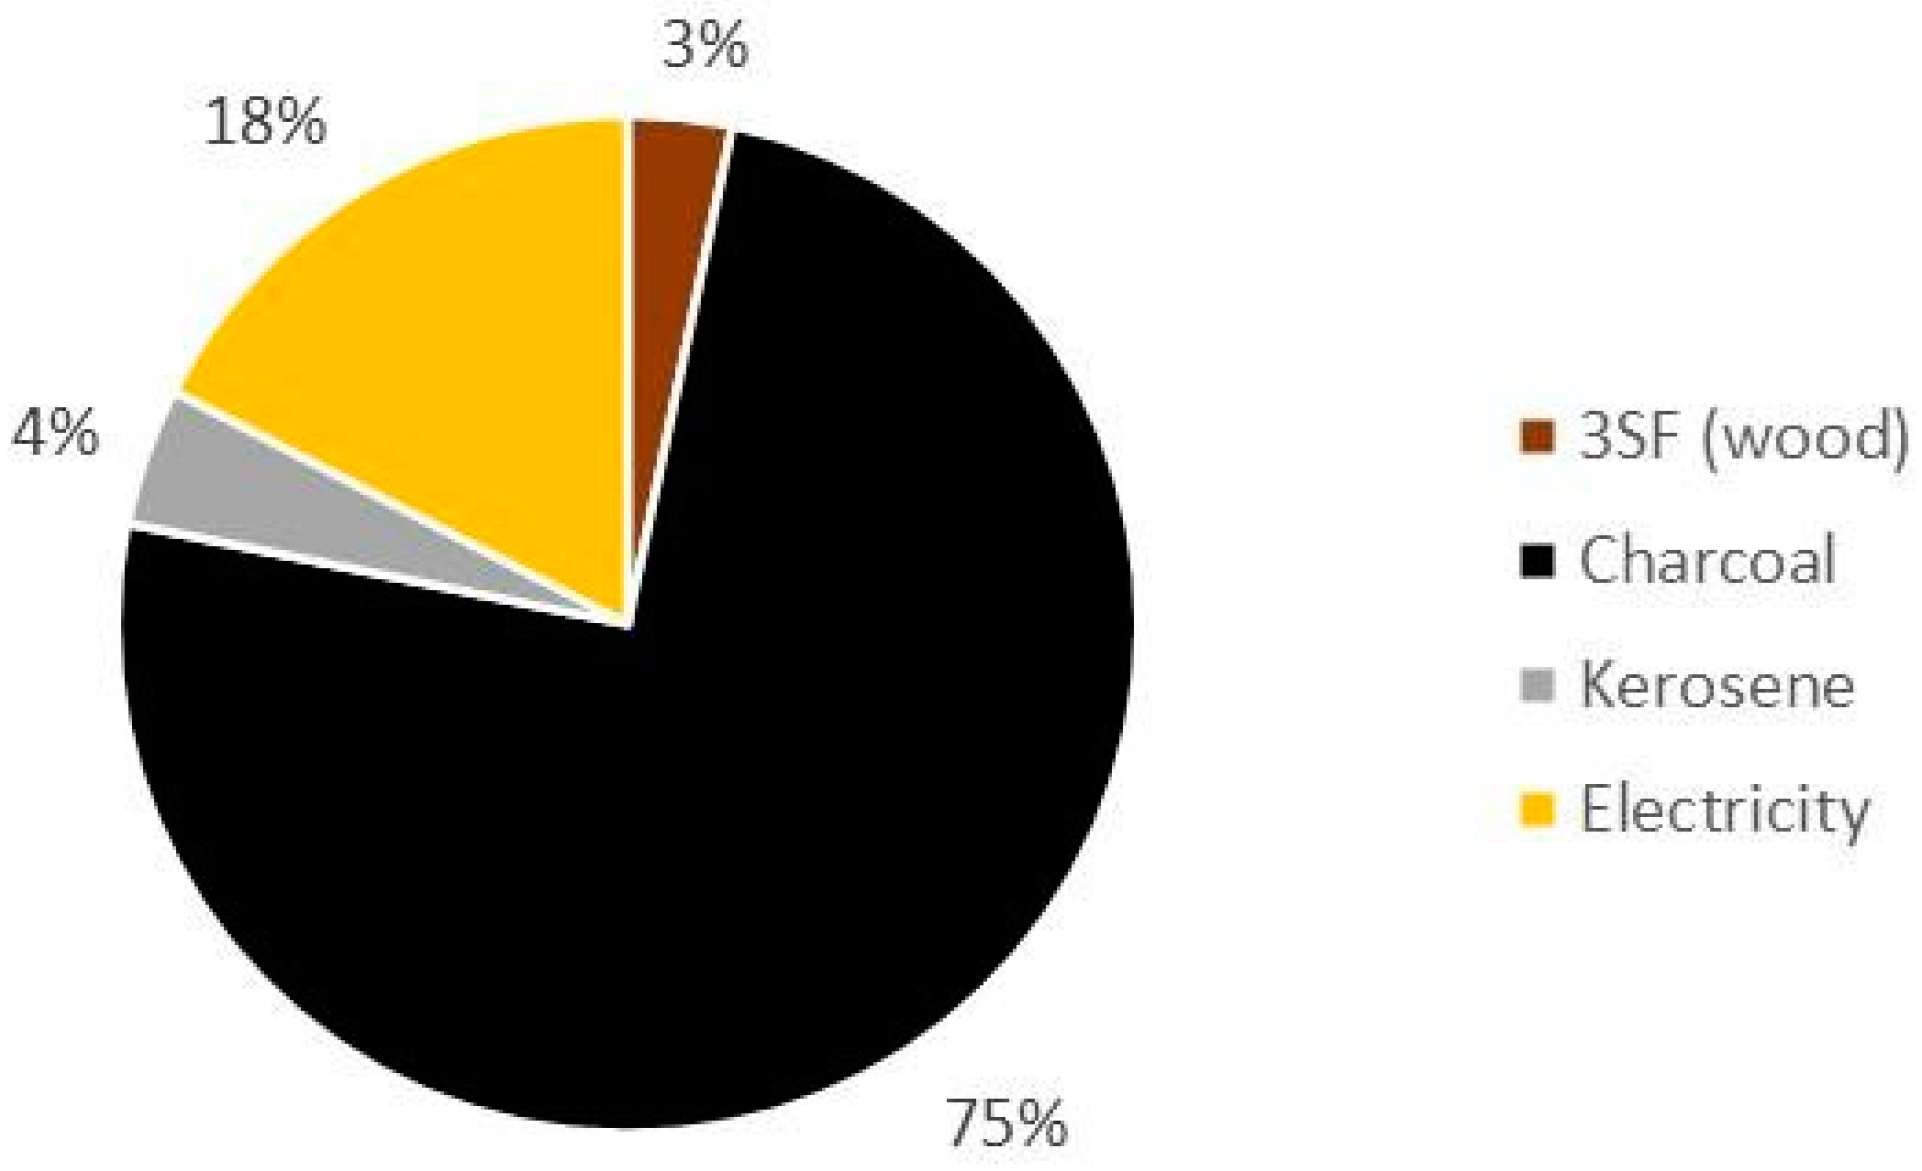
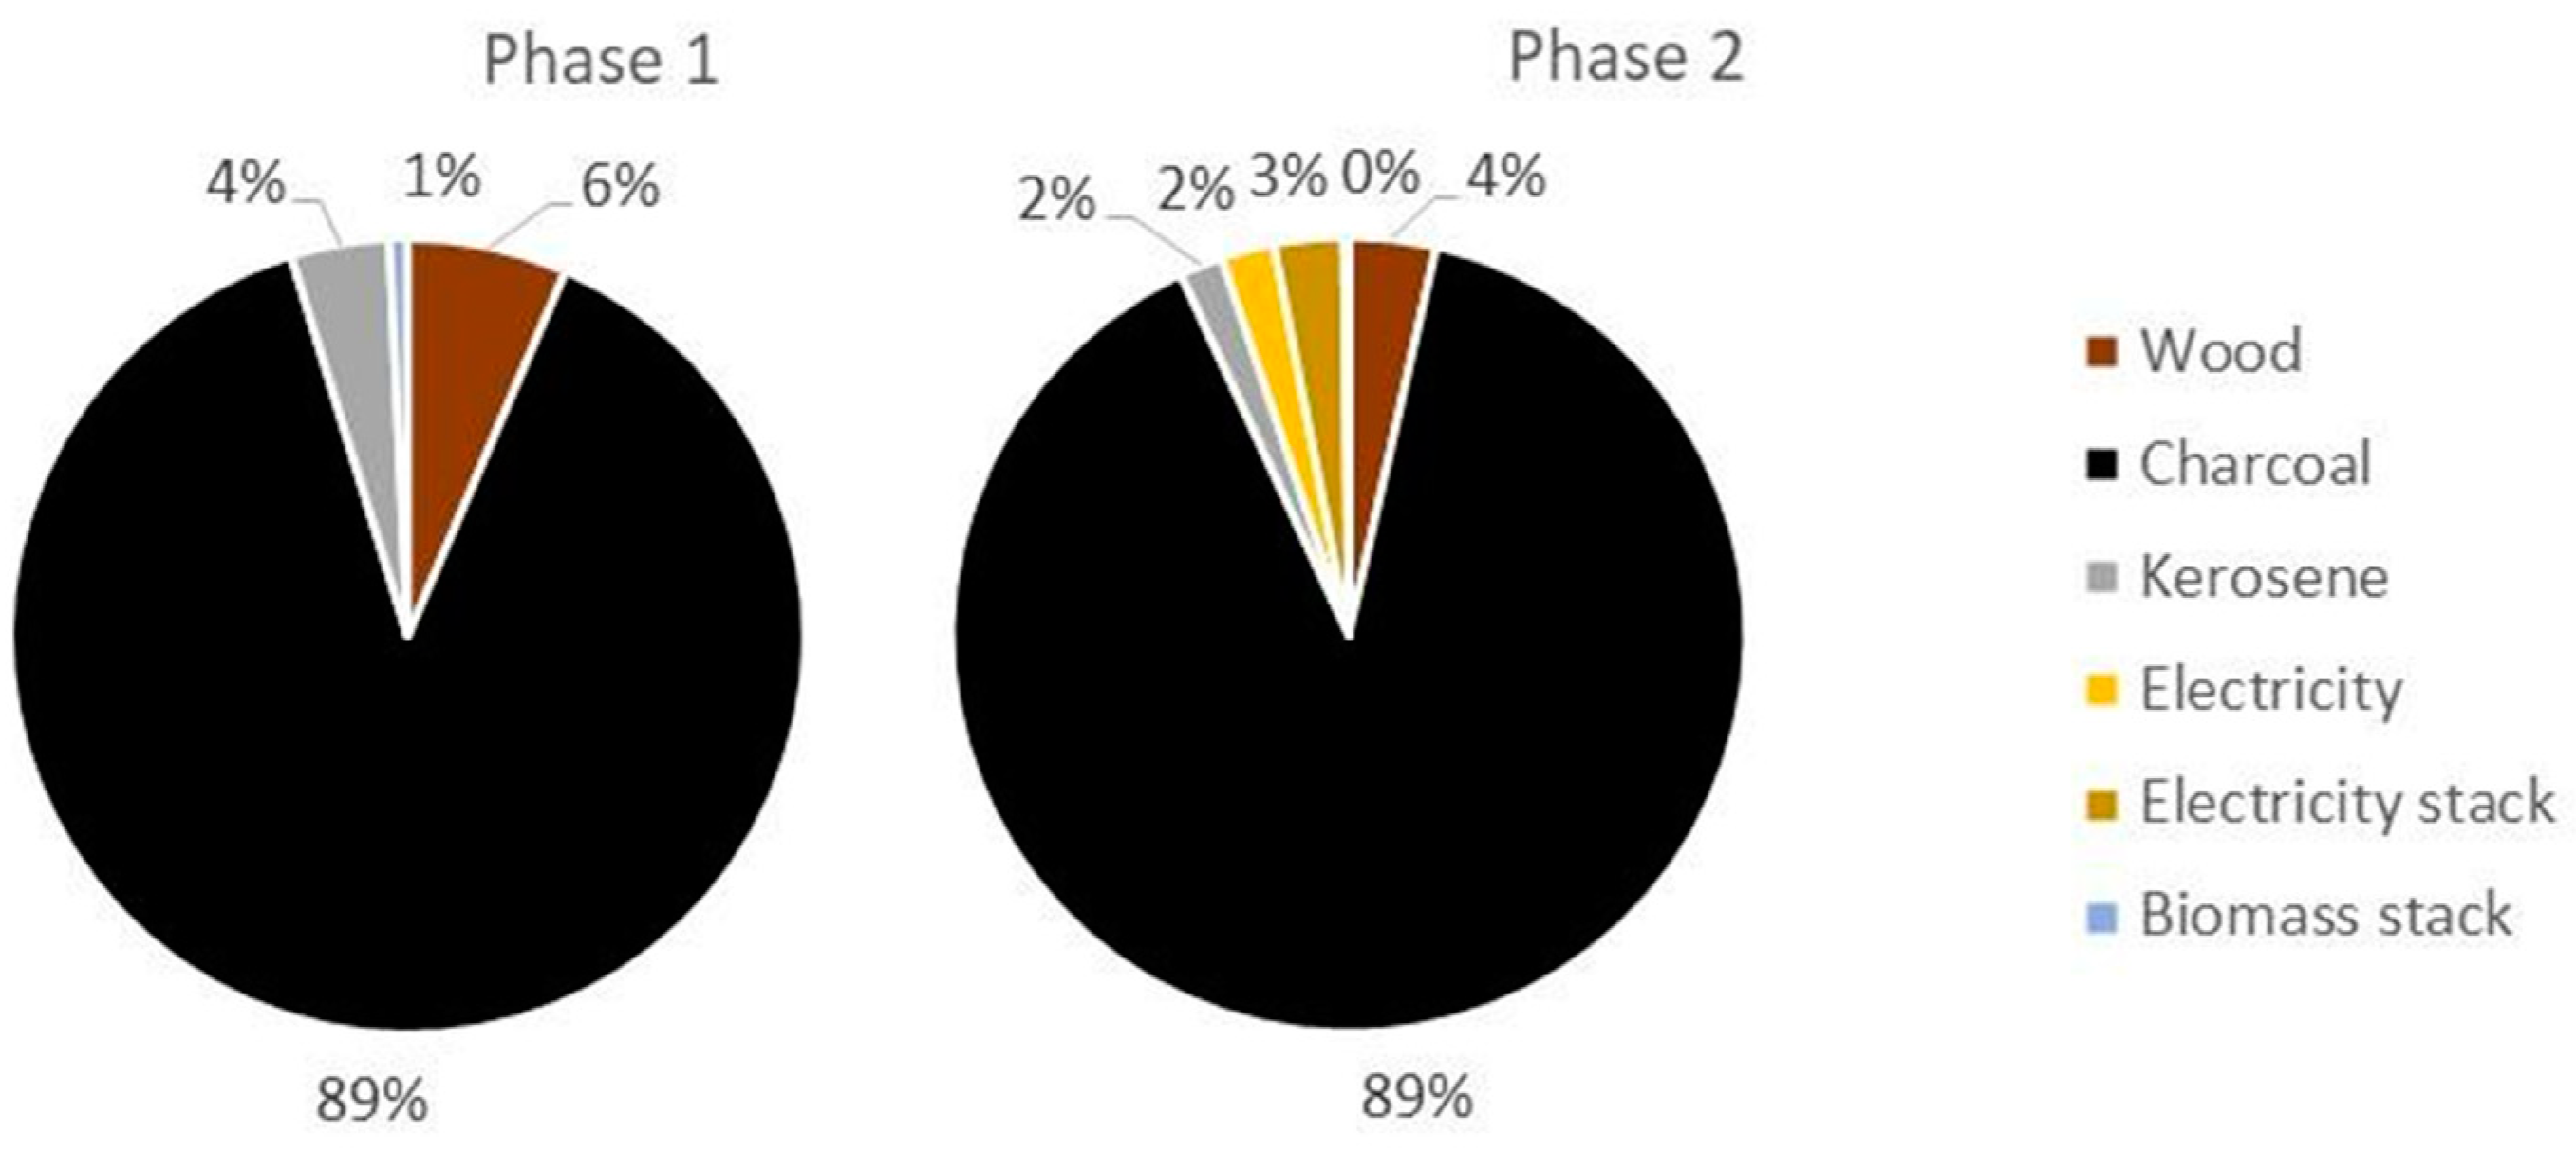
4.3.1. Fuel Usage
Across the two communities, charcoal was the dominant fuel of choice (
Figure 8). After the EPCs were introduced, charcoal remained dominant, but people made less use of kerosene and wood. In most of the records in which an EPC was used (57%), it was stacked with a biomass fuel. Further investigation is required to determine whether this reflects an inability to cook certain dishes in an EPC or a preference to cook multiple dishes simultaneously.
Over the extended period of EPC use until the end of 2020 (Phase 2 and Phase 3), EPCs did appear to displace more charcoal in the fuel mix even though charcoal remained dominant (see
Figure 9).
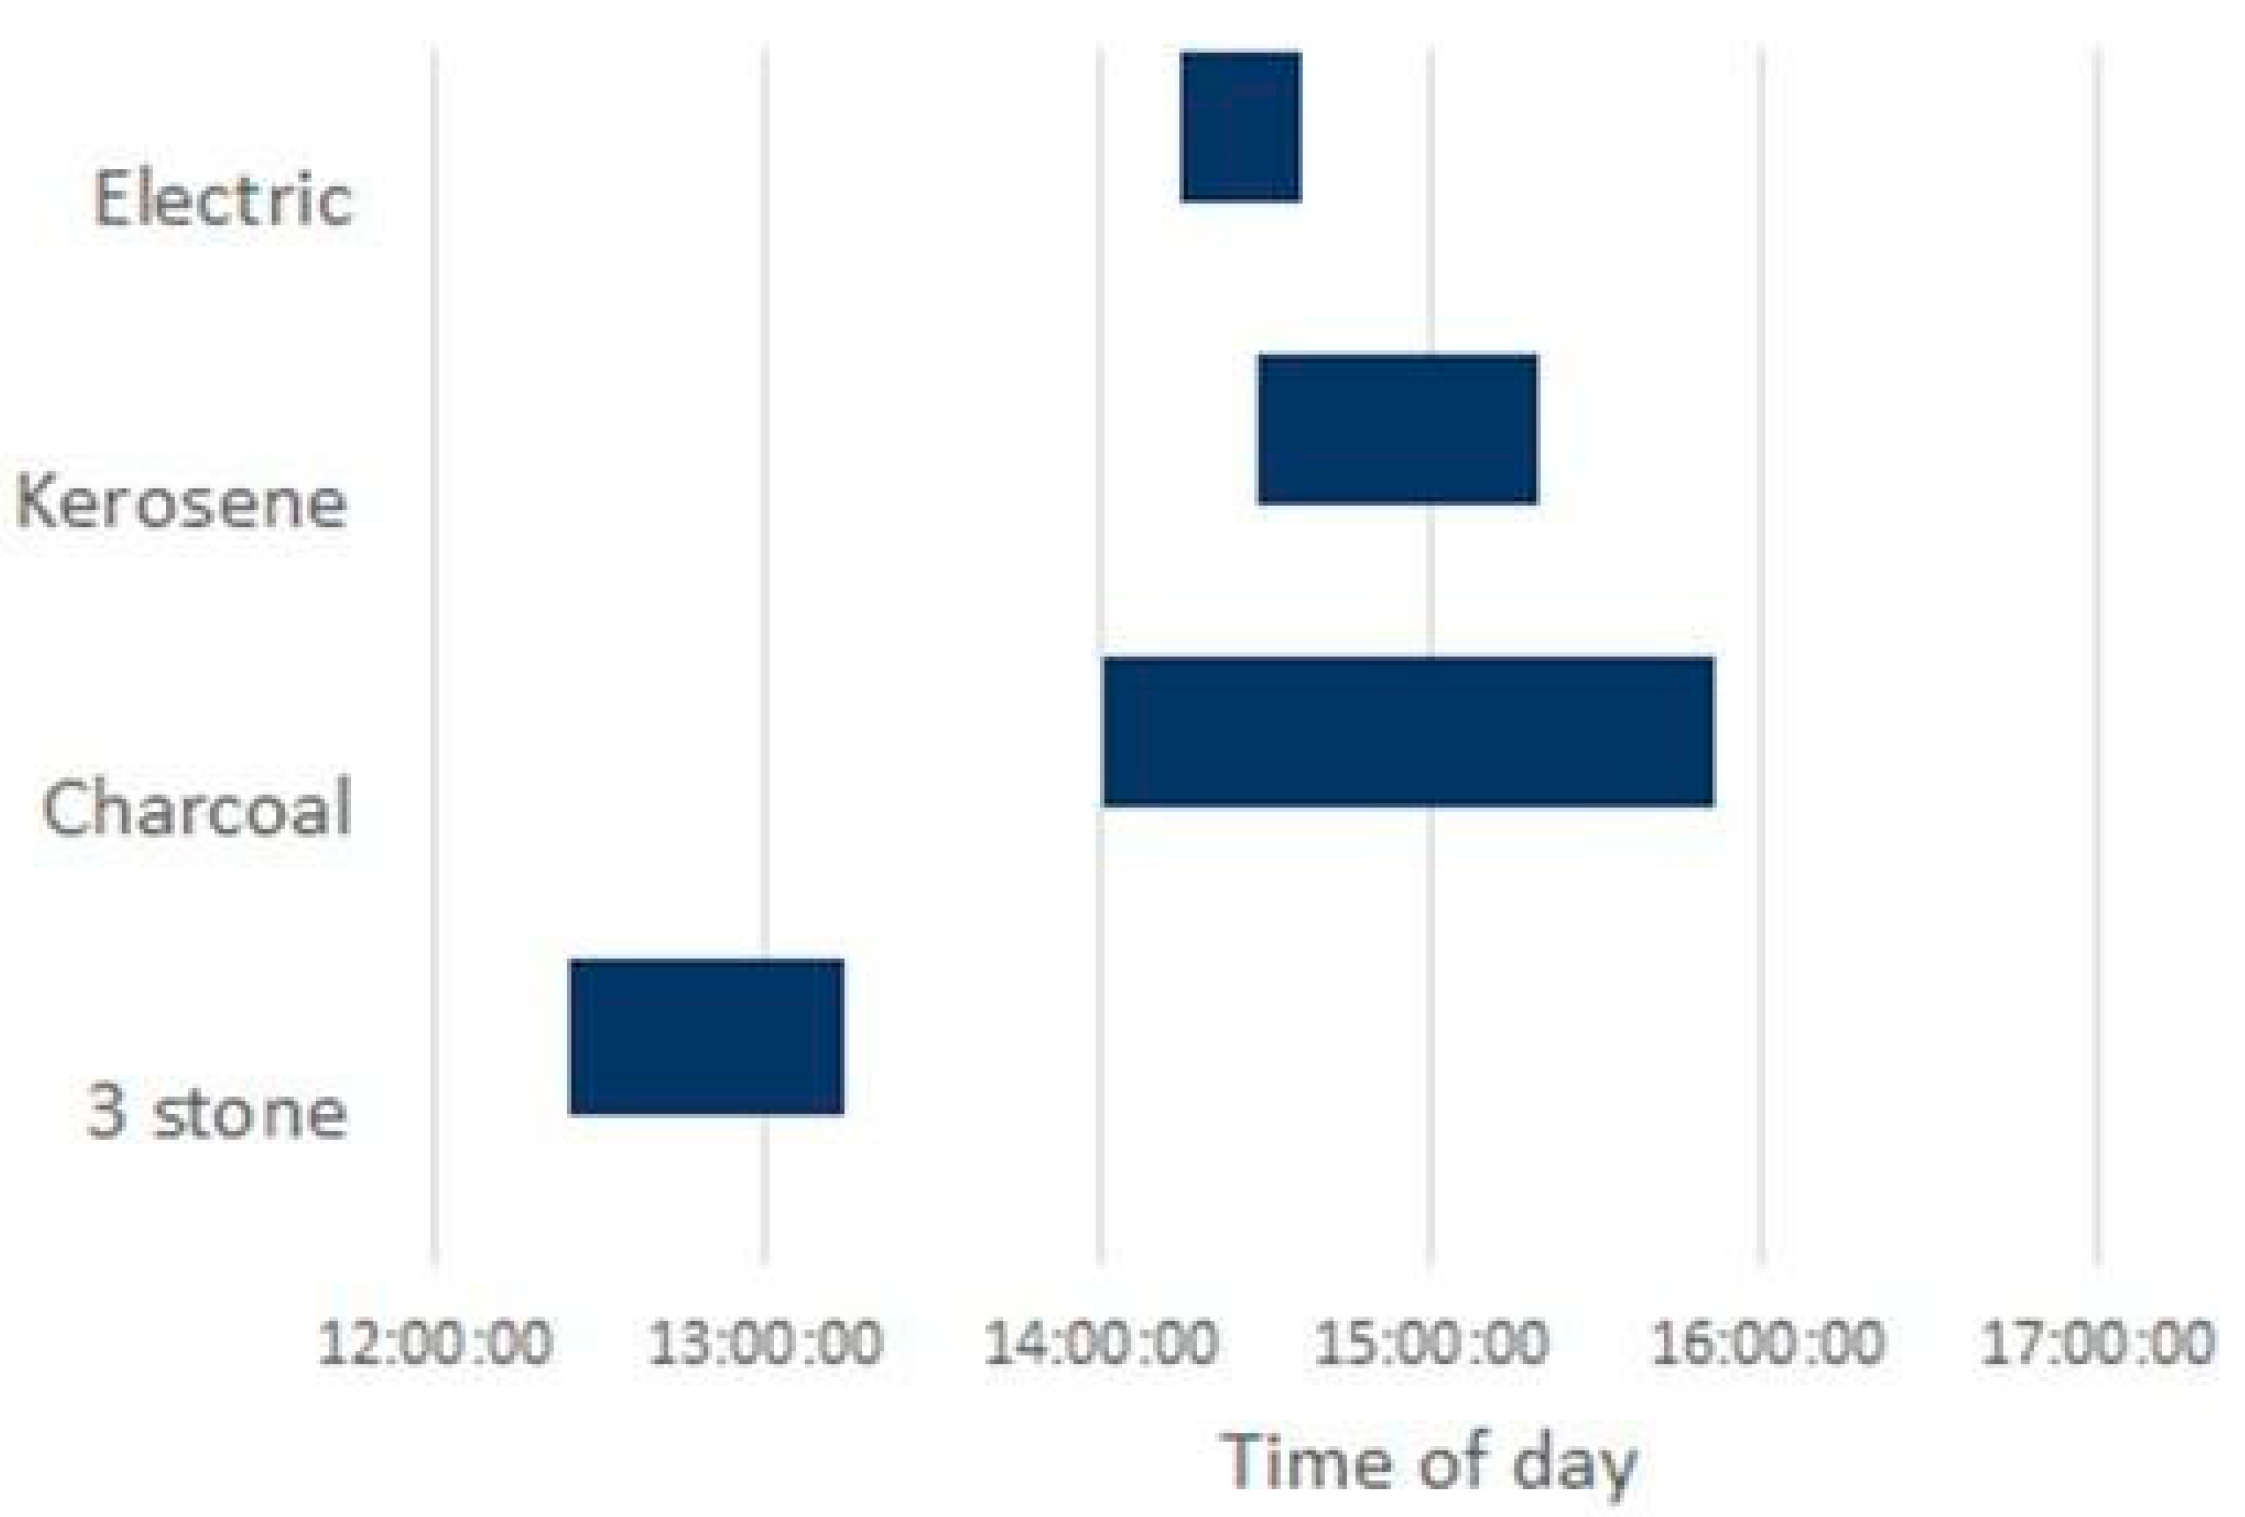
The limited data from the cooking diaries dataset showed that in 57% of the heating events where an EPC was used, it was stacked with another fuel. The smart meter and Stovetrace datasets, which cover a longer time period, have been combined and suggest similar patterns of use. However, understanding stacking requires Stovetrace events and EPC events to be aligned and matched up so that each event can be flagged as a stacking event or not. This is not straight forward, as traditional stoves tend to be lit in advance of cooking, whereas electric and kerosene devices can be turned on immediately before cooking, as illustrated in
Figure 10. This is a topic for further research.
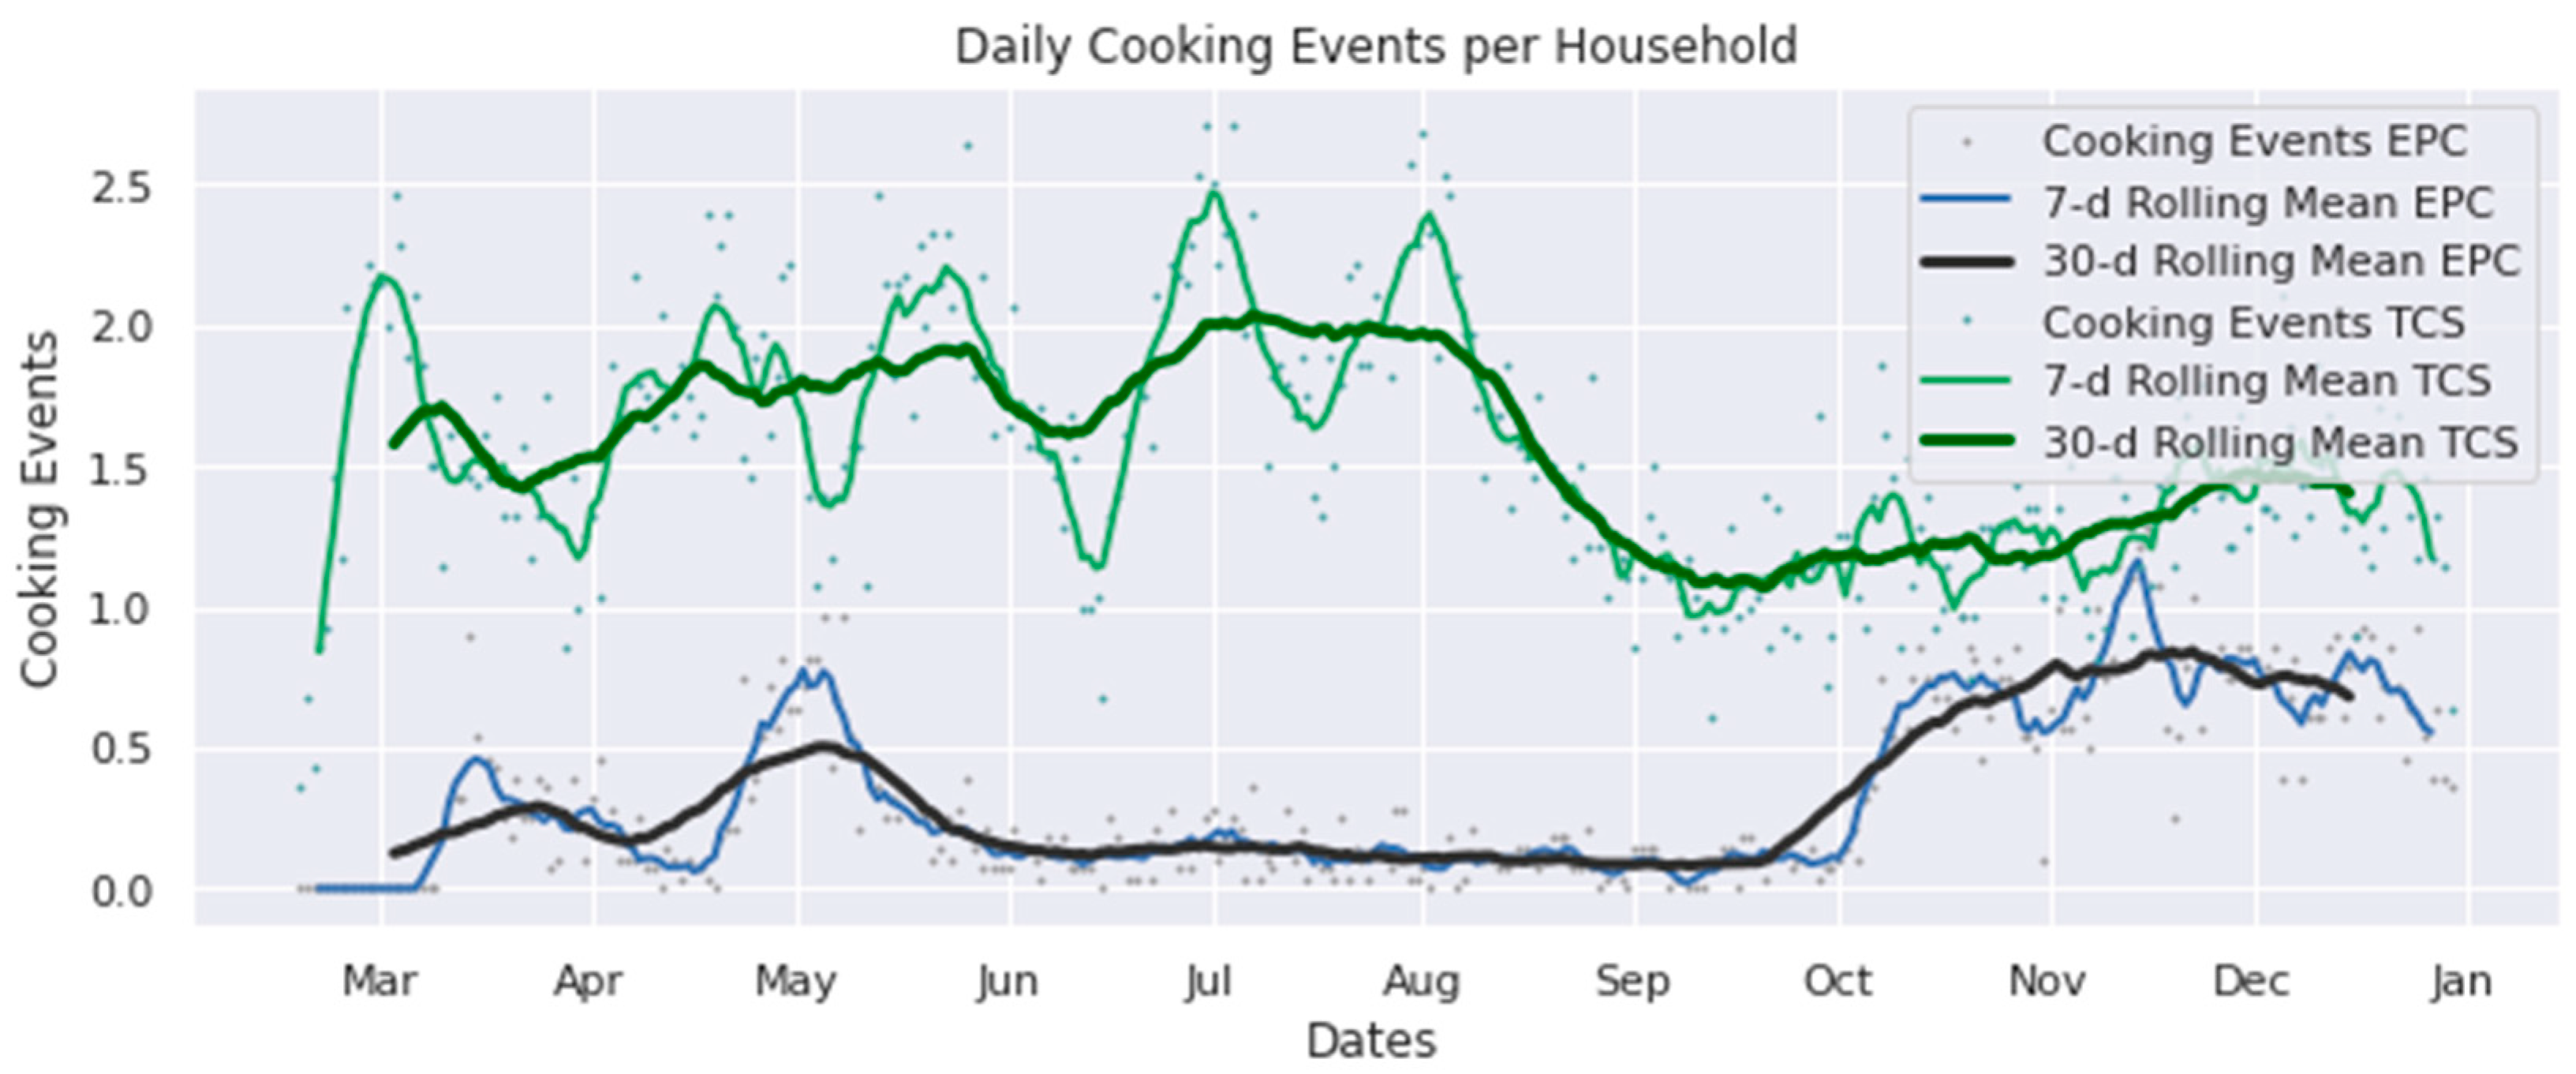
4.3.2. TCS Usage
The mean number of times both that both TCS and EPCs are used in each day in the period up to end December 2020 are presented in
Figure 11. The seven day rolling mean lines in this chart show occasions in May and then occasions from October–December, when high levels of EPC use correspond to low levels of TCS use, suggesting a substitutional effect. The TCS seven day rolling mean line also illustrates variations in cooking practices. The daily number of cooking events appears to vary by approximately 0.7 events on an almost monthly basis. Summing the TCS and EPC 30 day rolling mean lines suggests that any seasonal variation in the total number of cooking events is relatively modest. Note there is a decrease in cooking events between August and September, which remains unexplained; it could, for example, reflect some seasonal variation, or abrupt changes in cooking patterns amongst a subset of households.
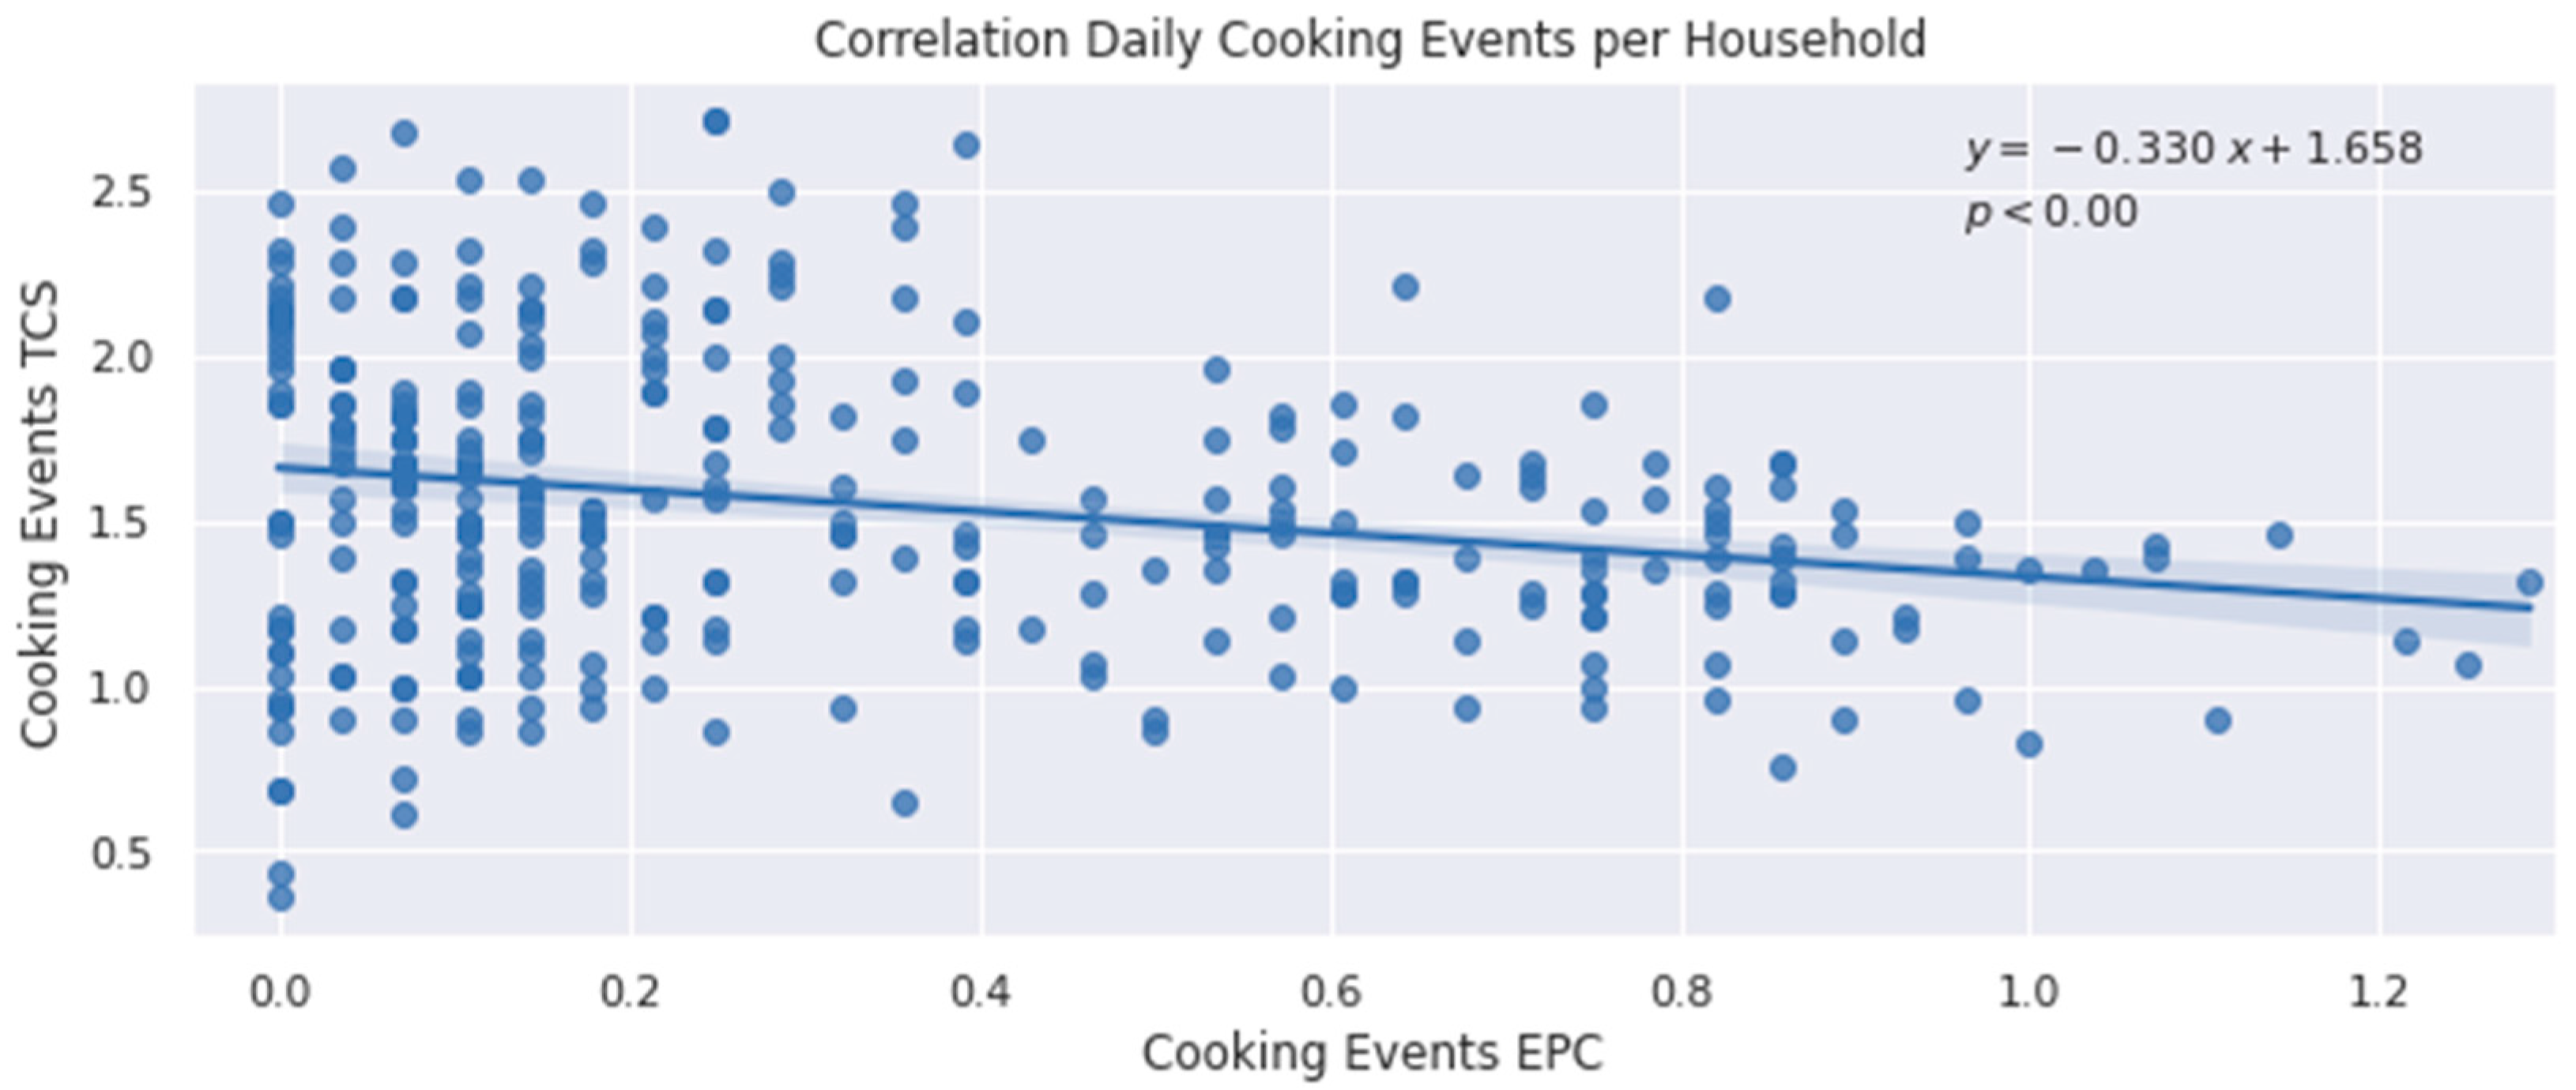
Plotting the event data from
Figure 11 on a scatter plot shows how the use of TCS declines on days when more use is made of the EPCs (see
Figure 12). The regression line indicates that, on average, one more EPC event results in 0.33 fewer TCS events. Note that the datasets covering an extended time period in
Figure 12 do not include comprehensive information on what the event is used for, so a single event could represent cooking a meal, or part of a meal (if stoves are stacked), or any other use, such as preparing a snack or heating water. The data also do not contain information on the number of dishes cooked in any one TCS event.
The slope of the regression line (−0.33) indicates that all of the EPC events in
Figure 9 (
n = 2964) will have reduced the number of TCS events by 980. In the absence of EPCs, the number of TCS events over the period would have been expected to be 15,020. The TCS events that were averted represent a 6.5% reduction in TCS usage across all households throughout the period (Phases 2 and 3).
4.4. Impacts of EPCs on Household Time and Fuel Savings
This section presents findings on how the introduction of the EPC impacted cooking time and fuel consumption in the household. The analysis focuses on understanding these impacts as possible benefits to the household, which may be important to policy makers, private sector organizations, and customers.
4.4.1. Time Saving
This section presents information on three categories of cooking times:
Dish Time: the time to cook individual items. The dish time was measured in the cooking diaries, which asked participants to note the times they started and finished cooking each dish and the type of stove used;
Daily Cooking Time: the average time a household cooked during a day. Cooking times were analyzed from the Stovetrace data set, which tracks the period of time over which a stove remains hot, and from the smart meter data set, which tracks the duration that an EPC was powered for;
Meal Preparation Time: the time it takes to cook a meal, which may consist of multiple dishes and may include other non-cooking tasks such as preparation. Meal preparation time was analyzed from the Cooking Diary dataset, which asked participants to note the time they started and completed preparing each meal.
The dish times for the 10 most commonly prepared dishes on both charcoal stoves and in EPCs are presented in
Table 11. This shows that cooking times are much shorter when using an EPC; cooking rice in an EPC saves 30% of the time to cook on a charcoal stove, and beans save 60% of the time taken to cook using charcoal.
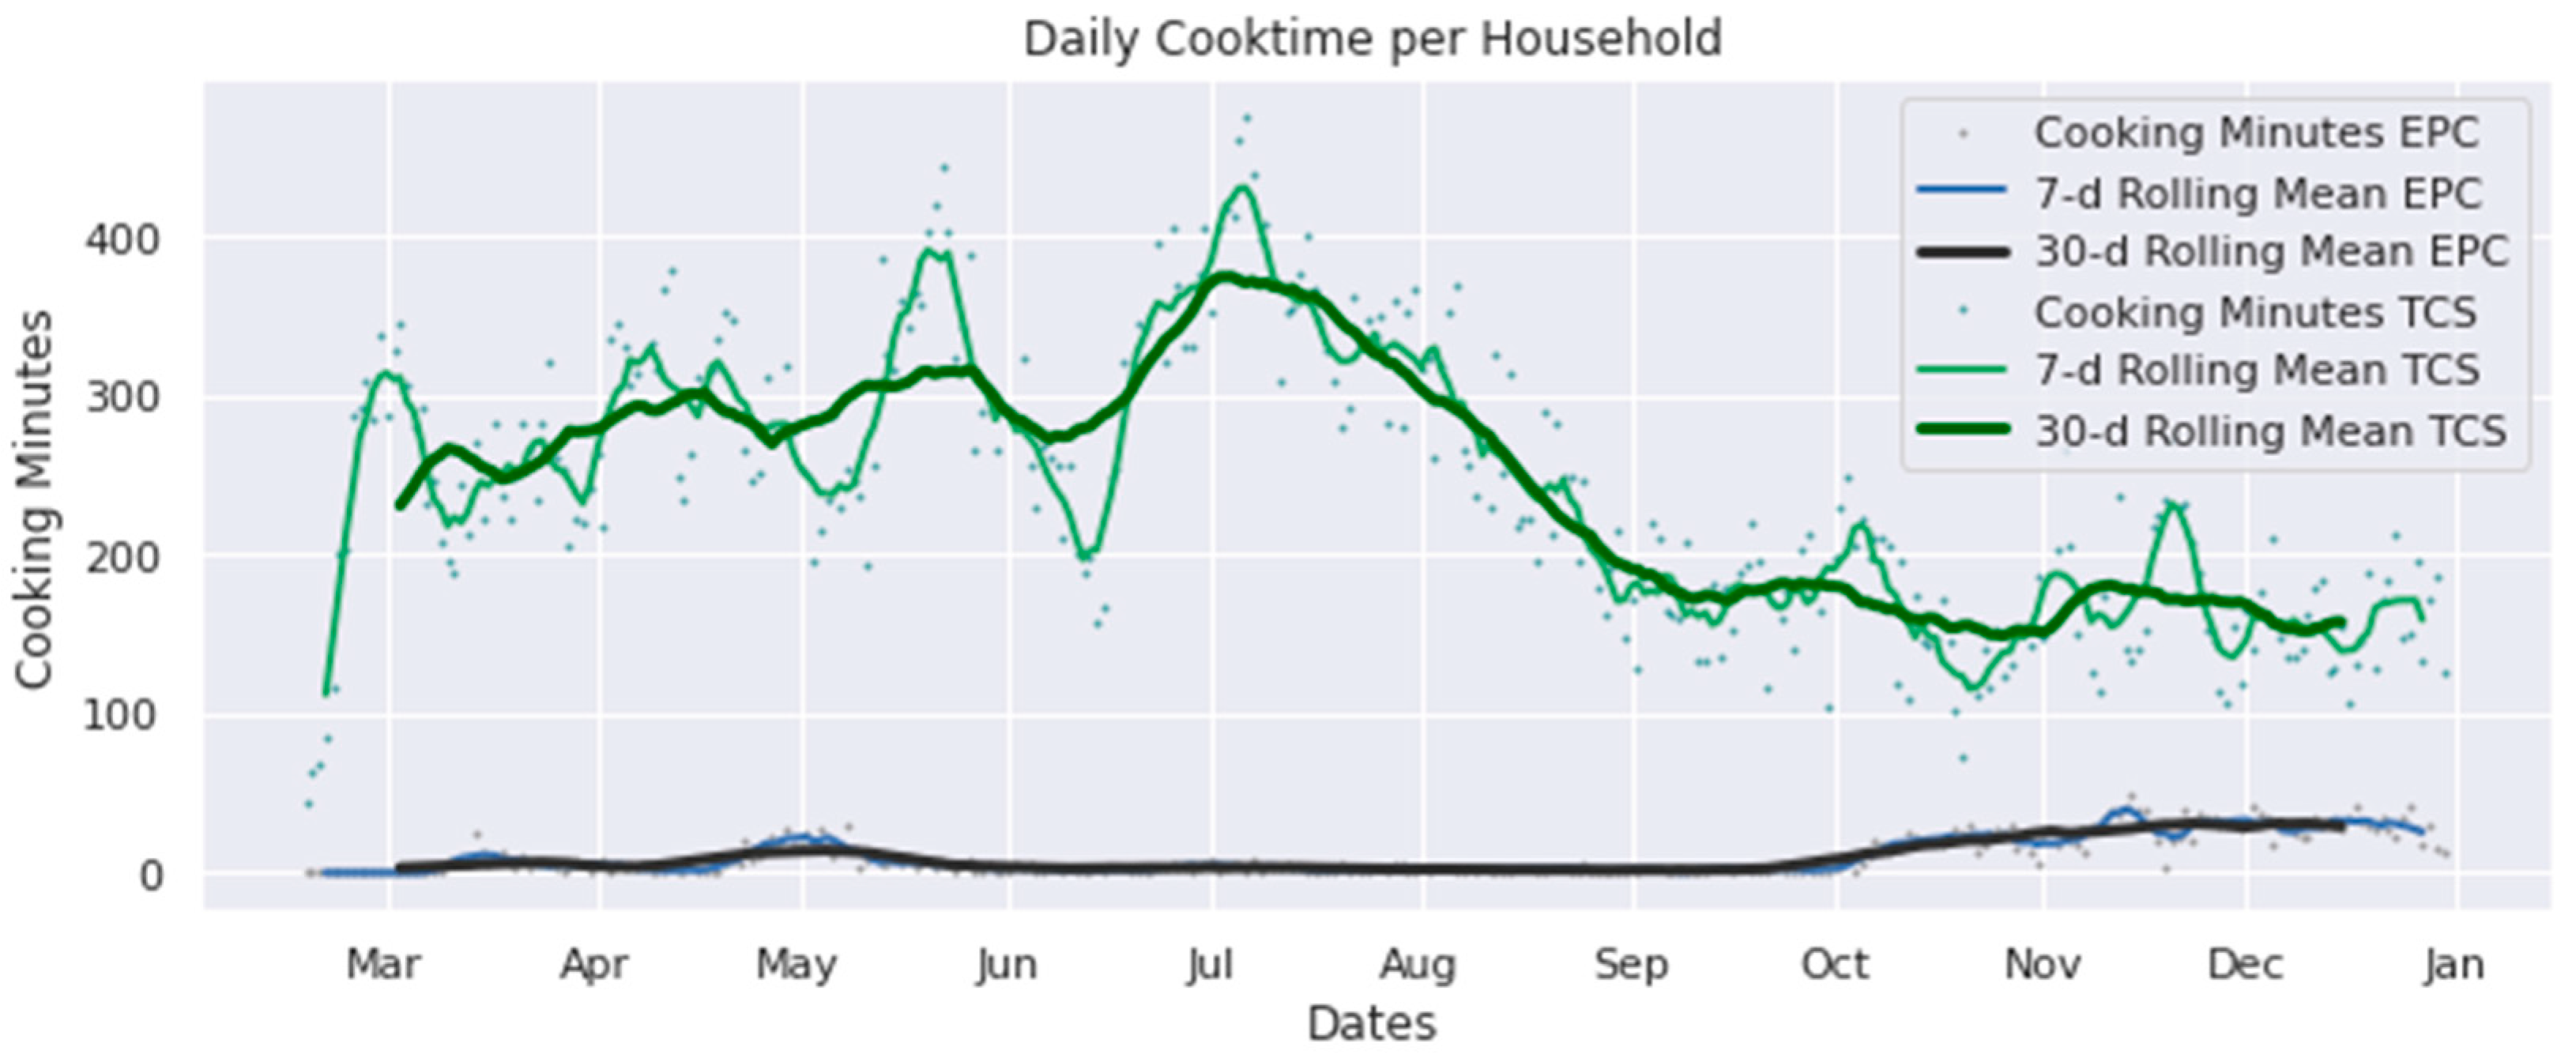
The daily cooking times for both TCS and EPC devices (summed across all events in a day) are presented in
Figure 13. Any complementarity between EPC and TCS use is harder to see in this chart than in
Figure 11 because the time duration of EPC heating events is an order of magnitude less than that for traditional stoves. Still, the increased use of EPCs during October to December can be seen to correspond with a drop in the mean duration of TCS use across all households.
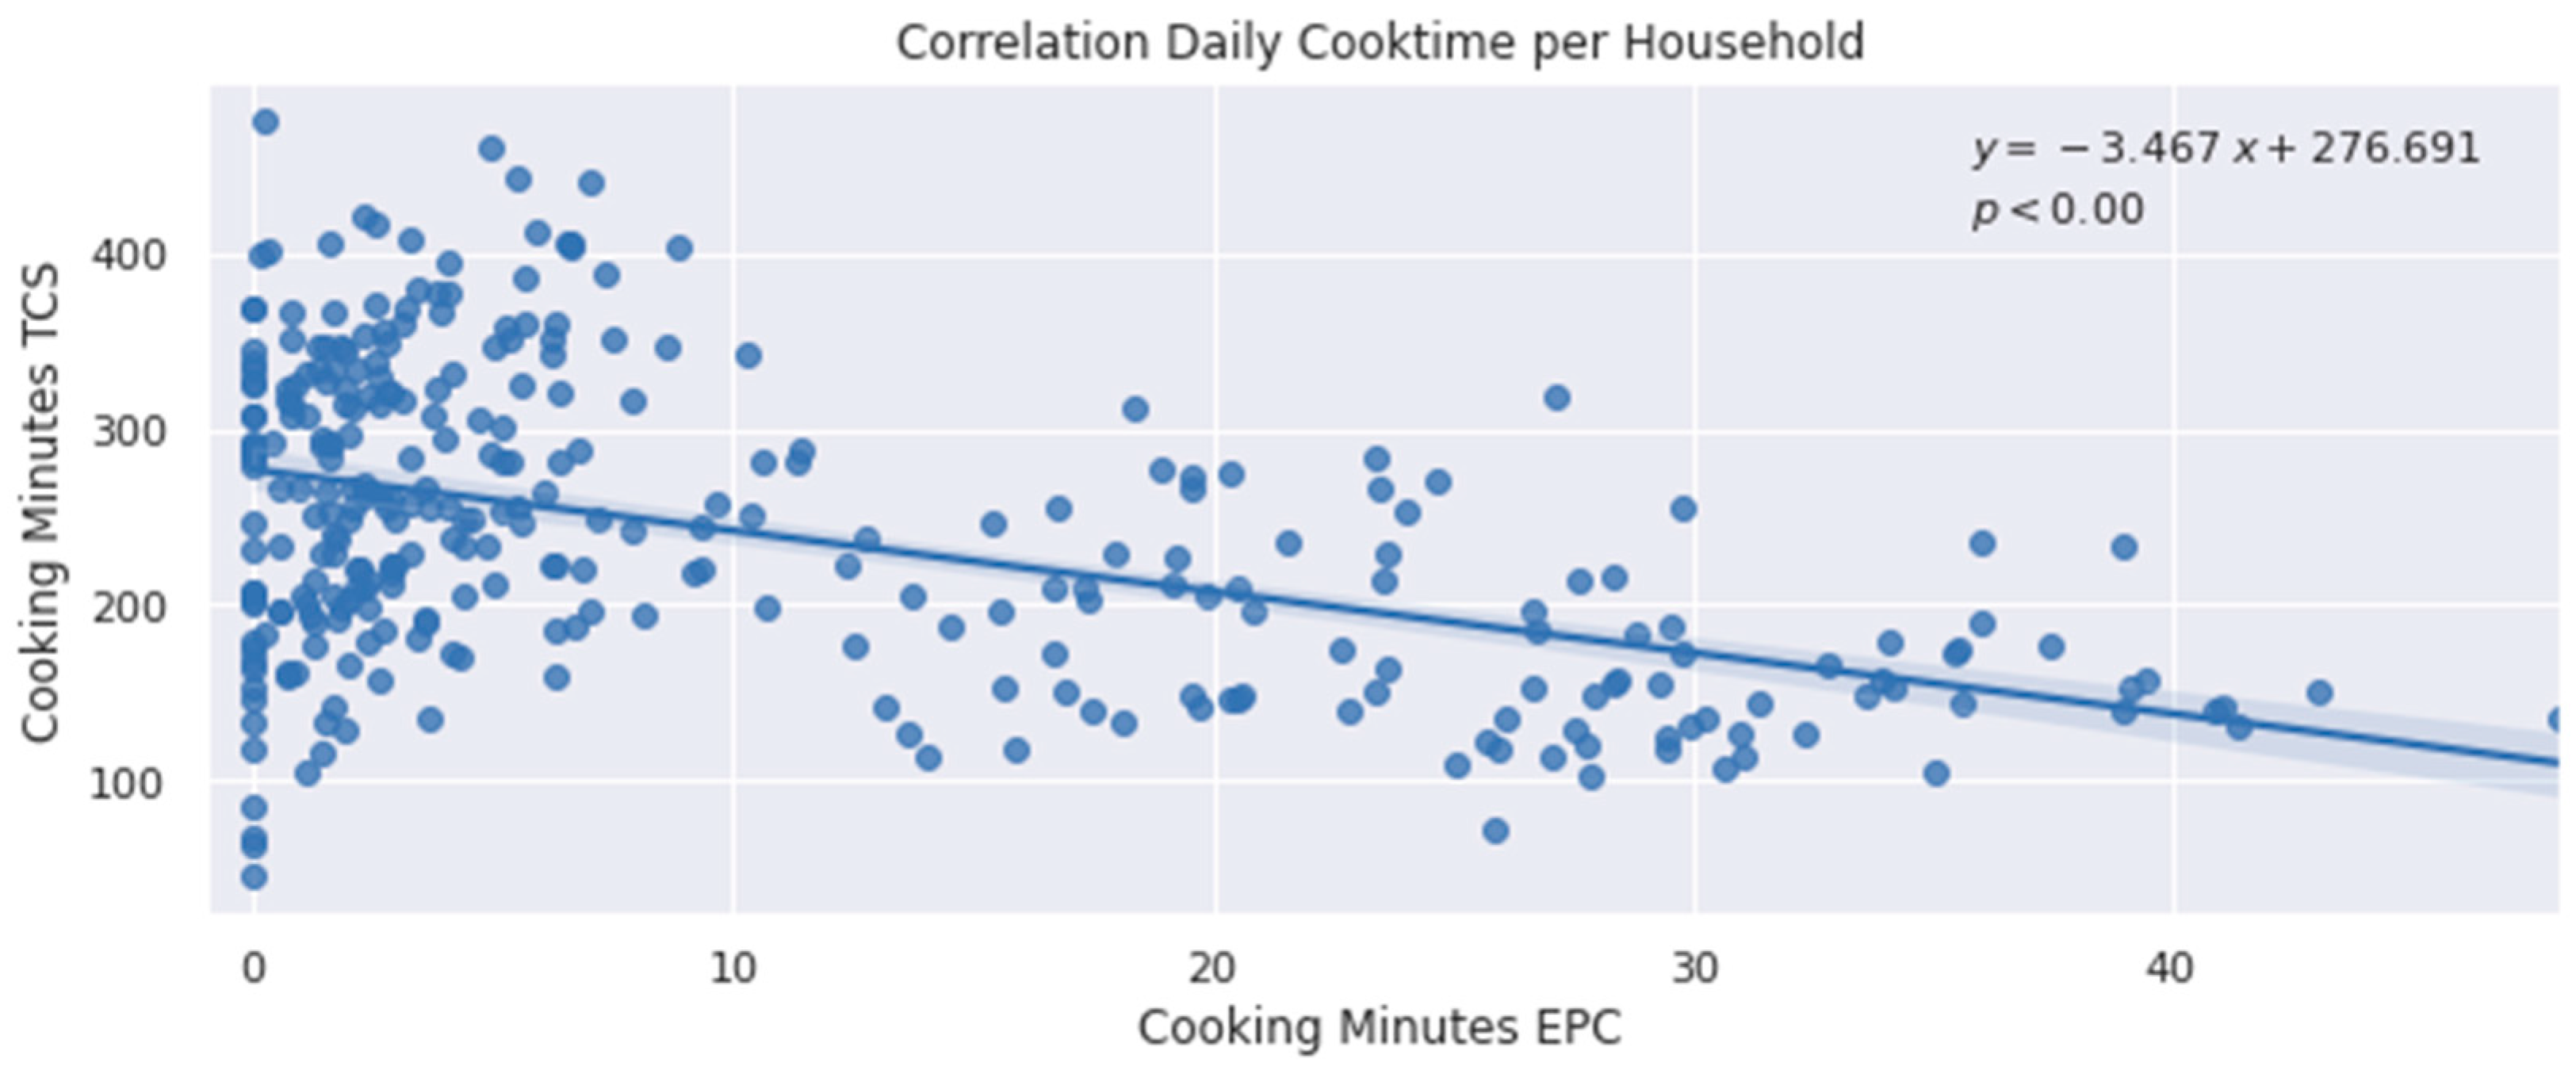
Plotting the cooking time data from
Figure 13 on a scatter plot shows that a TCS is used for less time on days when more use is made of the EPCs (
Figure 14). The gradient of the regression line indicates that for every minute that an EPC is used, 3.5 minutes of TCS use are saved.
The meal preparation time is not necessarily reflected in the time that a cooking device is operational. The total time spent preparing a meal is likely to be greater than the time that the EPC is switched on for (and recorded in the smart meter dataset); conversely, the total meal preparation time is likely to be less than the time that a TCS remains hot (recorded in the Stovetrace dataset).
The cooking diaries survey asked participants to note the time cooking activities started and the time that all of the activities finished. The mean figures presented in
Table 12 show a good deal of consistency in the overall time spent preparing meals when using a TCS in both Phase 1 and Phase 2, which was approximately 1 h and 40 min (mean). The table shows that there was no reduction in mean meal preparation time when an EPC was used (either on its own or stacked with a TCS).
Note that the mean figures are higher than the median times, indicating that there is a long tail of high meal preparation times. Median figures in the table can be argued to be more representative of most users and show that the median TCS meal preparation time was 1 h and 15 min (in both Phases 1 and 2). Median values indicate that using an EPC (either on its own or stacked with a TCS) reduces the overall meal preparation time by 9 min (12%).
Table 12 also suggests that overall meal preparation times can be halved when using an EPC exclusively, although this finding should be treated with caution because of the small sample size and differences in the dishes cooked in the EPC compared to TCSs.
4.4.2. Traditional Fuel Savings
During Phase 2 of the cooking diaries experiment, only 76 EPC events were recorded. In most of these instances, the EPC was stacked with another fuel (
n = 43).
Table 13 shows that when an EPC is used on its own (
n = 33), it uses a fraction of the energy of biomass fuels and it will substitute for all of the biomass fuel that would have otherwise been used (estimated at 4.7 MJ/person/event; see
Table 14). The figures in
Table 14 indicate that stacking an EPC with a charcoal stove reduces per capita consumption from 4.7 to 3.0 MJ/person/event, representing a 36% reduction in energy consumption.
Over the course of the study period, EPC use is estimated to have avoided 980 TCS uses (see
Section 4.3.2). Assuming a household size of six, this combines with the median per capita fuel consumption figure in
Table 14 to give an overall charcoal saving of over 900 kg (based on a calorific value of 29.9 MJ/kg).
It is perhaps more interesting to consider savings at the household level, which can be estimated by making assumptions on the number of meals cooked and combining that with the energy consumption figures in
Table 14. If a household of six is assumed to prepare three meals a day for 310 days per year (the remainder being days away from home), they would consume 880 kg of charcoal in a year (using charcoal only). However, if they used an EPC to prepare 20% of their meals (estimate derived from
Figure 9) and the EPC was stacked with their traditional charcoal stove for 60% of these meals (see
Section 4.3.1), then their total charcoal consumption would drop to 770 kg per year—a 12% saving.
This analysis highlights the potential impact of EPC adoption on biomass fuel consumption, along with related climate forcing emissions. These levels of reduction in biomass use are unlikely to lead to any substantial improvement in health. For example, charcoal and improved wood stoves can lead to PM2.5 exposure levels of 200–300 µg/m
3 (in a 24 h period) [
24]. High performance improved cookstoves can reduce this to 125 µg/m
3, but even this would reduce the health burden by only 20%. However, savings are based on average data from all households covering all three usage periods, so a sub-set of households that made more intensive use of EPCs will have achieved greater savings and may have made more substantial gains in household air pollution. This is an area for further research.
5. Discussion of Results
This research was motivated to investigate whether EPCs are socially acceptable, useful, technically feasible, and financially viable as a clean cooking solution for mini-grid customers.
Based on the study of meal composition, we found that EPCs are socially acceptable to users, as households continued to cook similar meals and dishes after the introduction of the EPCs. While this may be partially attributed to the relatively infrequent use of the EPCs during Phase 2, their frequent usage in the Low Tariff period suggests that the low use was related to cost rather than acceptability. Our findings align with the findings of other studies [
12], which found that users were able to integrate EPC usage into their cooking routines.
We also found the EPCs to be useful to households based on the analysis of time and fuel savings. In investigating cooking time, we found that cooking with the EPC reduced individual dish cooking time, total daily cooking time, and meal preparation time. If an EPC is used for an average of 25 min, it will reduce TCS operational time by an average of 88 min (based on the gradient in
Figure 13). Analysis showed that cooking with an EPC reduces meal preparation time by 12%. In investigating fuel consumption, we found that although households continued to cook with biomass fuels and TCSs, they still benefitted from a reduction of charcoal usage. Each use of an EPC does not result in a one-to-one reduction in TCS use; rather, each time an EPC is used, an average of one third (33%) of a TCS use is avoided. Stacking an EPC with a charcoal cookstove reduces charcoal usage by 45% (compared to using charcoal alone). Reductions in traditional fuel use may also yield associated time, fiscal, and health benefits to the household. Further, through the analysis of the cooking diaries, we found that the EPC was particularly useful for specific meals and dishes: the EPC was favored for dishes such as beans and was often used for quickly heating water for tea in the mornings. These findings are consistent with other research [
11,
12], which found that users benefitted from time, labor, and sometimes cost savings. These findings can be emphasized when introducing EPCs to new populations of users to accelerate the acceptance of the appliance.
Over the study period, we found few technical issues with operating the EPC on the different mini-grids, with neither the households nor the mini-grid providers encountering challenges during the adoption of the appliance. However, it was observed that EPC use was reduced in December due to power cuts, when it was no longer financially viable for the mini-grid to operate the back-up generator. The degree to which a mini-grid may be technically impacted by electric cooking will depend on a balance to be struck between the user demand for electric cooking and electricity prices and revenues to the developer.
Our findings on the financial viability of mini-grid customers cooking with EPCs on solar mini-grids are inconclusive. We found that under high tariffs, cooking with an EPC was not cost-effective for many households, resulting in low use. However, under a low-tariff, the EPCs were used extensively, but this tariff regime was not financially viable for the mini-grid. More evidence is needed to understand if there is a price point that is acceptable for all parties. Further research on this topic should consider how the specifics of pilot studies may or may not be applicable to other contexts. In this study, the mini-grids generated power from small-scale solar arrays and were serving rural, low-income households, many of whom cooked with fuelwood; electric cooking may still be viable on other types of mini-grids or with different population segments. While other research [
11] found that the introduction of EPCs on similar mini-grids resulted in increased household energy consumption, our analysis of EPC adoption shows that studies with shorter research periods may be susceptible to drawing conclusions prematurely. Initial adoption behavior may be characterized by novelty, and such user behavior may not be sustained over longer time periods, as shown by the observed Honeymoon period in our pilot. Studies that investigate the market demand for EPCs or other electric cooking appliances should consider having study periods of 6 months or longer so that users can become sensitized to the costs and benefits of the appliances. The financial viability of electric cooking may be improved if the health or environmental benefits of electric cooking can be monetized and paid by a third party, such as a carbon credit financing scheme. More research is needed to quantify the impacts of electric cooking adoption on health and the environment.
6. Conclusions
Enabling universal access to clean cooking fuels and technologies is an essential element of Sustainable Development Goal 7, alongside enabling universal access to electricity. Our research shows that both sides of this goal are complementary: after households gained access to electricity through a decentralized utility (mini-grids), they then demonstrate interest in using electricity for cooking, which reduced their usage of TCSs and traditional fuels. The study showed that EPCs were technically and socially acceptable in the context of rural Tanzania, where the majority of meals comprised only one or two dishes. Further research is required to understand the acceptability of EPCs in other contexts with more complex cooking practices.
A coupled approach to electricity and clean cooking access must consider the financial viability of combining the two or risk achieving neither. Different EPC usage rates in the three adoption periods demonstrate that the cost of electricity is a key determinant of EPC usage, which was the highest during a reduced tariff period that was ultimately unsustainable for the mini-grid developer. In order to contribute to the SDG 7 goal of providing access to electricity and clean cooking in some of the most remote communities, greater emphasis must be placed on how to reduce costs and improve affordability. Further research on this topic should focus on understanding supply and demand for electric cooking at different price points, mechanisms for externalizing costs, and innovations for reducing costs for energy delivery in remote areas.


