
Heat Transfer Analysis in Supercritical Hydrogen of Decoupled Poisoned Hydrogen Moderator with Non-Uniform Heat Source of Chinese Spallation Neutron Source

 , , and
Abstract
:1. Introduction
2. Mathematical and Physical Model
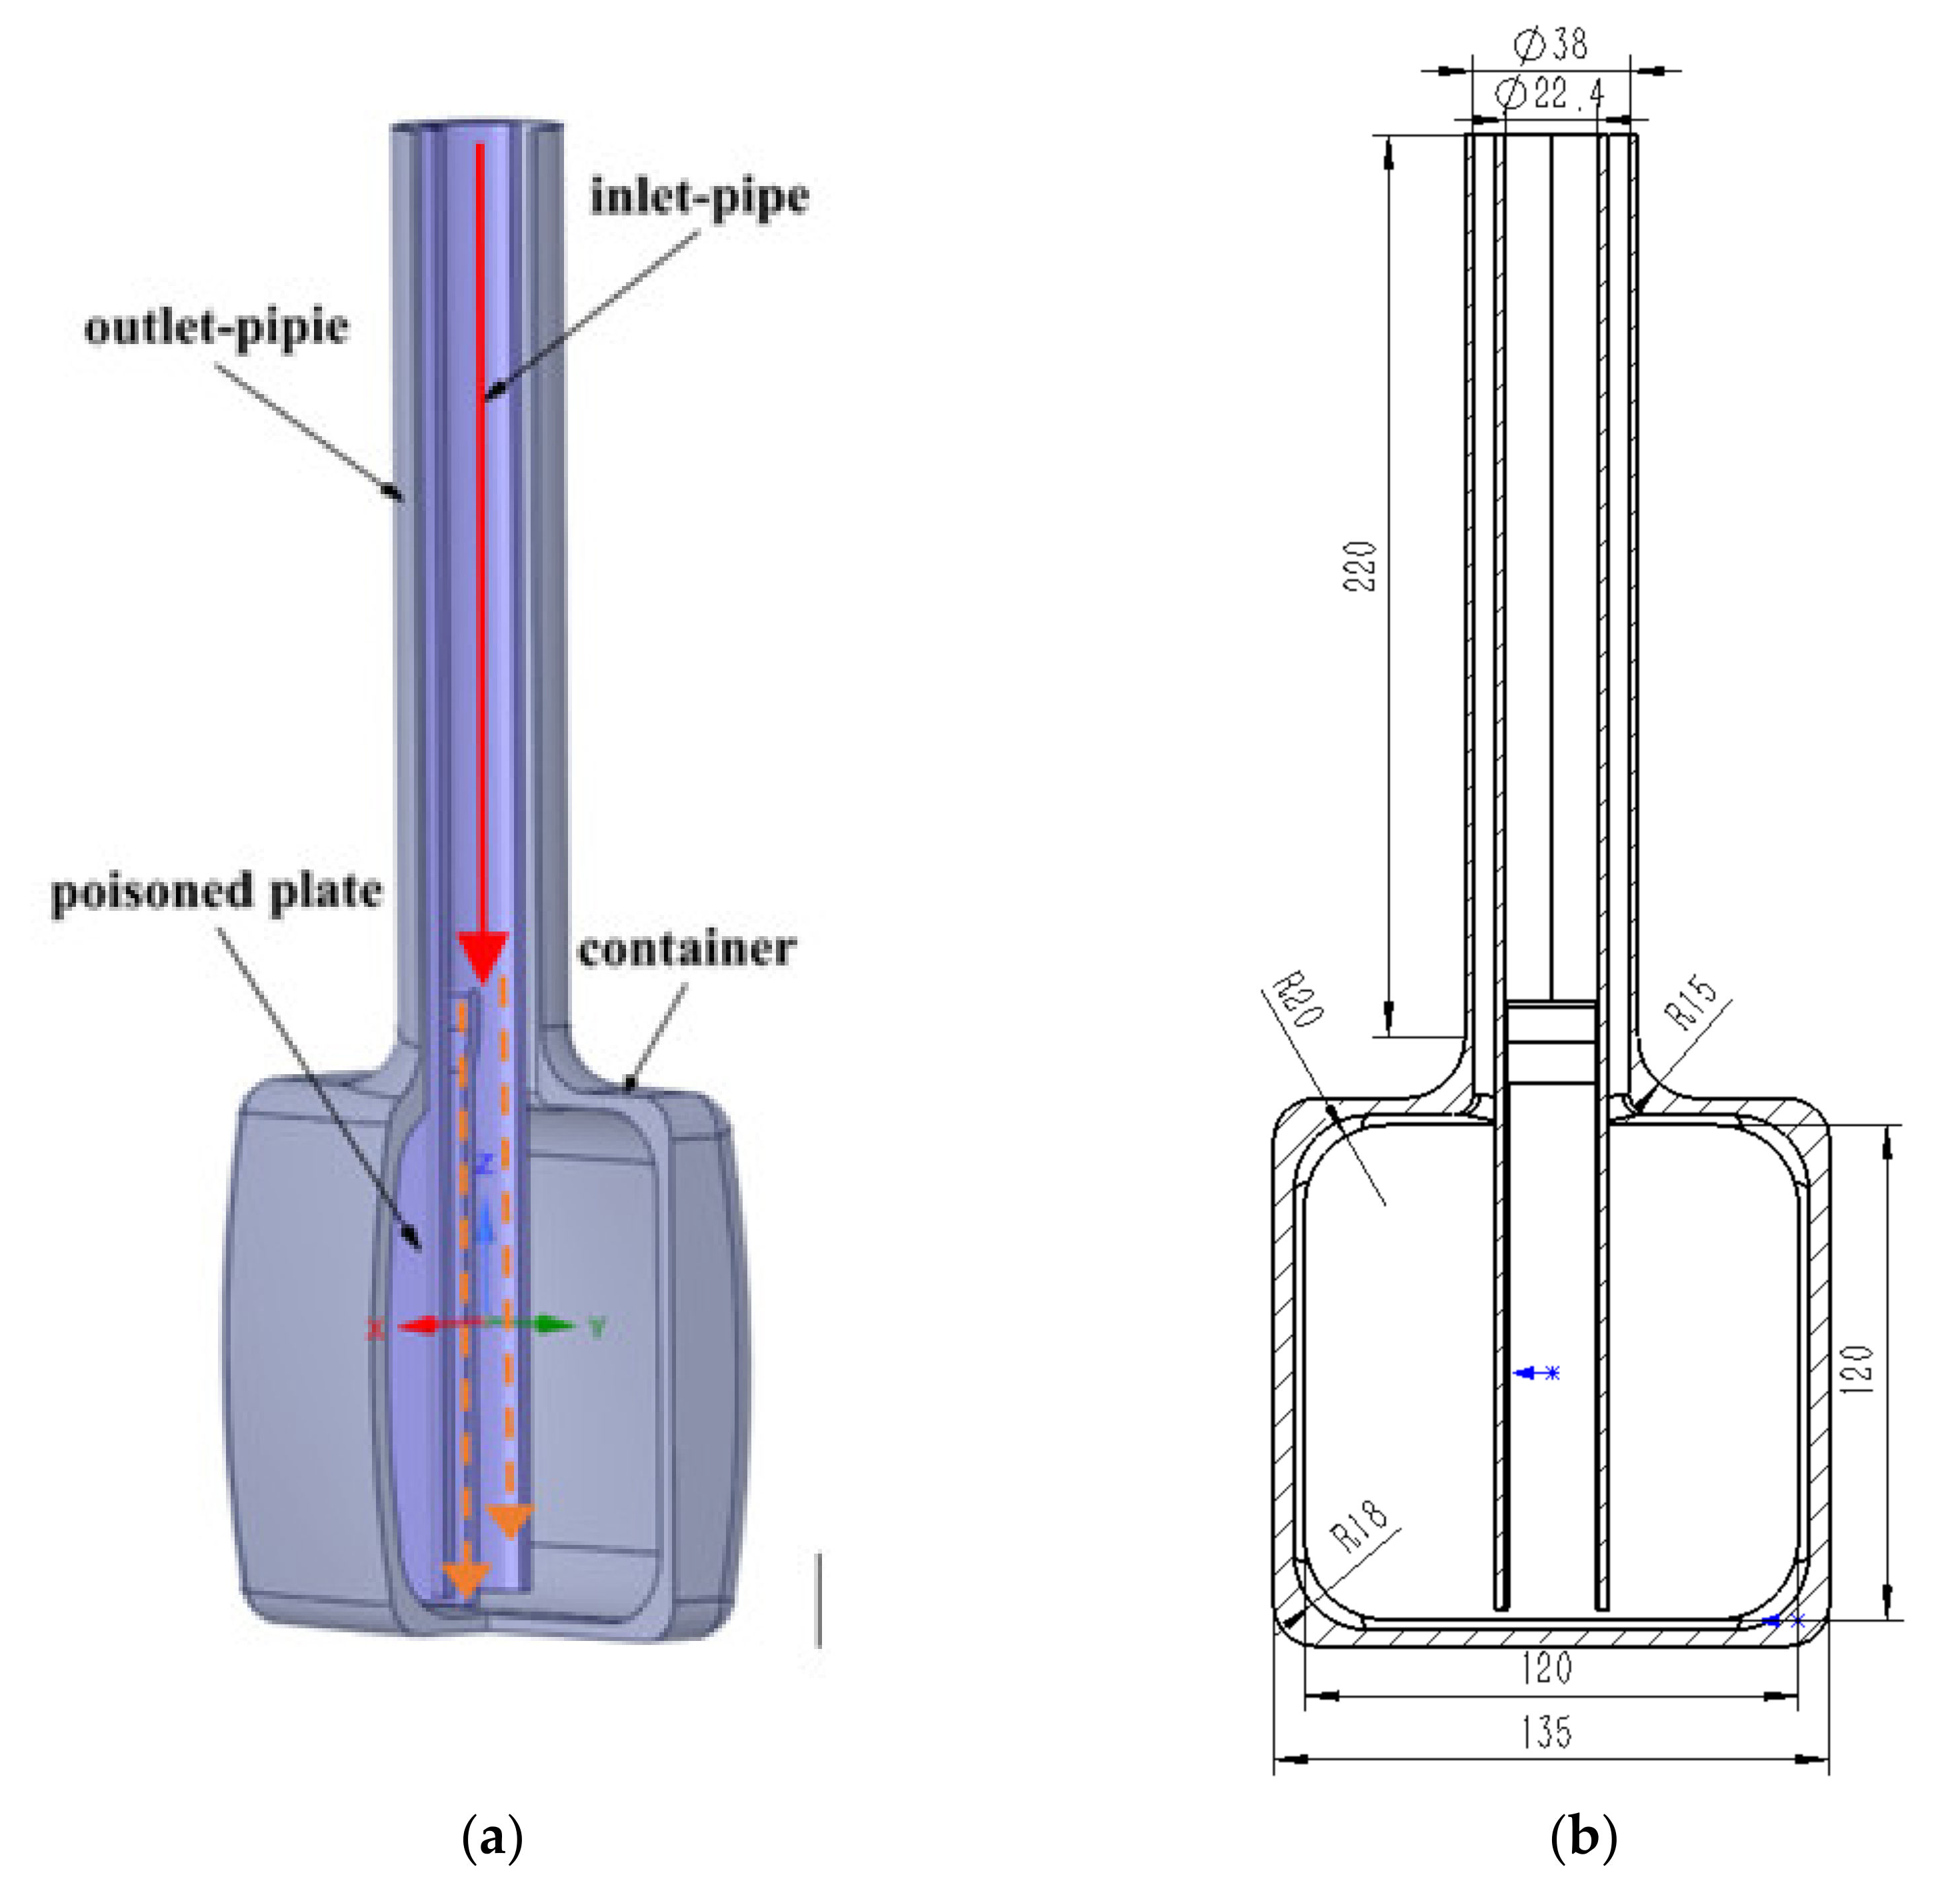
2.1. Physical Model
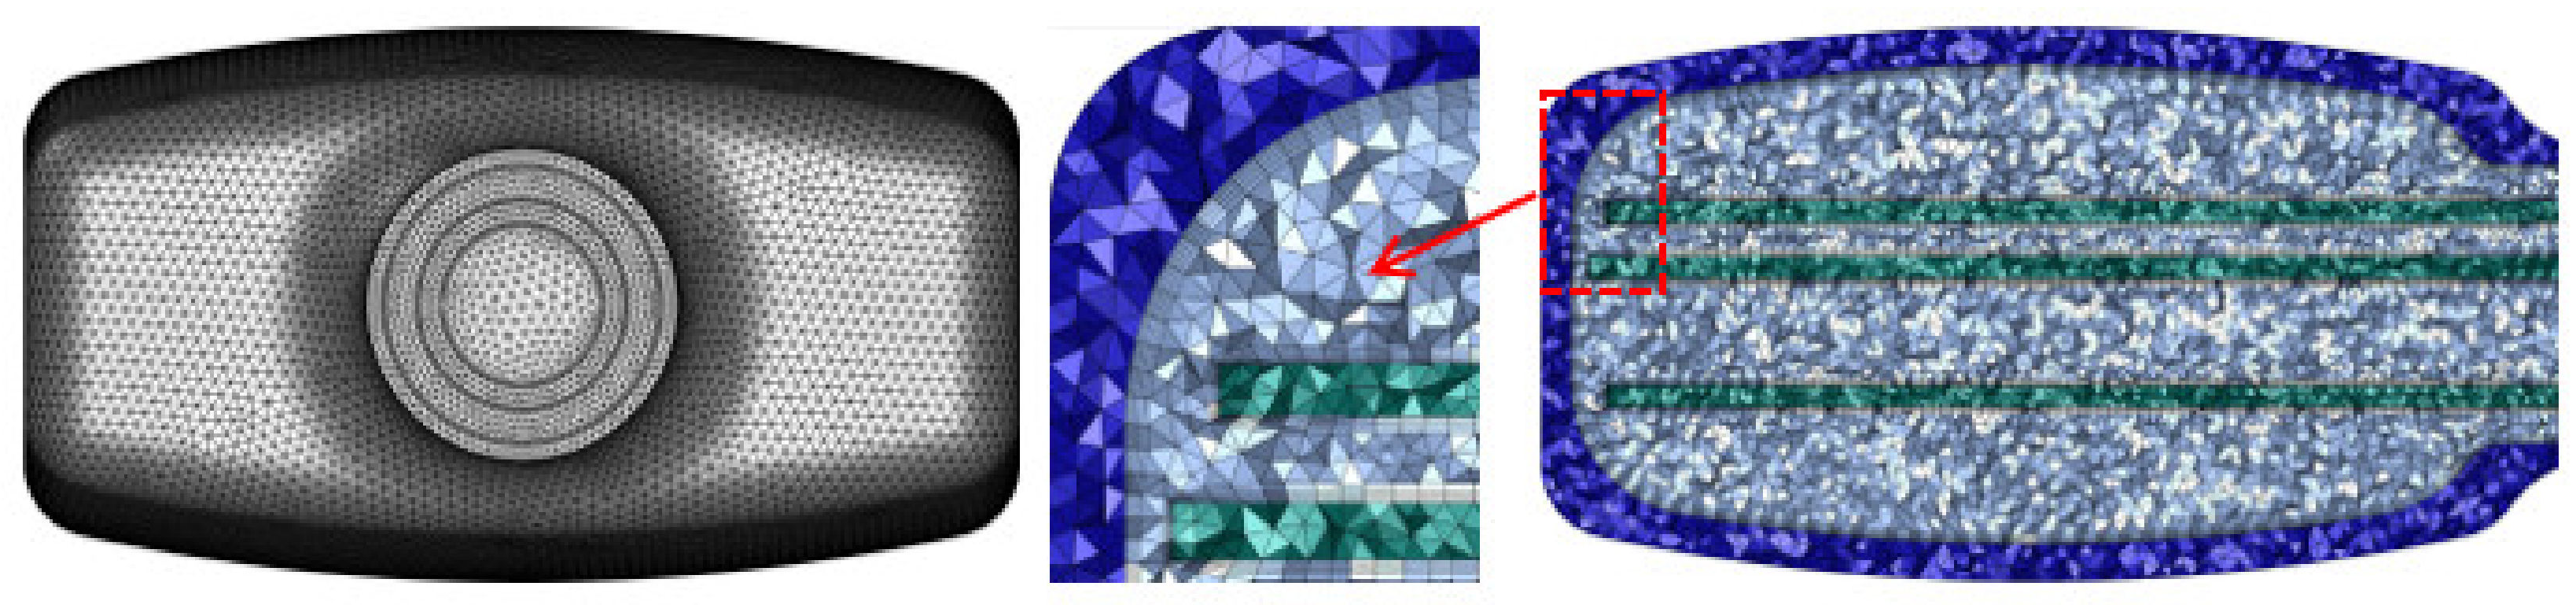
2.2. Meshing
2.3. Governing Equations
2.4. Boundary Conditions
- The inlet temperature ranges from 18 to 30 K, the inlet mass flow rate 30 to 150 g/s, the pressure from 11 to 15 bar. It is assumed that the flow at the inlet has been fully developed, and the boundary condition of the entrance is set as the average mass. The outlet boundary condition was set as the pressure outlet according to the standard atmospheric pressure, and the outlet calculation domain was appropriately extended to avoid the backflow phenomenon.
- The standard wall function is used for wall treatment, and the no-slip boundary condition is adopted. The container is set as an adiabatic wall surface, the second-order upwind format is used for the discrete equation, and Semi-Implicit Method for Pressure Linked Equations (SIMPLE) algorithm is selected for the pressure-velocity coupling method. The maximum number of convergent iterations is 8000, and the convergence residual Root Mean Square of the residual values (RMS) value is set to 10−6 to obtain a stable convergent solution.
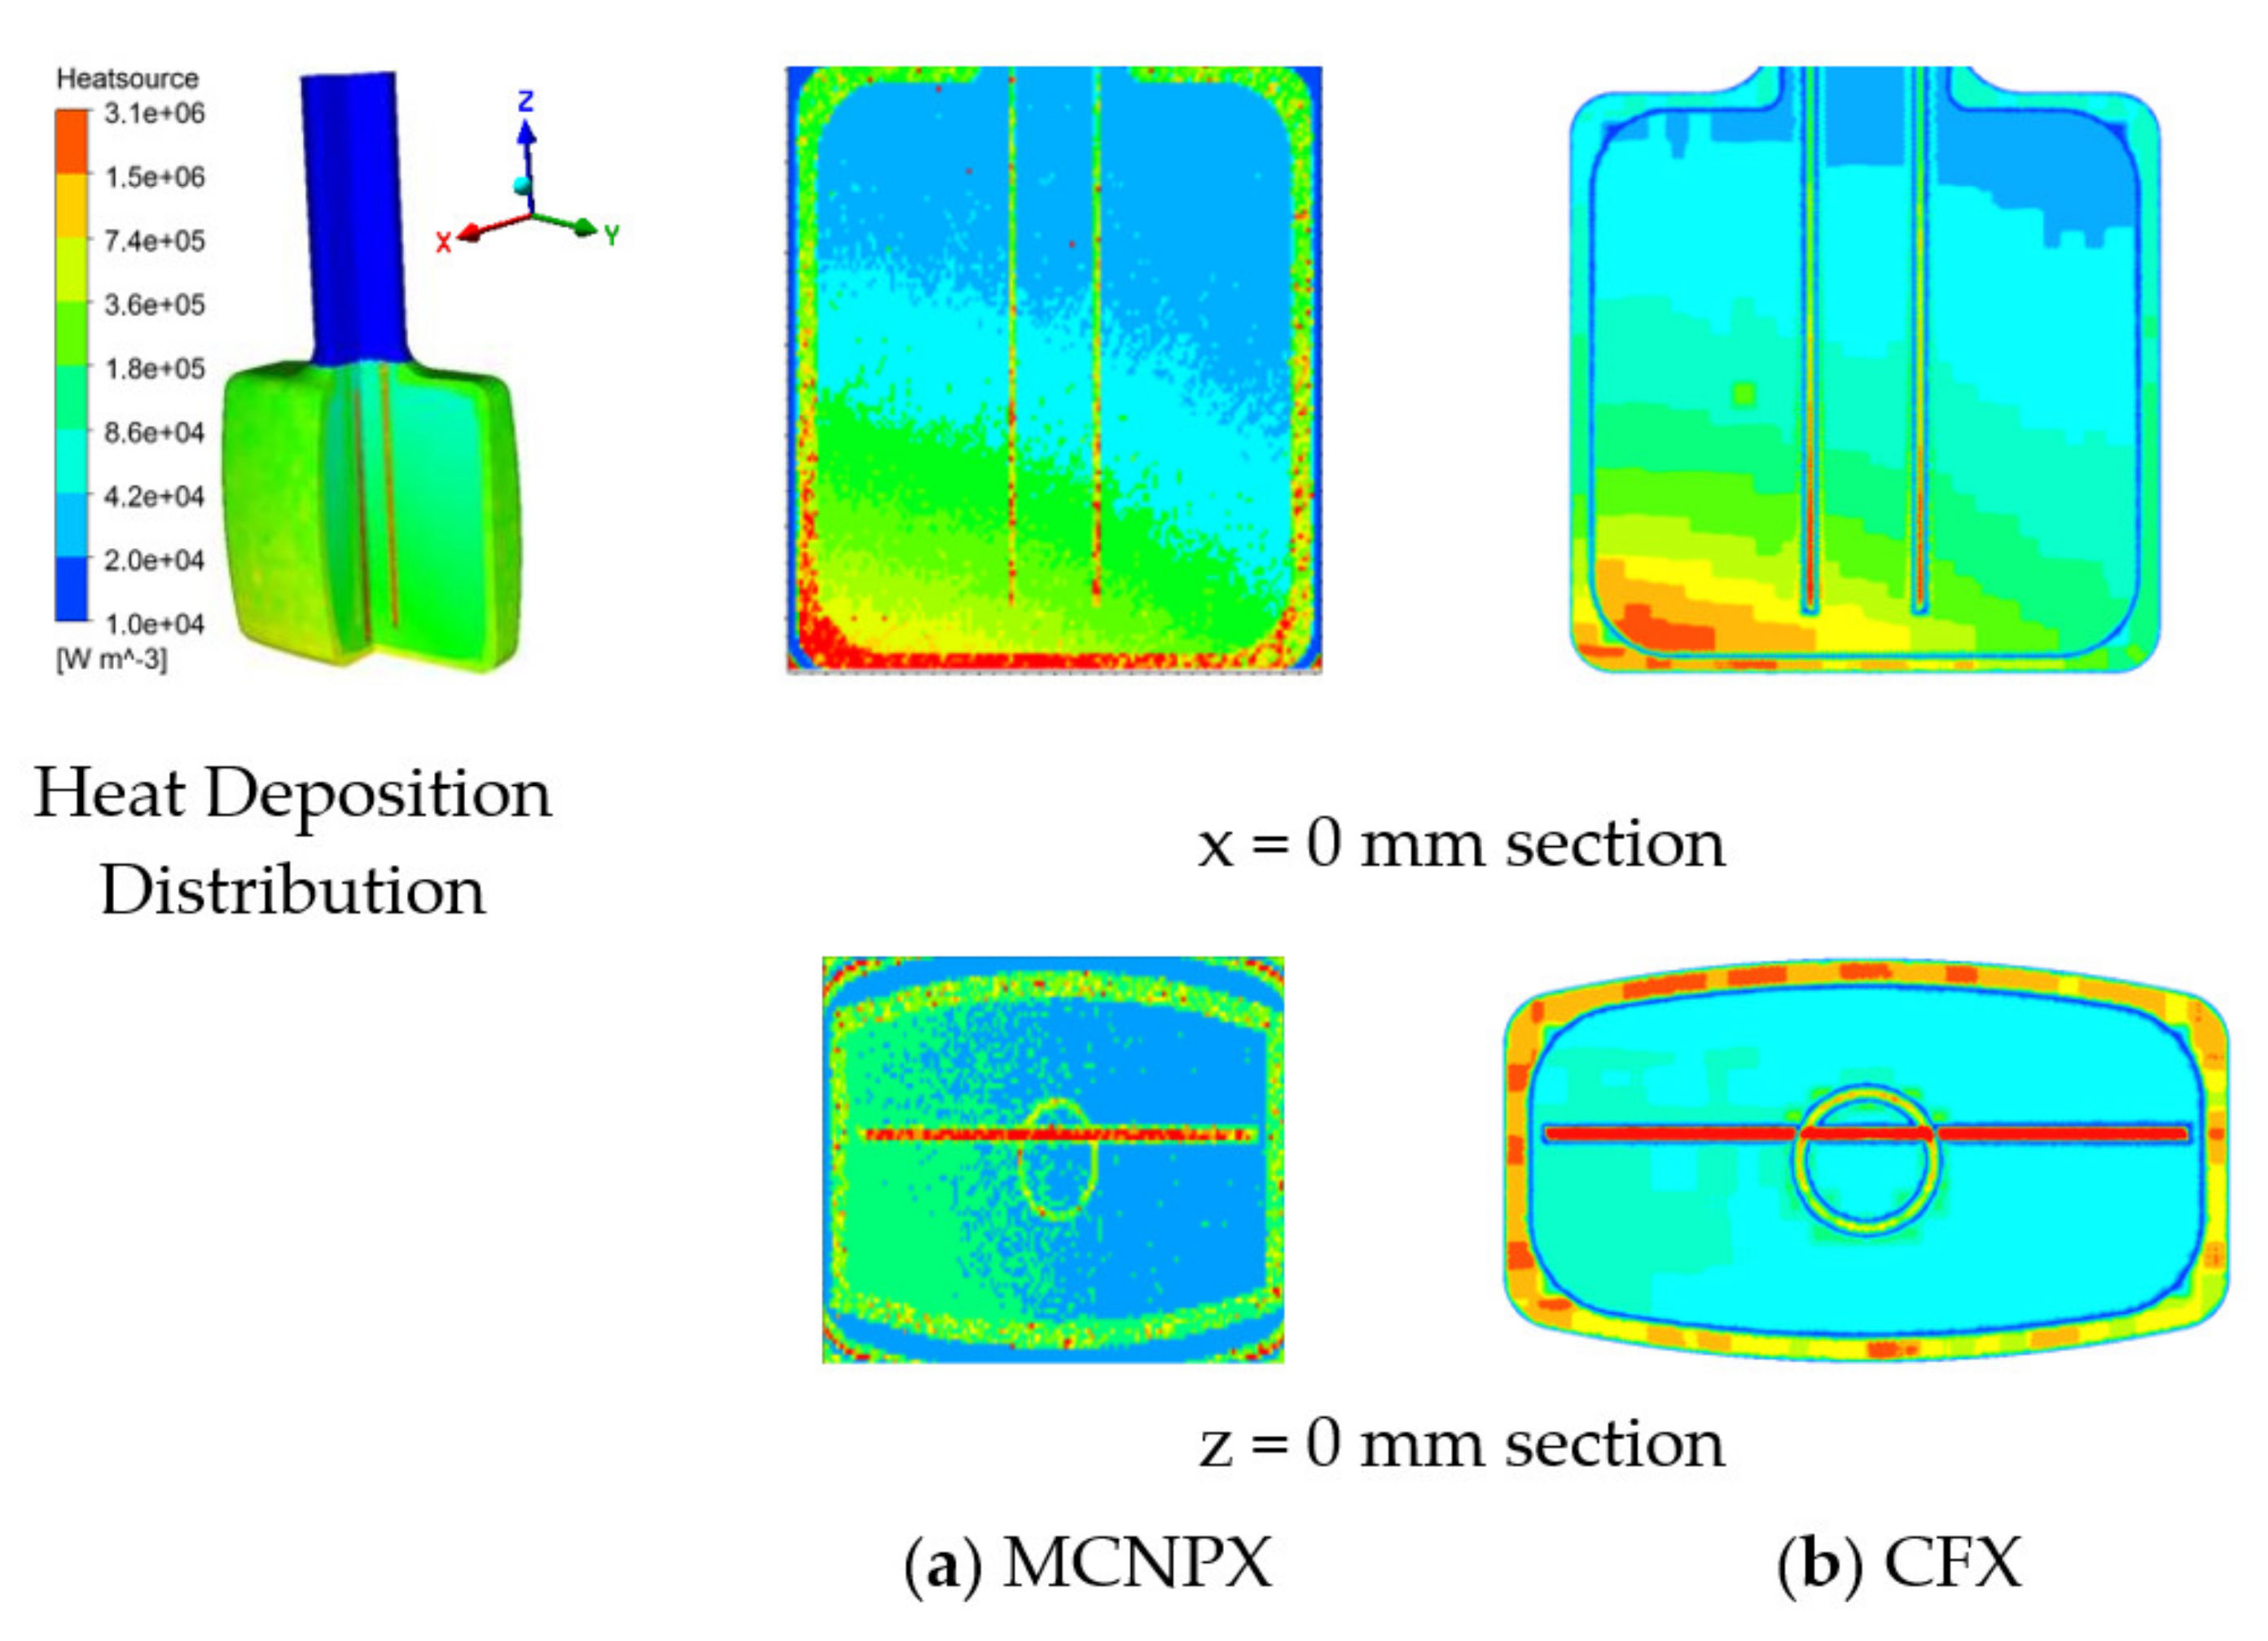
- The non-uniform heat source of the moderator was obtained by external coupling of MCNPX and CFX software and applied to the moderator. Table 1 lists the comparison of the corrected heat sources between MCNPX and CFX when the proton beam power is 500 kW. Since the models used in the two softwares are slightly different, there are some errors in the calculation values of thermal deposition of materials, but they are within the allowable range, which proves the accuracy and reliability of the coupling results.
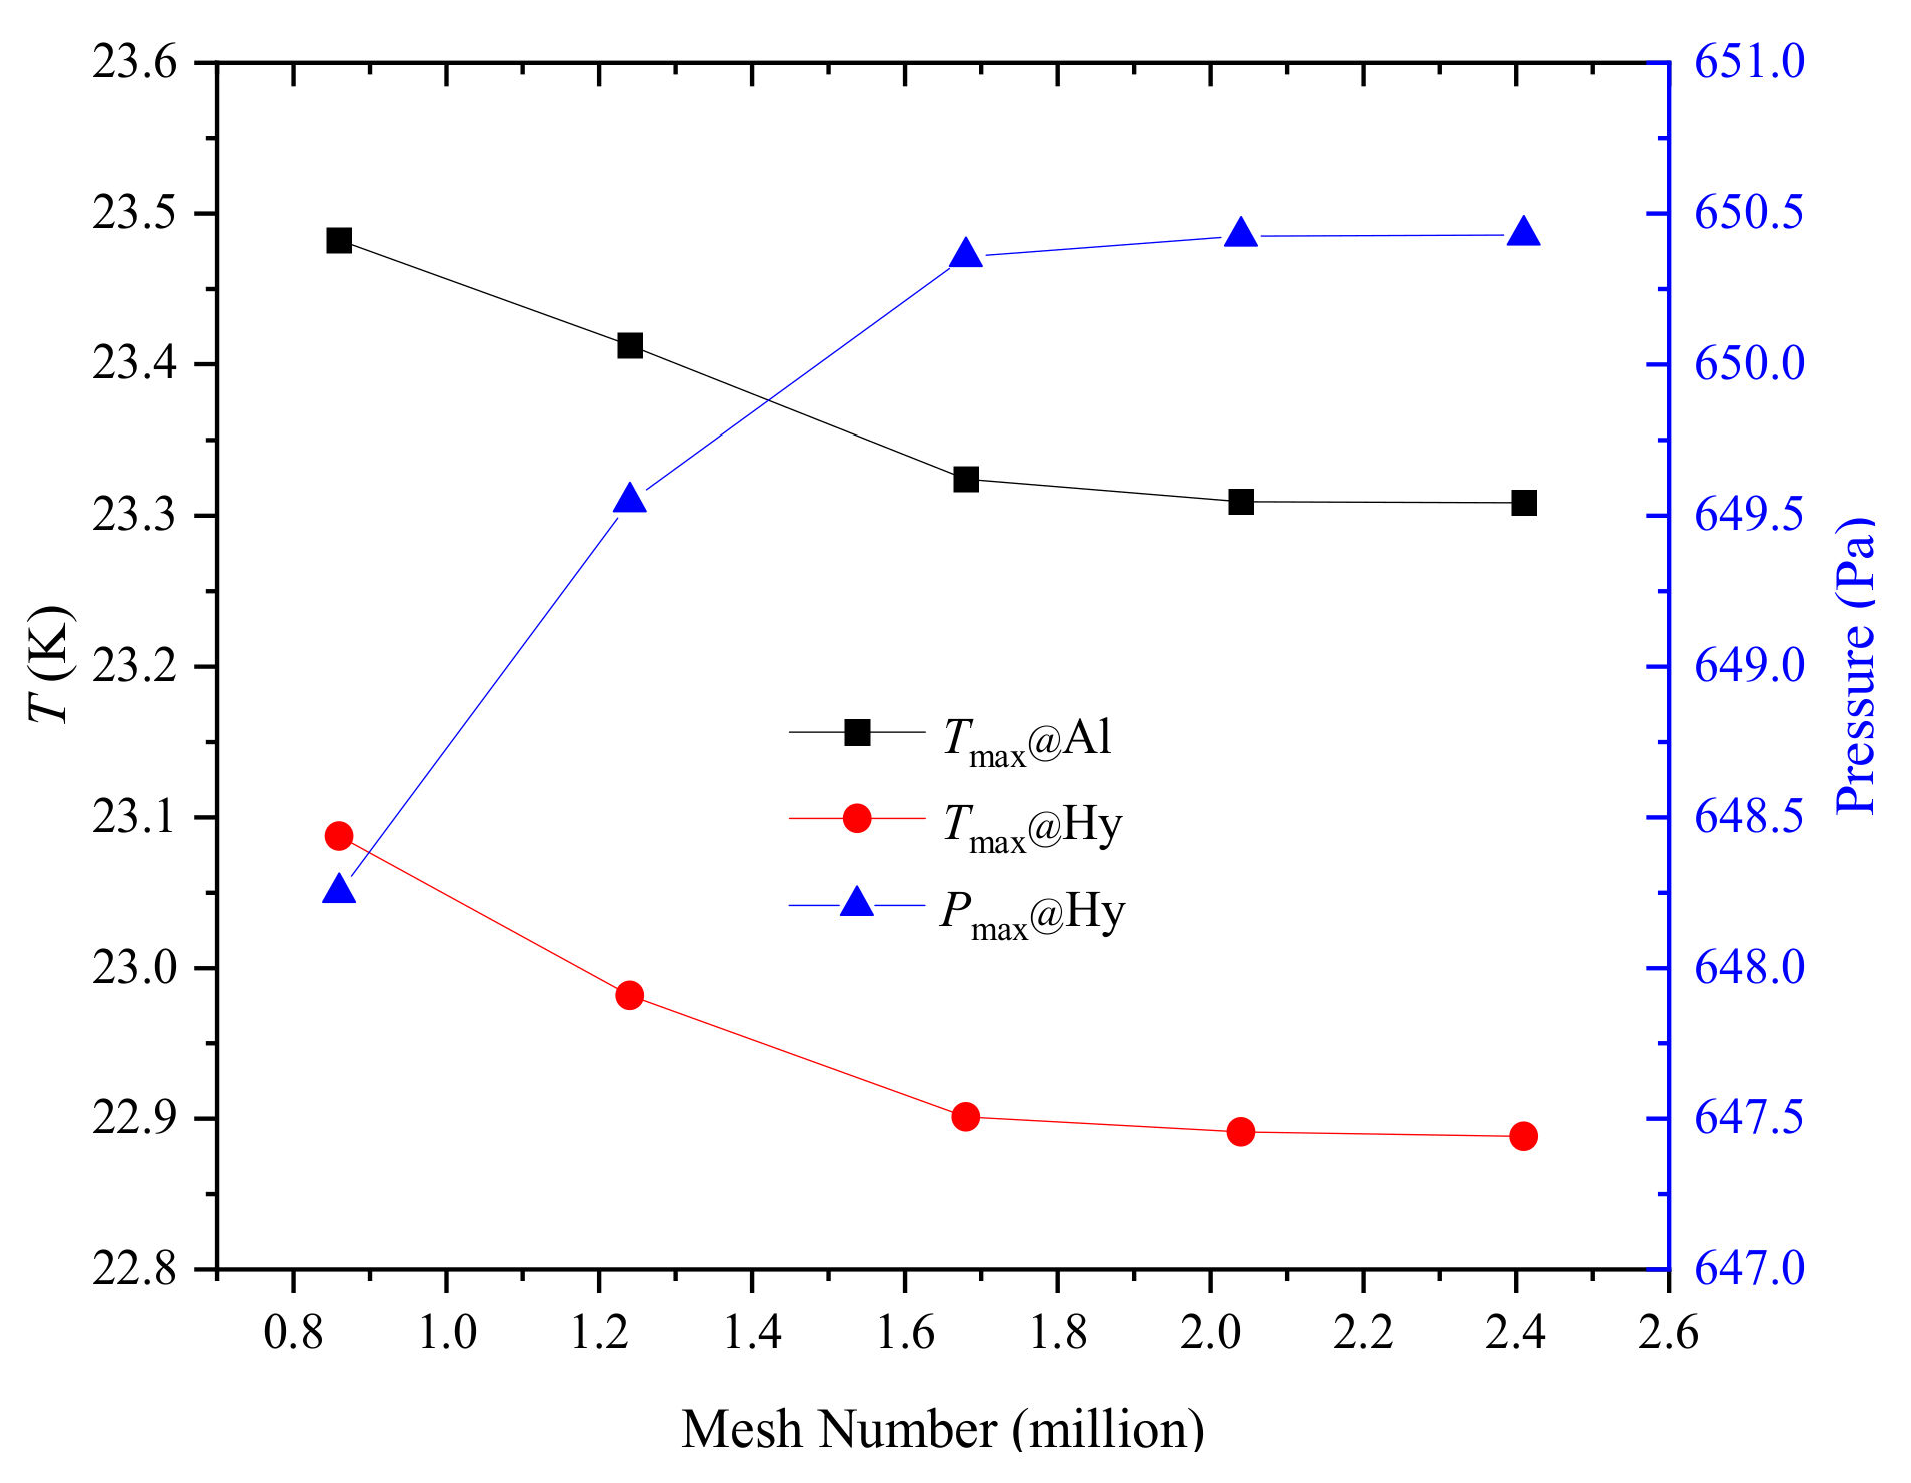
2.5. Verification of Grid Independence
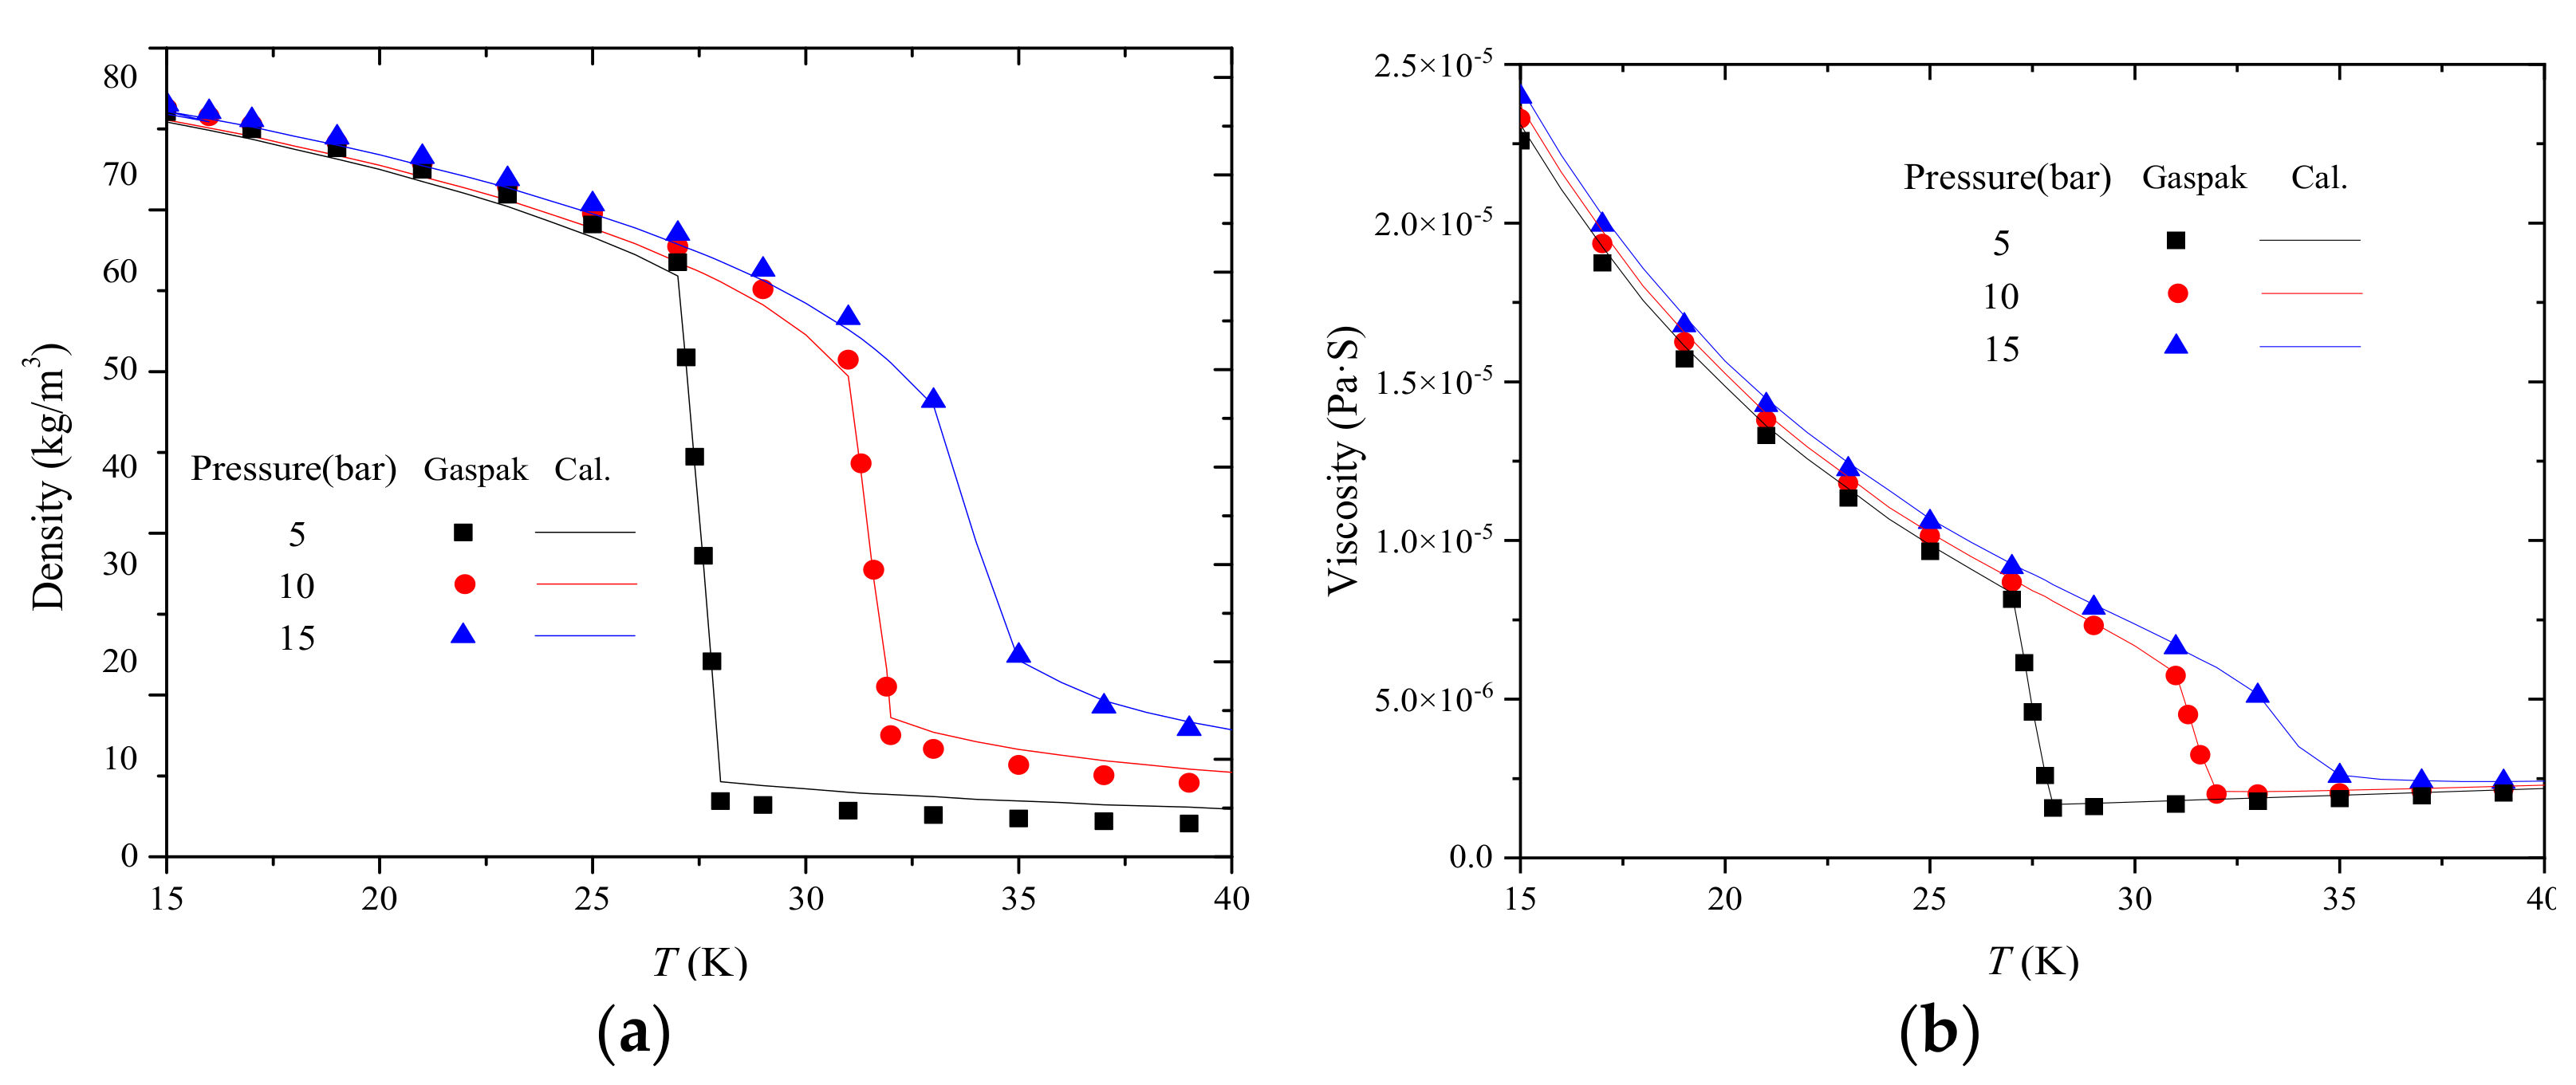
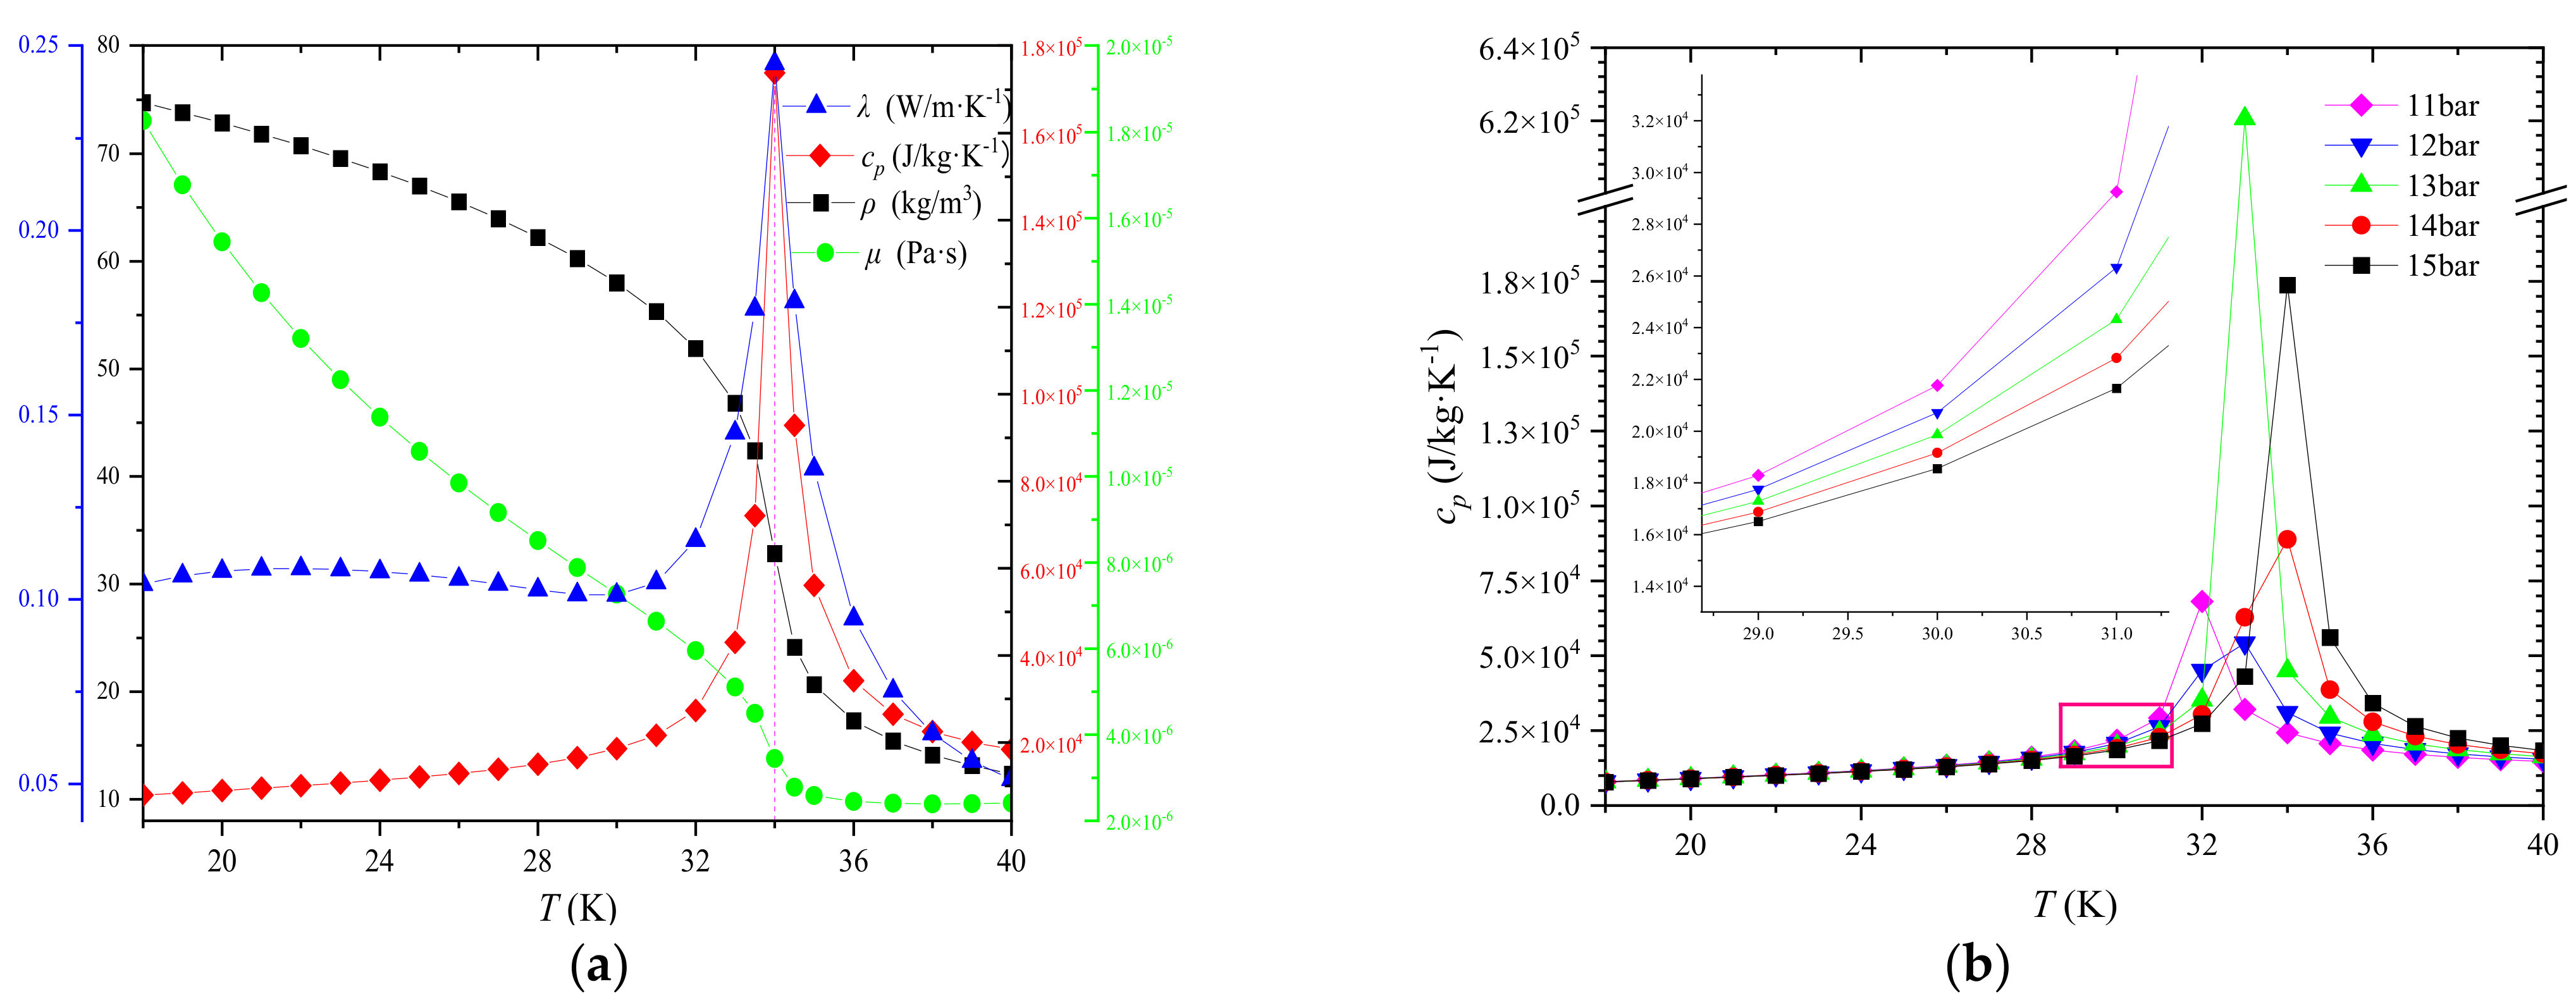
2.6. Verification of Physical Parameters
3. Results and Discussion
3.1. The Heat Source Distribution
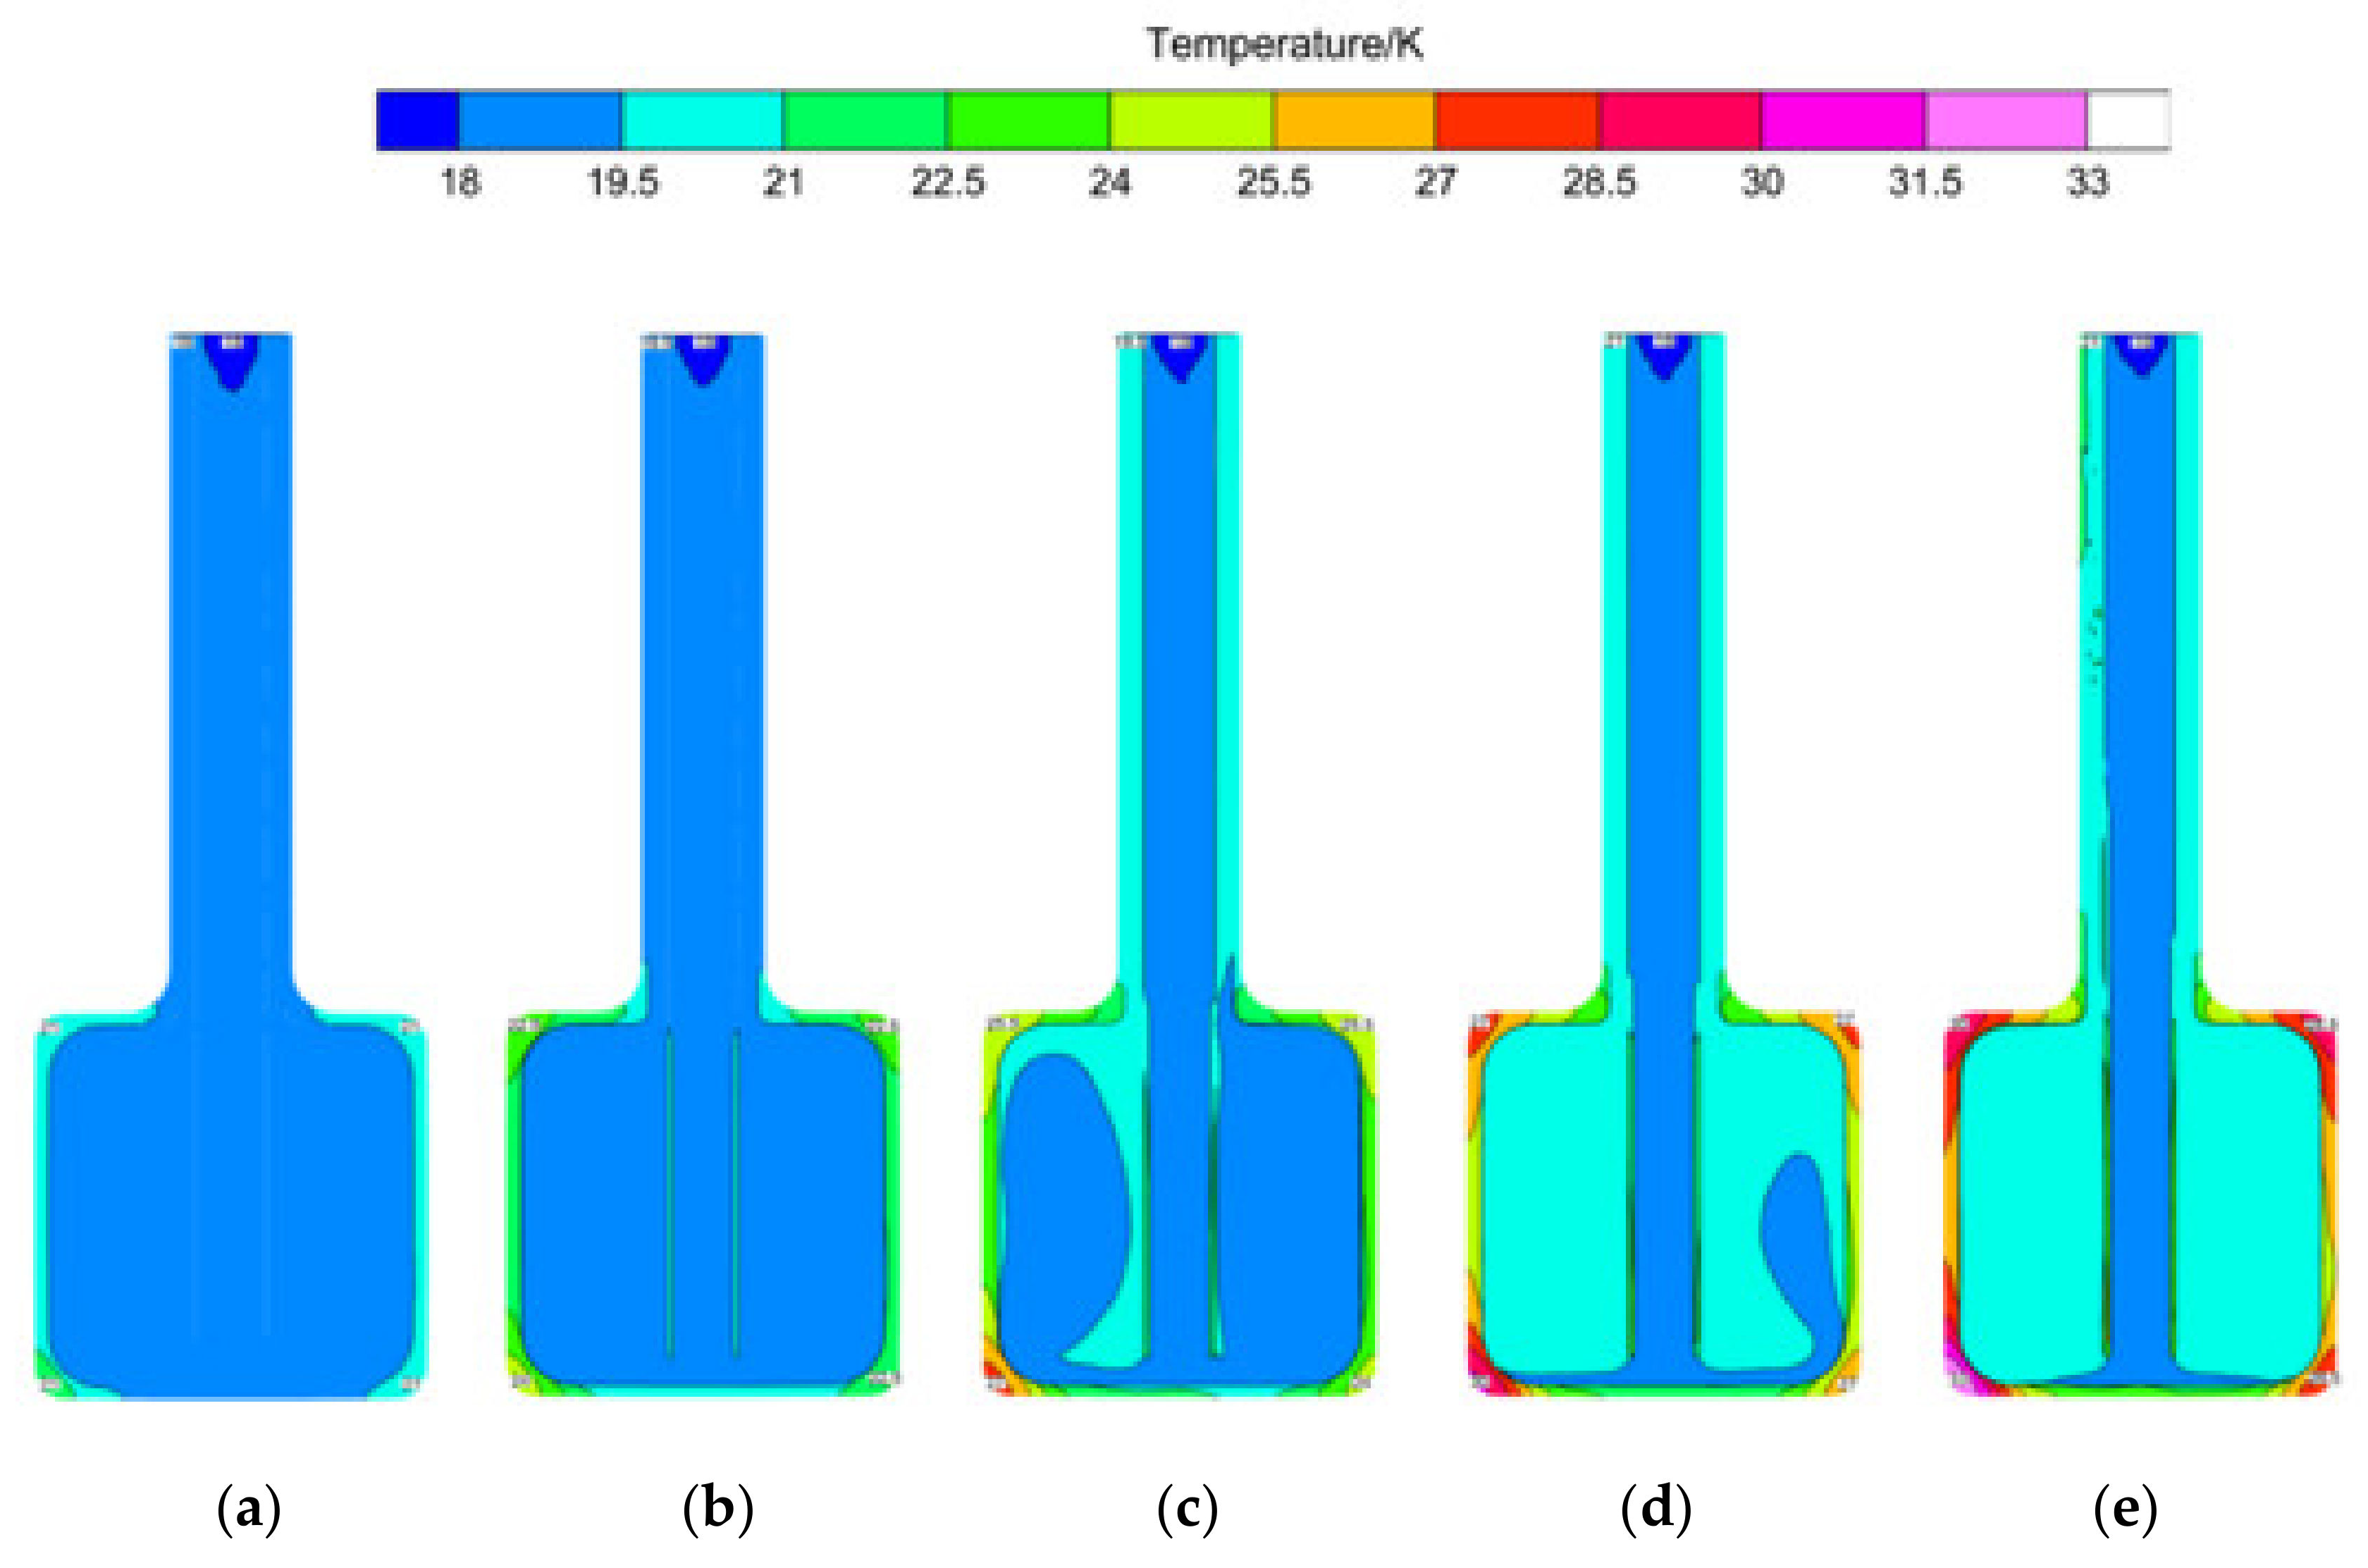
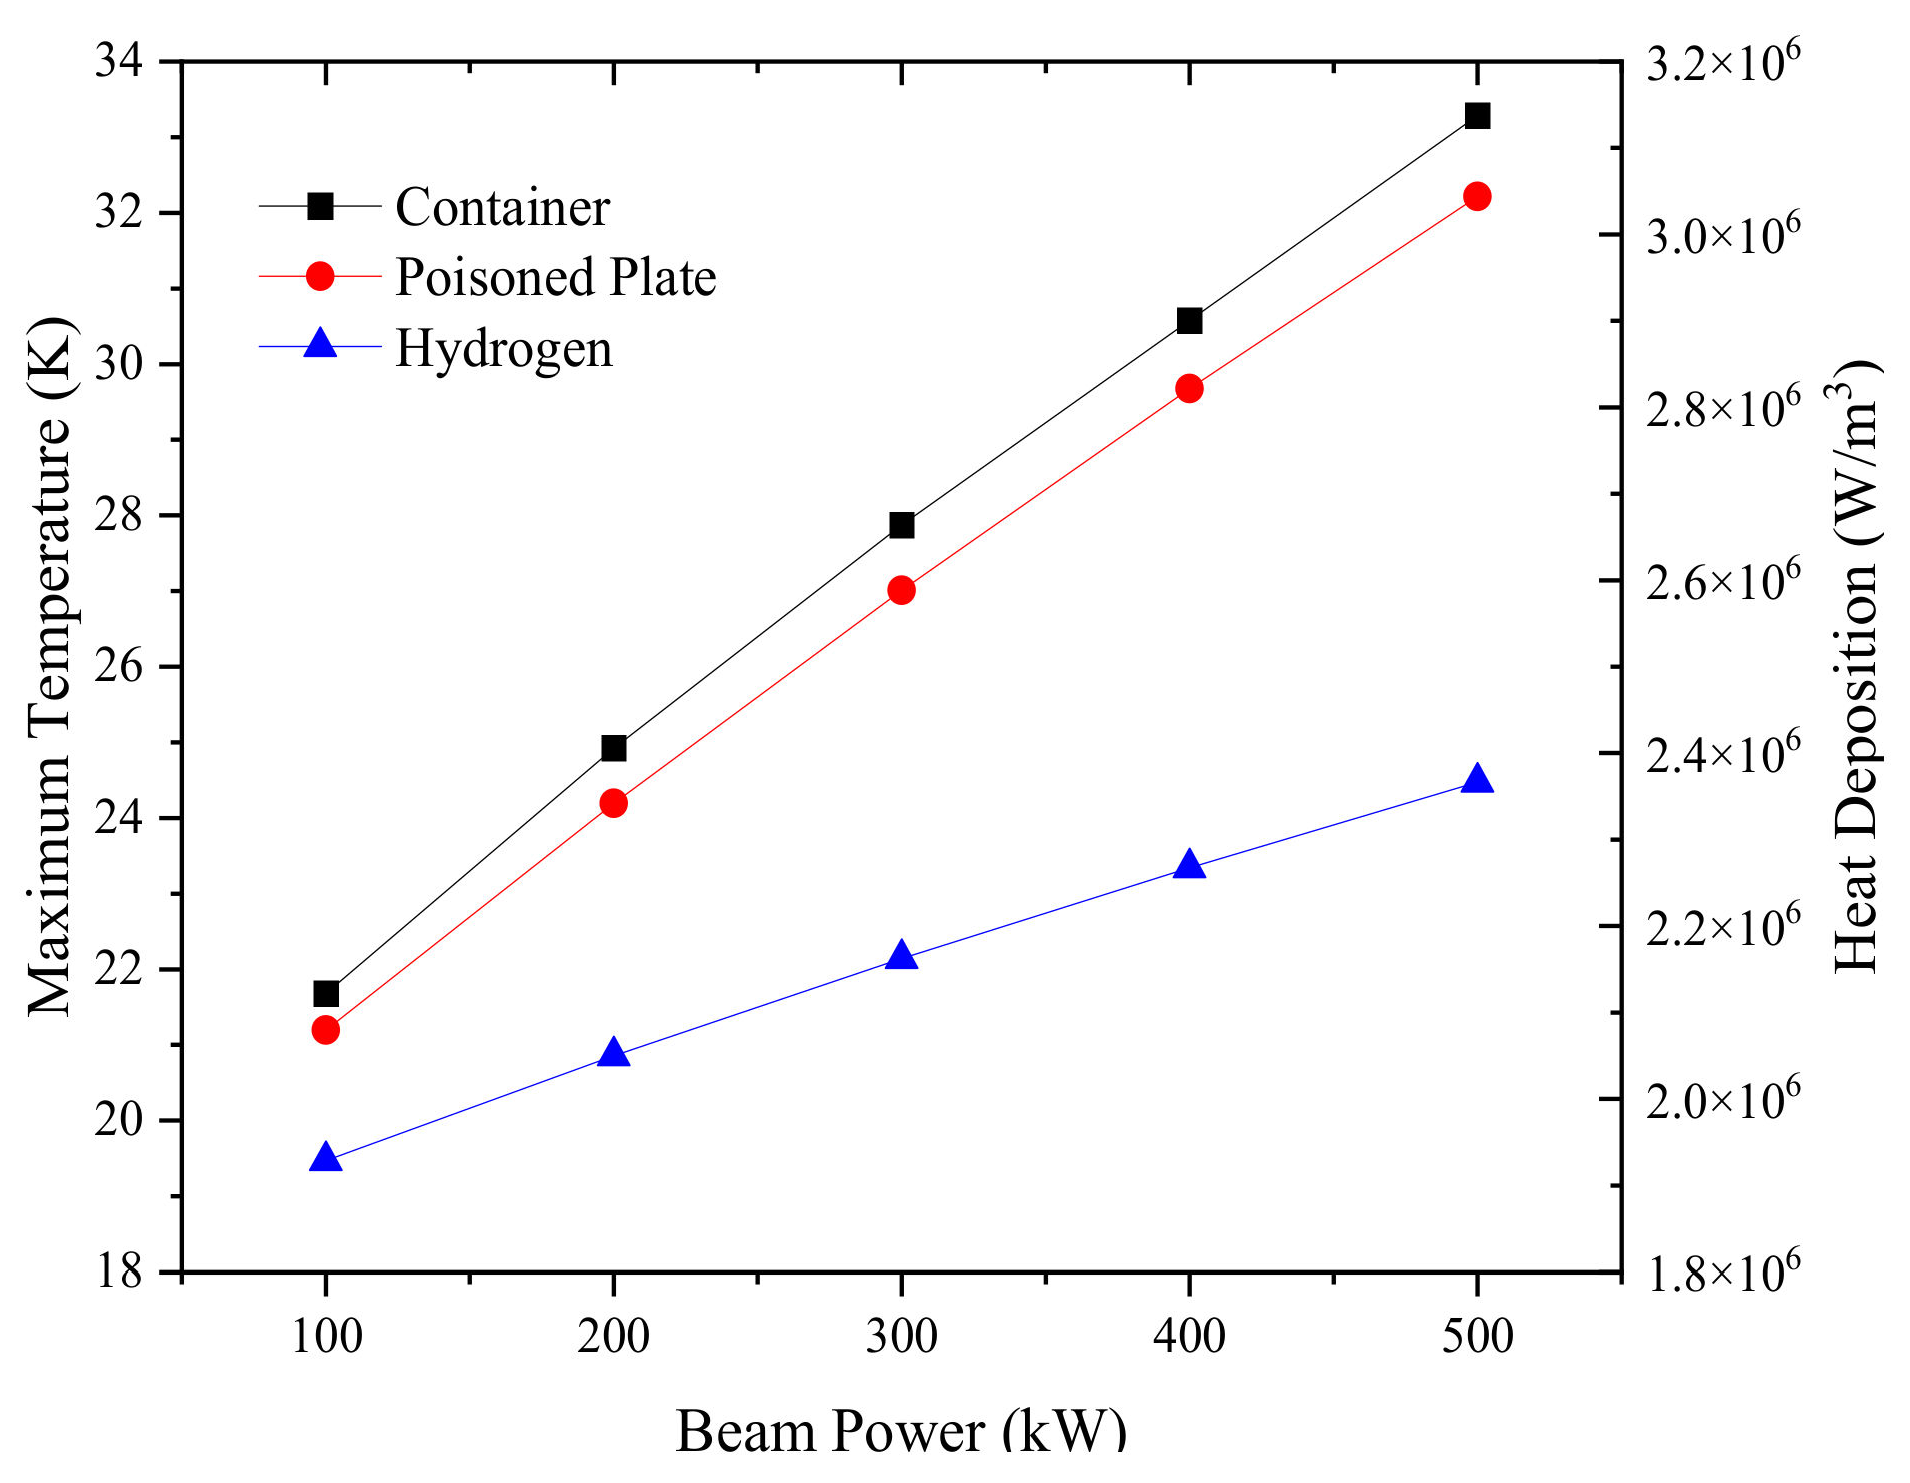
3.2. Effect of Beam Power on Heat Transfer
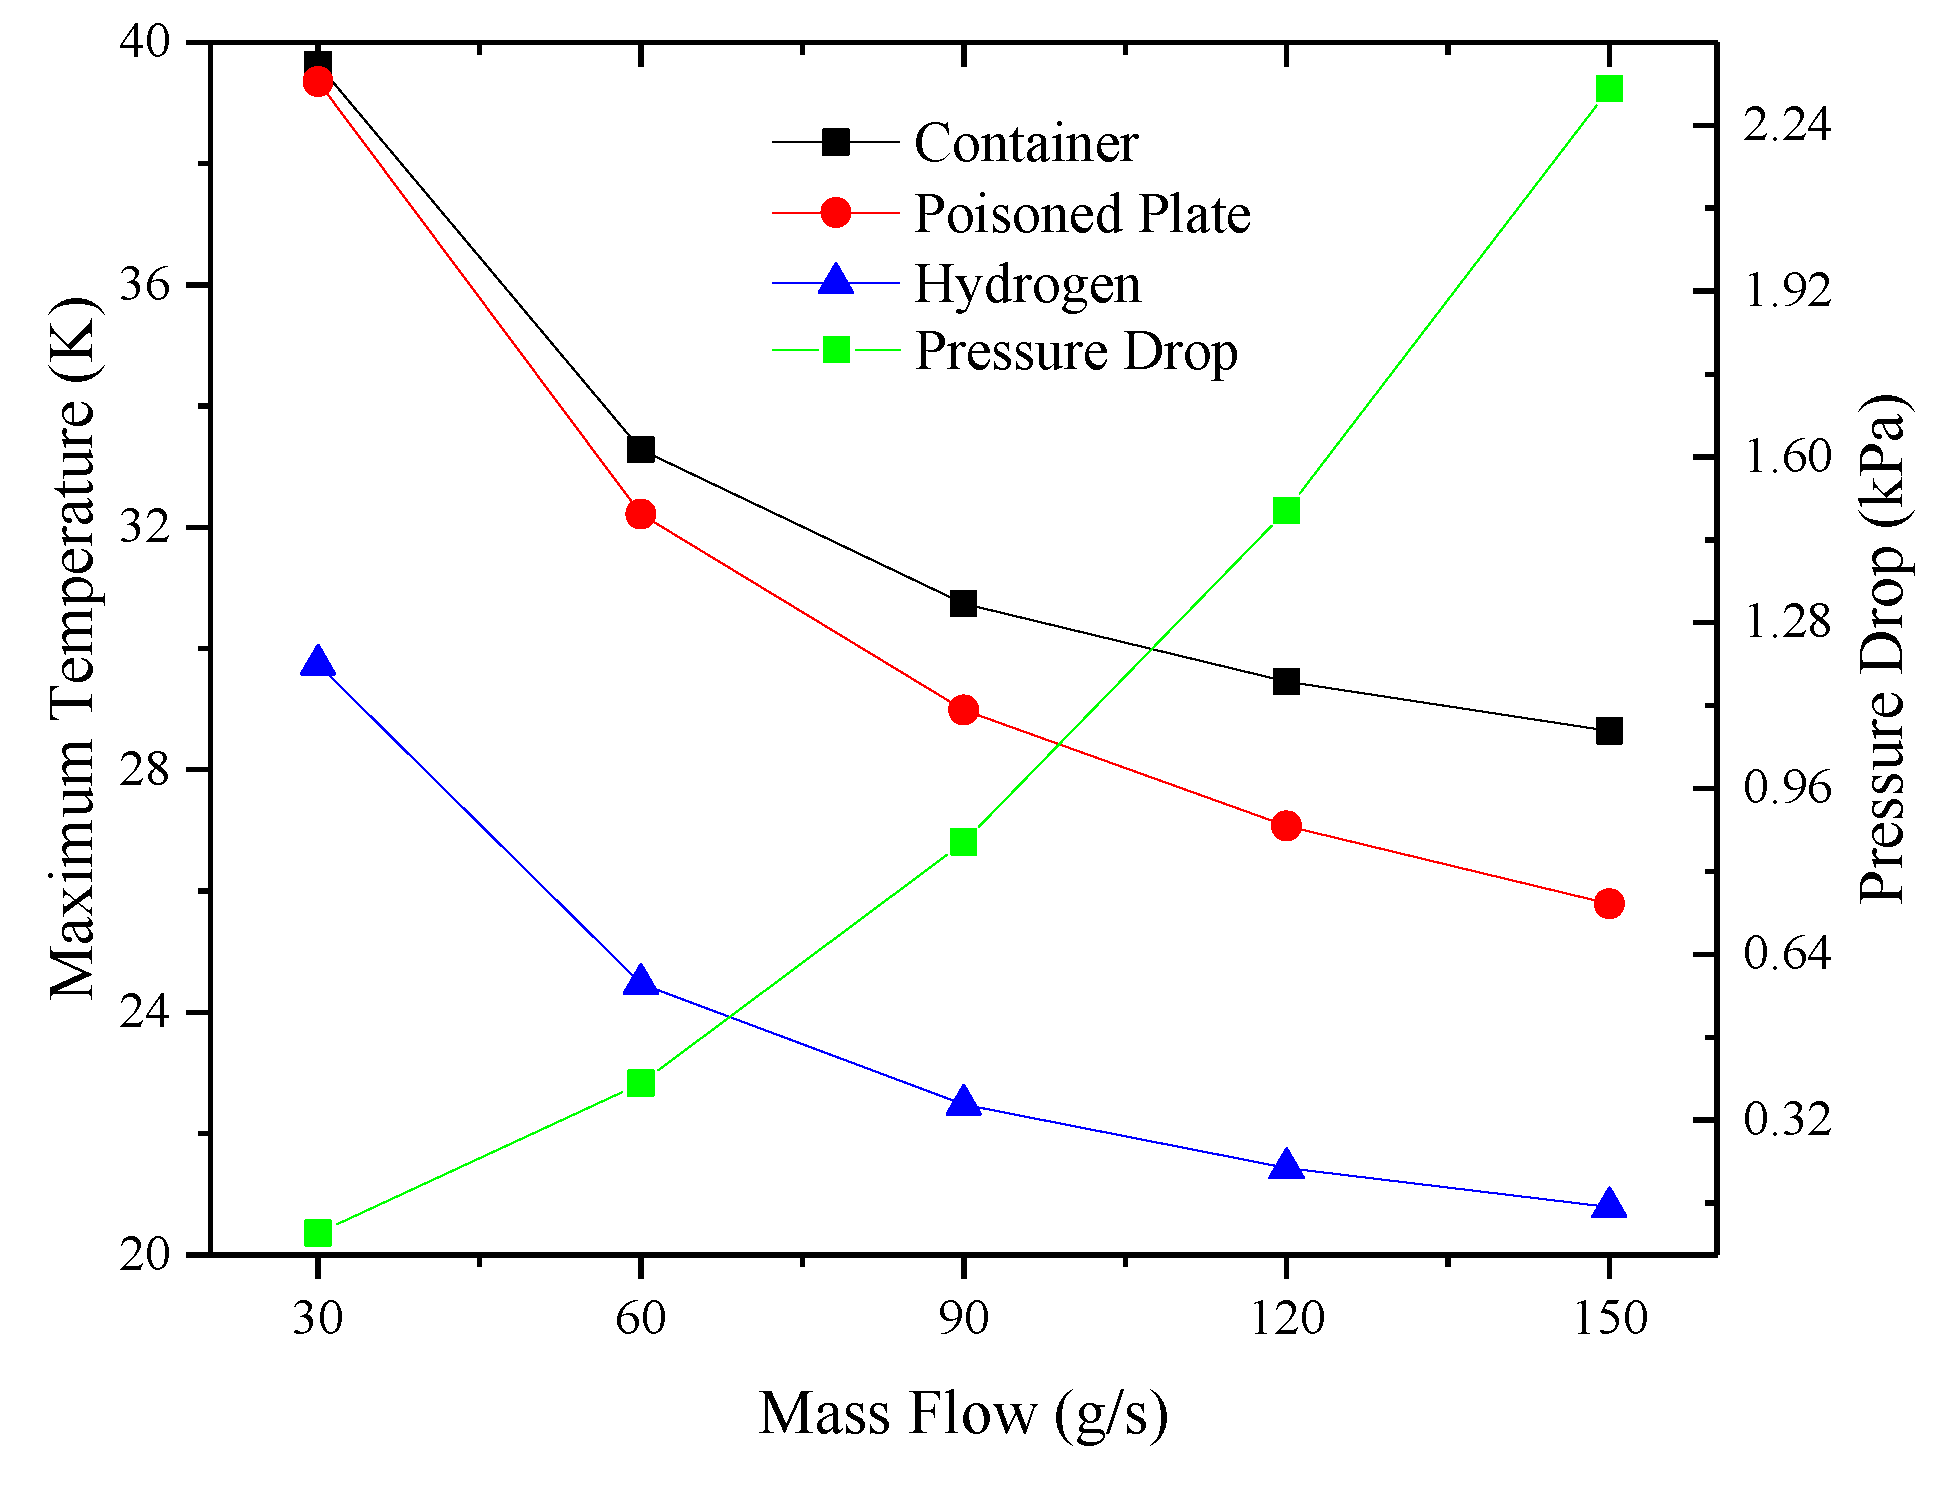
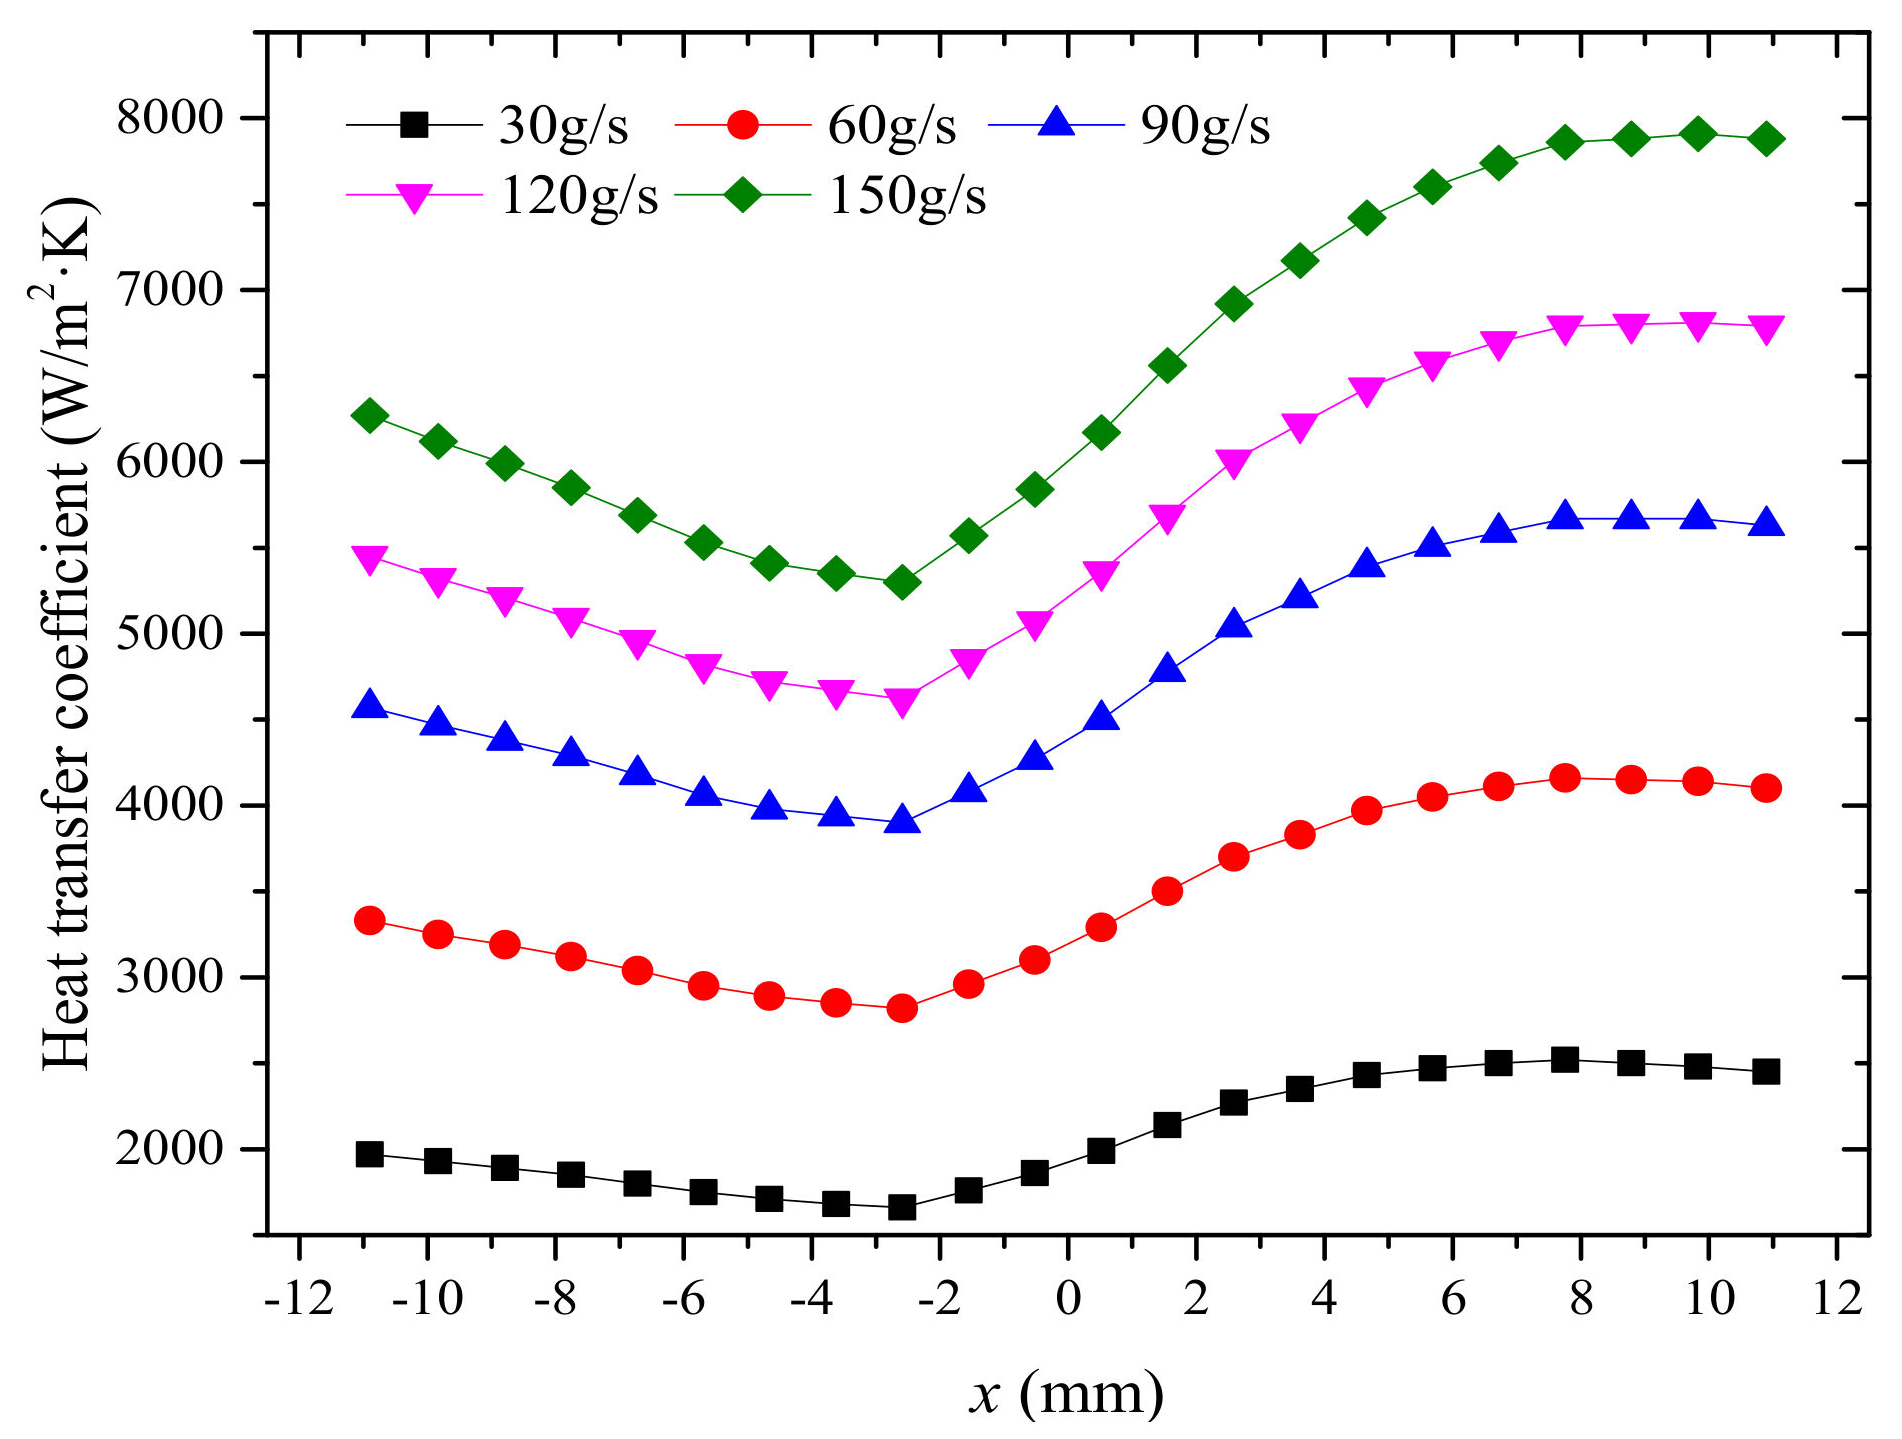
3.3. Effect of Mass Flow on Heat Transfer
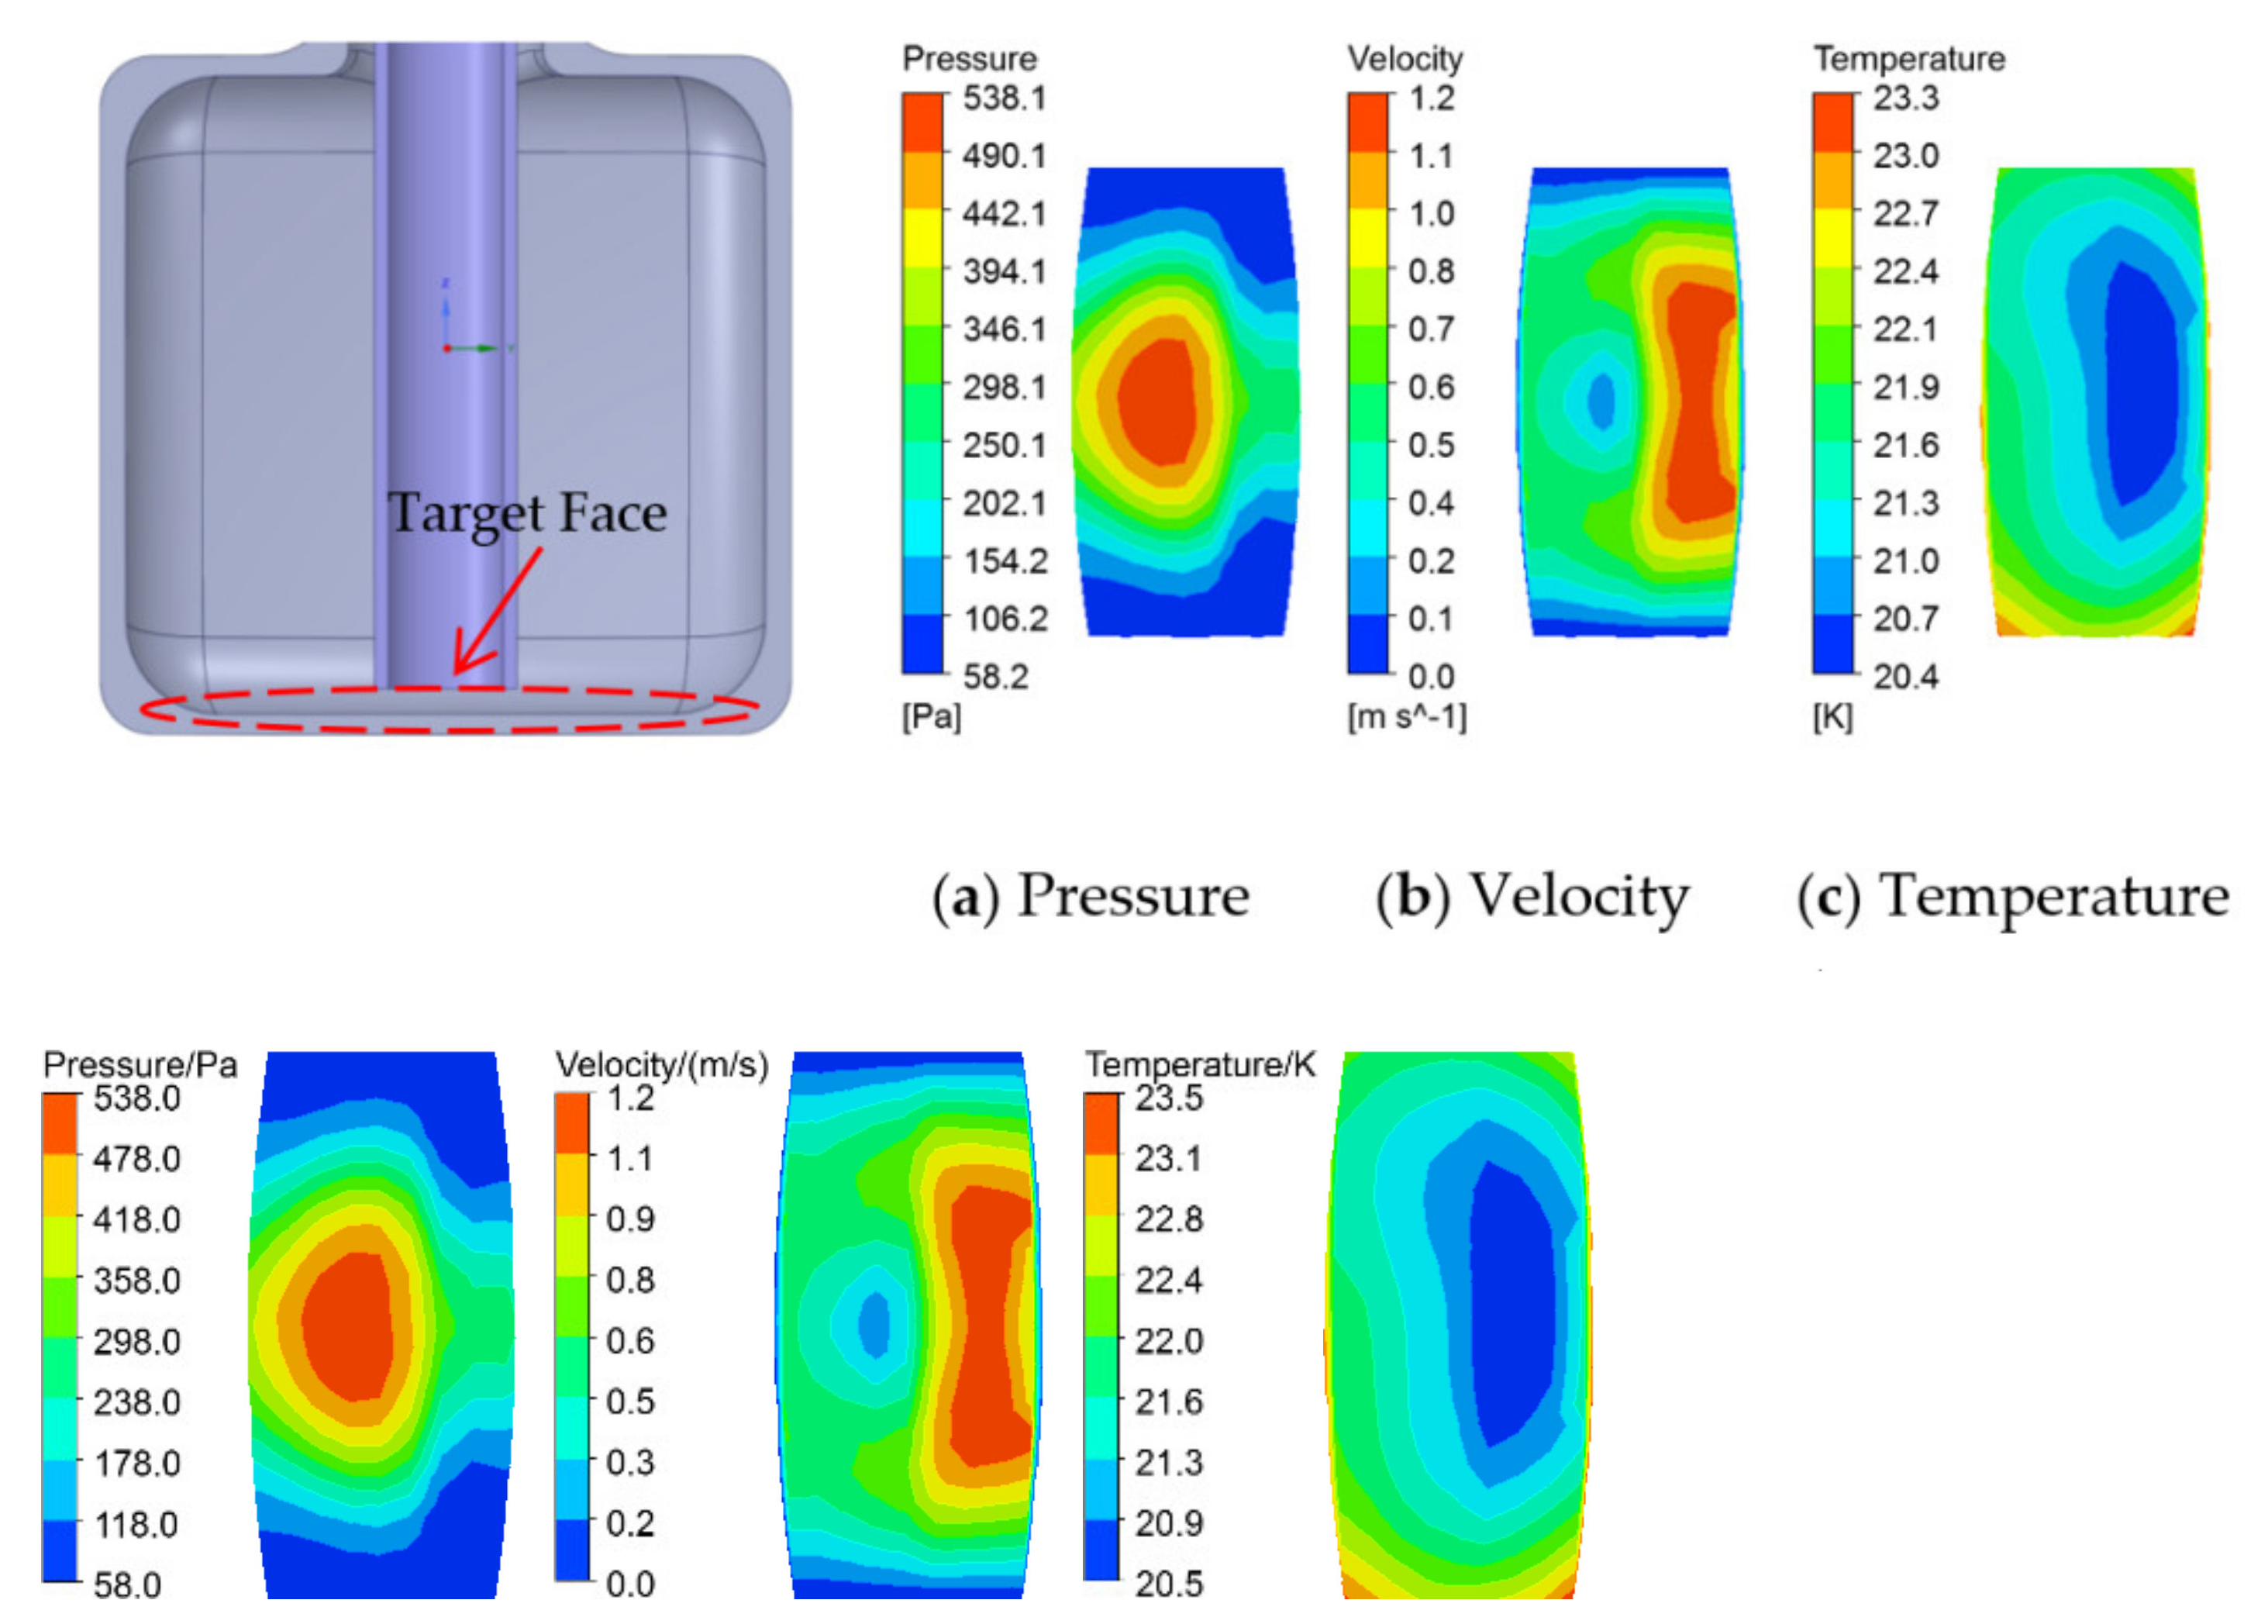
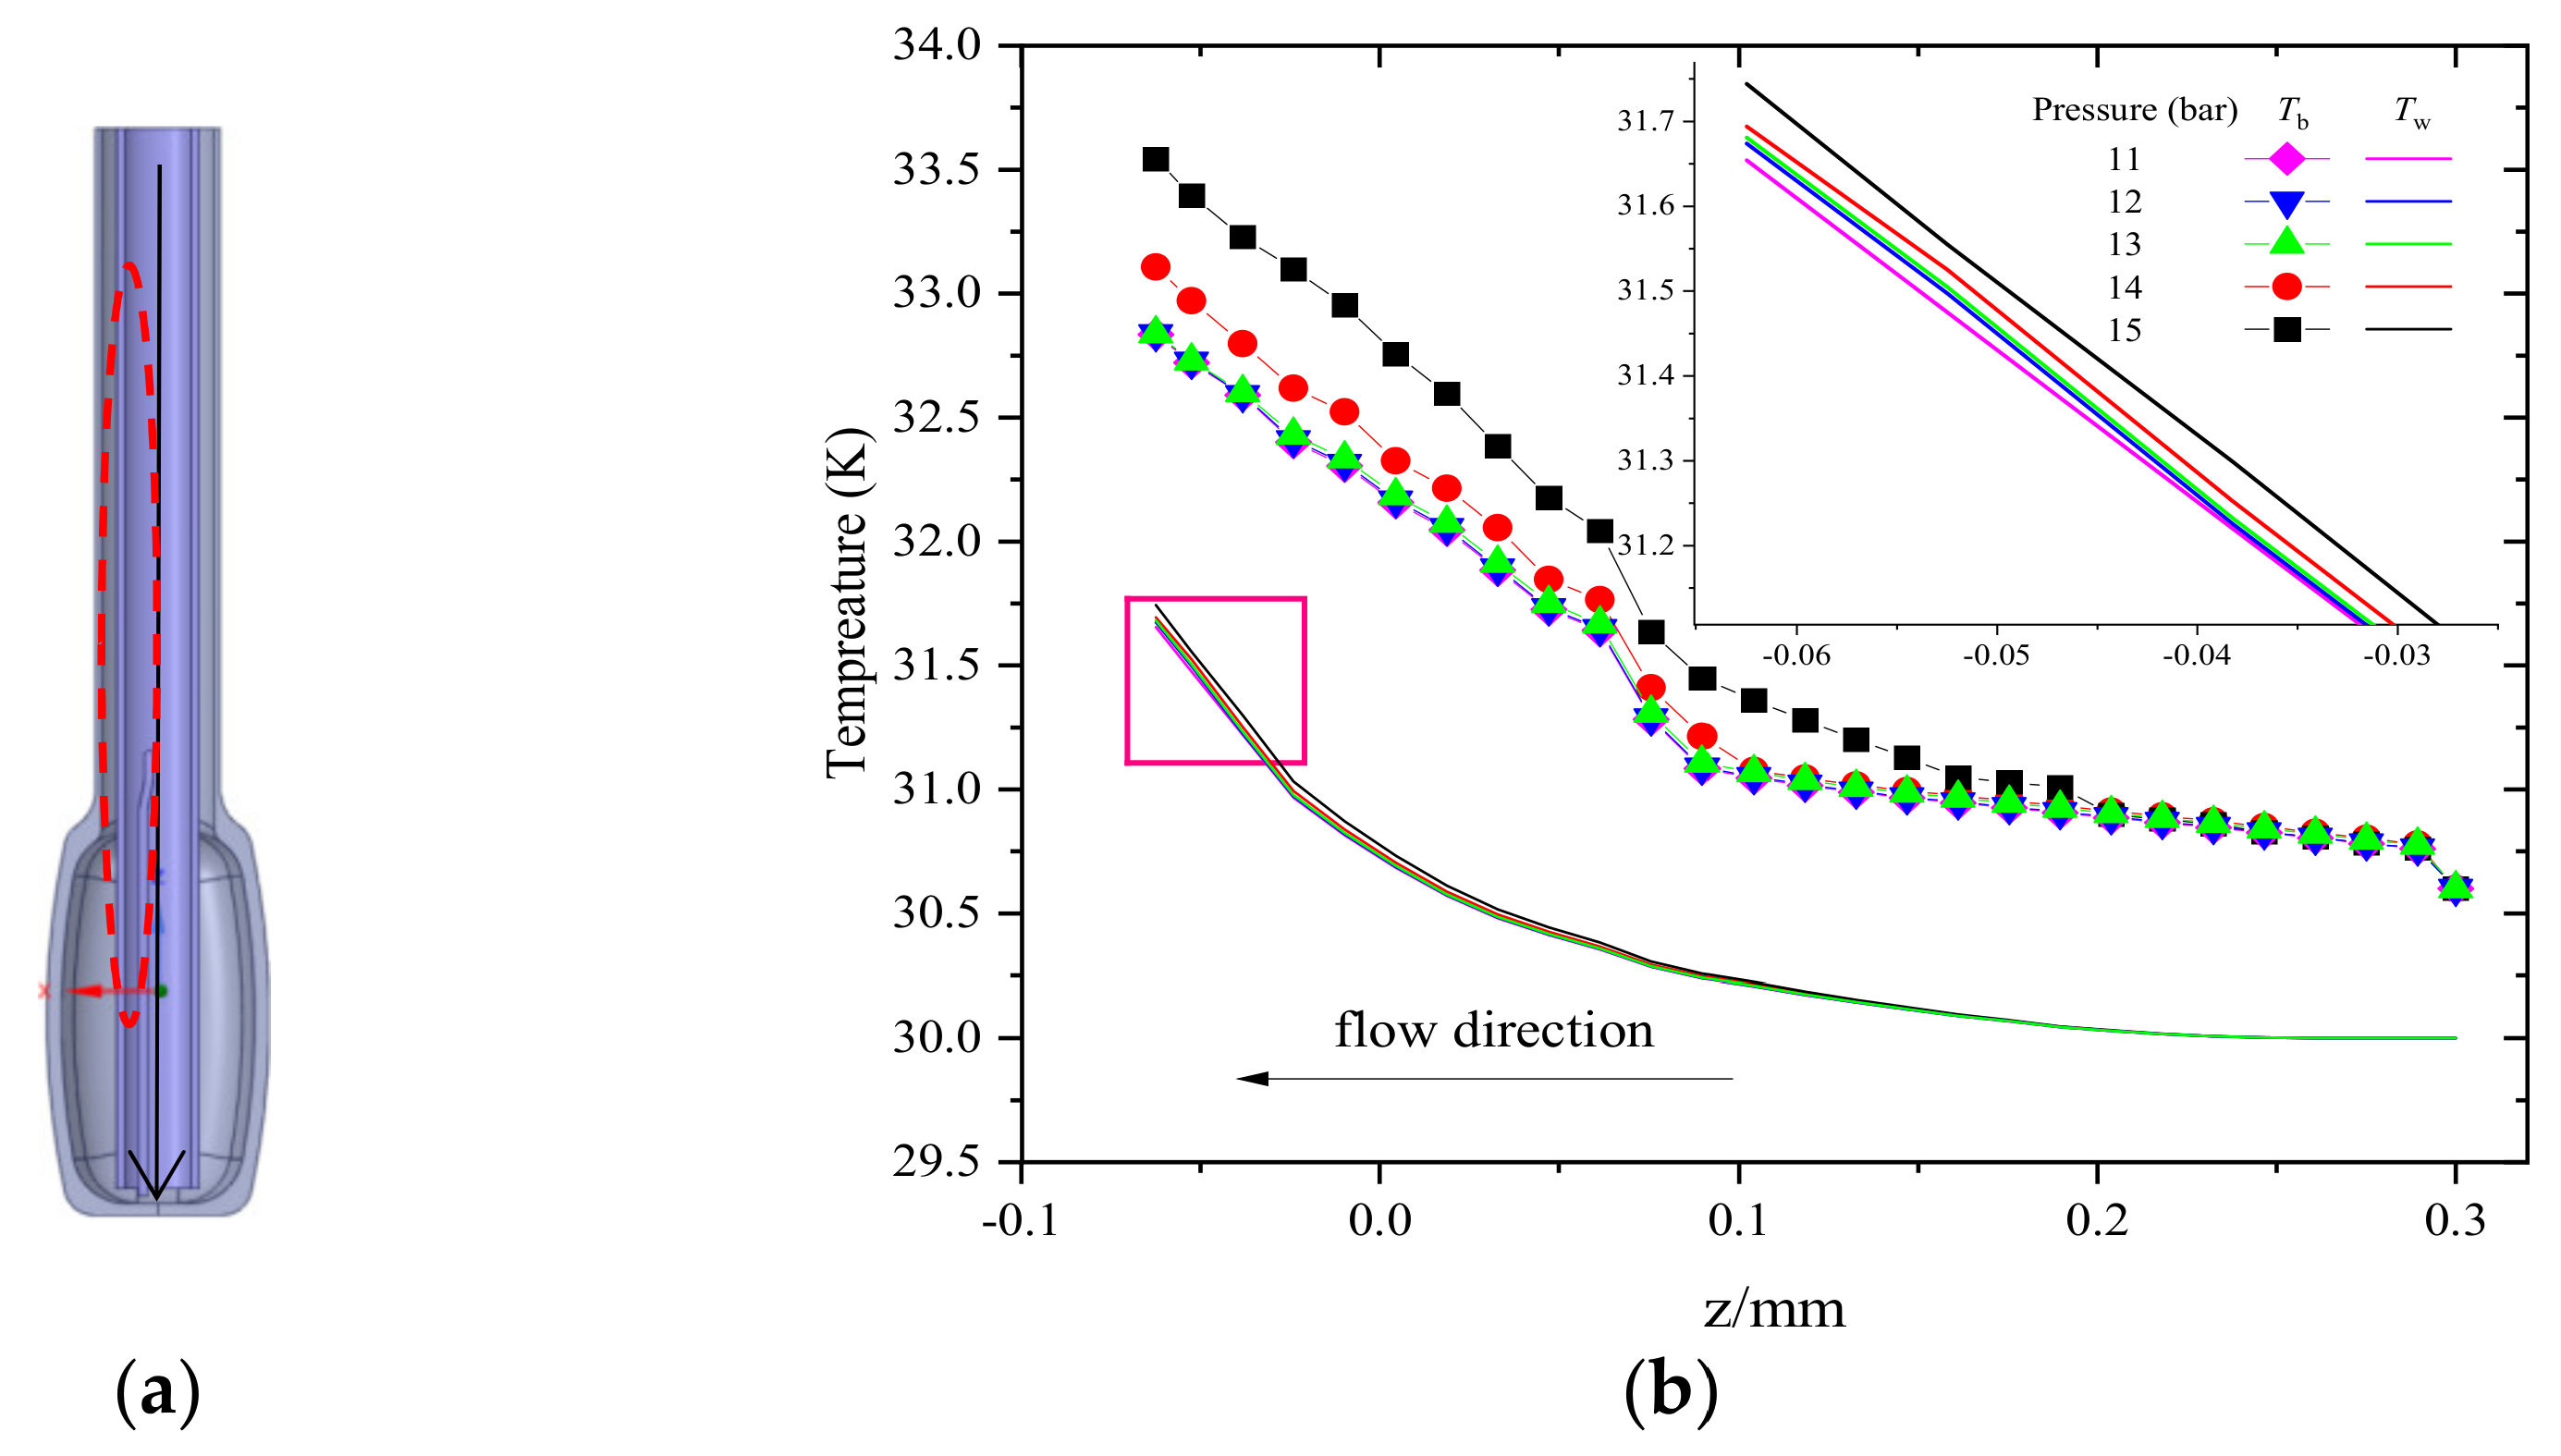
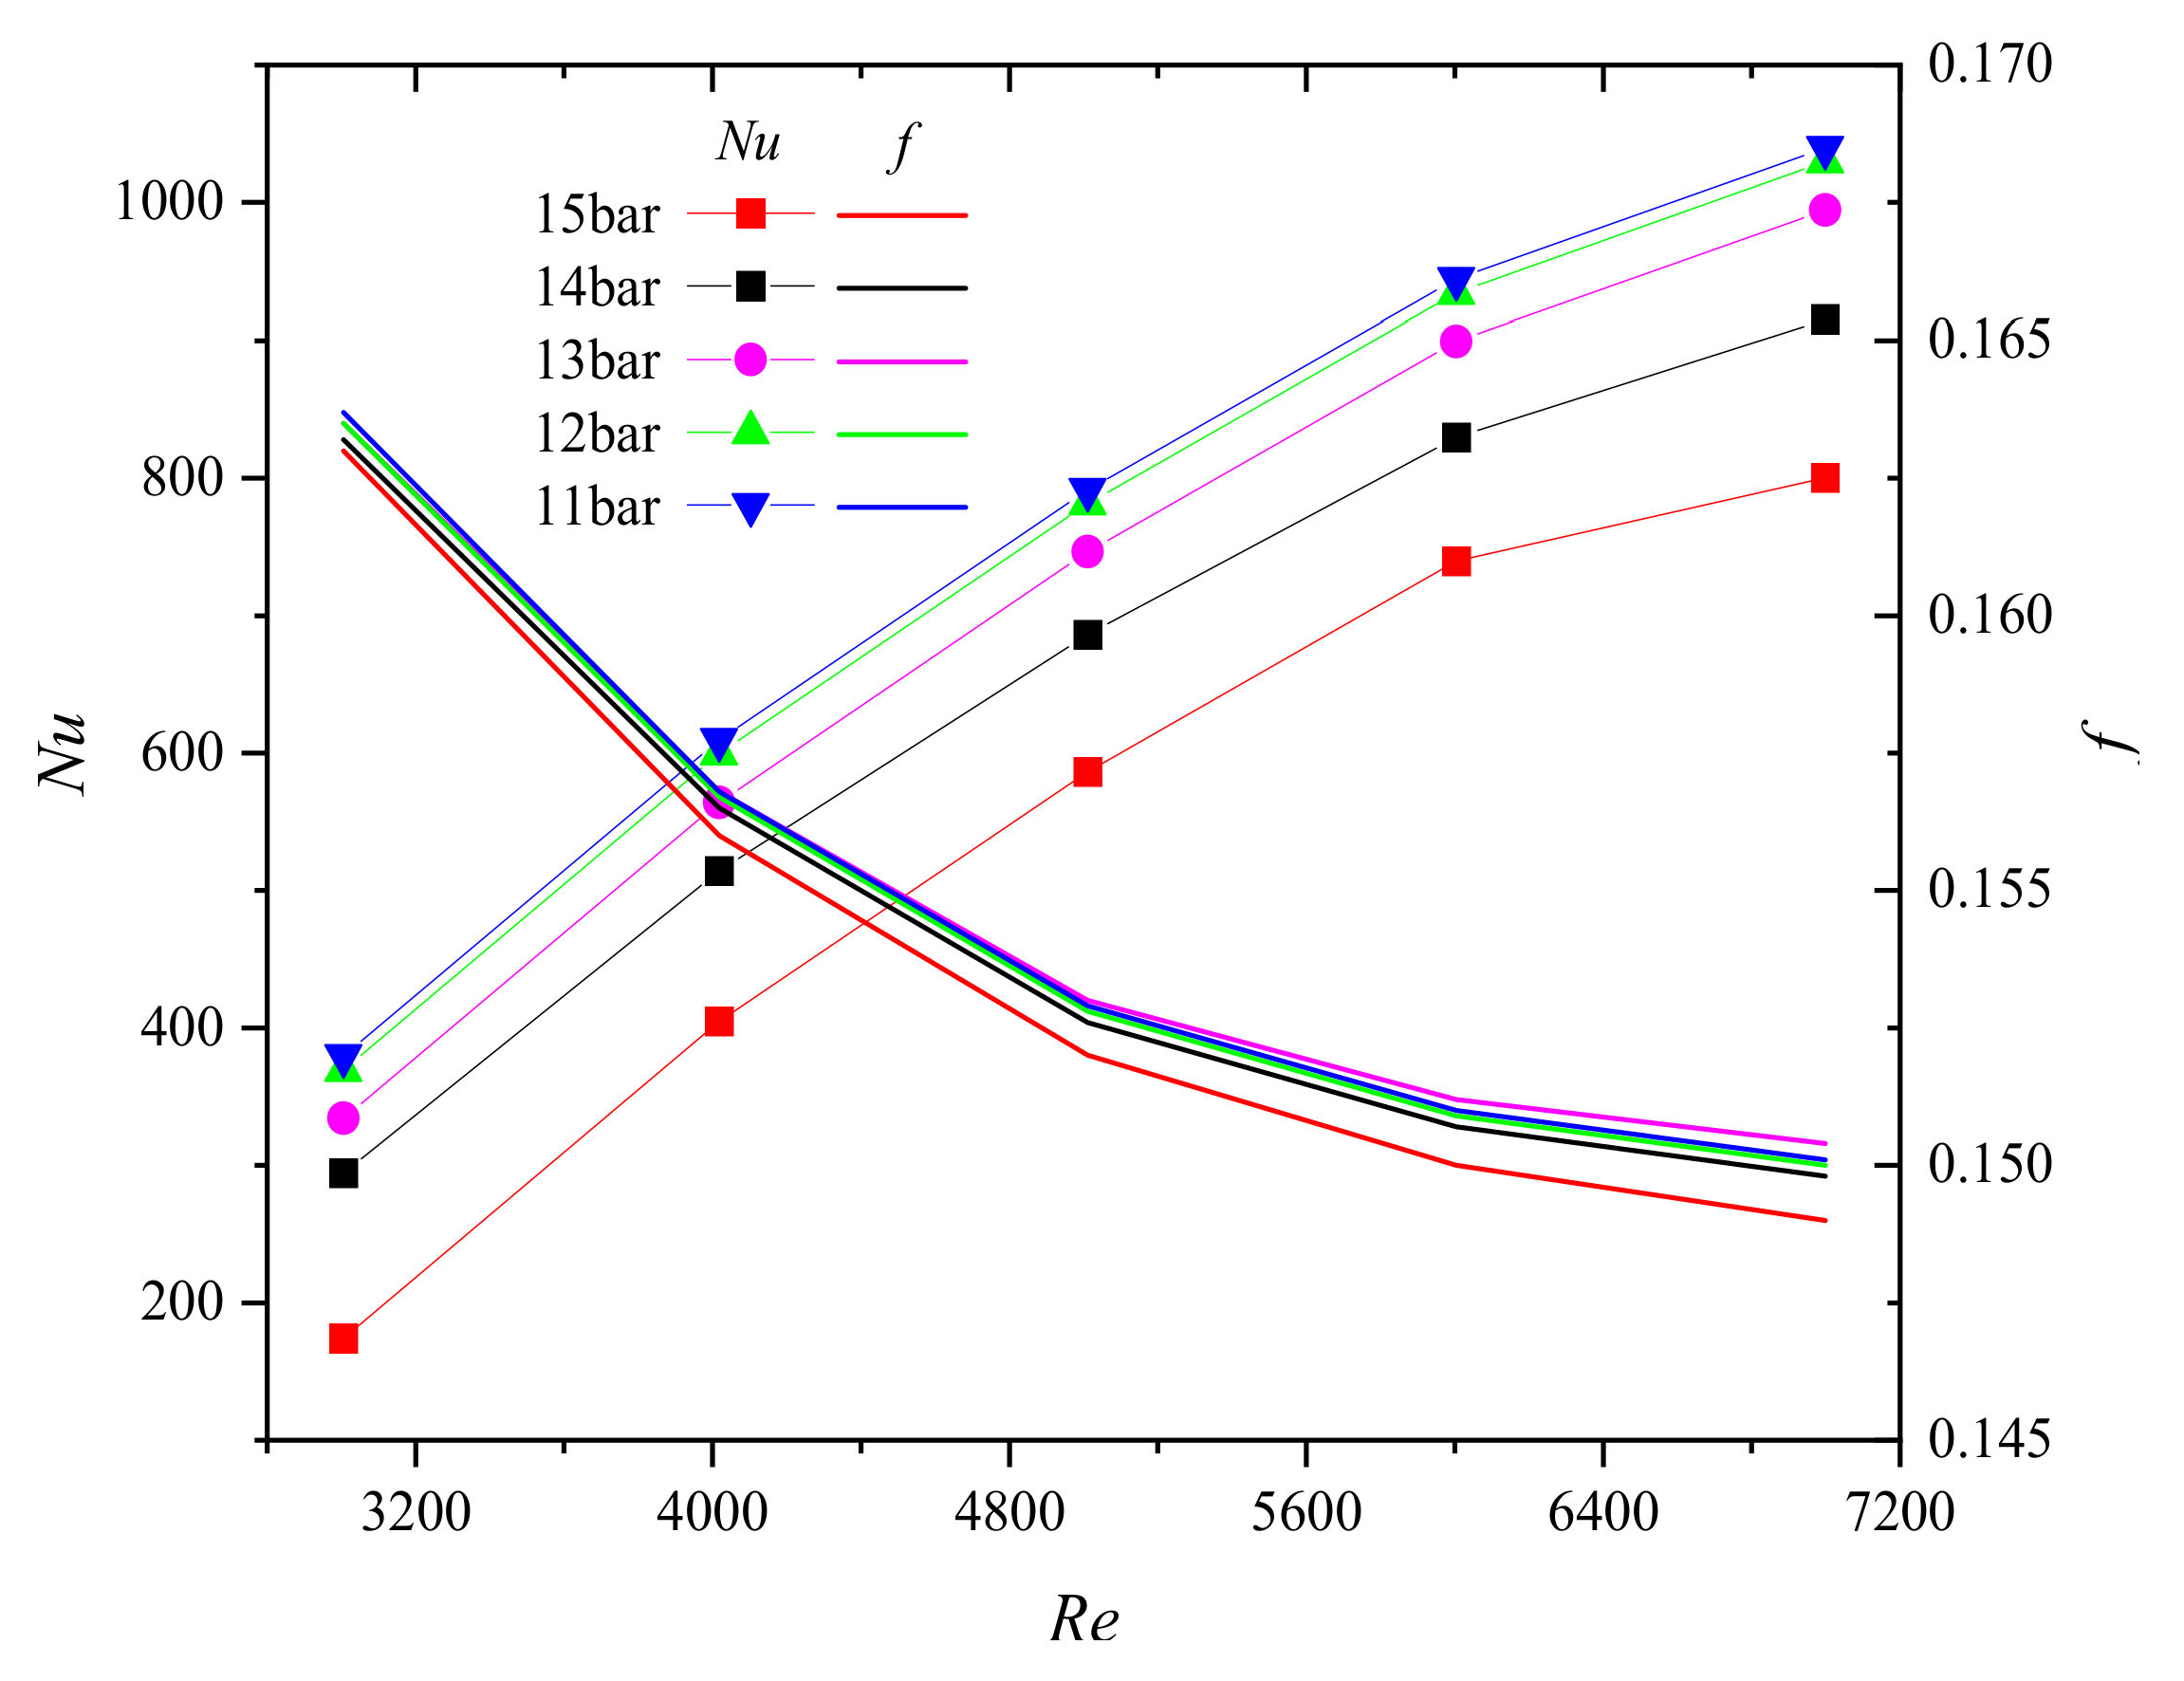
3.4. Effect of Pressure on Heat Transfer
4. Conclusions
- The sensitivity degree of factors affecting the heat transfer characteristics of liquid hydrogen are in sequence of inlet mass flow, beam power and operating pressure.
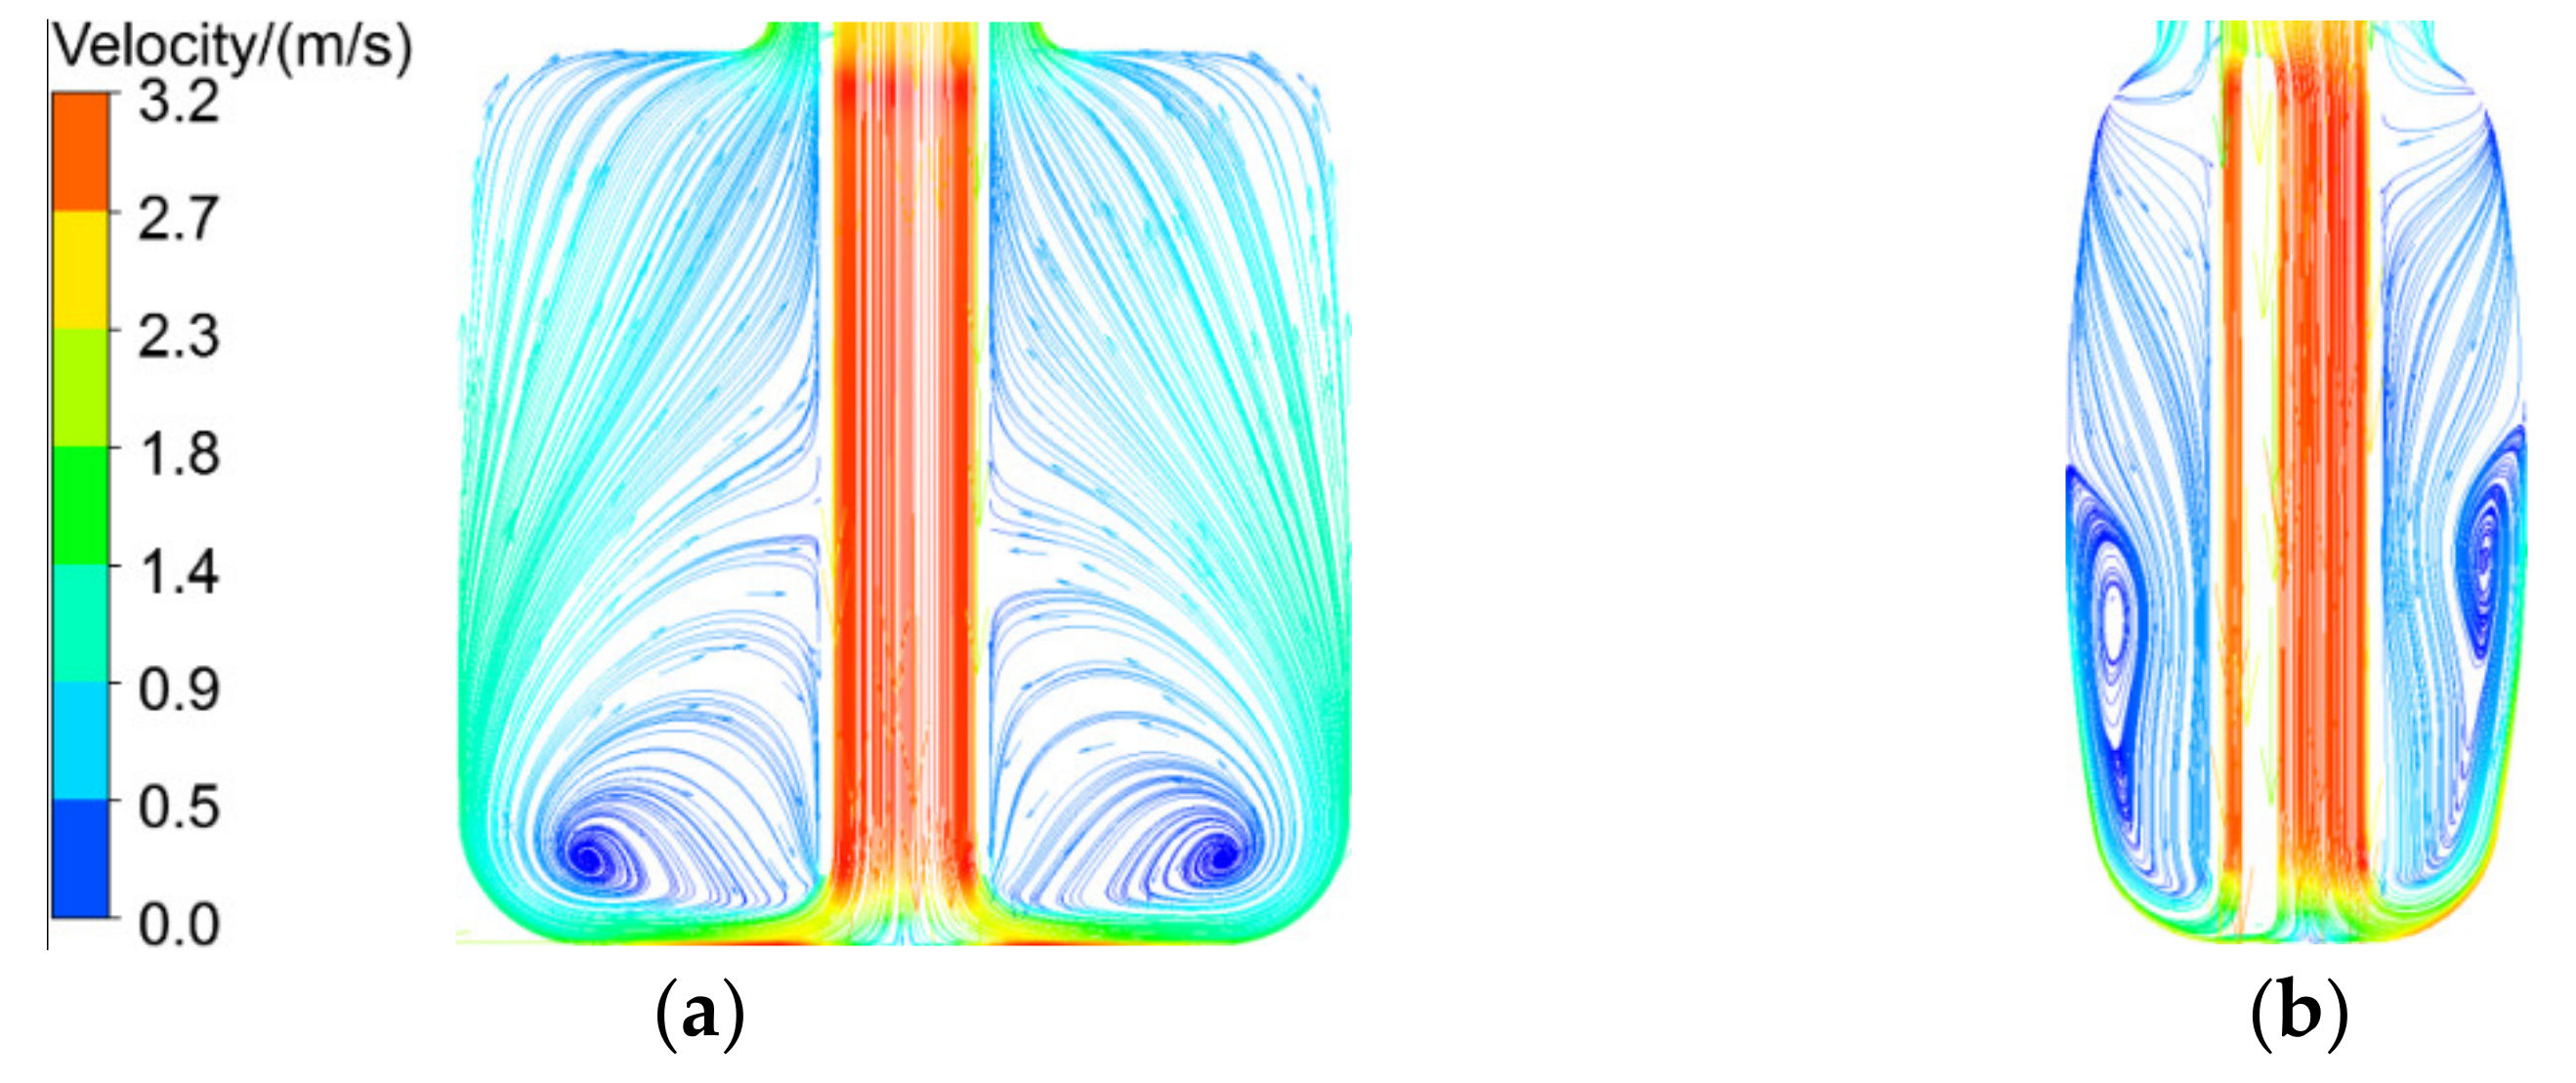
- The temperature tends to be stable and pressure loss increases gradually when the mass flow rate exceeds a certain range, especially when the beam power is 500 kW (the temperature range of liquid hydrogen is about 20~30 K); the cooling effect is best in the range of 60~90 g/s × 394 mm2.
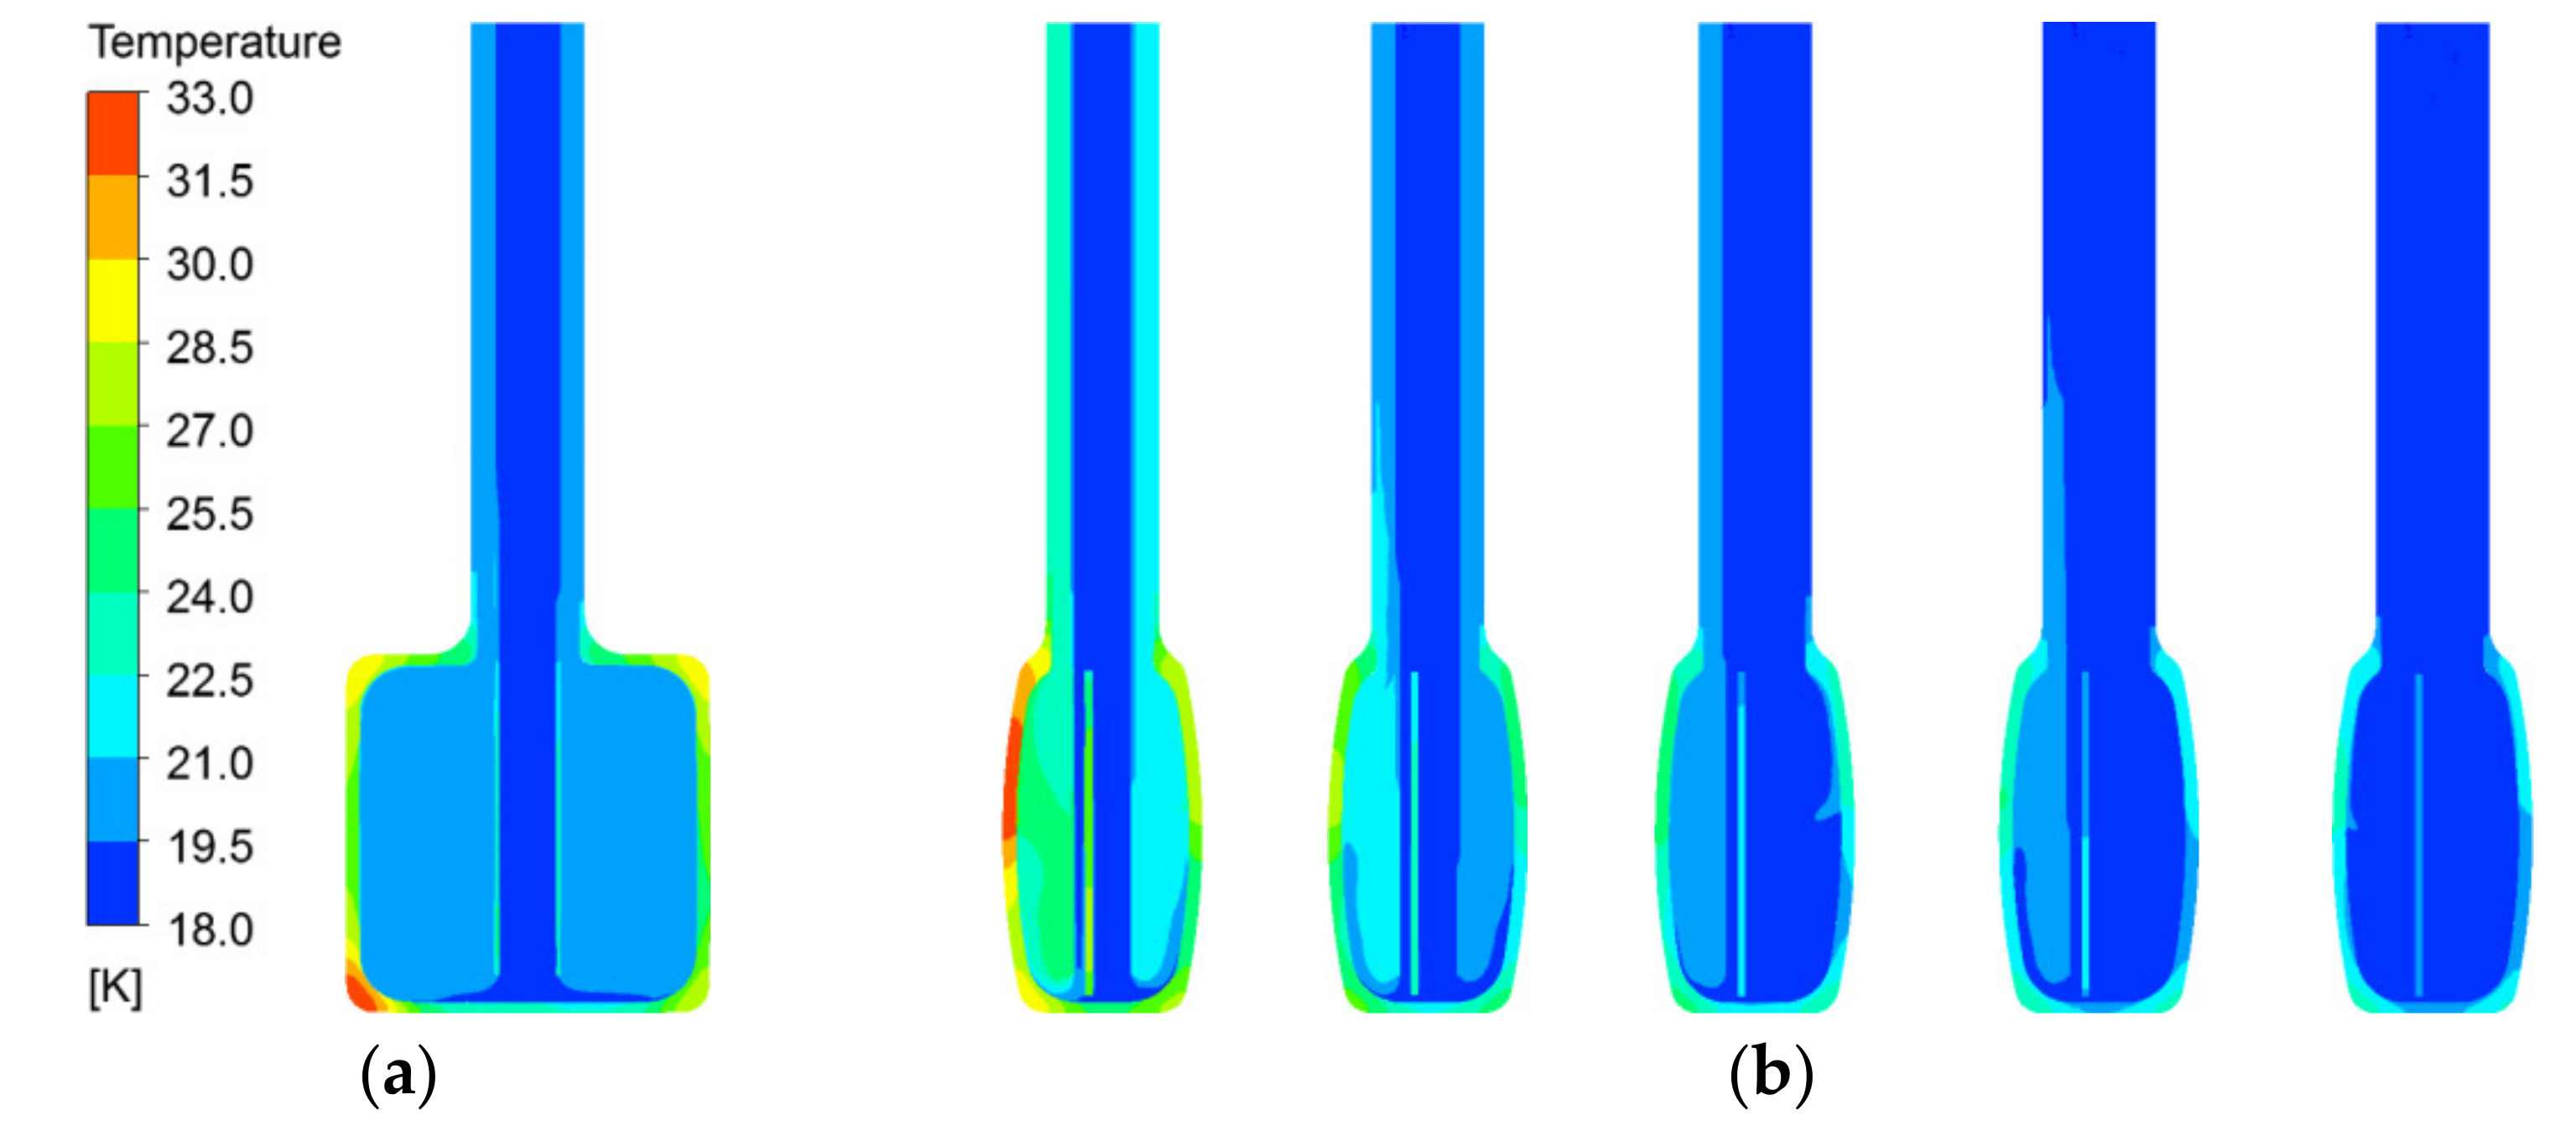
- With the beam power increasing, the maximum temperature of the container, poisoned plate and hydrogen maintain the linear growth trend. The maximum temperature of liquid hydrogen is close to the bottom recirculation zone due to the influence of the flow field and the heat deposition distribution of the poisoned plate.
- As the pressure increased, there was no significant difference in trends of the bulk temperature, Tb, of liquid hydrogen, whereas, near the large specific heat region of 15 bar, the wall temperature Tw exhibited a sudden enhancement.
Author Contributions
Funding
Institutional Review Board Statement
Informed Consent Statement
Conflicts of Interest
Nomenclature
| T | bulk fluid temperature, K |
| E | total energy, kJ/kg |
| P | static pressure, Pa |
| R | molecular gas constant, J/(mol·K) |
| L | characteristic length, mm |
| H | bulk fluid enthalpy, kJ/kg |
| Nu | Nussel number, |
| Cf | boundary layer friction coefficient |
| Re | Reynolds number |
| Sh | volumetric heat source, W/m3 |
| Tw | averaging temperature of wall, K |
| Tc | critical temperature, K |
| Tb | bulk temperature of fluid, K |
| Tr | reference temperature, K |
| Uτ | shear velocity, m/s |
| α | temperature dependence function (alpha function) |
| ac | critical attractive parameter, MPa·m6·k·mol−2 |
| b | molar co-volume, m3·k·mol−1 |
| p | ideal gas pressure, Pa |
| u | bulk fluid velocity, m/s |
| h | heat transfer coefficient, W/m2·K |
| f | resistance coefficient, - |
| w | bulk fluid axial velocity, m/s |
| ρ | density, kg/m3 |
| λ | thermal conductivity of the fluid, W/m·K−1 |
| ω | acentric factor, - |
| μ | dynamic viscosity, Pa·S |
| τ | shear stress, N/m2 |
| pc | critical pressure, K |
| Cp | Specific heat capacity, J/kg·K−1 |
| vPR | the molar volume, L |
| λeff | effective thermal conductivity, W/m·K−1 |
| τeff | effective stress tensor, N/m2 |
| τw | boundary layer shear stress, N/m2 |
| c1,c2,c3 | coefficients of the Mathias and Copeman alpha function |
References
- Wei, J.; Chen, H.S.; Chen, Y.W.; Chen, Y.B.; Chi, Y.L.; Deng, C.D.; Dong, H.Y.; Dong, L.; Fang, S.X.; Feng, J.; et al. China Spallation Neutron Source: Design, R&D, and outlook. Nucl. Instrum. Methods Phys. Res. A 2009, 600, 10–13. [Google Scholar]
- Wang, F.W.; Jia, X.J.; Liang, T.J.; He, C.H.; Yin, W.; Zhang, S.Y.; Zhu, T.; Yu, Q.Z.; Wang, P. Physical design of the target station and spectrometers for a spallati-on neutron source. Physics 2008, 34, 449–453. [Google Scholar]
- Wang, F.W.; Yan, Q.W.; Liang, T.J.; Yin, W.; Zhang, P.L.; Fu, S.N.; Tang, J.Y.; Fang, S.S.; Zhang, Z.; Zhang, J. Netron Scattering and Spallation Neutron Source. Physics 2005, 34, 731–738. [Google Scholar]
- Wang, G.P.; Xiao, J.; He, K.; Li, S.P. Conceptual design of cryogenic system for Chinese Spallation Neutron Source. Cryogenics 2009, 5, 27–30. [Google Scholar]
- He, C.C.; He, K.; Wang, G.P. Hydrogen safety design of cryogenic system for Chinese Spallation Neutron Source. Cryogenics 2010, 6, 1–5. [Google Scholar]
- Zhao, K.; Yang, G.P.; Shen, J.; Zhang, Z.; Chen, J. Experimental study on adjustment system of liquid hydrogen density. Cryogenics 2018, 2, 45–50. [Google Scholar]
- Wang, G.P.; Xiao, J.; Zhang, Y.; Qiu, Y.N.; Hu, Z.J.; Ding, M.Y.; Sang, M.J.; Li, S.P. Pressure control design of Chinese Spallation Neutron Source supercritical hydrogen circulation system. Vacuum&Cryogenics 2011, 1, 251–256. [Google Scholar]
- Huang, D.; Wu, Z.; Sunden, B.; Li, W. A brief review on convection heat transfer of fluids at supercritical pressures in tubes and the recent progress. Appl. Energ. 2016, 162, 494–505. [Google Scholar] [CrossRef]
- Mohseni, M.; Bazargan, M. A New Correlation for the Turbulent Prandtl Number in Upward Rounded Tubes in Supercritical Fluid Flows. J. Heat Transf. 2016, 138, 081701. [Google Scholar] [CrossRef]
- Du, X.; Lv, Z.; Yu, X.; Cao, M.; Zhou, J.; Ren, Y.; Qiu, Q.; Zhu, X. Heat transfer of supercritical CO2 in vertical round tube: A considerate turbulent Prandtl number modification. Energy 2020, 192, 116612. [Google Scholar] [CrossRef]
- Qiu, Q.; Du, X.; Zhao, S.; Zhu, X.; Shen, S. Numerical study on heat transfer of SCW near the pseudo-critic-al temperature in a hexagon sub-channel. Nucl. Eng. Des. 2018, 331, 263–273. [Google Scholar] [CrossRef]
- Wang, Z.W.; Qi, G.L.; Li, M.J. Numerical Investigation of Heat Transfer to Supercritical Water in Vertical Tube under Semicircular Heating Condition. Energies 2019, 12, 3958. [Google Scholar] [CrossRef] [Green Version]
- Zhu, X.J.; Zhang, R.Z.; Yu, X.; Cao, M.G.; Ren, Y.X. Numerical Study on the Gravity Effect on Heat Transfer of Supercritical CO2 in a Vertical Tube. Energies 2020, 13, 3502. [Google Scholar] [CrossRef]
- Kim, D.E.; Kim, M.H. Experimental study of the effects of flow acceleration and buoyancy on heat transfer in a supercritical fluid flow in a circular tube. Nucl. Eng. Des. 2010, 240, 3336–3349. [Google Scholar] [CrossRef]
- Youn, B.; Mills, A.F. Flow of Supercritical Hydrogen in a Uniformly Heated Circular Tube. Numer. Heat Transfer Part A Appl. 1993, 24, 1–24. [Google Scholar] [CrossRef]
- Locke, J.M.; Landrum, D.B. Study of Heat Transfer Correlations for Supercritical Hydrogen in Regenerative Cooling Channels. J. Propul. Power 2008, 24, 94–102. [Google Scholar] [CrossRef]
- Freels, J.D. COMSOL Validation Progress on Supercritical Hydrogen Heat Transfer. In Proceedings of the COMSOL Multiphysics Conference 2007 Proceedings, COMSOL, Boston, MA, USA, October 2007; Dravid, V., Ed.; pp. 341–347. [Google Scholar]
- Xie, P.Y.; Zhang, X.B. A method of rib-bed plate enhancing heat transfer in hydrogen rocket engine chamber wall. Int. J. Hydrogen Energy 2019, 44, 20504–20515. [Google Scholar] [CrossRef]
- Xie, P.Y.; Zhang, X.B. Enhancement heat transfer analysis of supercritical hydrogen fuel in small-scale channels with spherical concave. Int. J. Therm. Sci. 2020, 152, 106287. [Google Scholar] [CrossRef]
- Xie, P.Y.; Zhang, X.B. Turbulent heat transfer analysis in supercritical hydrogen fuel flow considering thermal stratification. Numer. Heat Transfer Part A. Appl. 2020, 77, 913–929. [Google Scholar] [CrossRef]
- Mosavati, B.; Mosavati, M.; Kowsary, F. Solution of radiative inverse boundary design problem in a combined radiating-free convecting furnace. Int. Commun. Heat Mass 2013, 45, 130–136. [Google Scholar] [CrossRef]
- Mosavati, B.; Mosavati, M.; Kowsary, F. Inverse boundary design solution in a combined radiating-free convecting furnace filled with participating medium containing specularly reflecting walls. Int. Commun. Heat Mass 2016, 76, 69–76. [Google Scholar] [CrossRef]
- Bolek, A.; Bayraktar, S. Flow and heat transfer investigation of a circular jet issuing on different types of surfaces. Sadhana Acad. P. Eng. 2019, 44, 242–252. [Google Scholar] [CrossRef] [Green Version]
- Tong, J.F.; Wang, J.L.; Zhang, H.C.; Ji, Y.; Tan, H.P. Three dimensional numerical simulation of thermal-hydraulic behaviors of CSNS decoupled poisoned hydrogen moderator with non-uniform heat source. In Proceedings of the ASME 2016 24th International Conference on Nuclear Engineering, Charlotte, NC, USA, 26–30 June 2016; pp. 1–6. [Google Scholar]
- Pelowitz, D.B. MCNPX User’ S Manual Version 2.5.0; Los Alamos National Laboratory: Los Alamos, NM, USA, 2005. [Google Scholar]
- ANSYS Inc. ANSYS CFX Reference Guide, Release 11.0; ANSYS Inc.: Canonsburg, PA, USA, 2006. [Google Scholar]
- Versteeg, H.; Malalasekra, W. An Introduction to Computational Fluid Dynamics: The Finite Volume Method, 2nd ed.; Prentice Hall: Hoboken, NJ, USA, 2007. [Google Scholar]
- Bae, J.H.; Yoo, J.Y. Direct numerical simulation of turbulent supercritical flows with heat transfer. Phys. Fluids 2005, 17, 105104. [Google Scholar] [CrossRef]
- Hirsch, C. Numerical Computation of Internal and External Flows. In Fundamentals of Computational Fluid Dynamics, 2nd ed.; Hirsch John Wiley & Sons Ltd.: New York, NY, USA, 2007; Volume 1. [Google Scholar]
- Tao, W.Q. Numerical Heat Transfer, 2nd ed.; Xi’an Jiaotong University Press: Xi’an, China, 2001. [Google Scholar]
- Yan, X.; Baugn, J.W.; Mesbath, M. The effect of reynolds number on the heat transfer distribution from a flat Plate to an impinging jet. In Proceedings of the ASME Winter Annual Meeting, Anaheim, CA, USA, 1992; Volume 226, pp. 1–7. [Google Scholar]
- Roache, P.J. Perspective: A method for uniform reporting of grid refinement studies. J. Fluids Eng. 1994, 116, 405–413. [Google Scholar] [CrossRef]
- Tong, J.F.; Wang, S.L.; Yin, W.; Lu, Y.L.; Yu, Q.Z.; Hu, C.M.; Yu, C.J.; Du, W.T.; Yao, C.J.; Liang, T.J. Neutronics/Thermal-Hydraulic Coupling for CSNS Decoupled Posioned Hydrogen Moderator. J. Eng. Thermophysrus. 2013, 34, 905–909. [Google Scholar]
- Boublik, T. The BACK equation of state for hydrogen and related compounds. Fluid Phase Equilib 2005, 240, 96–100. [Google Scholar] [CrossRef]
- Peng, D.Y.; Robinson, D.P. A new two-constant equation of state. Ind. Eng. Chem. Fundam. 1976, 15, 59–64. [Google Scholar] [CrossRef]
- Khashayar, N. Comparative study of eleven equations of state in predicting the thermodynamic properties of hydrogen. Int. J. Hydrogen Eng. 2010, 35, 3802–3811. [Google Scholar]
- Mathias, P.M.; Copeman, T.W. Extension of the Peng-Robinson equation-of-state to complex mixtures: Evaluation of the various forms of the local composition concept. Fluid Phase Equilib 1983, 13, 91–108. [Google Scholar] [CrossRef]
- McCarty, R.D.; Arp, V.; Fox, J.R. GASPAK Version 3.35/3.45; CRYODATA Inc.: Littleton, CO, USA, 2007. [Google Scholar]
- Flourusse, L.J.; Peters, C.J.; Pamies, J.C.; Vega, L.F.; Meijer, H. Solubility of hydrogen in heavy n-alkanes: Experiments and SAFT modeling. AIChE. J. 2003, 49, 3260–3269. [Google Scholar] [CrossRef]


| Structure | CFX | MCNPX |
|---|---|---|
| Liquid hydrogen Poisoned plate Aluminum coating The container | 332 43 44 389 | 324 40 43 385 |
Publisher’s Note: MDPI stays neutral with regard to jurisdictional claims in published maps and institutional affiliations. |
© 2021 by the authors. Licensee MDPI, Basel, Switzerland. This article is an open access article distributed under the terms and conditions of the Creative Commons Attribution (CC BY) license (https://creativecommons.org/licenses/by/4.0/).
Share and Cite
Tong, J.; Zhu, L.; Lu, Y.; Liang, T.; Lu, Y.; Wang, S.; Yu, C.; Dong, S.; Tan, H. Heat Transfer Analysis in Supercritical Hydrogen of Decoupled Poisoned Hydrogen Moderator with Non-Uniform Heat Source of Chinese Spallation Neutron Source. Energies 2021, 14, 4547. https://doi.org/10.3390/en14154547
Tong J, Zhu L, Lu Y, Liang T, Lu Y, Wang S, Yu C, Dong S, Tan H. Heat Transfer Analysis in Supercritical Hydrogen of Decoupled Poisoned Hydrogen Moderator with Non-Uniform Heat Source of Chinese Spallation Neutron Source. Energies. 2021; 14(15):4547. https://doi.org/10.3390/en14154547
Chicago/Turabian StyleTong, Jianfei, Lingbo Zhu, Yiping Lu, Tianjiao Liang, Youlian Lu, Songlin Wang, Chaoju Yu, Shikui Dong, and Heping Tan. 2021. "Heat Transfer Analysis in Supercritical Hydrogen of Decoupled Poisoned Hydrogen Moderator with Non-Uniform Heat Source of Chinese Spallation Neutron Source" Energies 14, no. 15: 4547. https://doi.org/10.3390/en14154547
APA StyleTong, J., Zhu, L., Lu, Y., Liang, T., Lu, Y., Wang, S., Yu, C., Dong, S., & Tan, H. (2021). Heat Transfer Analysis in Supercritical Hydrogen of Decoupled Poisoned Hydrogen Moderator with Non-Uniform Heat Source of Chinese Spallation Neutron Source. Energies, 14(15), 4547. https://doi.org/10.3390/en14154547