
Design Procedure to Convert a Maximum Power Point Tracking Algorithm into a Loop Control System

 , ,
, ,
Abstract
:
1. Introduction
2. Materials and Methods
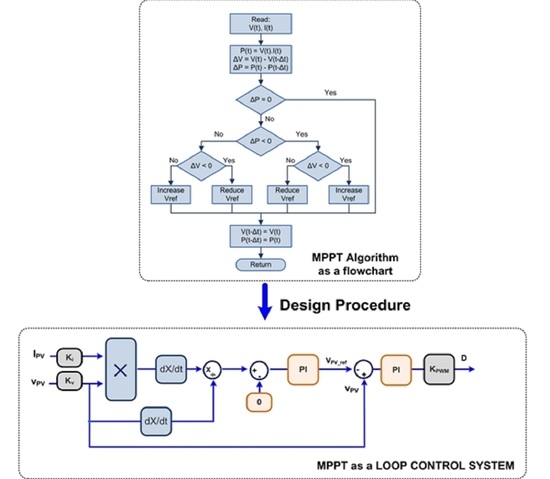
2.1. MPPT Rules
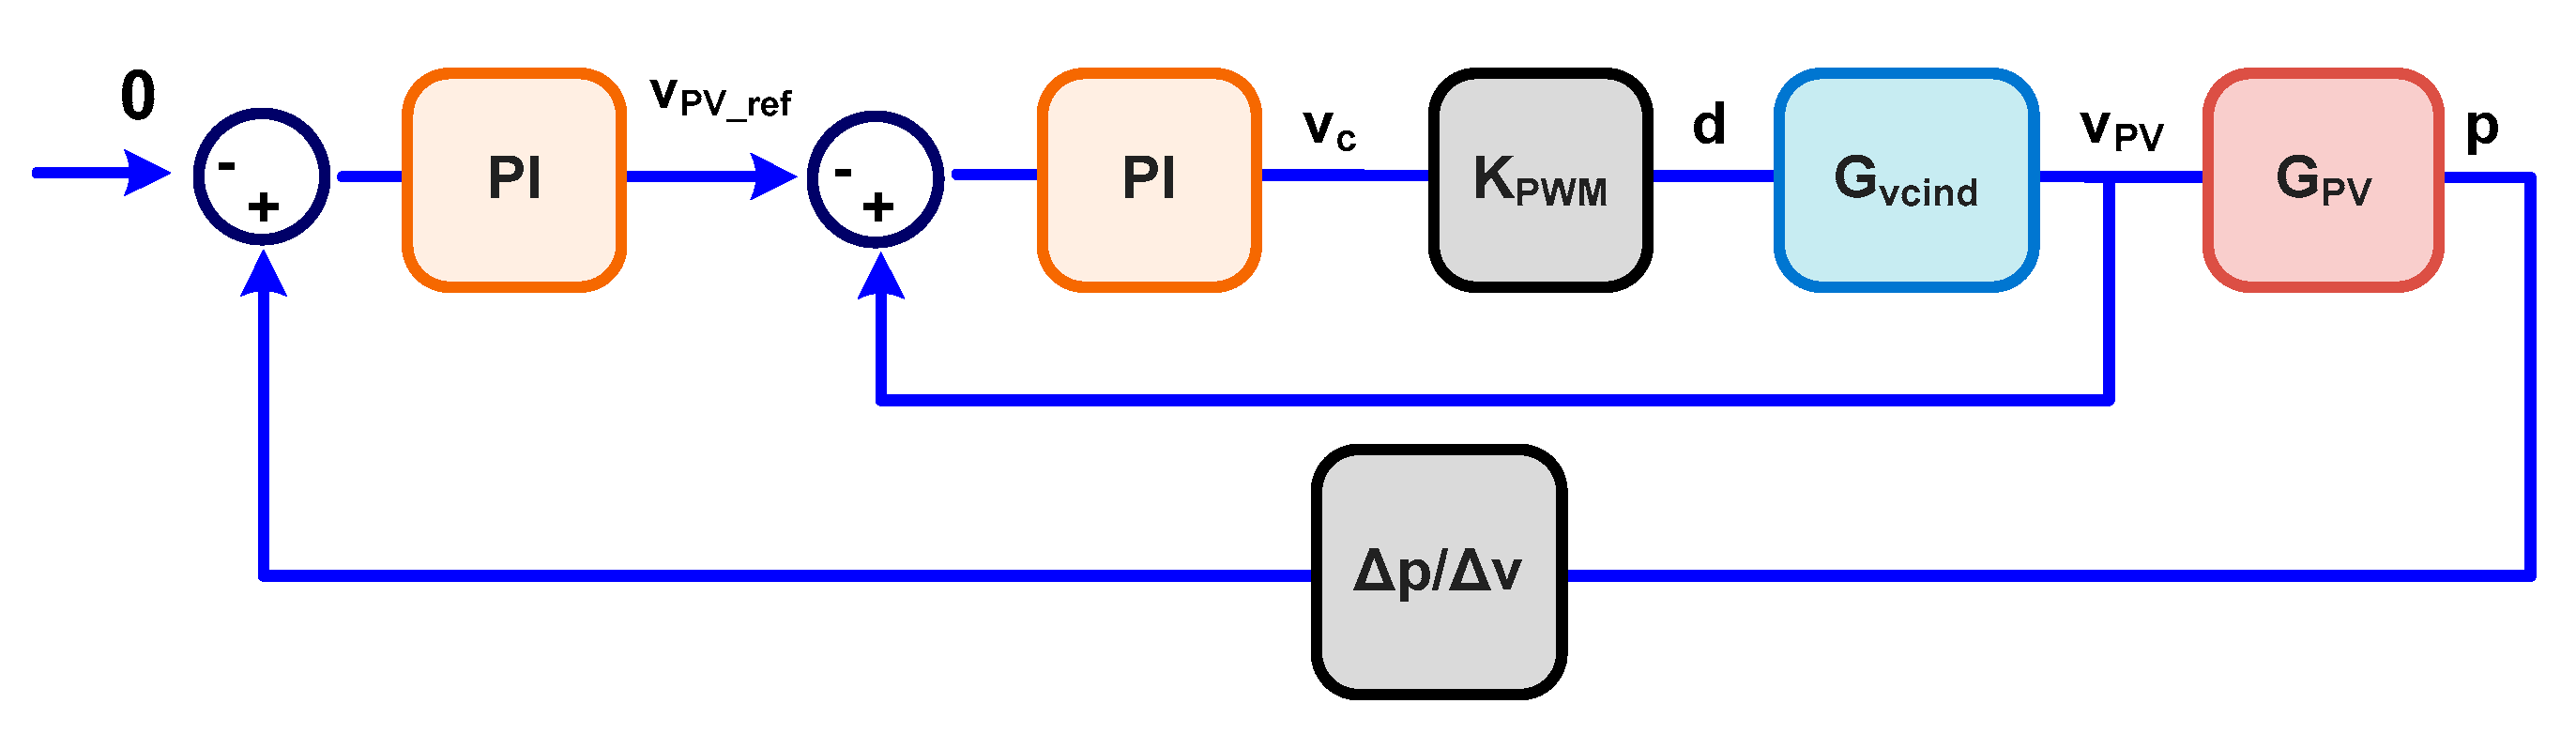
2.2. Controlled MPPT Transfer Functions
3. Results and Discussions
4. Conclusions
Author Contributions
Funding
Institutional Review Board Statement
Informed Consent Statement
Data Availability Statement
Acknowledgments
Conflicts of Interest
References
- Liserre, E.M.; Sauter, T.; Hung, J.Y. Future Energy Systems: Integrating Renewable Energy Sources into the Smart Power Grid through Industrial Electronics. IEEE Trans. Ind. Electron. 2010, 4, 18–37. [Google Scholar] [CrossRef]
- Kwon, J.; Nam, K.; Kwon, B. Photovoltaic power conditioning system with line connection. IEEE Trans. Ind. Electron. 2006, 53, 1048–1054. [Google Scholar] [CrossRef]
- IRENA–International Renewable Energy Agency. Future of Solar Photovoltaic: Deployment, Investment, Technology, Grid Integration and Socio-Economic Aspects; IRENA–International Renewable Energy Agency: Abu Dhabi, United Arab Emirates, 2019; pp. 1–73. [Google Scholar]
- Philipps, S.; Warmuth, W. Fraunhofer Institute for Solar Energy Systems: Photovoltaics Report; PSE Projects GmbH: Freiburg, Germany, 2020; pp. 1–49. [Google Scholar]
- NREL-National Renewable Energy Laboratory. Photovoltaic Research: Best Research-Cell Efficiency Chart. 2019. Available online: nrel.gov/pv/cell-efficiency.html (accessed on 5 April 2021).
- Esram, T.; Chapman, P.L. Comparison of Photovoltaic Array Maximum Power Point Tracking Techniques. IEEE Trans. Energy Convers. 2007, 22, 439–449. [Google Scholar] [CrossRef] [Green Version]
- De Brito, M.A.G.; Galotto, L.; Sampaio, L.P.; Melo, G.D.A.; Canesin, C.A. Evaluation of the Main MPPT Techniques for Photovoltaic Applications. IEEE Trans. Ind. Electron. 2013, 60, 1156–1167. [Google Scholar] [CrossRef]
- Femia, N.; Petrone, G.; Spagnuolo, G.; Vitelli, M. Optimization of perturb and observe maximum power point tracking method. IEEE Trans. Power Electron. 2005, 20, 963–973. [Google Scholar] [CrossRef]
- Liu, F.; Kang, Y.; Zhang, Y.; Duan, S. Comparison of P&O and Hill Climbing MPPT Methods for Grid-Connected PV Converter. In Proceedings of the IEEE Conference on Industrial Electronics and Applications, Singapore, 3–5 June 2008; pp. 804–807. [Google Scholar]
- Yu, W.L.; Lee, T.P.; Wu, G.H.; Chen, Q.S.; Chiu, H.J.; Lo, Y.K.; Shih, F. A DSP-based single-stage maximum power point tracking PV inverter. In Proceedings of the Twenty-Fifth Annual IEEE Applied Power Electronics Conference and Exposition (APEC), Palm Springs, CA, USA, 21–25 February 2010; Volume 25, pp. 948–952. [Google Scholar]
- Abdelsalam, A.K.; Massoud, A.M.; Ahmed, S.; Enjeti, P.N. High-performance adaptive perturb and observe MPPT technique for photovoltaic-based microgrids. IEEE Trans. Power Electron. 2011, 26, 1010–1021. [Google Scholar] [CrossRef]
- Tafticht, T.; Agbossou, K.; Doumbia, M.L.; Cheriti, A. An improved maximum power point tracking method for photovoltaic systems. Renew. Energy 2008, 33, 1508–1516. [Google Scholar] [CrossRef]
- Alik, R.; Jusoh, A. Modified Perturb and Observe (P&O) with checking algorithm under various solar irradiation. Sol. Energy 2017, 148, 128–139. [Google Scholar]
- Zhu, Y.; Kim, M.K.; Wen, H. Simulation and Analysis of Perturbation and Observation-Based Self-Adaptable Step Size Maximum Power Point Tracking Strategy with Low Power Loss for Photovoltaics. Energies 2019, 12, 92. [Google Scholar] [CrossRef] [Green Version]
- Elbaset, A.A.; Ali, H.; Abd-El Sattar, M.; Khaled, M. Implementation of a modified perturb and observe maximum power point tracking algorithm for photovoltaic system using an embedded microcontroller. IET Renew. Power Gener. 2016, 10, 551–560. [Google Scholar] [CrossRef]
- Lee, H.-S.; Yun, J.-J. Advanced MPPT Algorithm for Distributed Photovoltaic Systems. Energies 2019, 12, 3576. [Google Scholar] [CrossRef] [Green Version]
- Al-Dhaifallah, M.; Nassef, A.M.; Rezk, H.; Nisar, K.S. Optimal parameter design of fractional order control based INC-MPPT for PV system. Sol. Energy 2018, 159, 650–664. [Google Scholar] [CrossRef]
- Hsieh, G.C.; Chen, H.L.; Chen, Y.; Tsai, C.M.; Shyu, S.S. Variable frequency controlled incremental conductance derived MPPT photovoltaic stand-along DC bus system. In Proceedings of the Twenty-Third Annual IEEE Applied Power Electronics Conference and Exposition, Austin, TX, USA, 24–28 February 2008; Volume 23, pp. 1849–1854. [Google Scholar]
- Liu, F.; Duan, S.; Liu, F.; Liu, B.; Kang, Y. A variable step size INC MPPT method for PV systems. IEEE Trans. Ind. Electron. 2008, 55, 2622–2628. [Google Scholar]
- Tey, K.S.; Mekhilef, S. Modified Incremental Conductance Algorithm for Photovoltaic System under Partial Shading Conditions and Load Variation. IEEE Trans. Ind. Electron. 2014, 61, 5384–5392. [Google Scholar]
- Sivakumar, P.; Kader, A.A.; Kaliavaradhan, Y.; Arutchelvi, M. Analysis and enhancement of PV efficiency with incremental conductance MPPT technique under non-linear loading conditions. Renew. Energy 2015, 81, 543–550. [Google Scholar] [CrossRef]
- Jain, S.; Agarwal, V. A new algorithm for rapid tracking of approximate maximum power point in photovoltaic systems. IEEE Power Electron. Lett. 2004, 2, 16–19. [Google Scholar] [CrossRef]
- Li, X.; Wen, H.; Hu, Y.; Jiang, L. A novel beta parameter based fuzzy-logic controller for photovoltaic MPPT application. Renew. Energy 2019, 130, 416–427. [Google Scholar] [CrossRef]
- Casadei, D.; Grandi, G.; Rossi, C. Single-phase single-stage photovoltaic generation system based on a ripple correlation control maximum power point tracking. IEEE Trans. Energy Convers. 2006, 21, 562–568. [Google Scholar] [CrossRef]
- Esram, T.; Kimball, J.W.; Krein, P.T.; Chapman, P.L.; Midya, P. Dynamic maximum power point tracking of photovoltaic arrays using ripple correlation control. IEEE Trans. Power Electron. 2006, 21, 1282–1291. [Google Scholar] [CrossRef]
- Ho, B.M.T.; Chung, H.S.H.; Lo, W.L. Use of system oscillation to locate the MPP of PV panels. IEEE Power Electron. Lett. 2004, 2, 1–5. [Google Scholar] [CrossRef]
- Ho, B.M.; Chung, H.S. An integrated inverter with maximum power tracking for grid-connected PV systems. IEEE Trans. Power Electron. 2005, 20, 953–962. [Google Scholar] [CrossRef]
- Scarpa, V.V.R.; Buzo, S.; Spiazzi, G. Low complexity MPPT technique exploiting the effect of the PV Module MPP Locus characterization. IEEE Trans. Ind. Electron. 2009, 56, 1531–1538. [Google Scholar] [CrossRef]
- Arsalan, M.; Iftikhar, R.; Ahmad, I.; Hasan, A.; Sabahat, K.; Javeria, A. MPPT for photovoltaic system using nonlinear backstepping controller with integral action. Sol. Energy 2018, 170, 192–200. [Google Scholar] [CrossRef]
- Kofinas, P.; Doltsinis, S.; Dounis, A.I.; Vouros, G.A. A reinforcement learning approach for MPPT control method of photovoltaic sources. Renew. Energy 2017, 108, 461–473. [Google Scholar] [CrossRef]
- Oubbati, B.K.; Boutoubat, M.; Rabhi, A.; Belkheiri, M. Experiential Integral Backstepping Sliding Mode Controller to achieve the Maximum Power Point of a PV system. Control Eng. Pract. 2020, 102, 104570. [Google Scholar] [CrossRef]
- Hosseinzadeh, M.; Salmasi, F.R. Robust Optimal Power Management System for a Hybrid AC/DC Micro-Grid. IEEE Trans. Sustain. Energy 2015, 6, 675–687. [Google Scholar] [CrossRef]
- Valenciaga, F.; Puleston, P.F.; Battaiotto, P.E. Power control of a photovoltaic array in a hybrid electric generation system using sliding mode techniques. IEE Proc. Control Theory Appl. 2001, 148, 448–455. [Google Scholar] [CrossRef]
- Chiu, C.-S.; Ouyang, Y.-L.; Ku, C.-Y. Terminal sliding mode control for maximum power point tracking of photovoltaic power generation systems. Sol. Energy 2012, 86, 2986–2995. [Google Scholar] [CrossRef]
- Daraban, S.; Petreus, D.; Morel, C. A novel MPPT (maximum power point tracking) algorithm based on a modified genetic algorithm specialized on tracking the global maximum power point in photovoltaic systems affected by partial shading. Energy 2014, 74, 374–388. [Google Scholar] [CrossRef]
- Brito, M.A.G.; Omine, L.T.; Pinto, J.O.P.; Garcia, R. Hybrid MPPT Algorithms for Photovoltaic Systems. In Proceedings of the 4th IEEE Southern Power Electronics Conference, Singapore, 10–13 December 2018; pp. 1–8. [Google Scholar]
- Ko, J.-S.; Huh, J.-H.; Kim, J.-C. Overview of Maximum Power Point Tracking Methods for PV System in Micro Grid. Electronics 2020, 9, 816. [Google Scholar] [CrossRef]
- Elobaid, L.M.; Abdelsalam, A.K.; Zakzouk, E.E. Artificial neural network-based photovoltaic maximum power point tracking techniques: A survey. IET Renew. Power Gener. 2015, 9, 1043–1063. [Google Scholar] [CrossRef]
- De Brito, M.A.G.; Alves, M.; Canesin, C.A. Hybrid MPP Solution for Double-Stage Photovoltaic Inverter. J. Control Autom. Electr. Syst. 2019, 30, 253–265. [Google Scholar] [CrossRef]
- Casaro, M.; Martins, D. Photovoltaic array model aimed to analyses in power electronics through simulation. Braz. J. Power Electron. 2008, 13, 141–146. [Google Scholar]
- Rashid, M. Power Electronics Handbook, 1st ed.; Academic Press: Cambridge, MA, USA, 2001; p. 892. [Google Scholar]
- Erickson, R.; Maksimovic, D.M. Fundamentals of Power Electronics, 2nd ed.; Springer: Kluwer Academic Publishers: Berlin, Germany, 2001; p. 882. [Google Scholar]
- Kjaer, S.B.; Pedersen, J.K.; Blaabjerg, F. A Review of Single-Phase Grid-Connected Inverters for Photovoltaic Modules. IEEE Trans. Ind. Appl. 2005, 41, 1292–1306. [Google Scholar] [CrossRef]
- Costanzo, L.; Vitelli, M. A Novel MPPT Technique for Single Stage Grid-Connected PV Systems: T4S. Energies 2019, 12, 4501. [Google Scholar] [CrossRef] [Green Version]


| Parameters | Quantities |
|---|---|
| Maximum power | Pmax = 200 Wp |
| Voltage at MPP | VMPP = 26.3 V |
| Current at MPP | IMPP = 7.61 A |
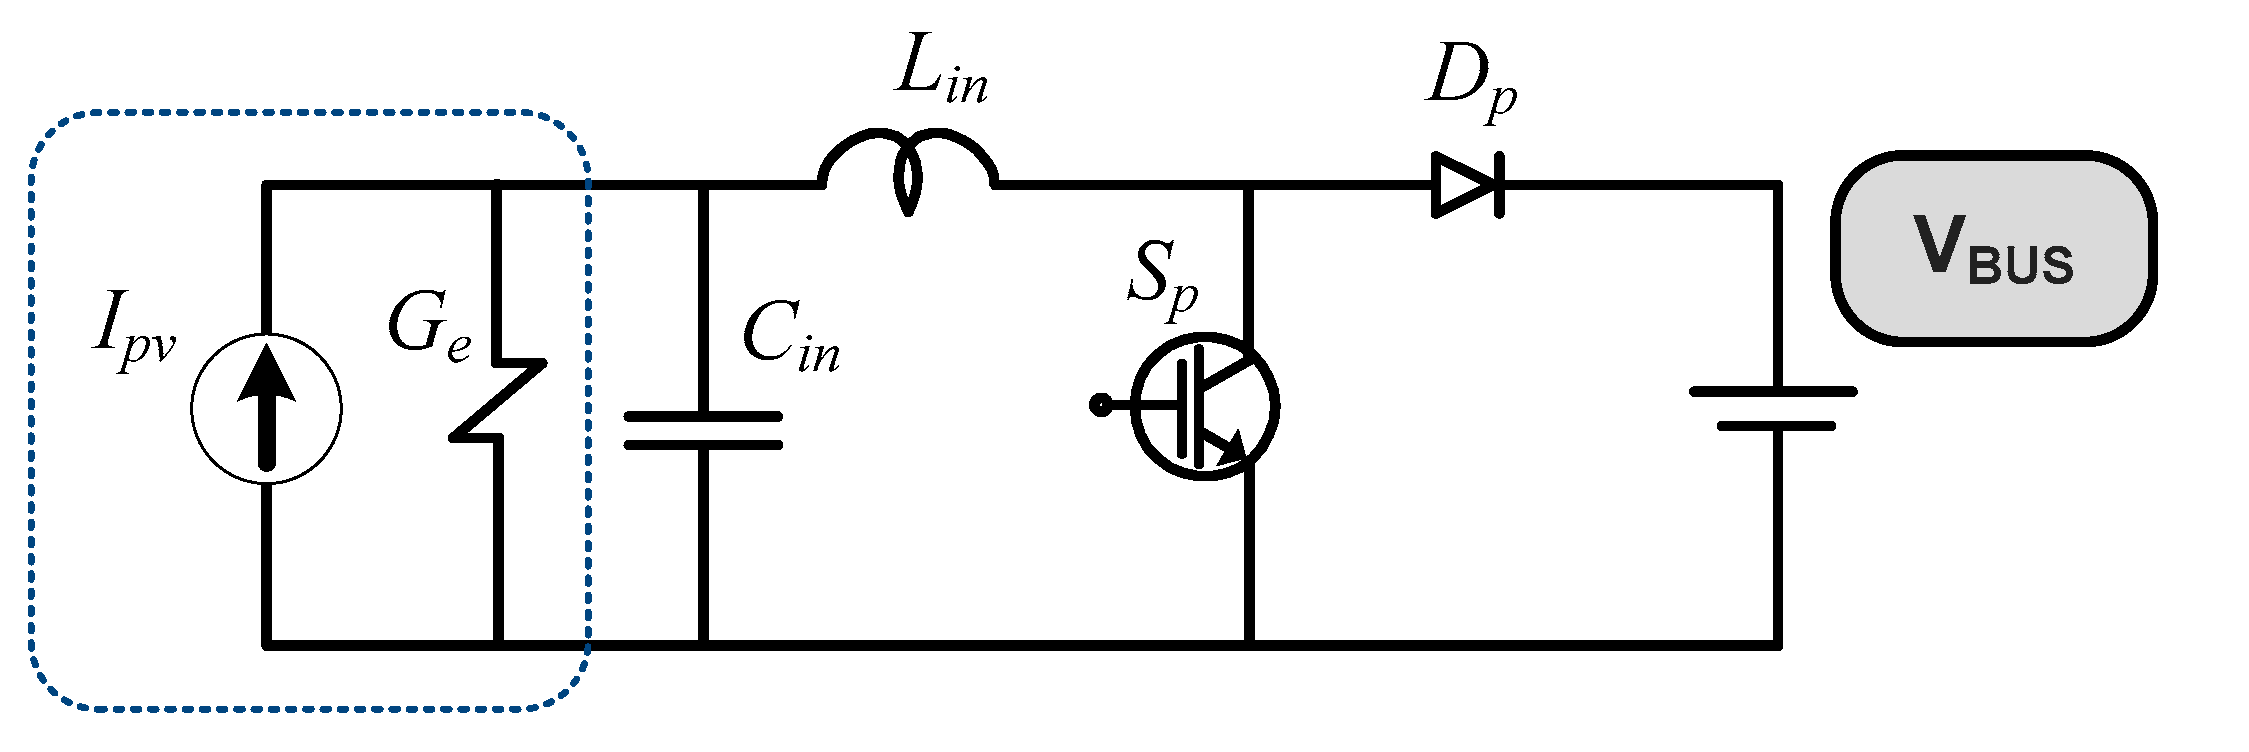
| Decoupling capacitance | Cin = 10 μF |
| Boost inductance | Lin = 2.5 mH |
| Boost load | RL = 50 Ω |
| Inductor resistance | rLin = 0.05 Ω |
| Conductance | Ge = 0.2894 s |
| Algorithms | TF [%] |
|---|---|
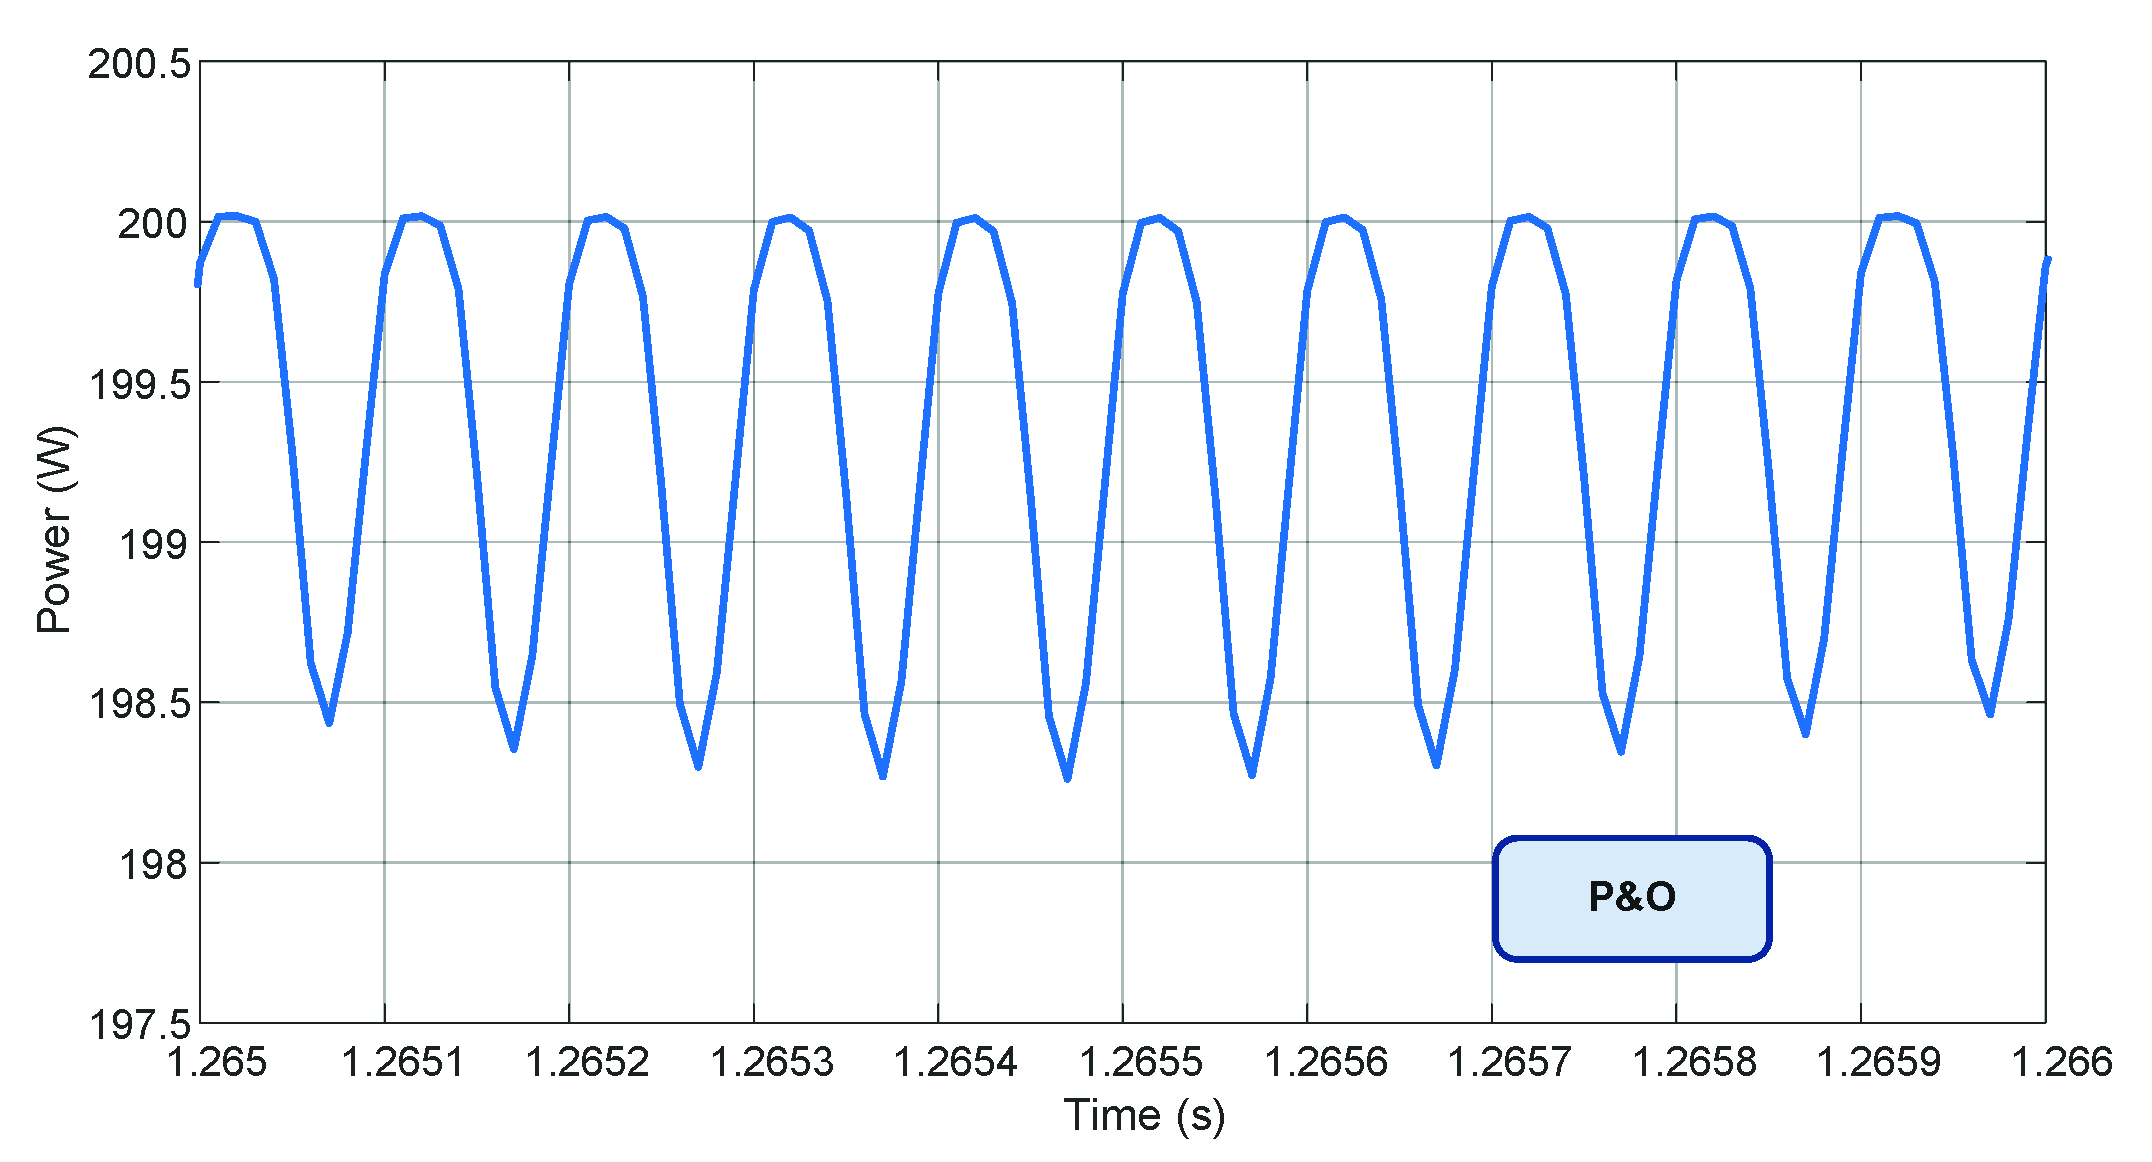
| P&O | 95.75 |
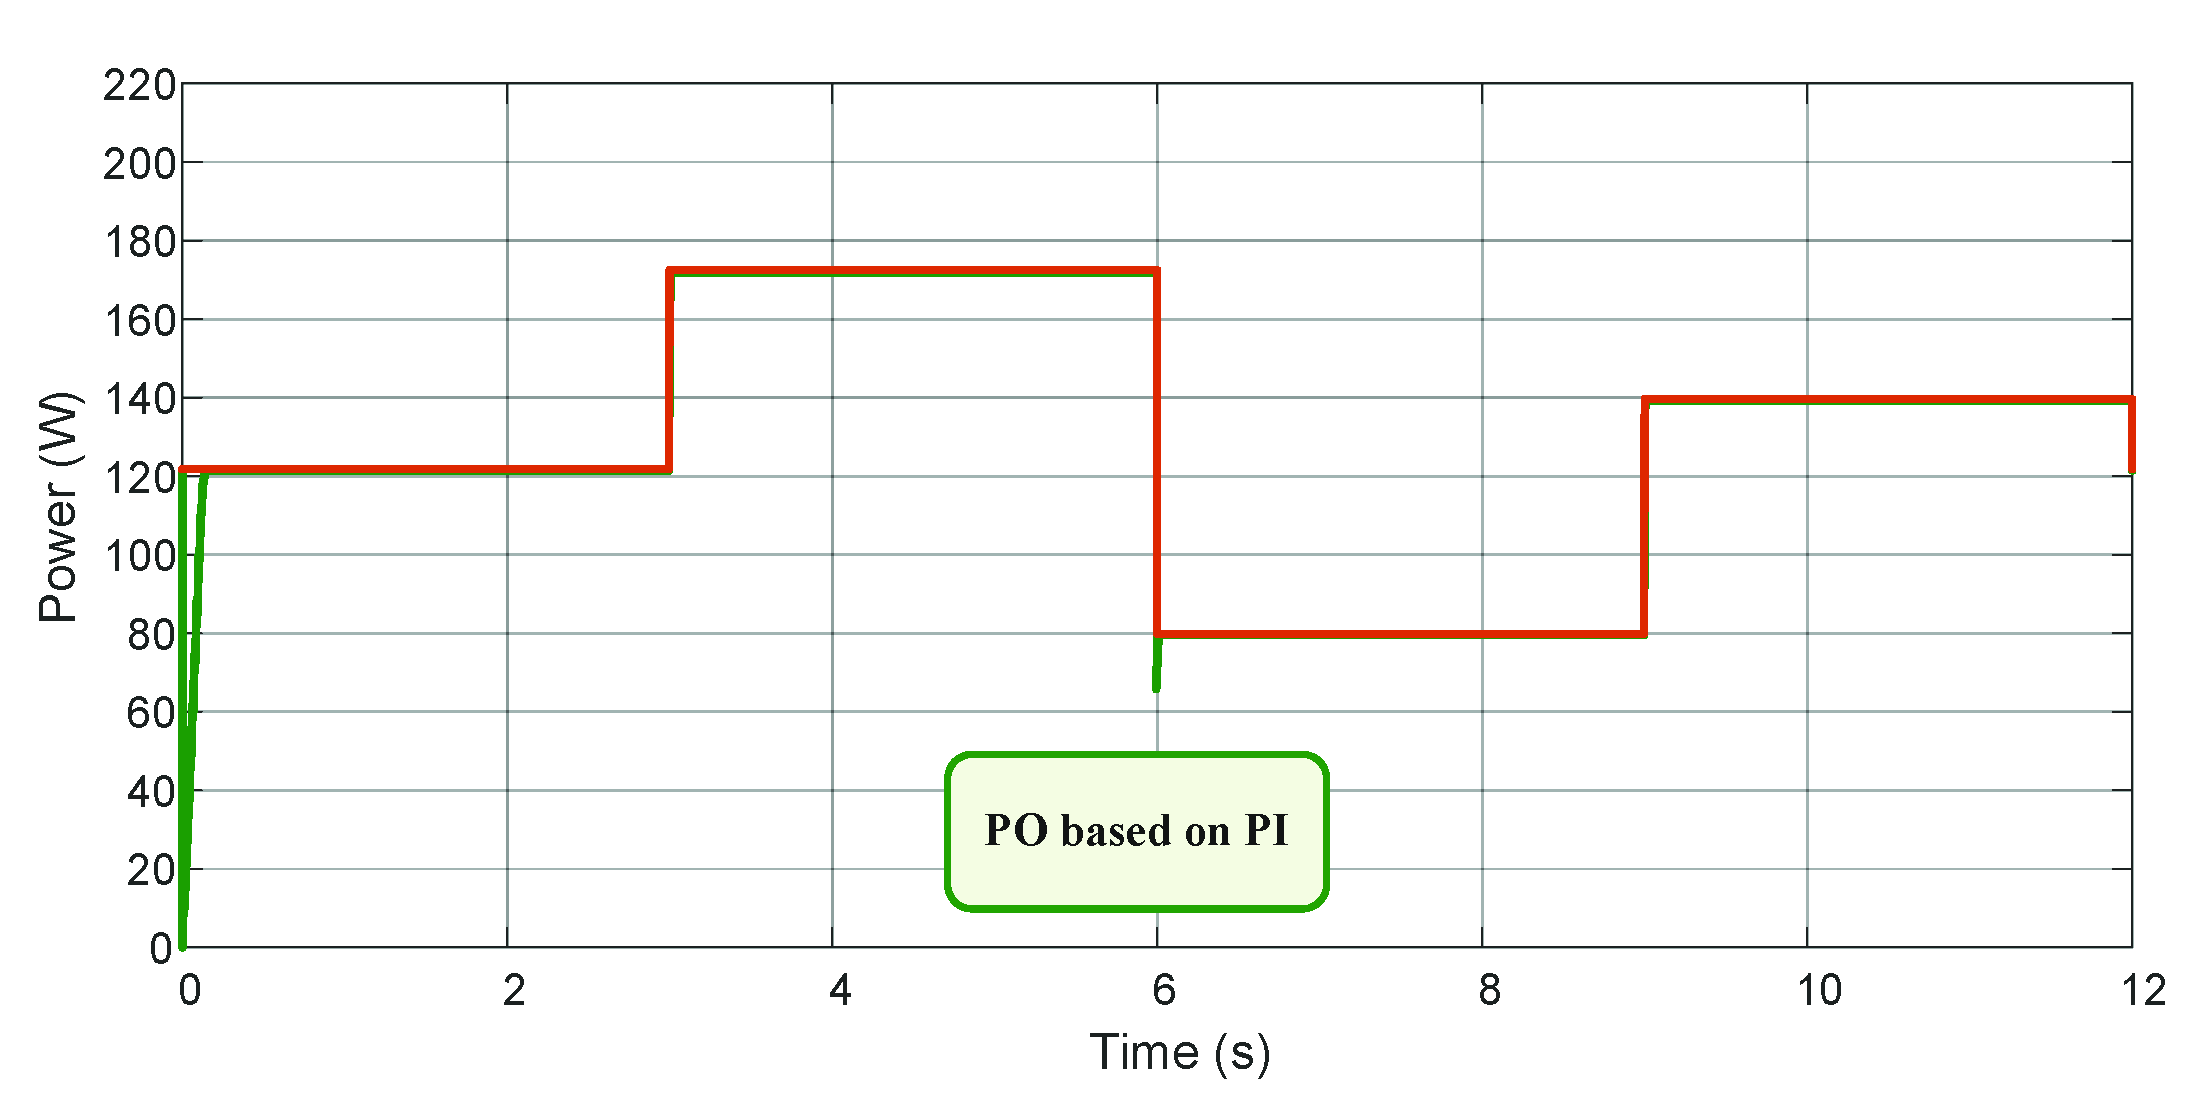
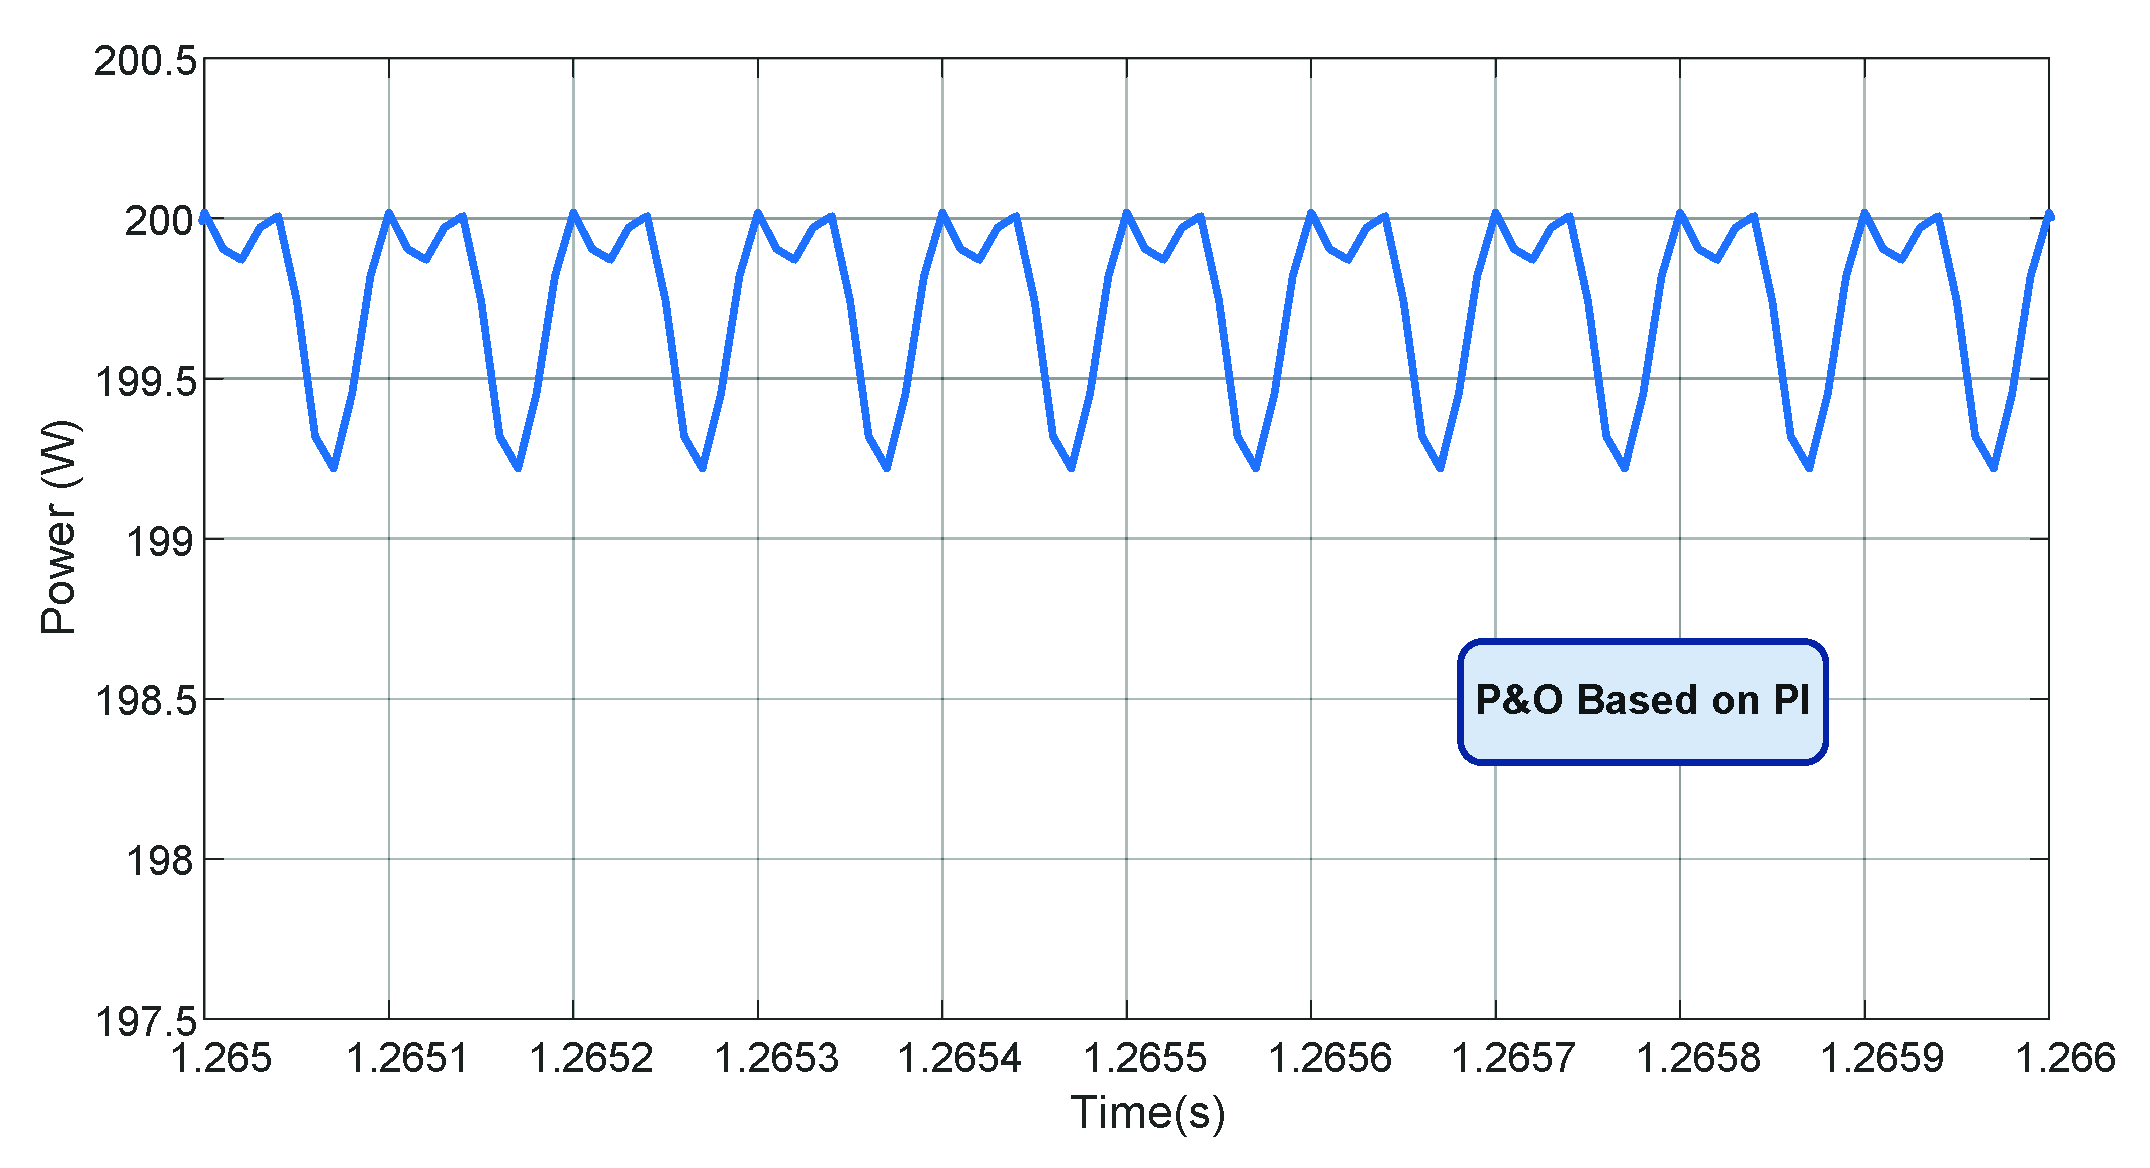
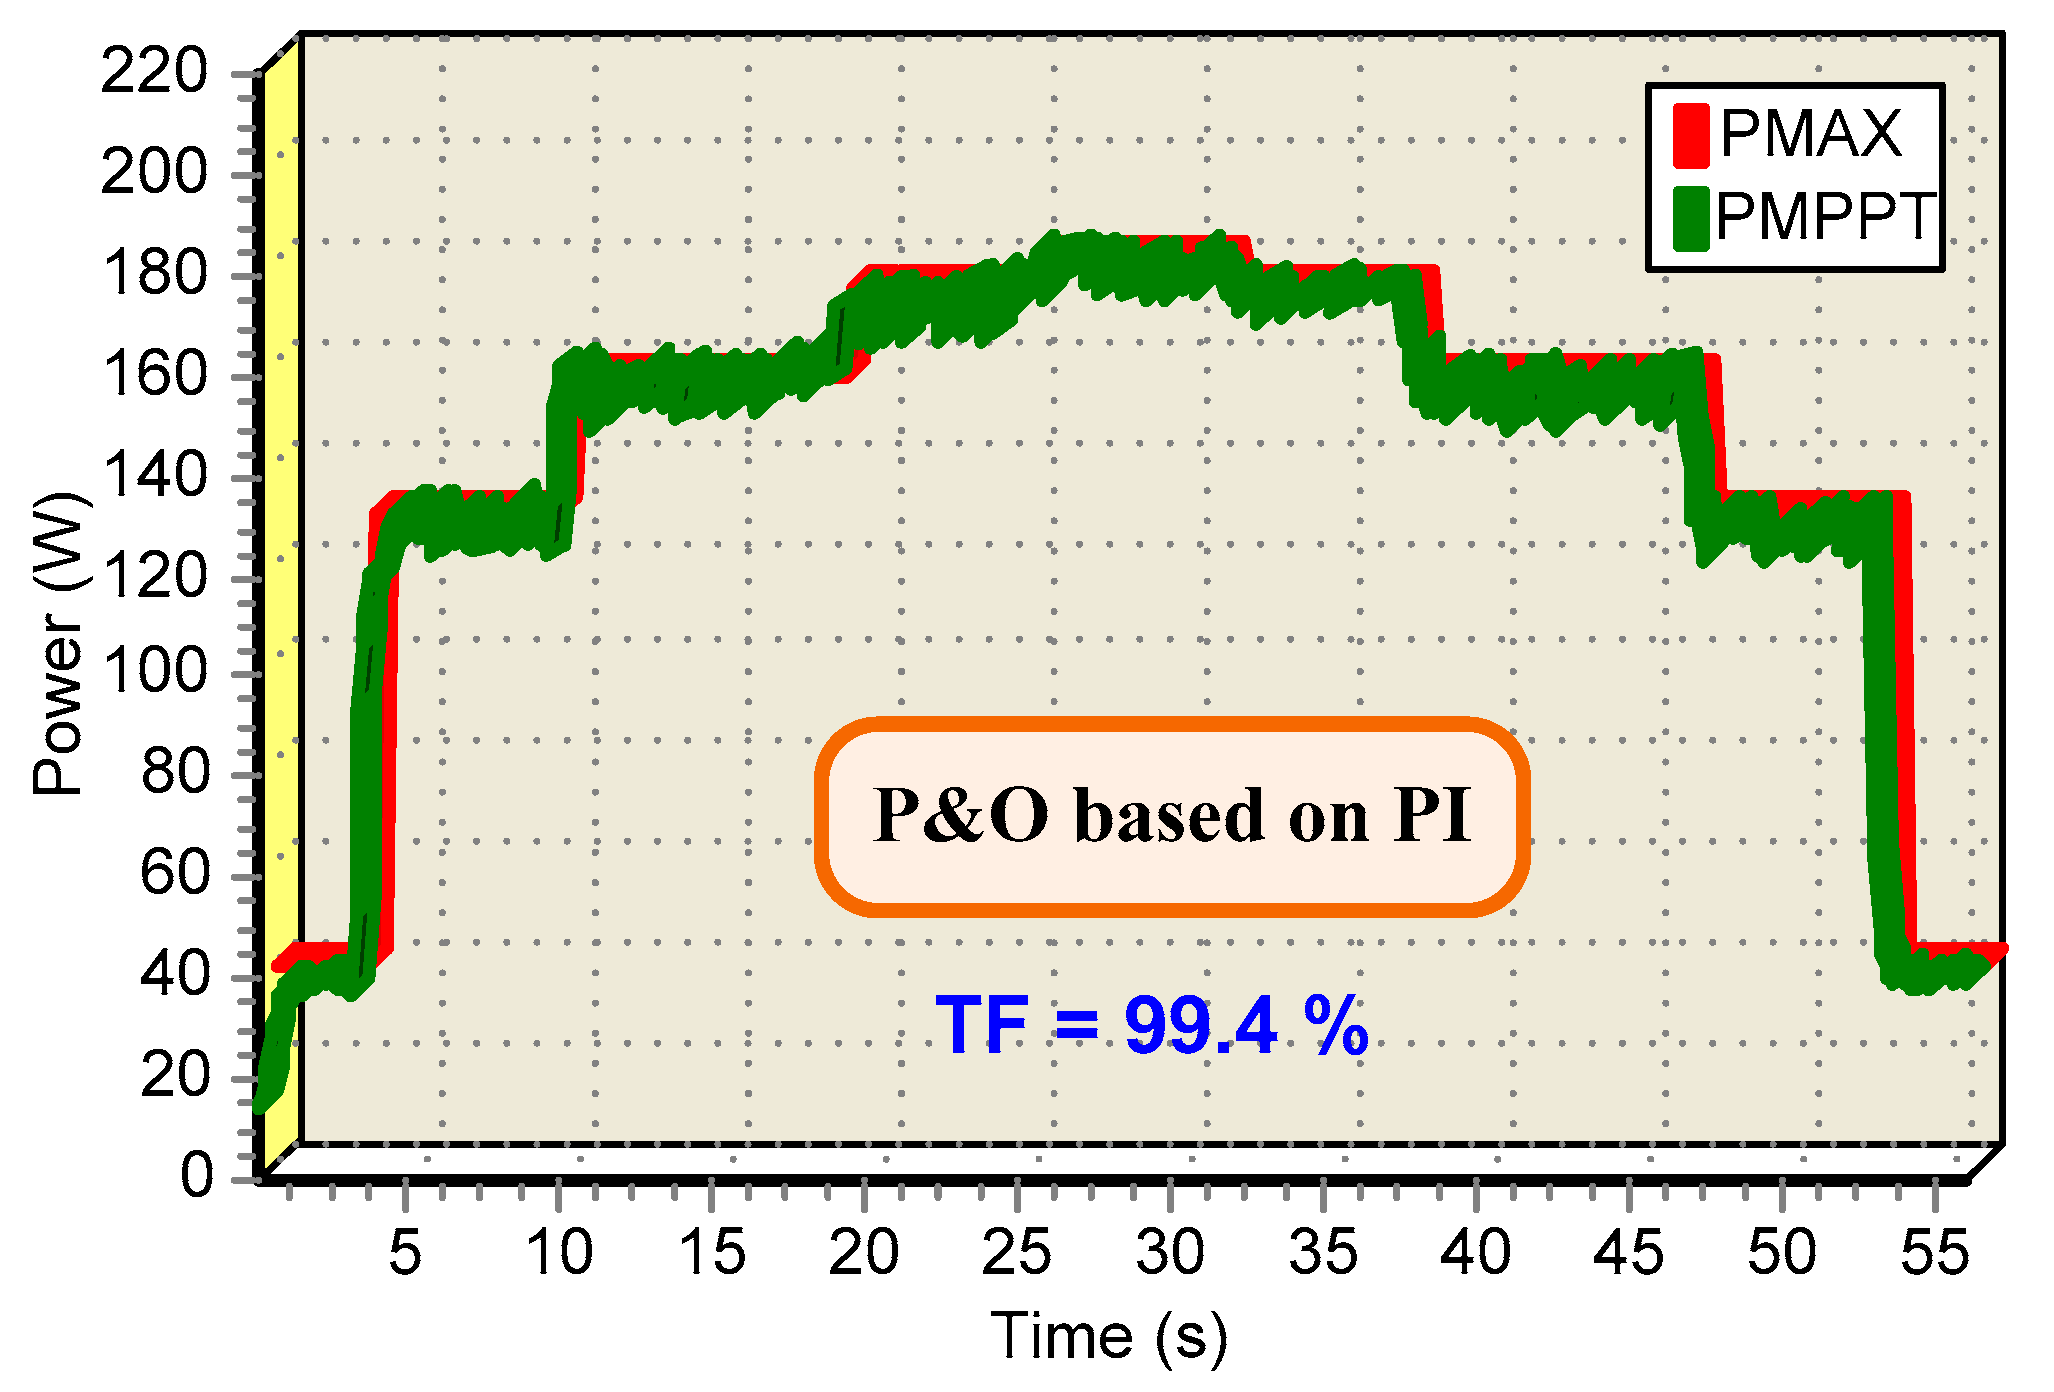
| P&O based on PI | 98.75 |
| IC | 95.85 |
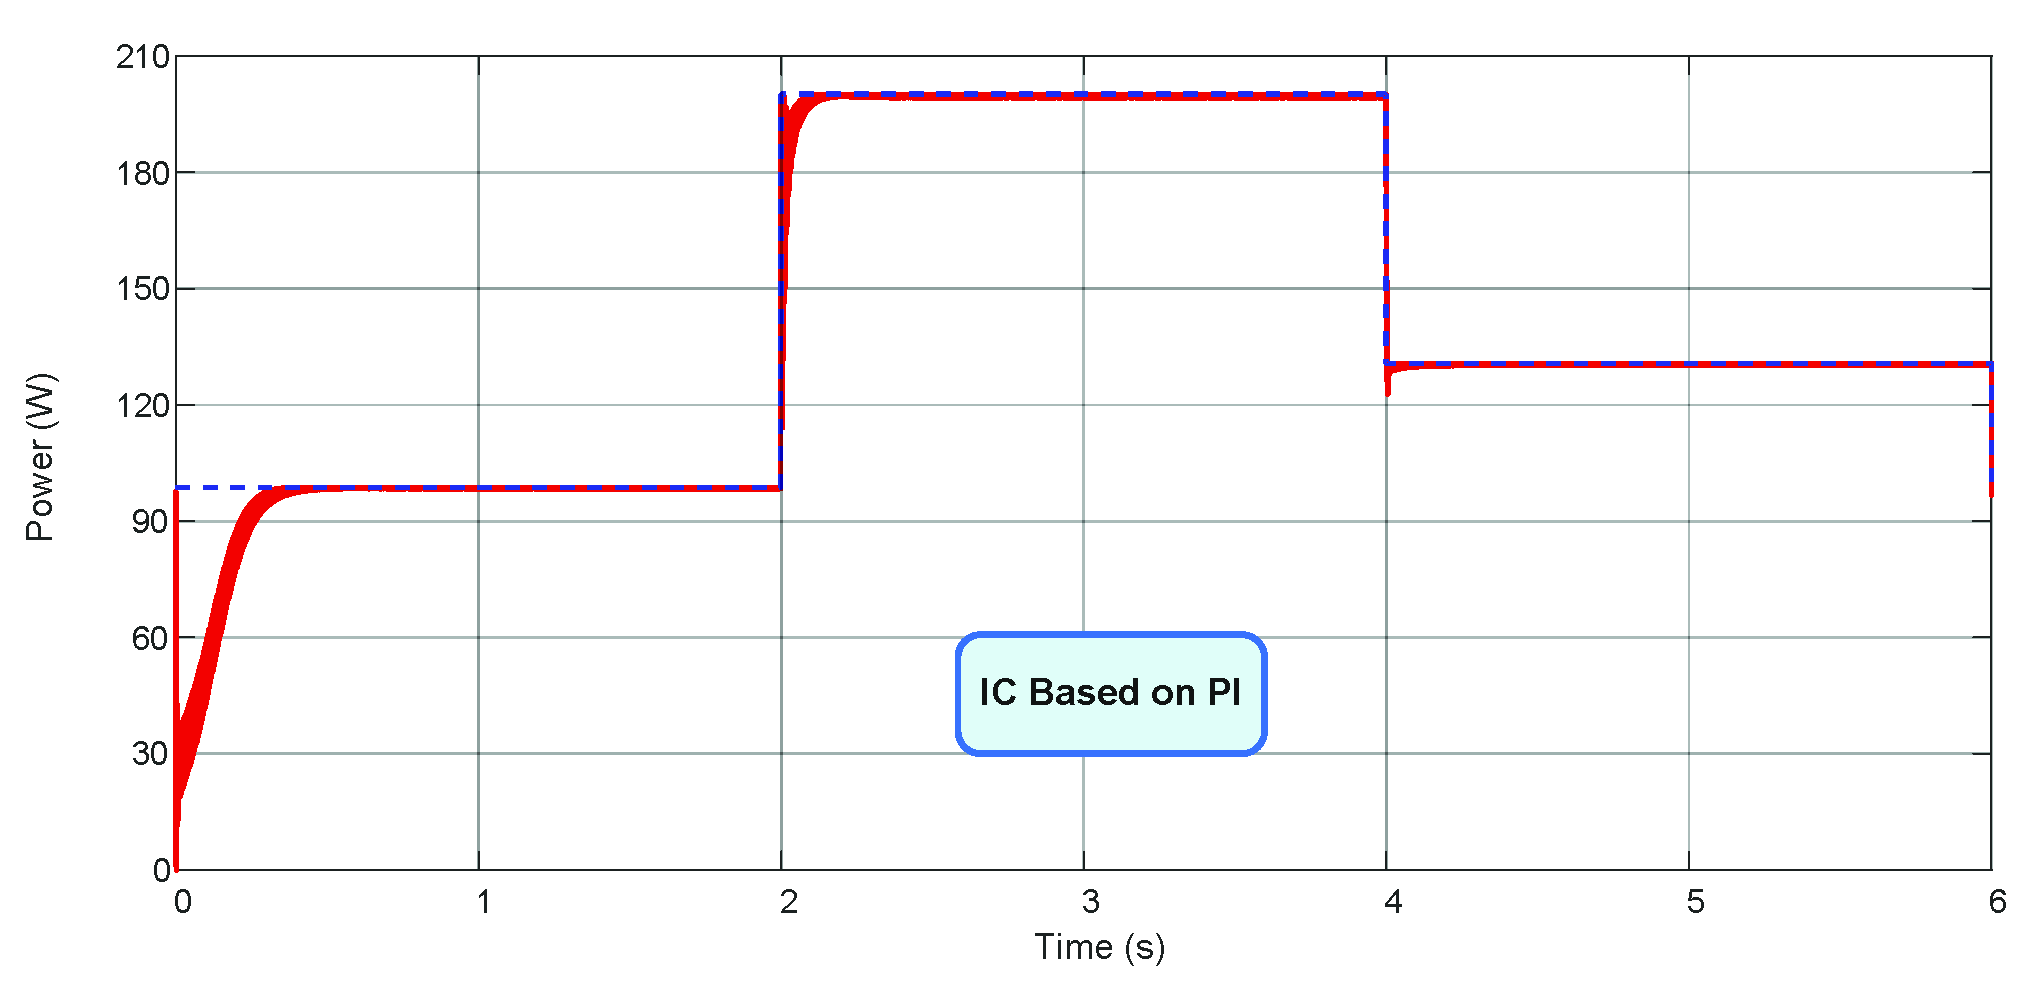
| IC based on PI | 98.68 |
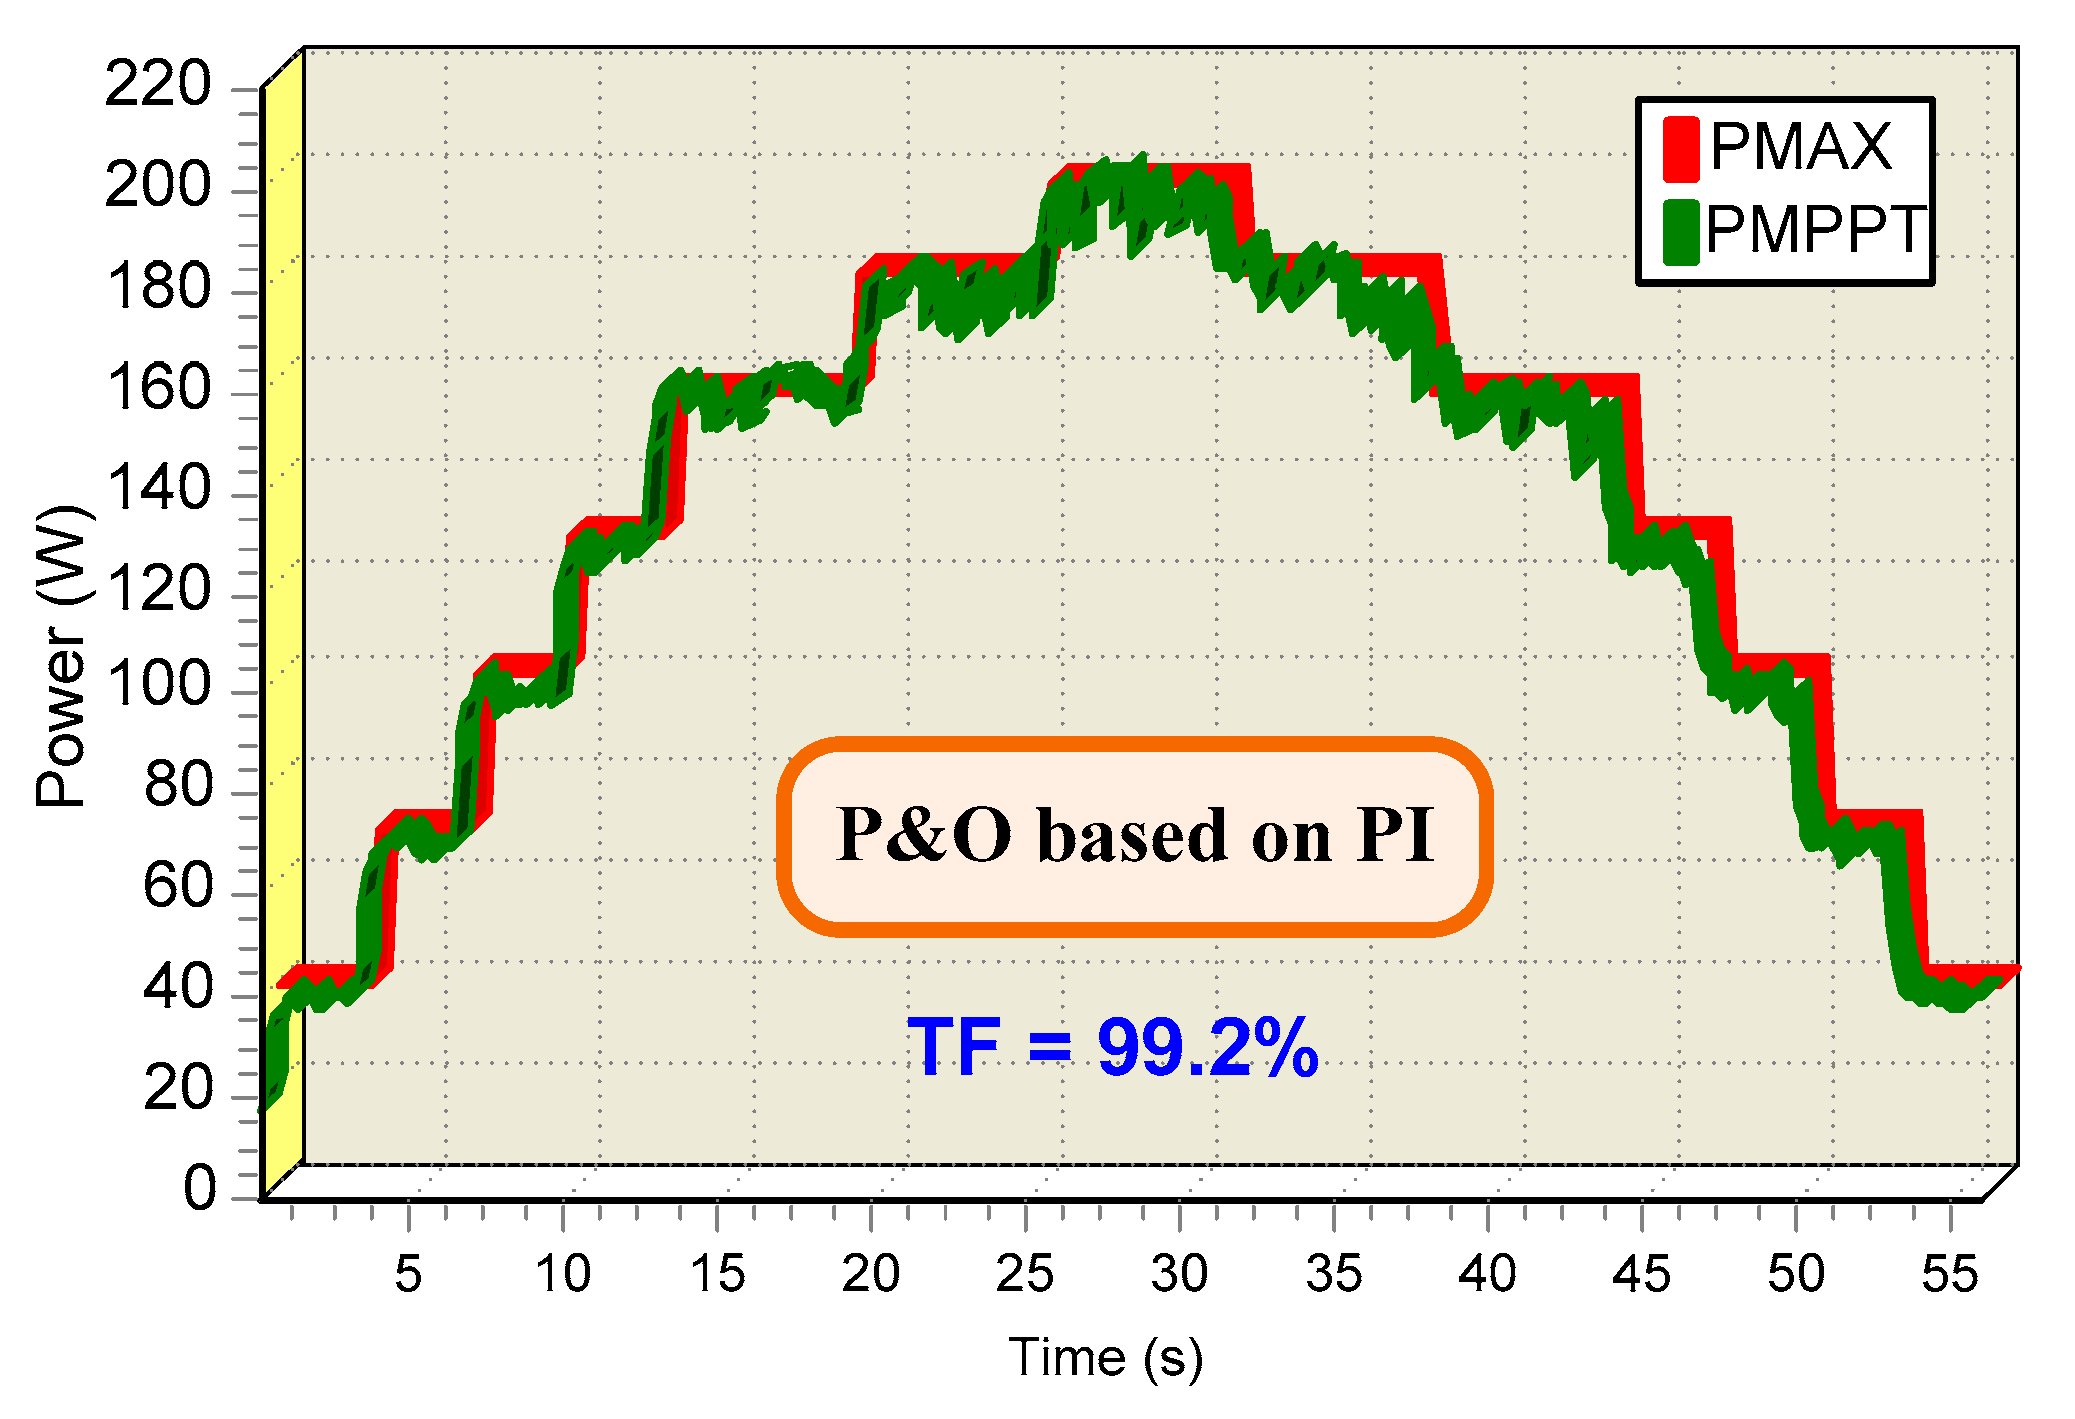
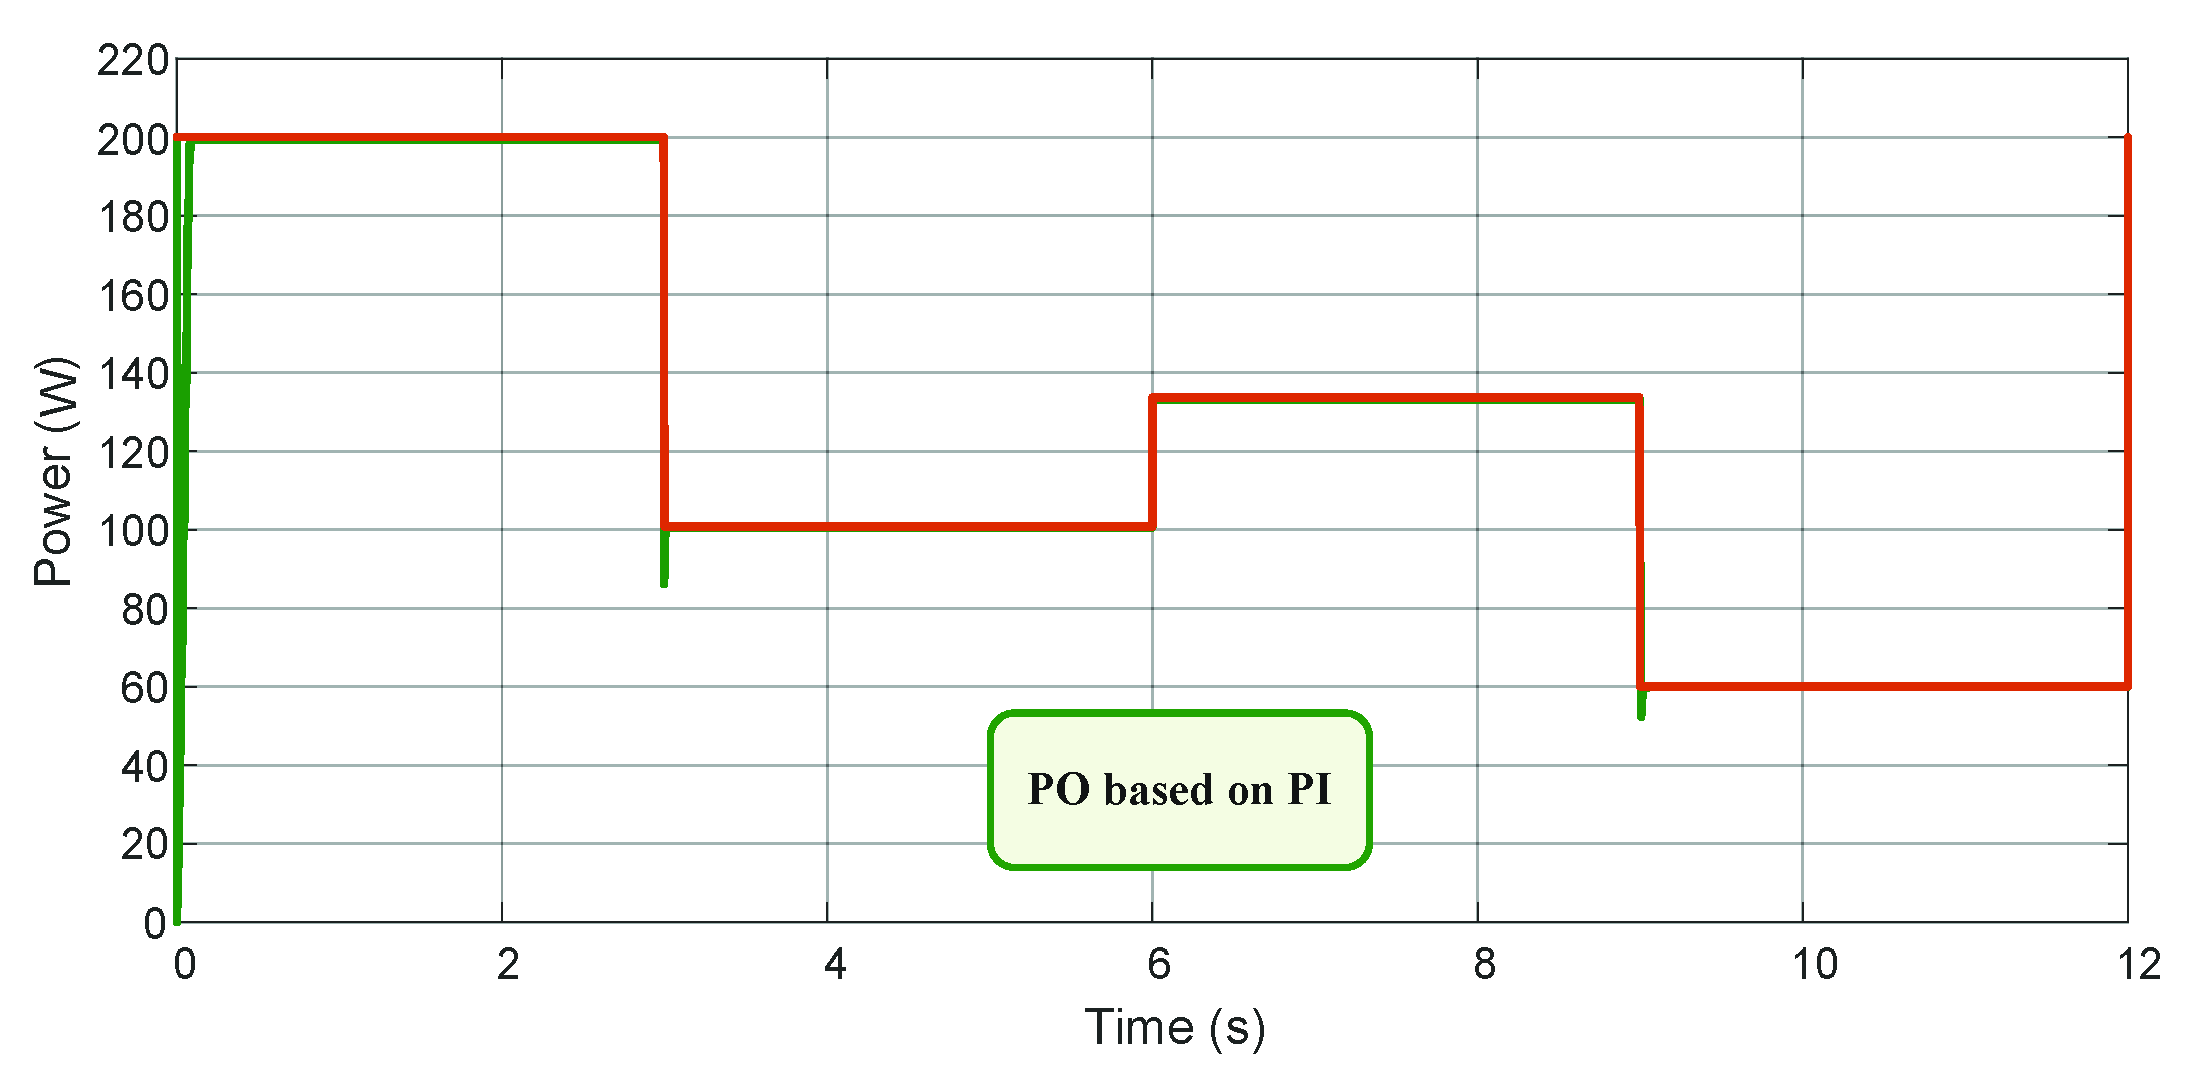
| Profile I | ||
| Irradiance | Temperature | Theoretical Power |
| 1000 W/m2 | 25 °C | 200.01 W |
| 500 W/m2 | 20 °C | 100.79 W |
| 700 W/m2 | 35 °C | 133.68 W |
| 300 W/m2 | 15 °C | 60.08 W |
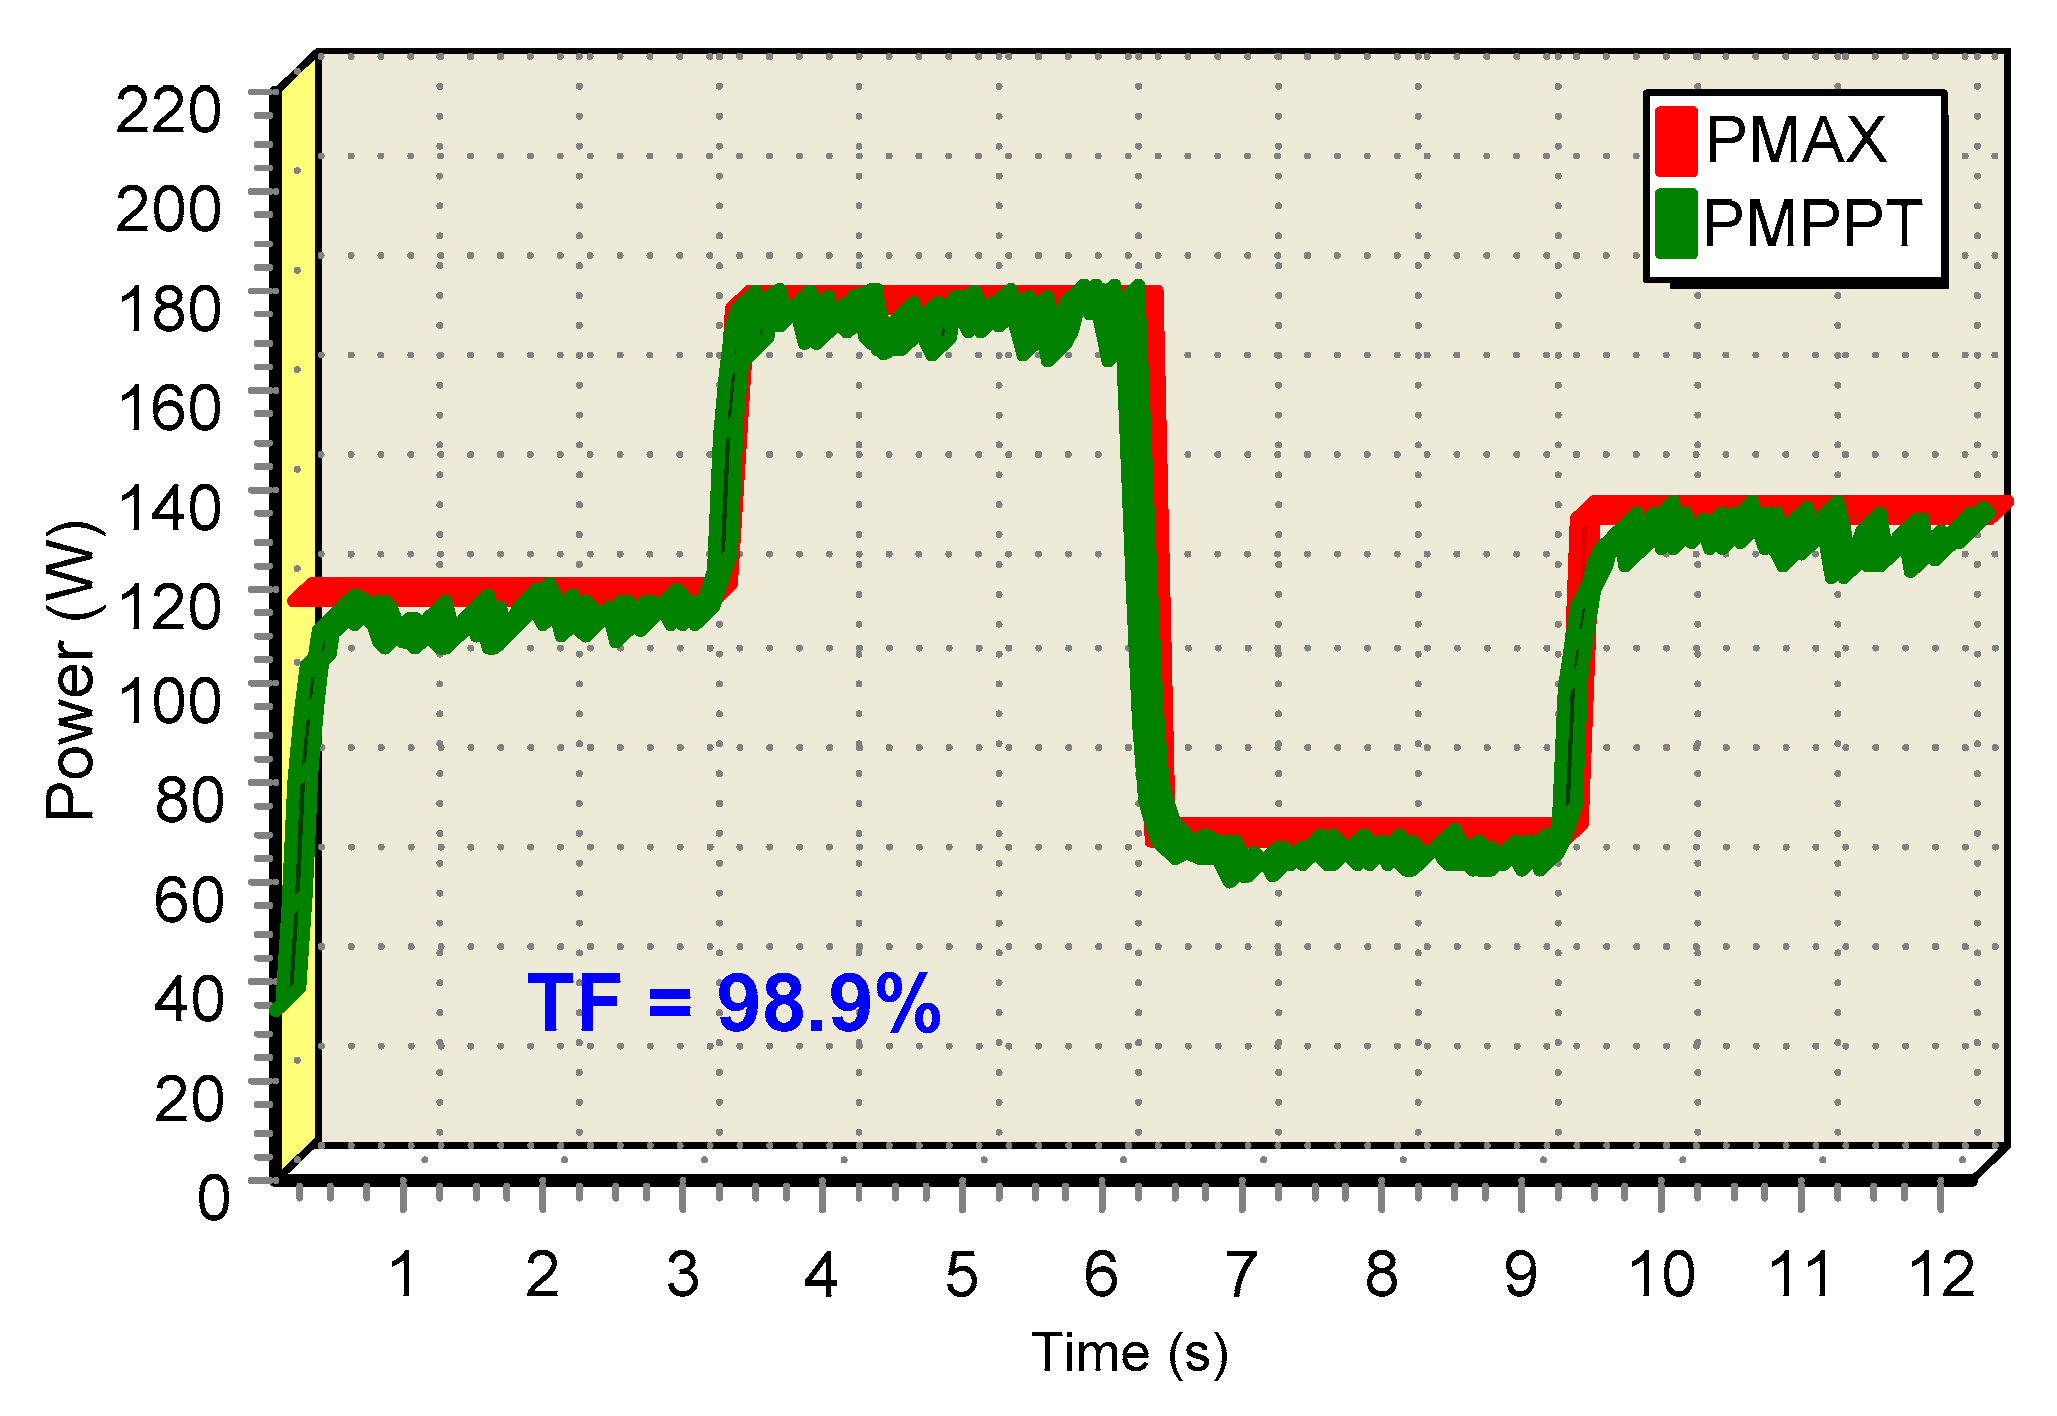
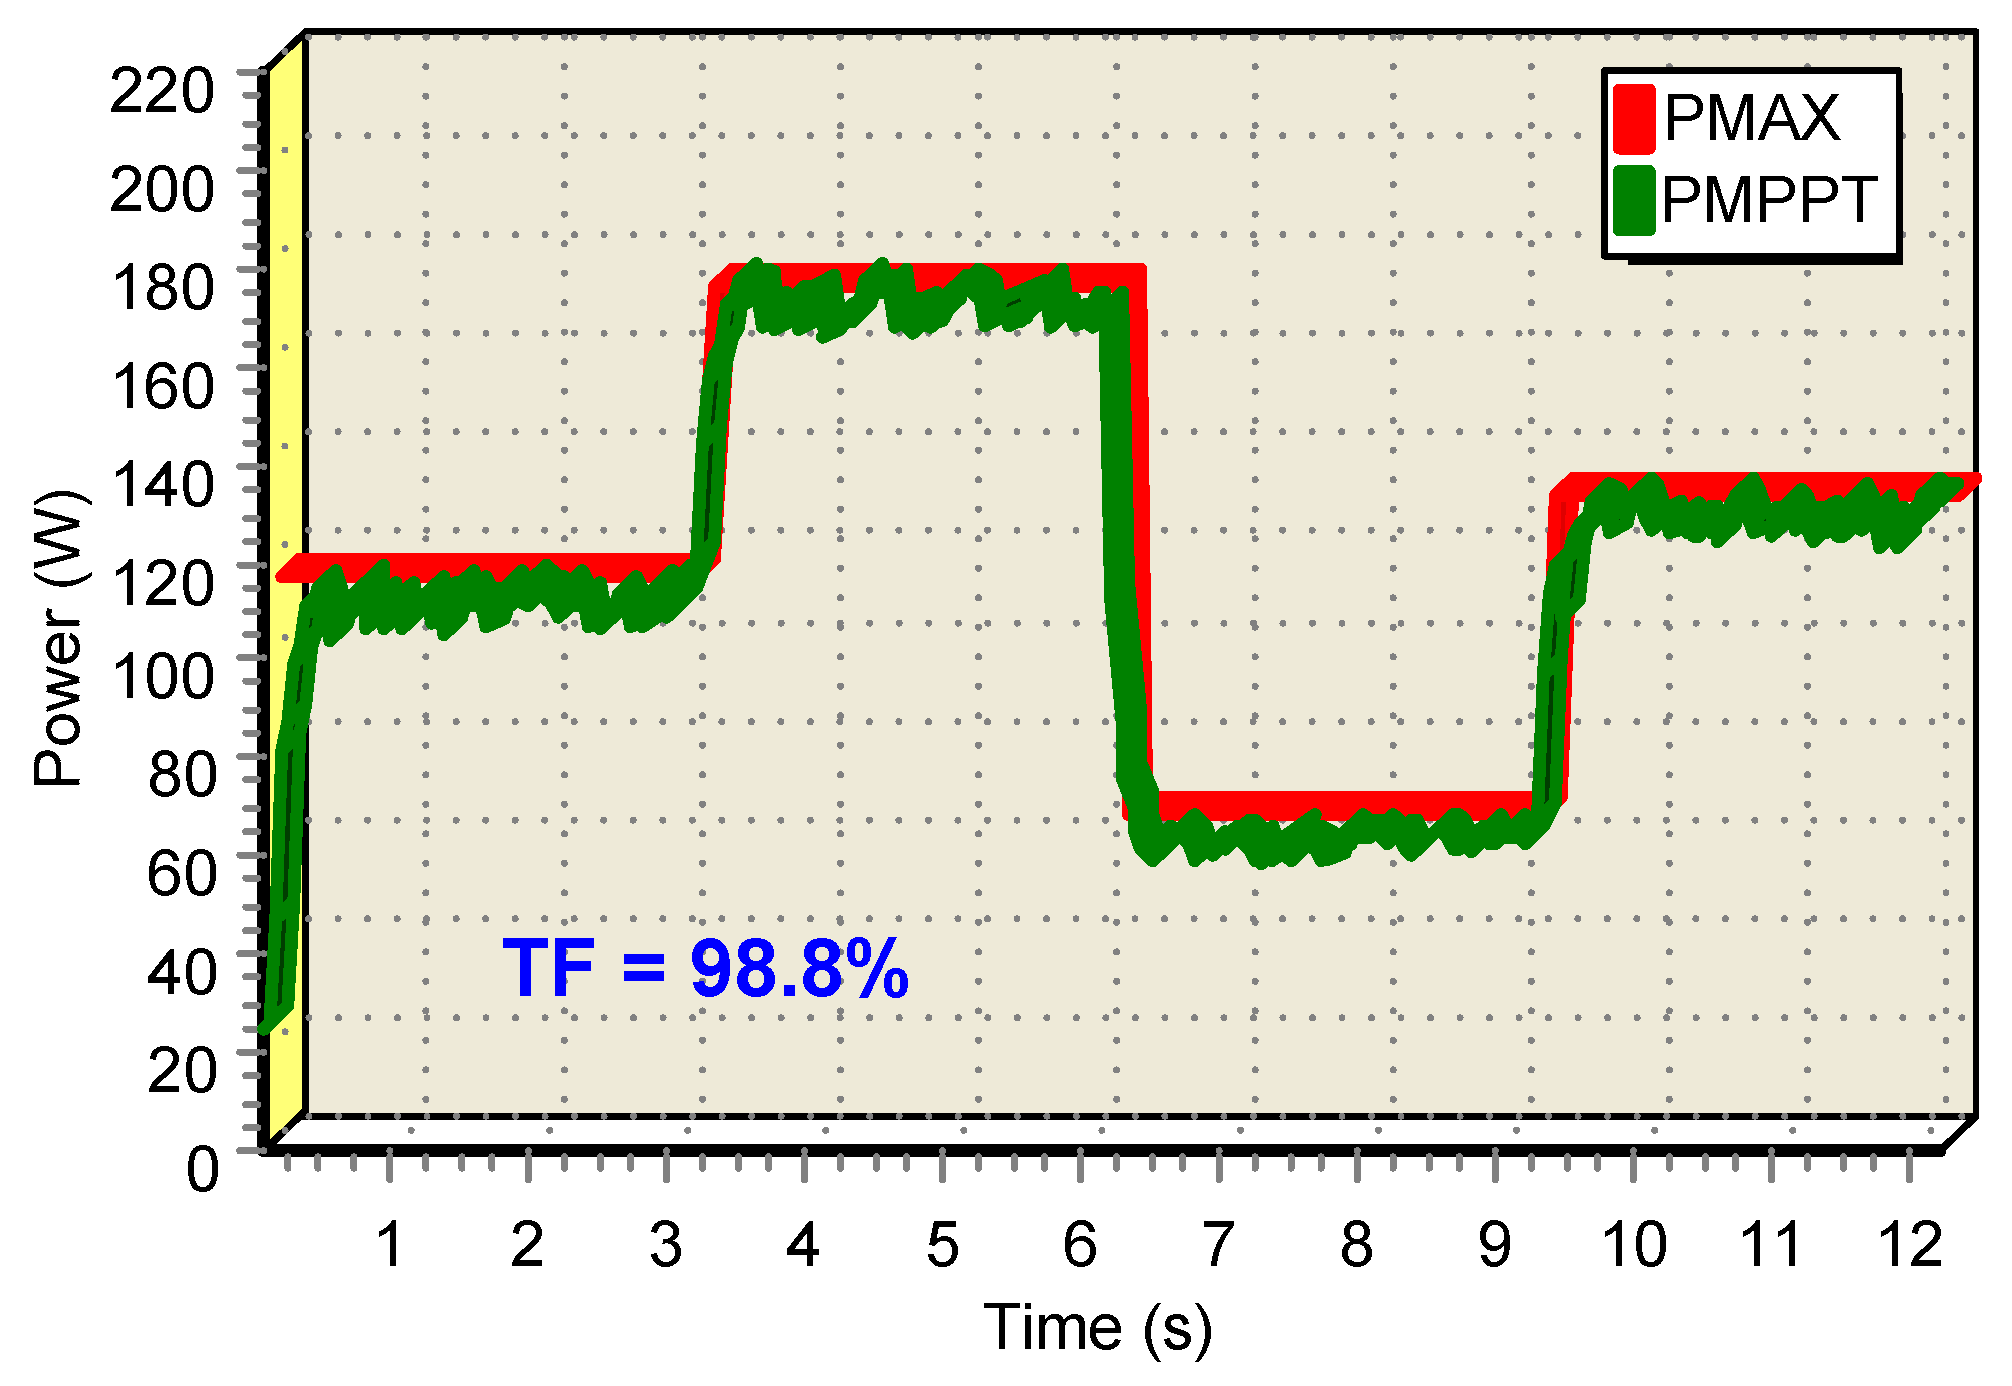
| Profile II | ||
| Irradiance | Temperature | Theoretical Power |
| 600 W/m2 | 20 °C | 121.74 W |
| 900 W/m2 | 35 °C | 172.47 W |
| 400 W/m2 | 20 °C | 79.80 W |
| 700 W/m2 | 25 °C | 139.62 W |
Publisher’s Note: MDPI stays neutral with regard to jurisdictional claims in published maps and institutional affiliations. |
© 2021 by the authors. Licensee MDPI, Basel, Switzerland. This article is an open access article distributed under the terms and conditions of the Creative Commons Attribution (CC BY) license (https://creativecommons.org/licenses/by/4.0/).
Share and Cite
Brito, M.A.G.d.; Prado, V.A.; Batista, E.A.; Alves, M.G.; Canesin, C.A. Design Procedure to Convert a Maximum Power Point Tracking Algorithm into a Loop Control System. Energies 2021, 14, 4550. https://doi.org/10.3390/en14154550
Brito MAGd, Prado VA, Batista EA, Alves MG, Canesin CA. Design Procedure to Convert a Maximum Power Point Tracking Algorithm into a Loop Control System. Energies. 2021; 14(15):4550. https://doi.org/10.3390/en14154550
Chicago/Turabian StyleBrito, Moacyr A. G. de, Victor A. Prado, Edson A. Batista, Marcos G. Alves, and Carlos A. Canesin. 2021. "Design Procedure to Convert a Maximum Power Point Tracking Algorithm into a Loop Control System" Energies 14, no. 15: 4550. https://doi.org/10.3390/en14154550
APA StyleBrito, M. A. G. d., Prado, V. A., Batista, E. A., Alves, M. G., & Canesin, C. A. (2021). Design Procedure to Convert a Maximum Power Point Tracking Algorithm into a Loop Control System. Energies, 14(15), 4550. https://doi.org/10.3390/en14154550