
An Energy Efficiency Estimation Procedure for Small Wind Turbines at Chosen Locations in Poland


Abstract
:
1. Introduction
1.1. Small Wind Turbines
1.2. Motivation
2. Materials & Methods
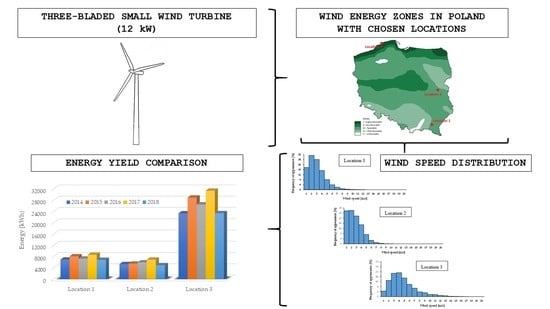
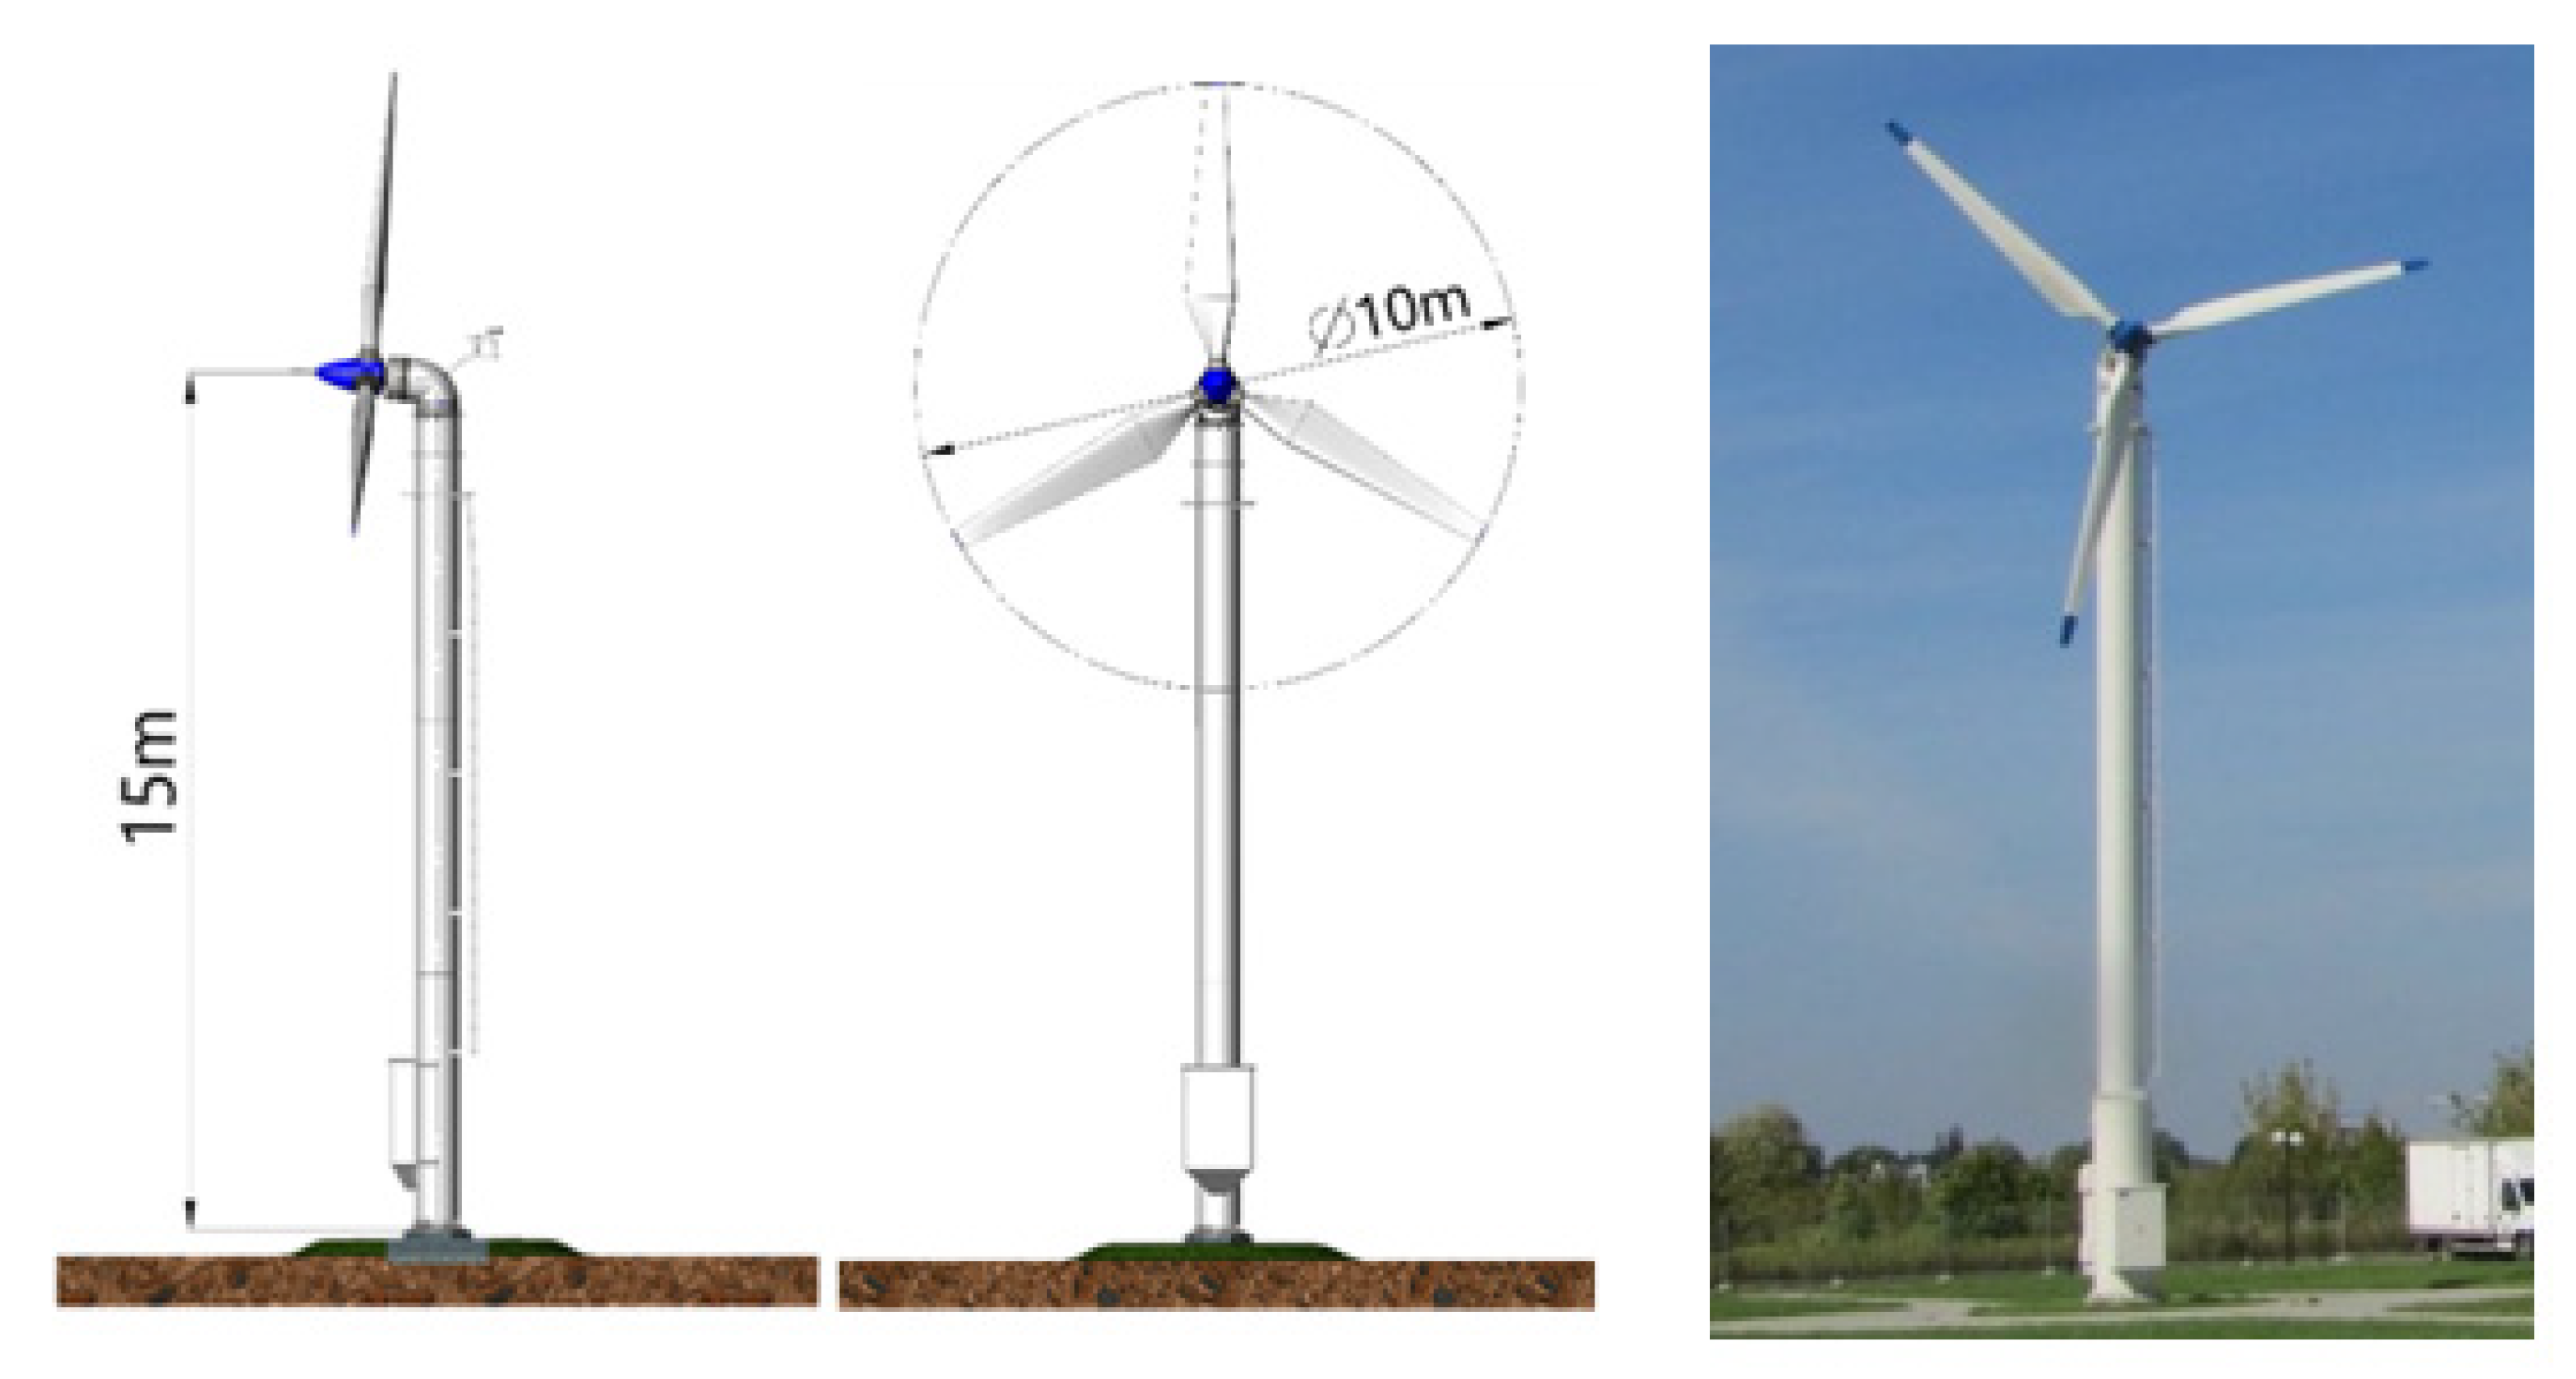
2.1. Subject of the Analysis
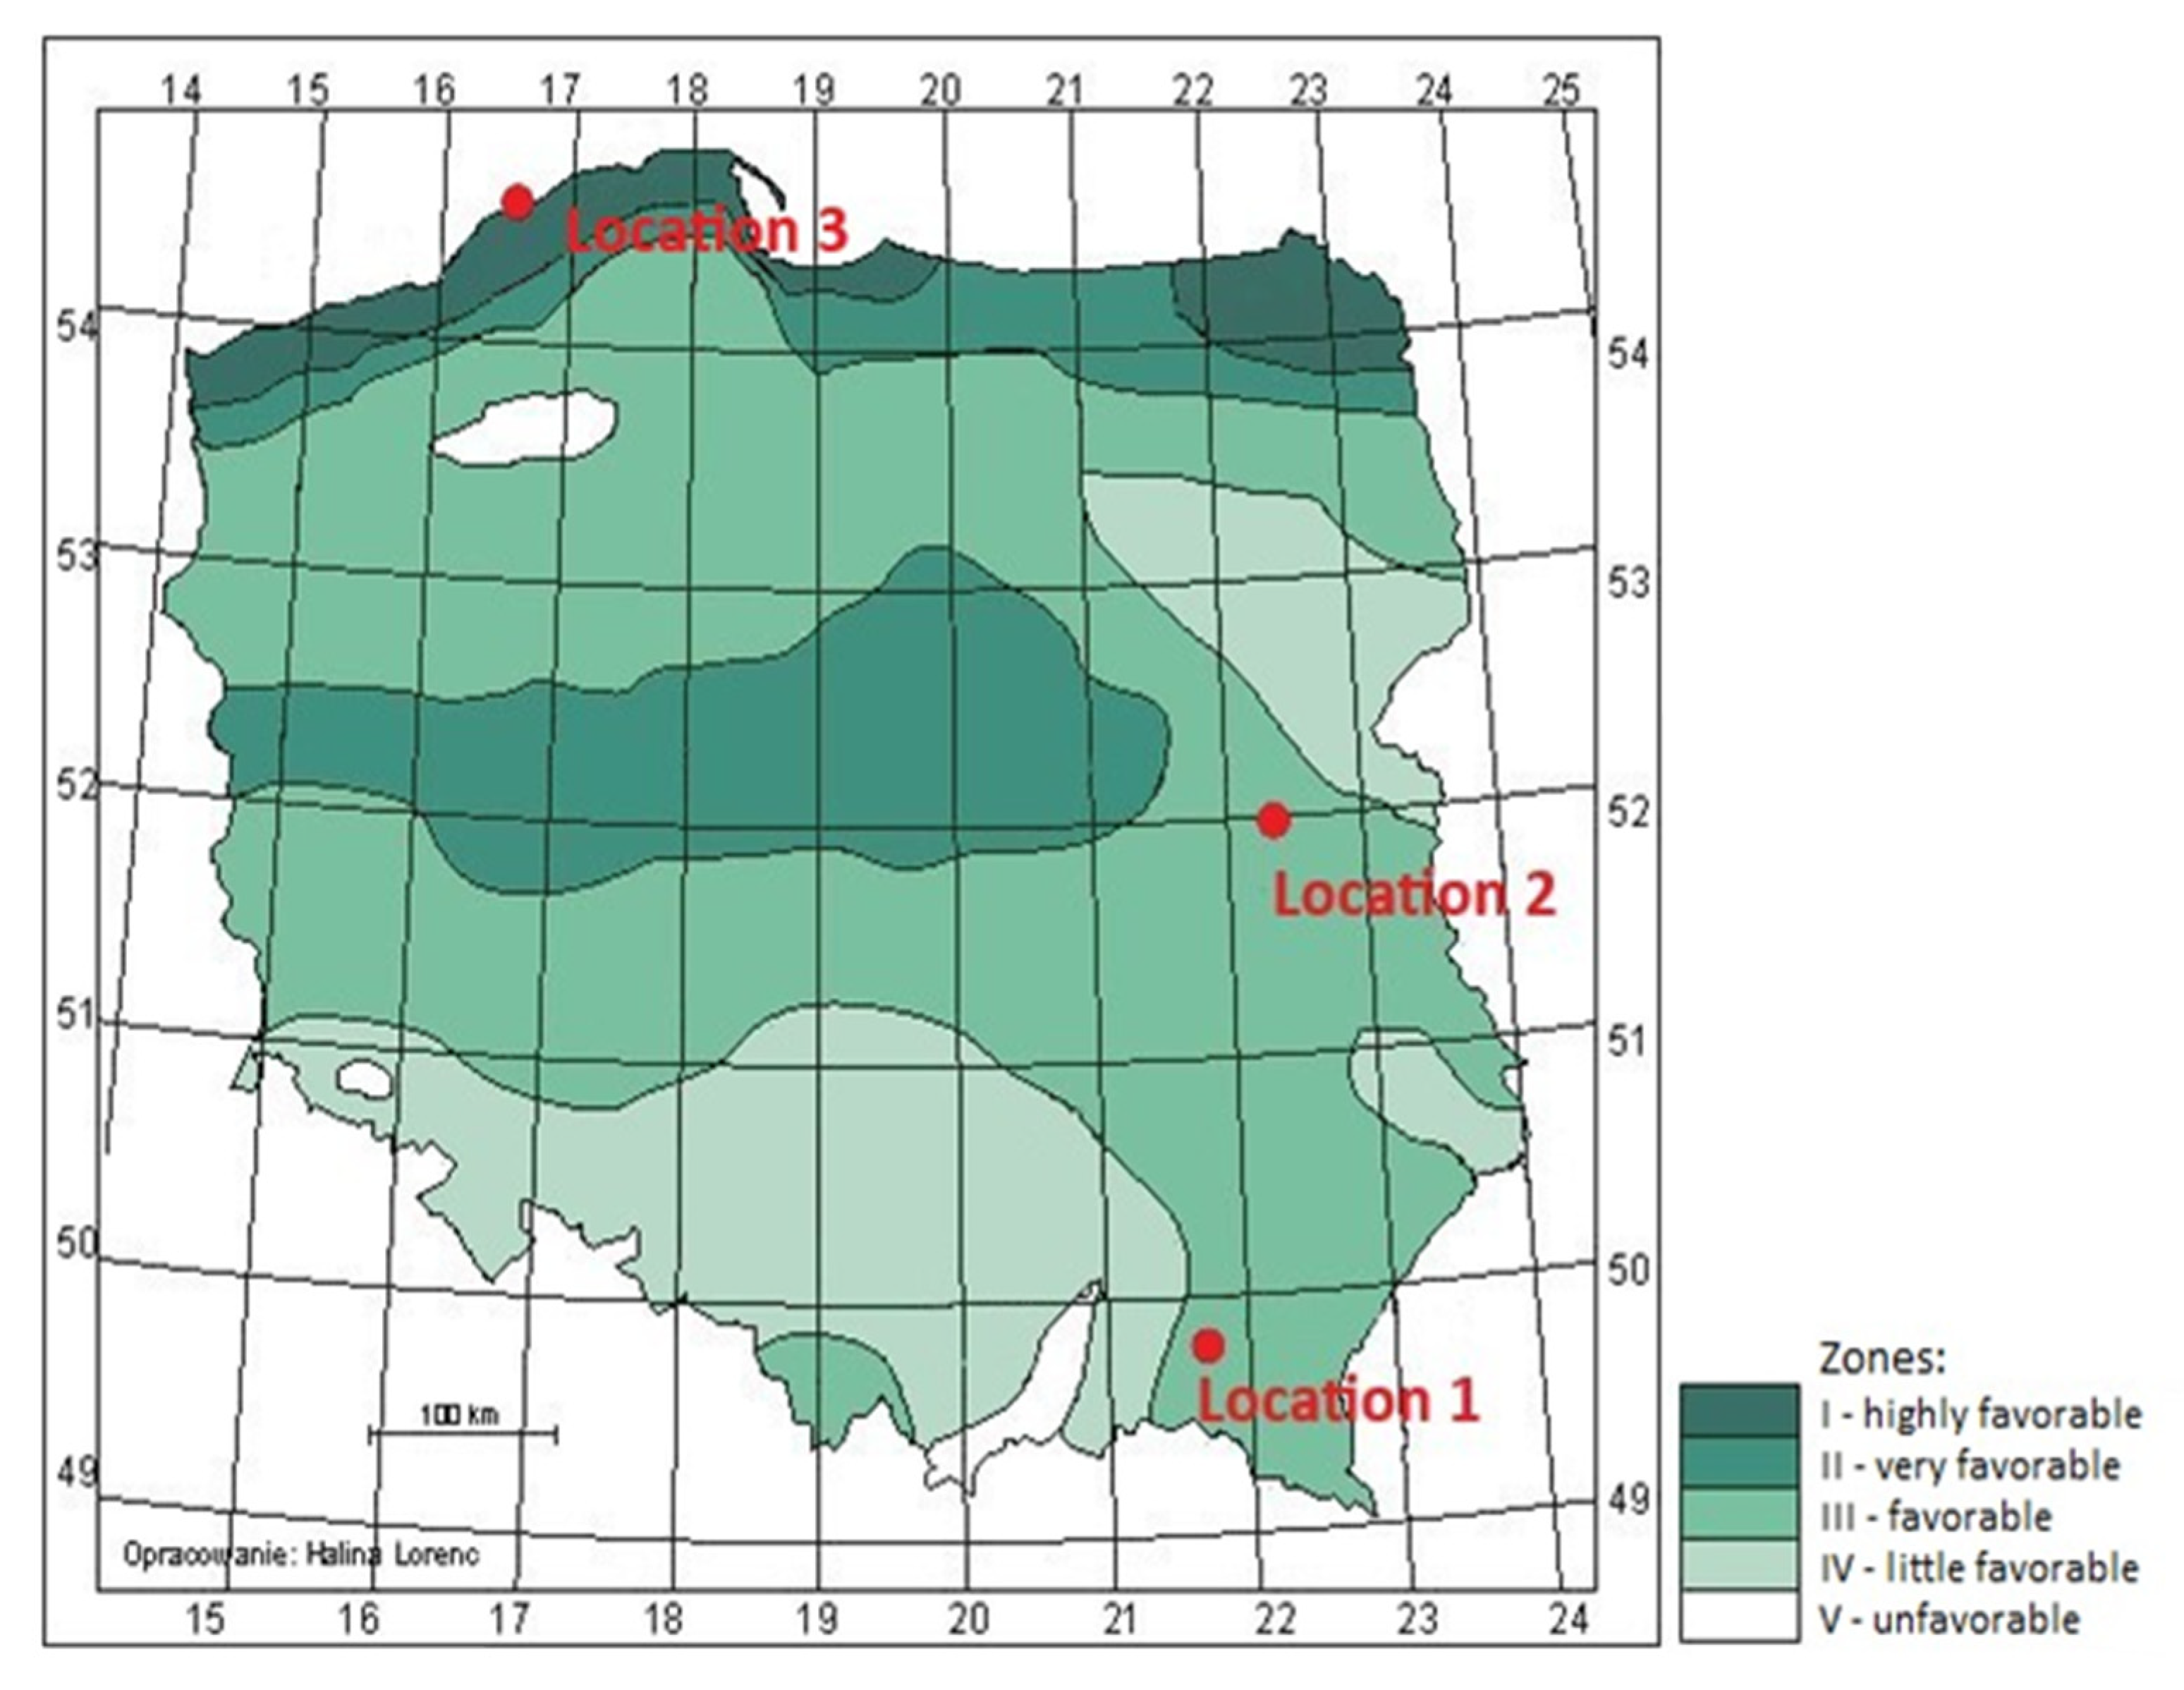
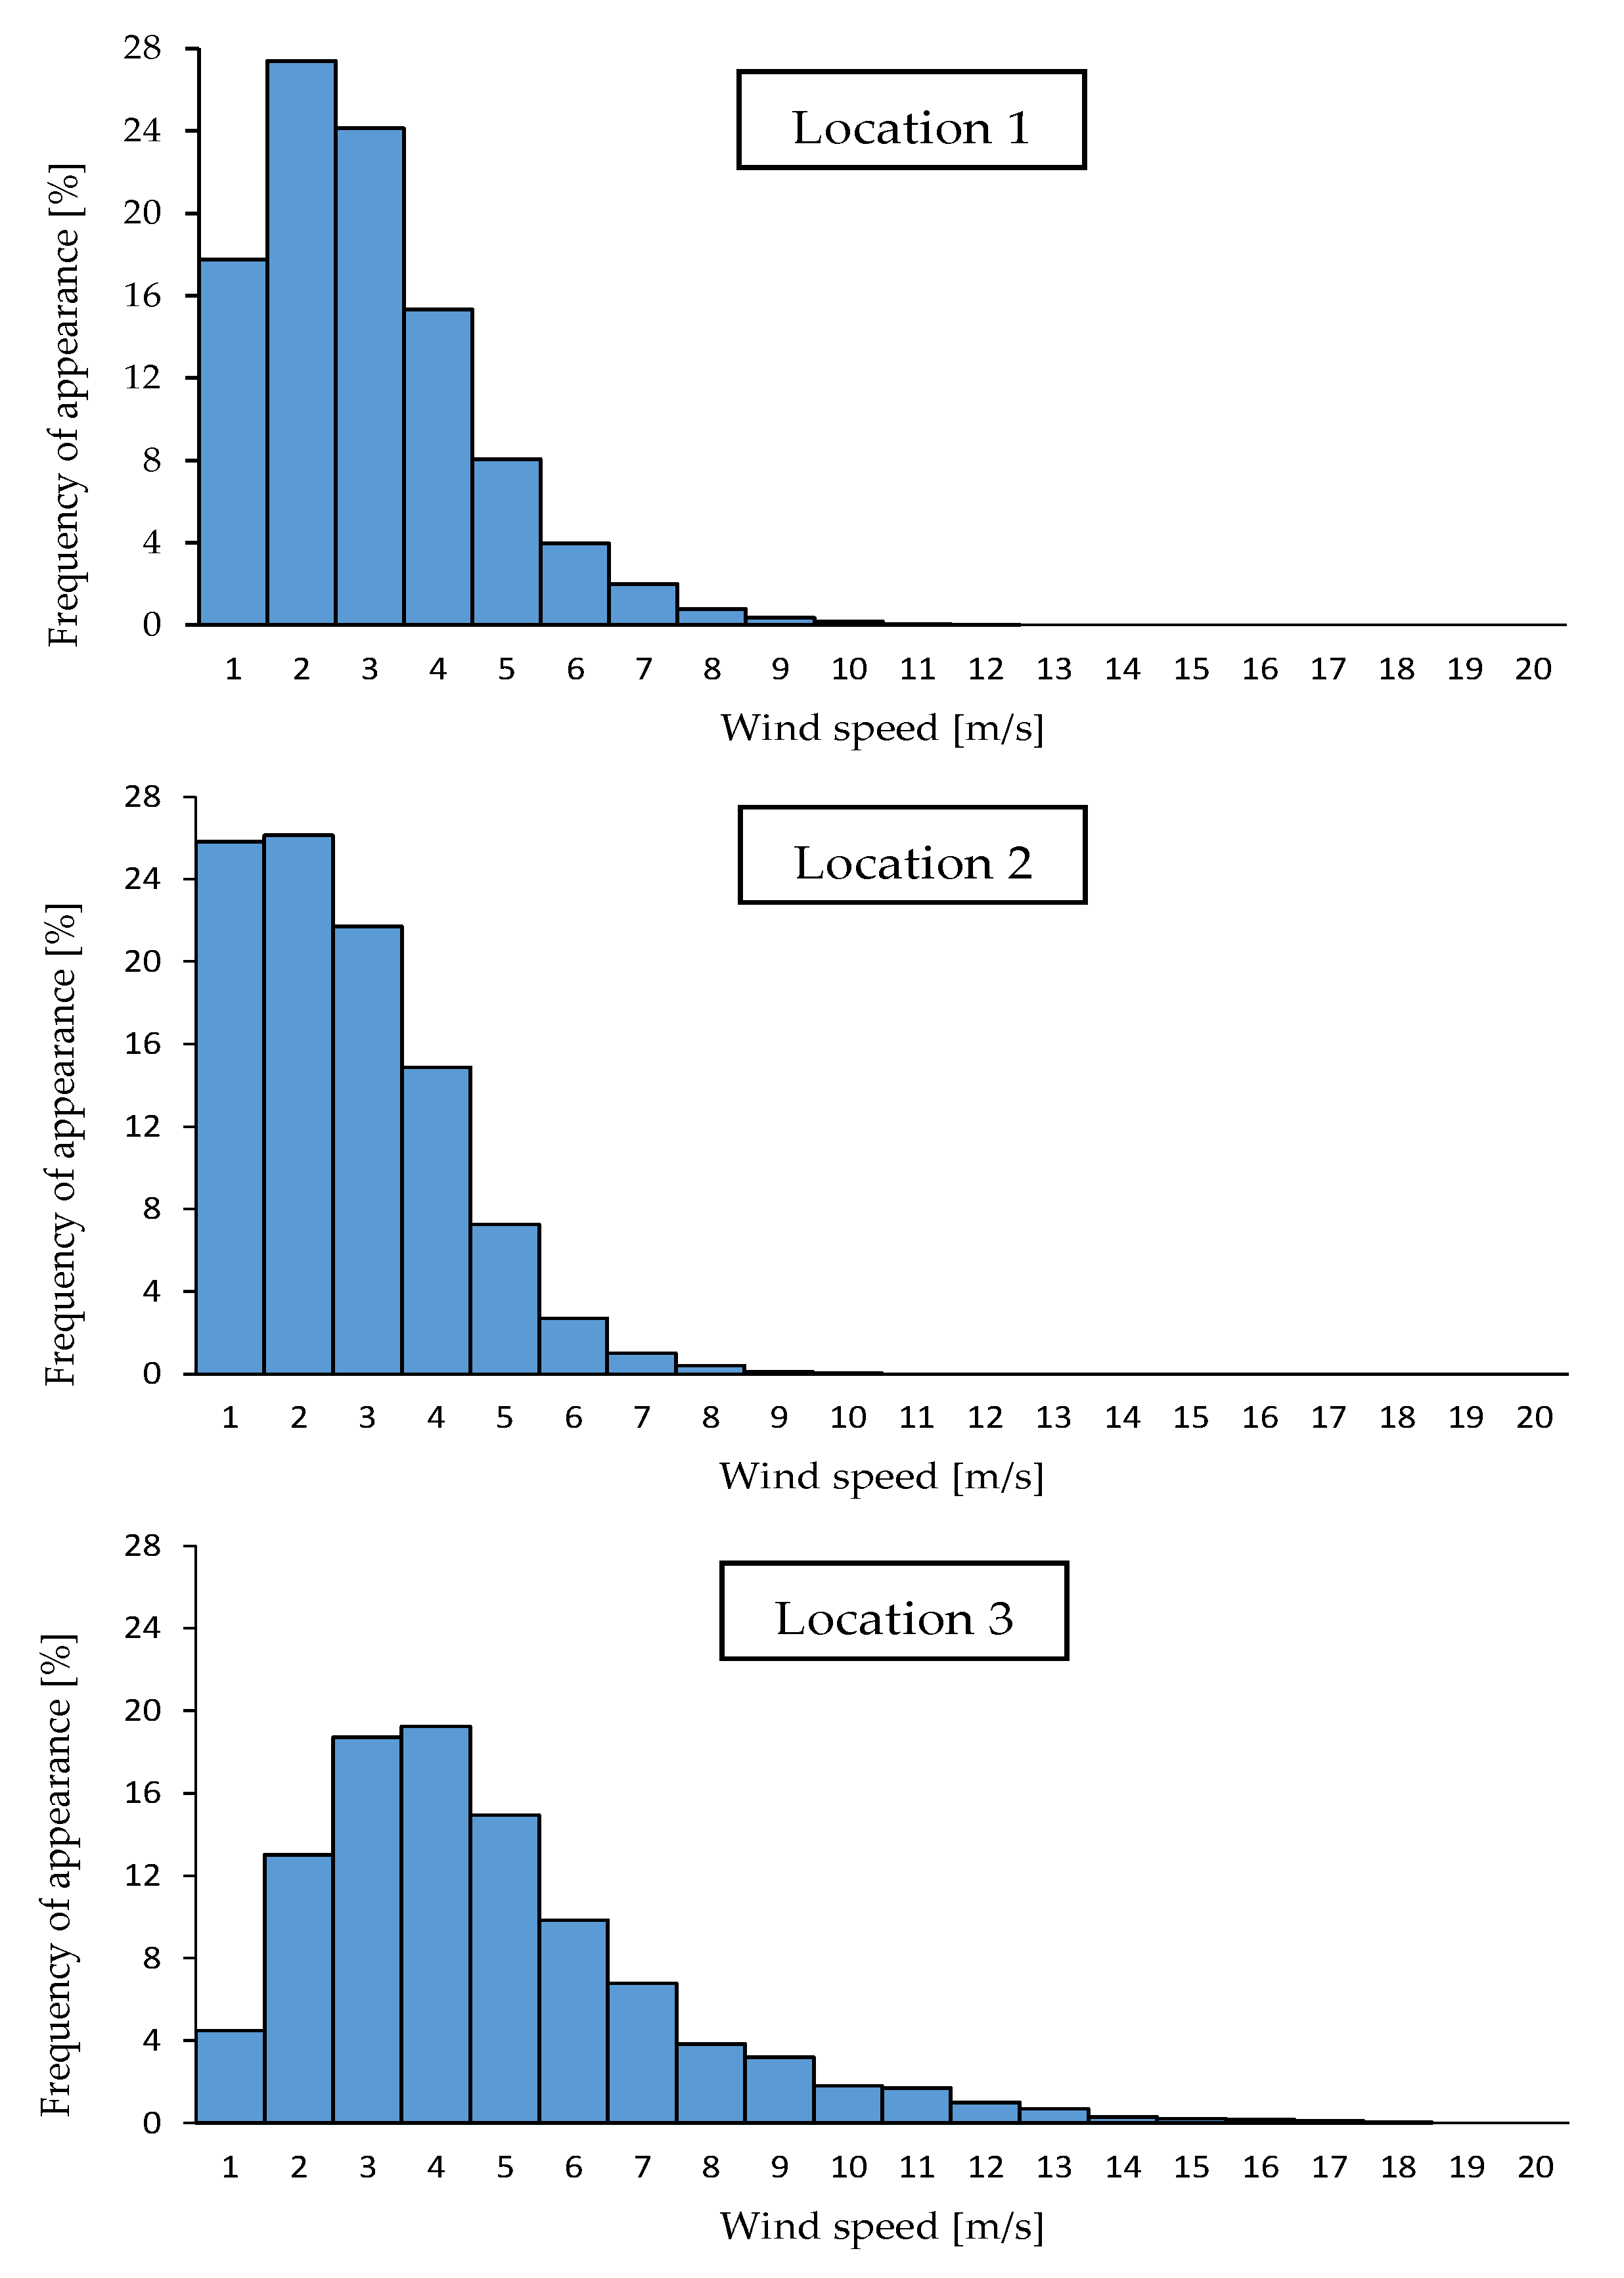
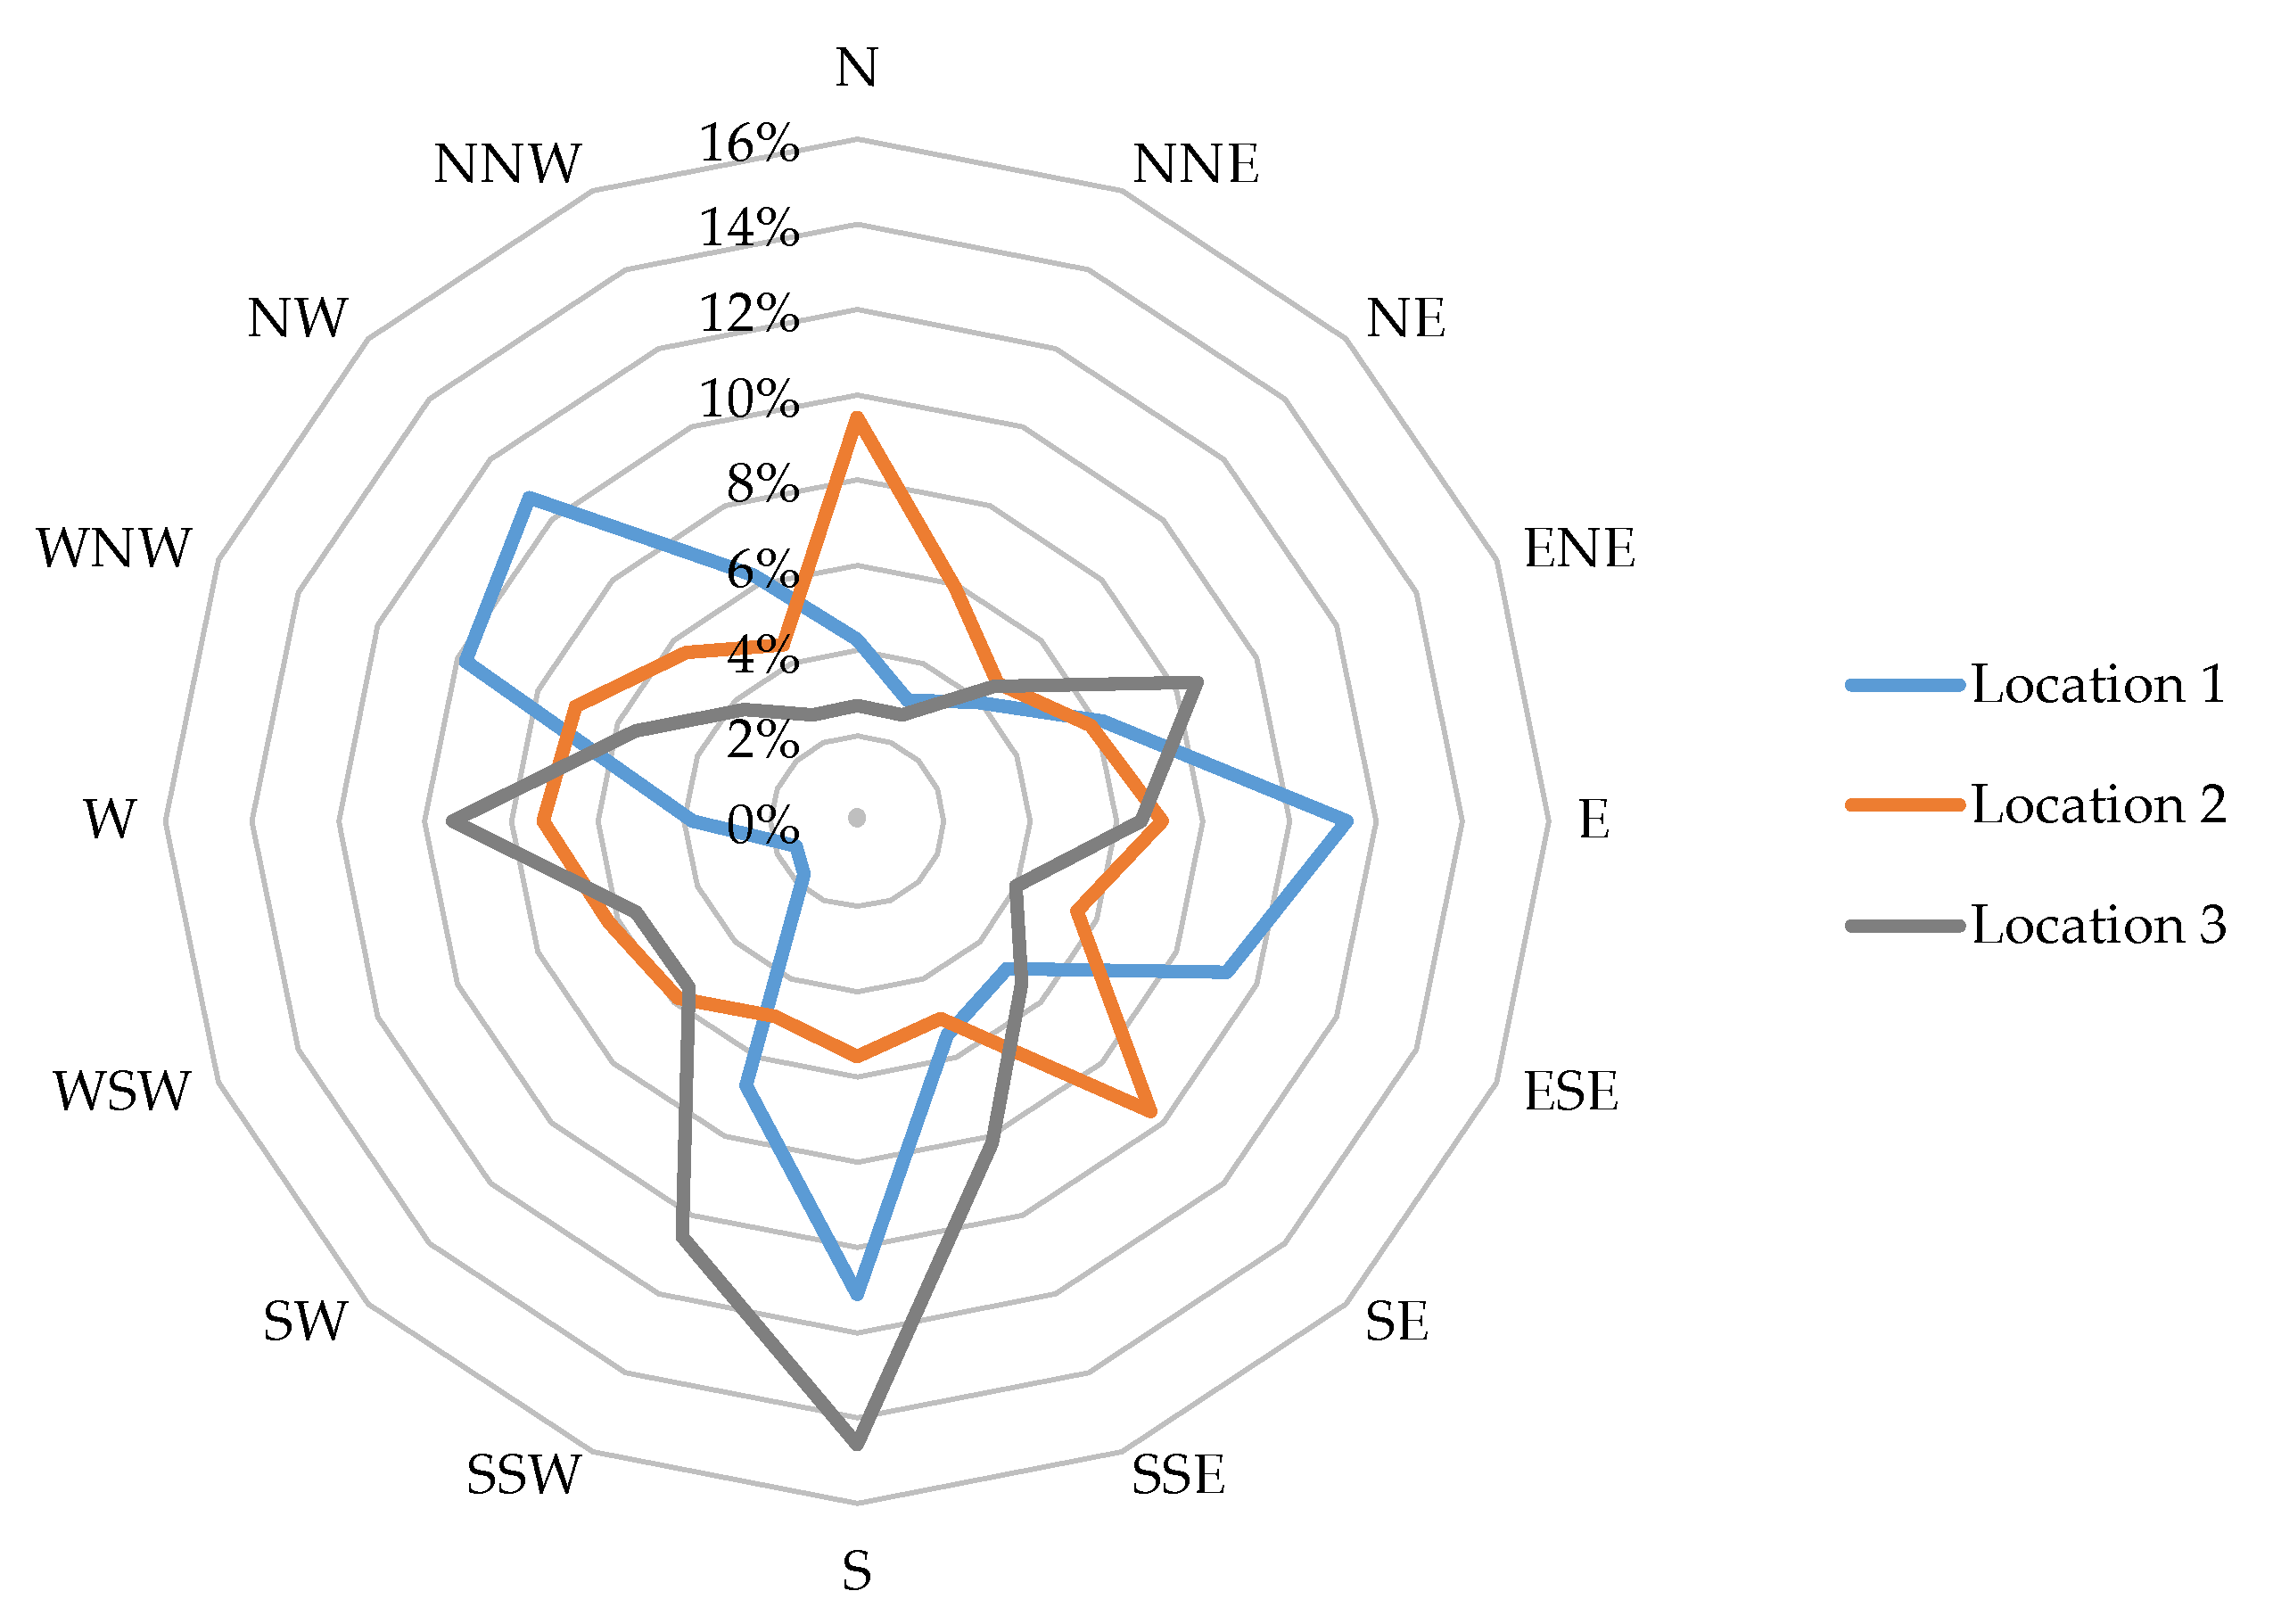
2.2. Wind Energy Potential in Poland
2.3. Economic Analysis
3. Results
4. Discussion
5. Conclusions
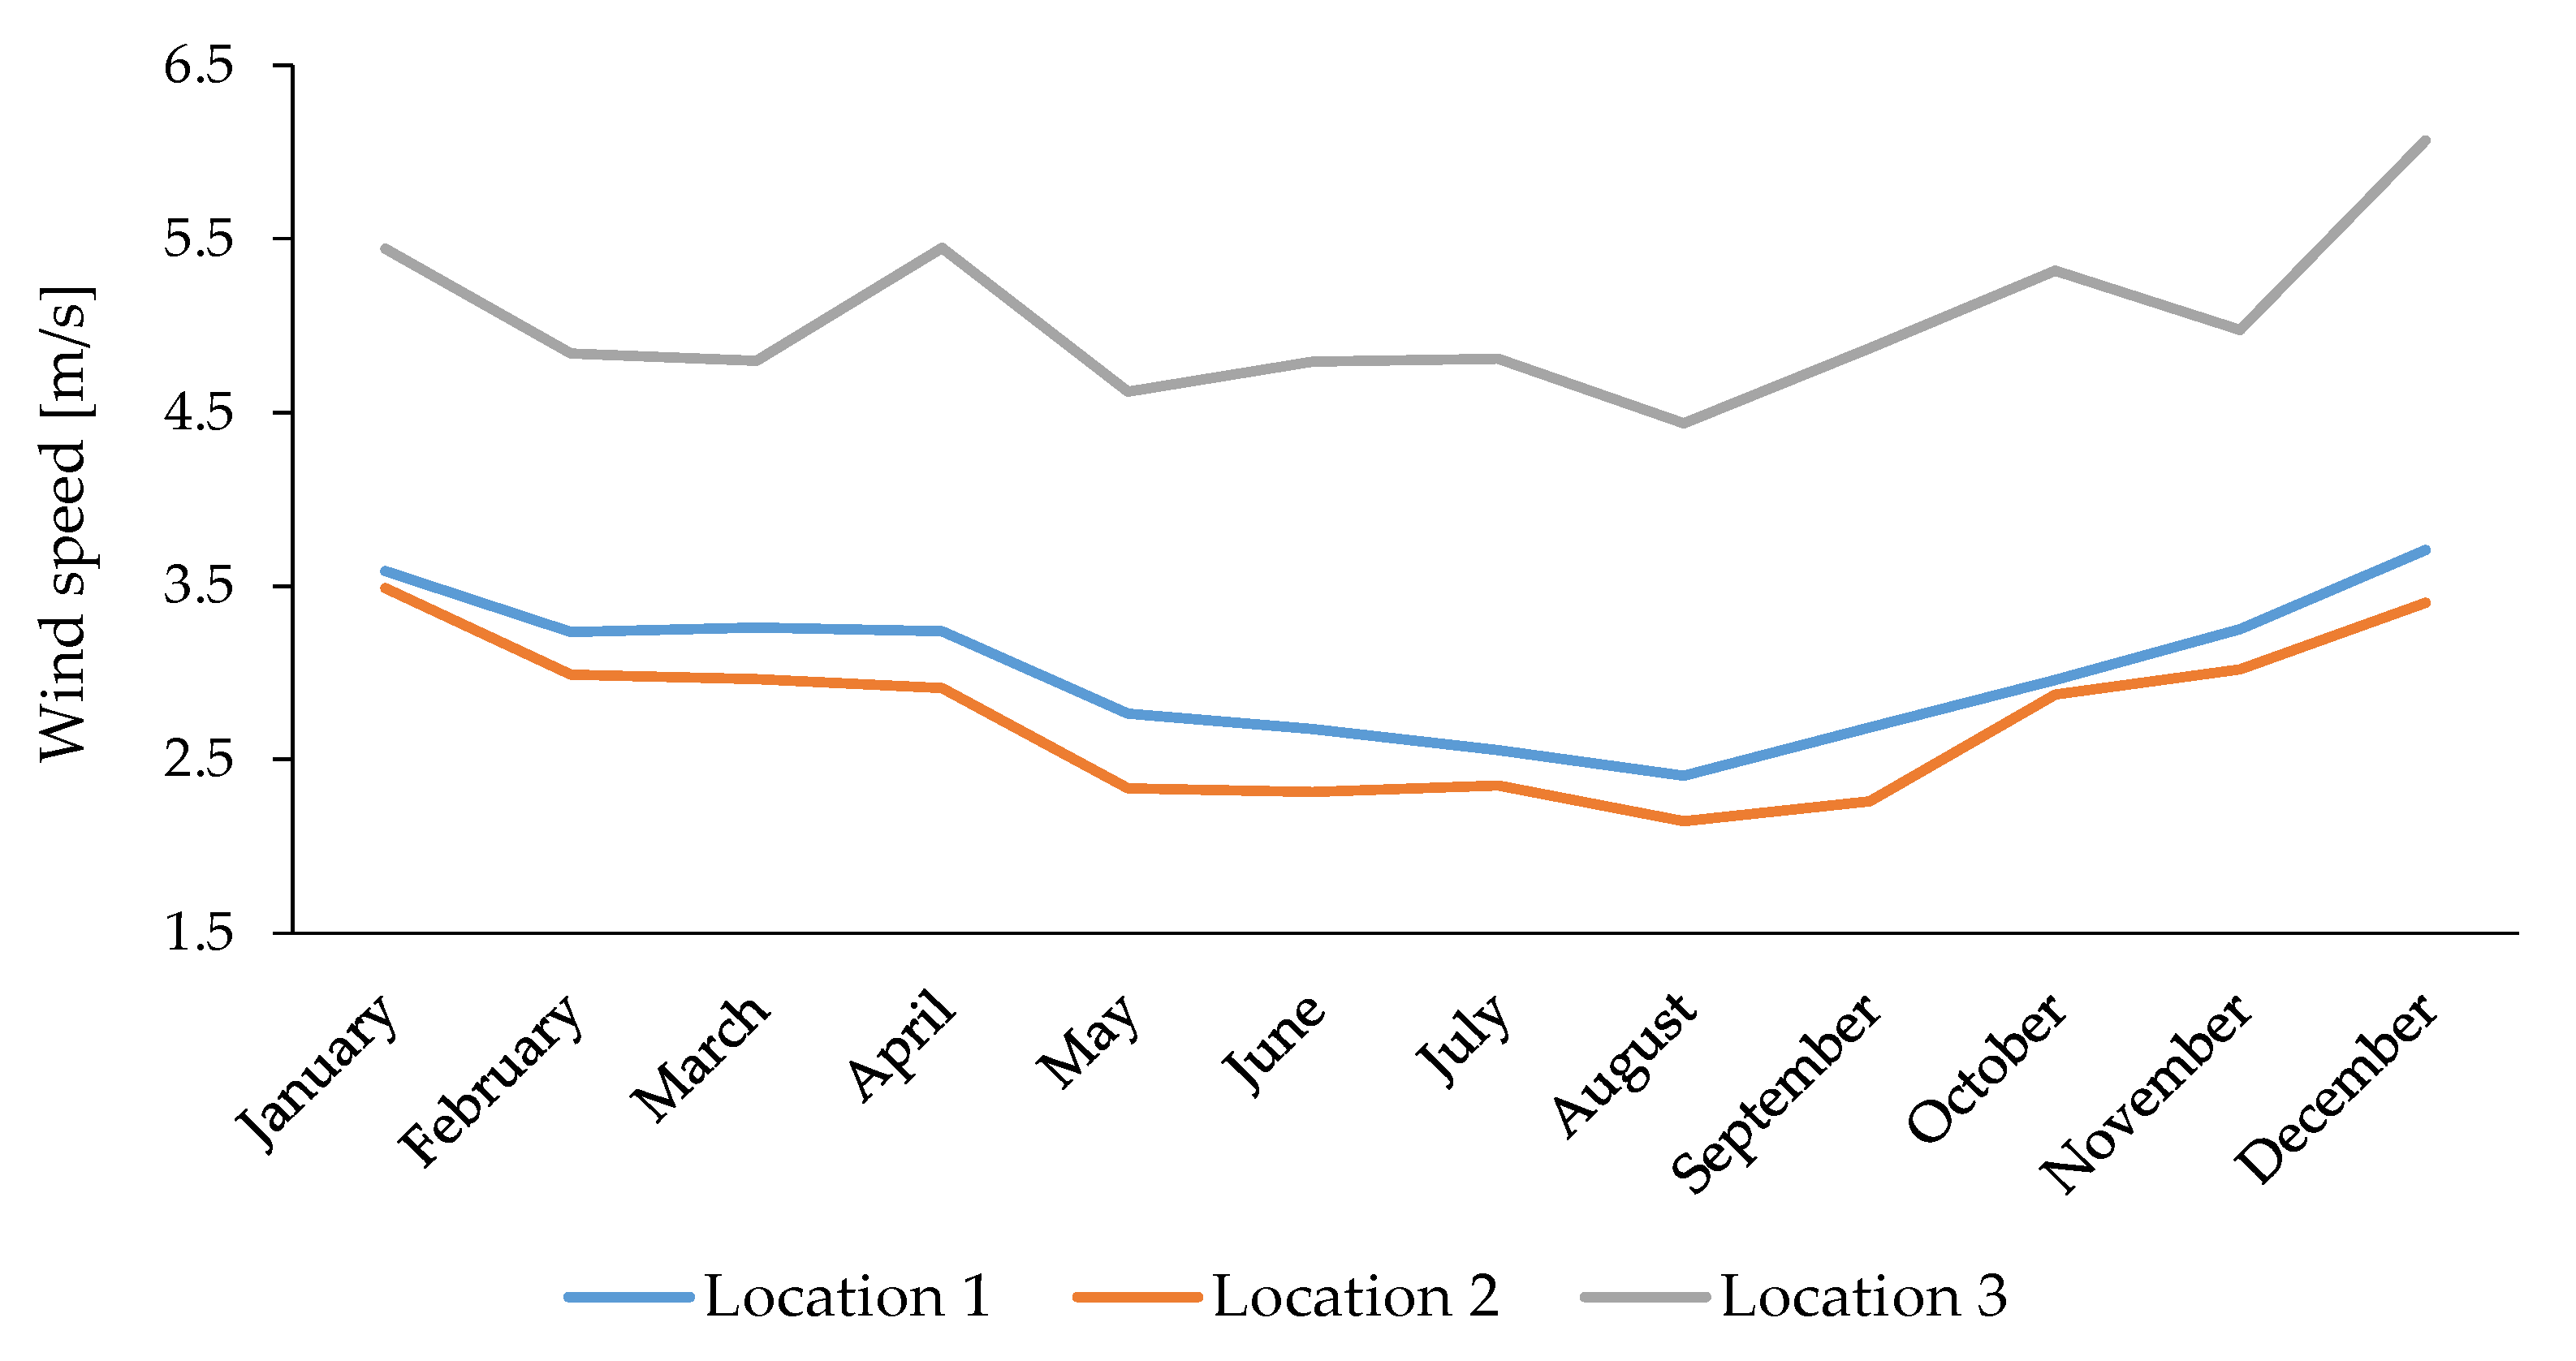
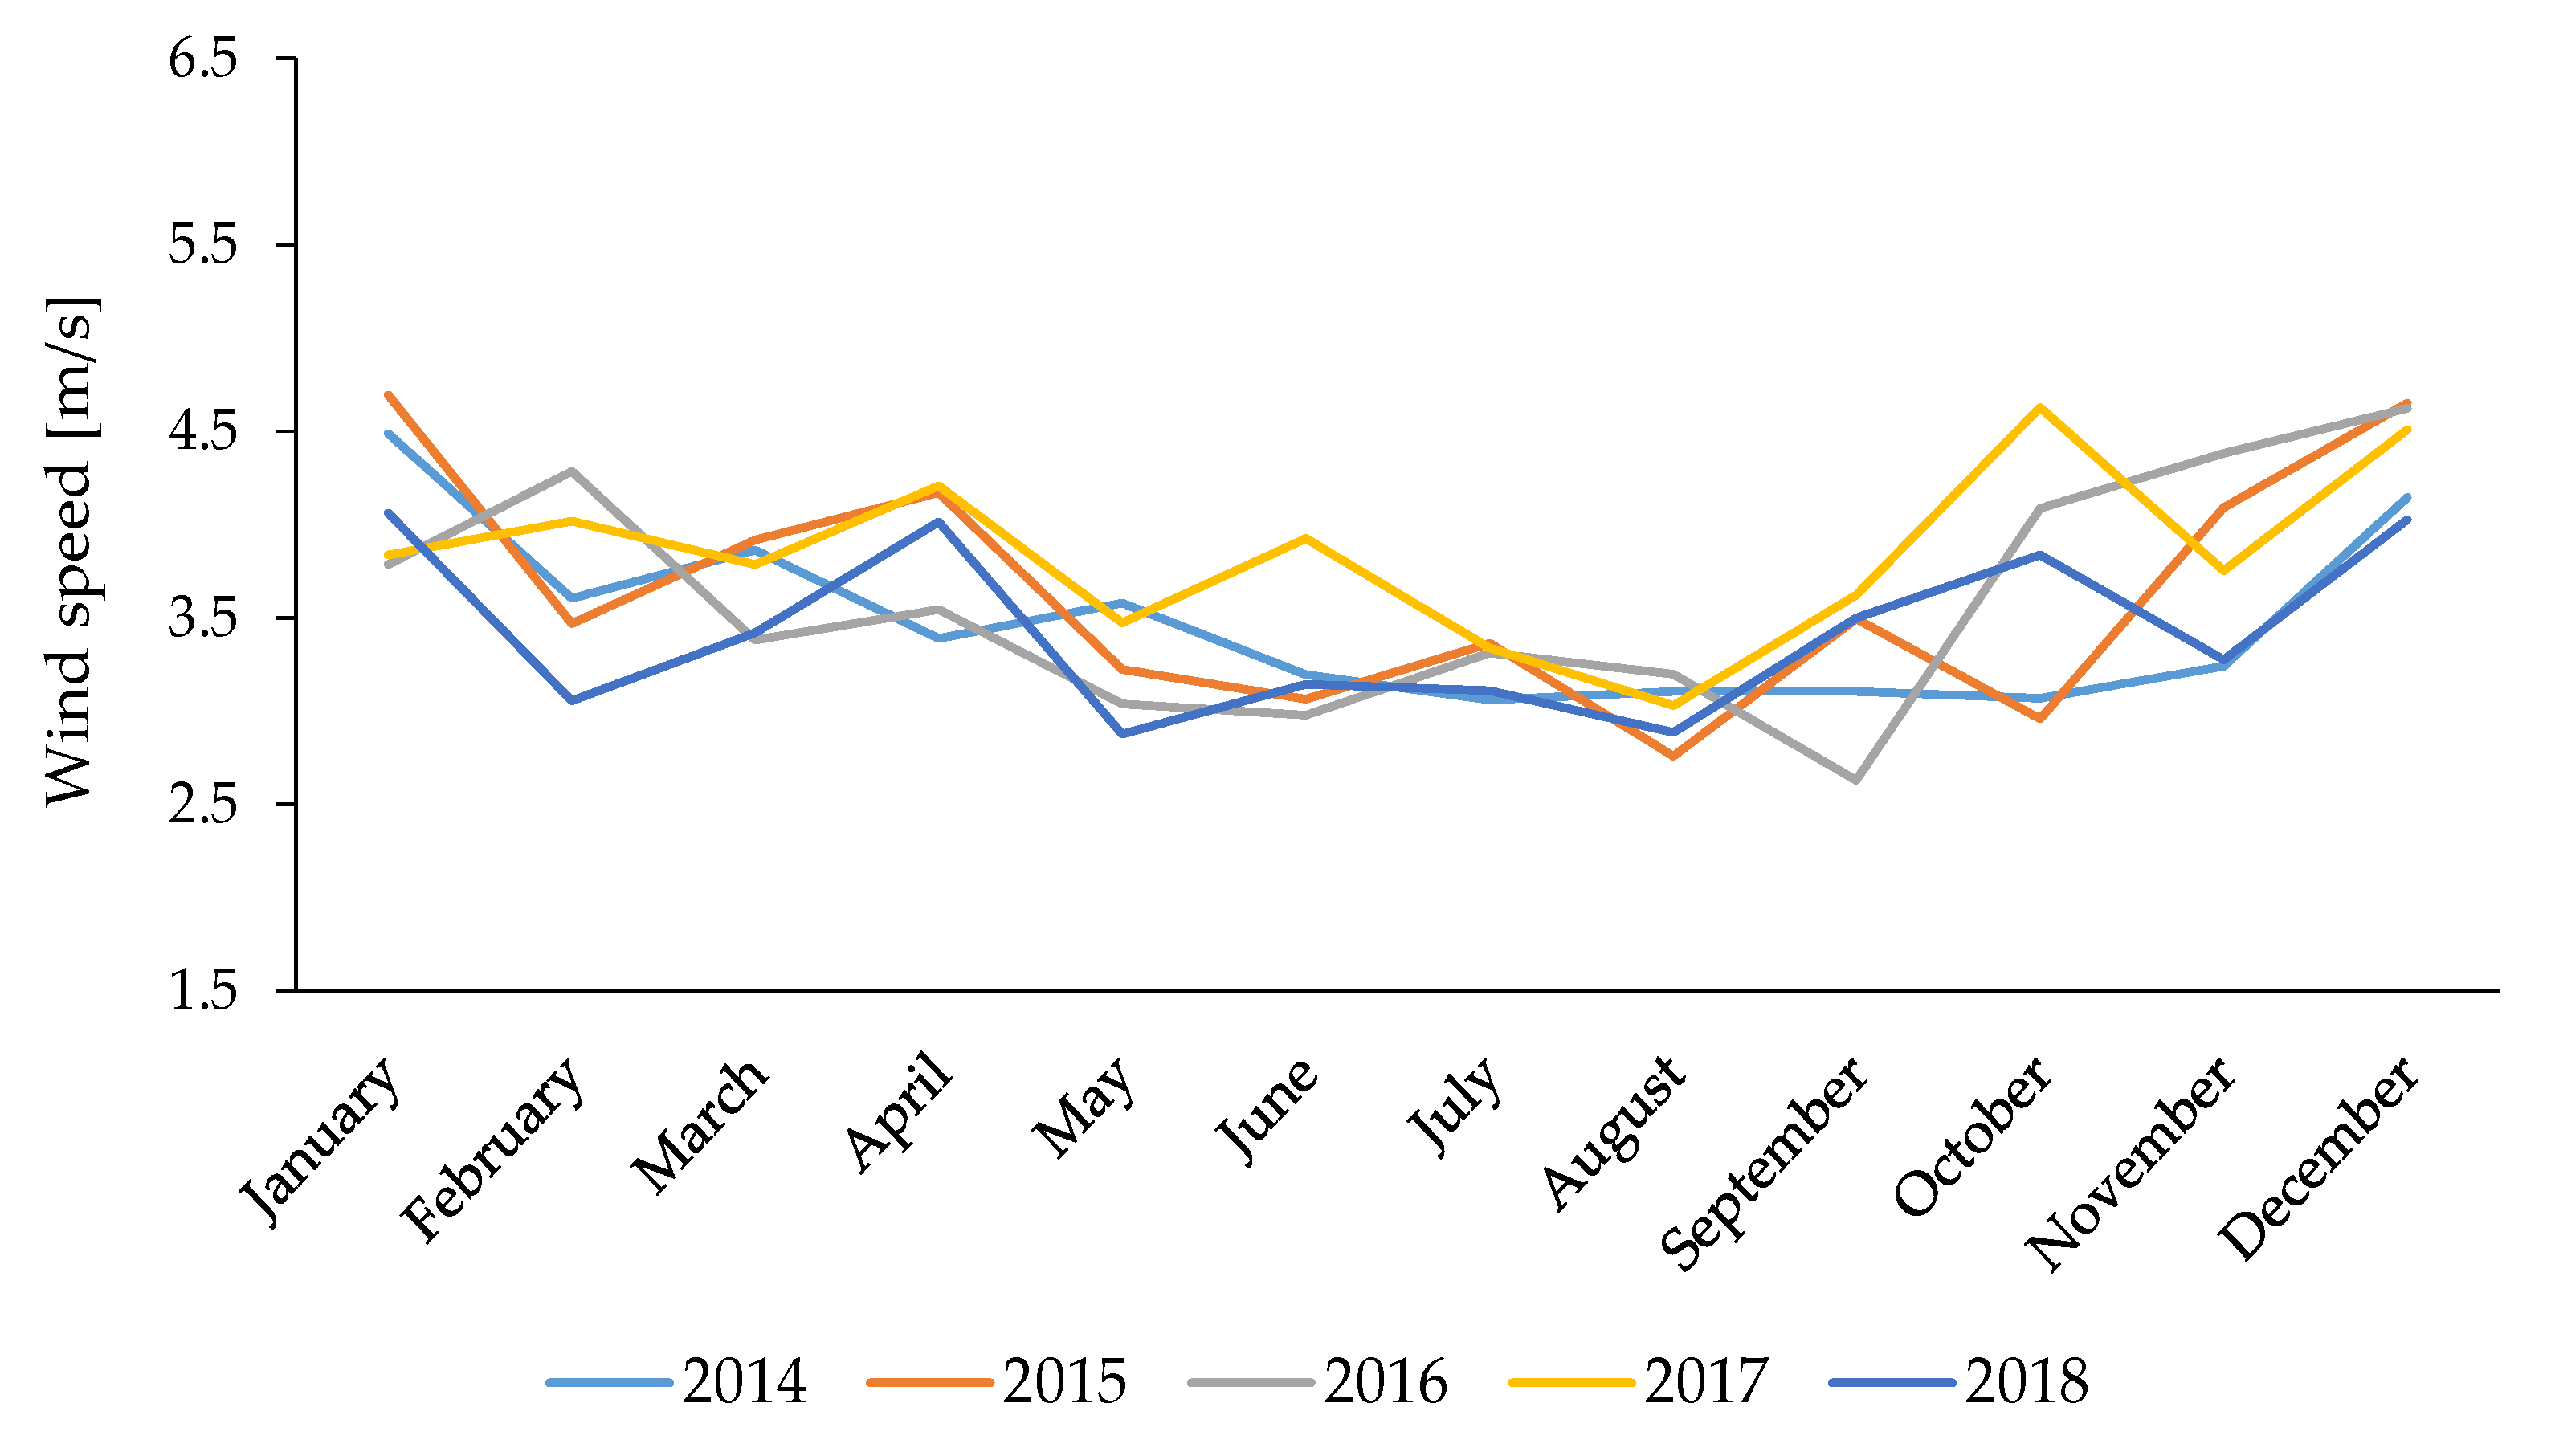
- The wind characteristics in the analysed locations have a similar windiness trend, as the windiness in autumn-winter period is higher than in spring-winter period in each location.
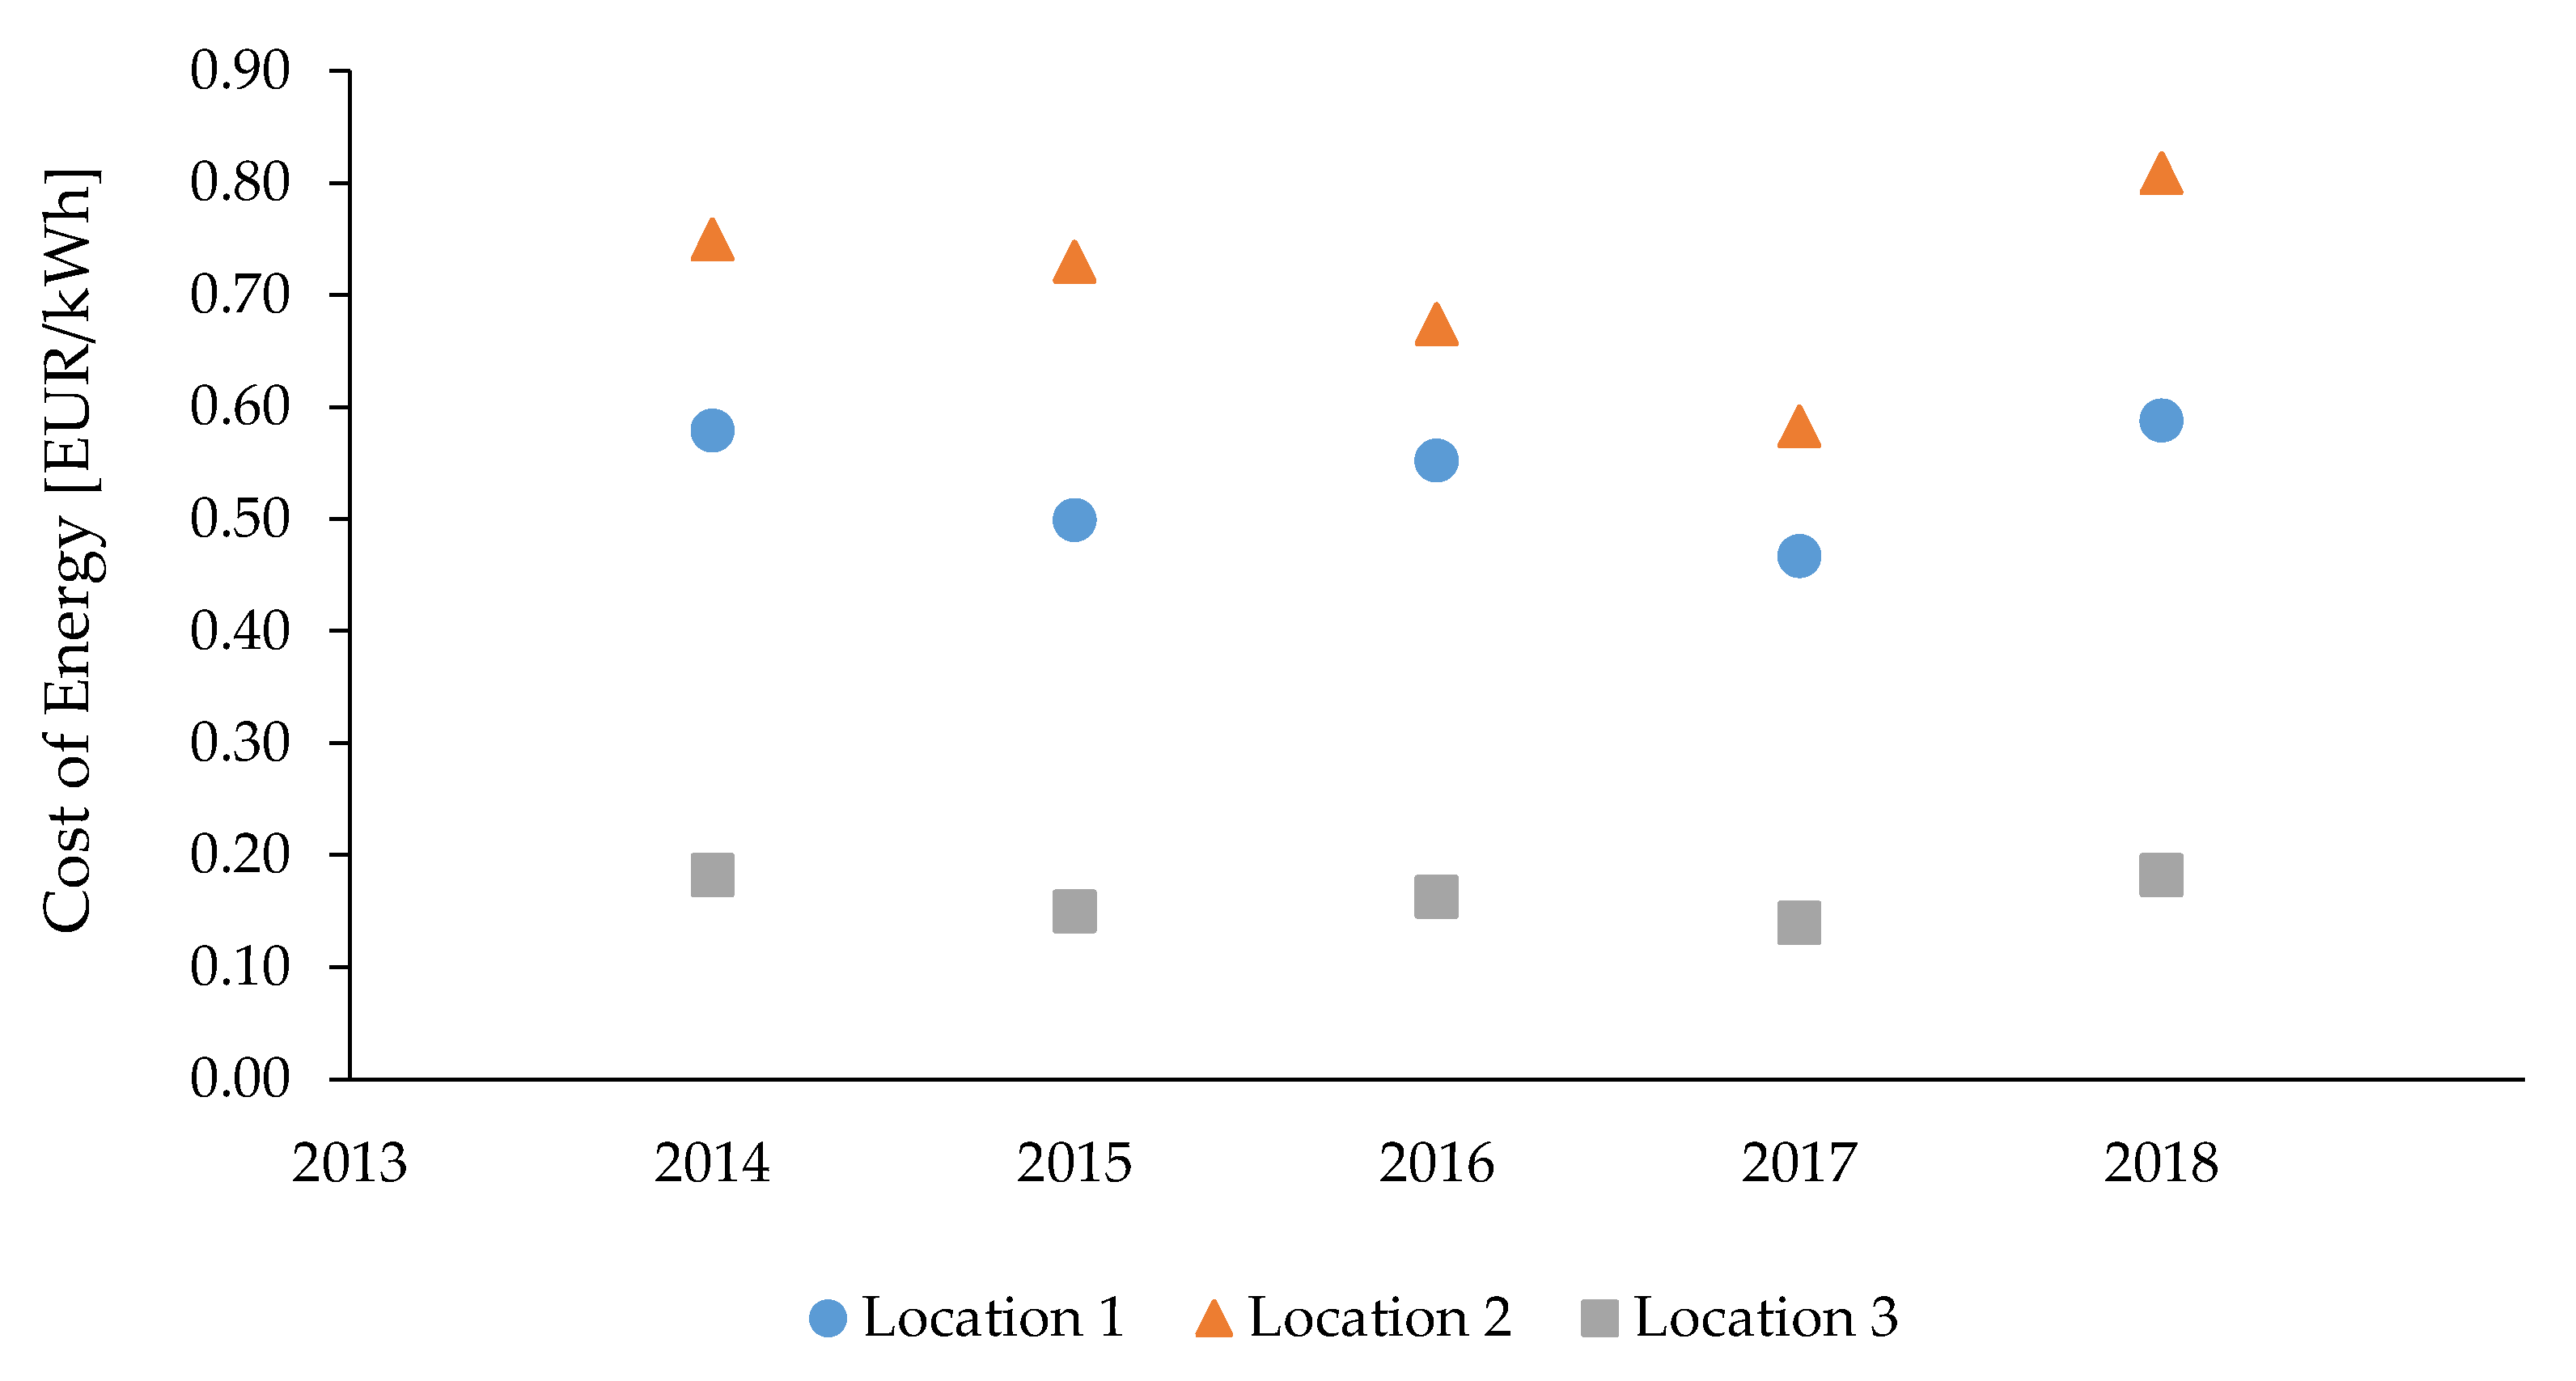
- The unit cost of electricity generation is clearly different in each location studied in different regions of Poland. This proves the necessity of thorough verification of the surroundings before investing in a small wind turbine.
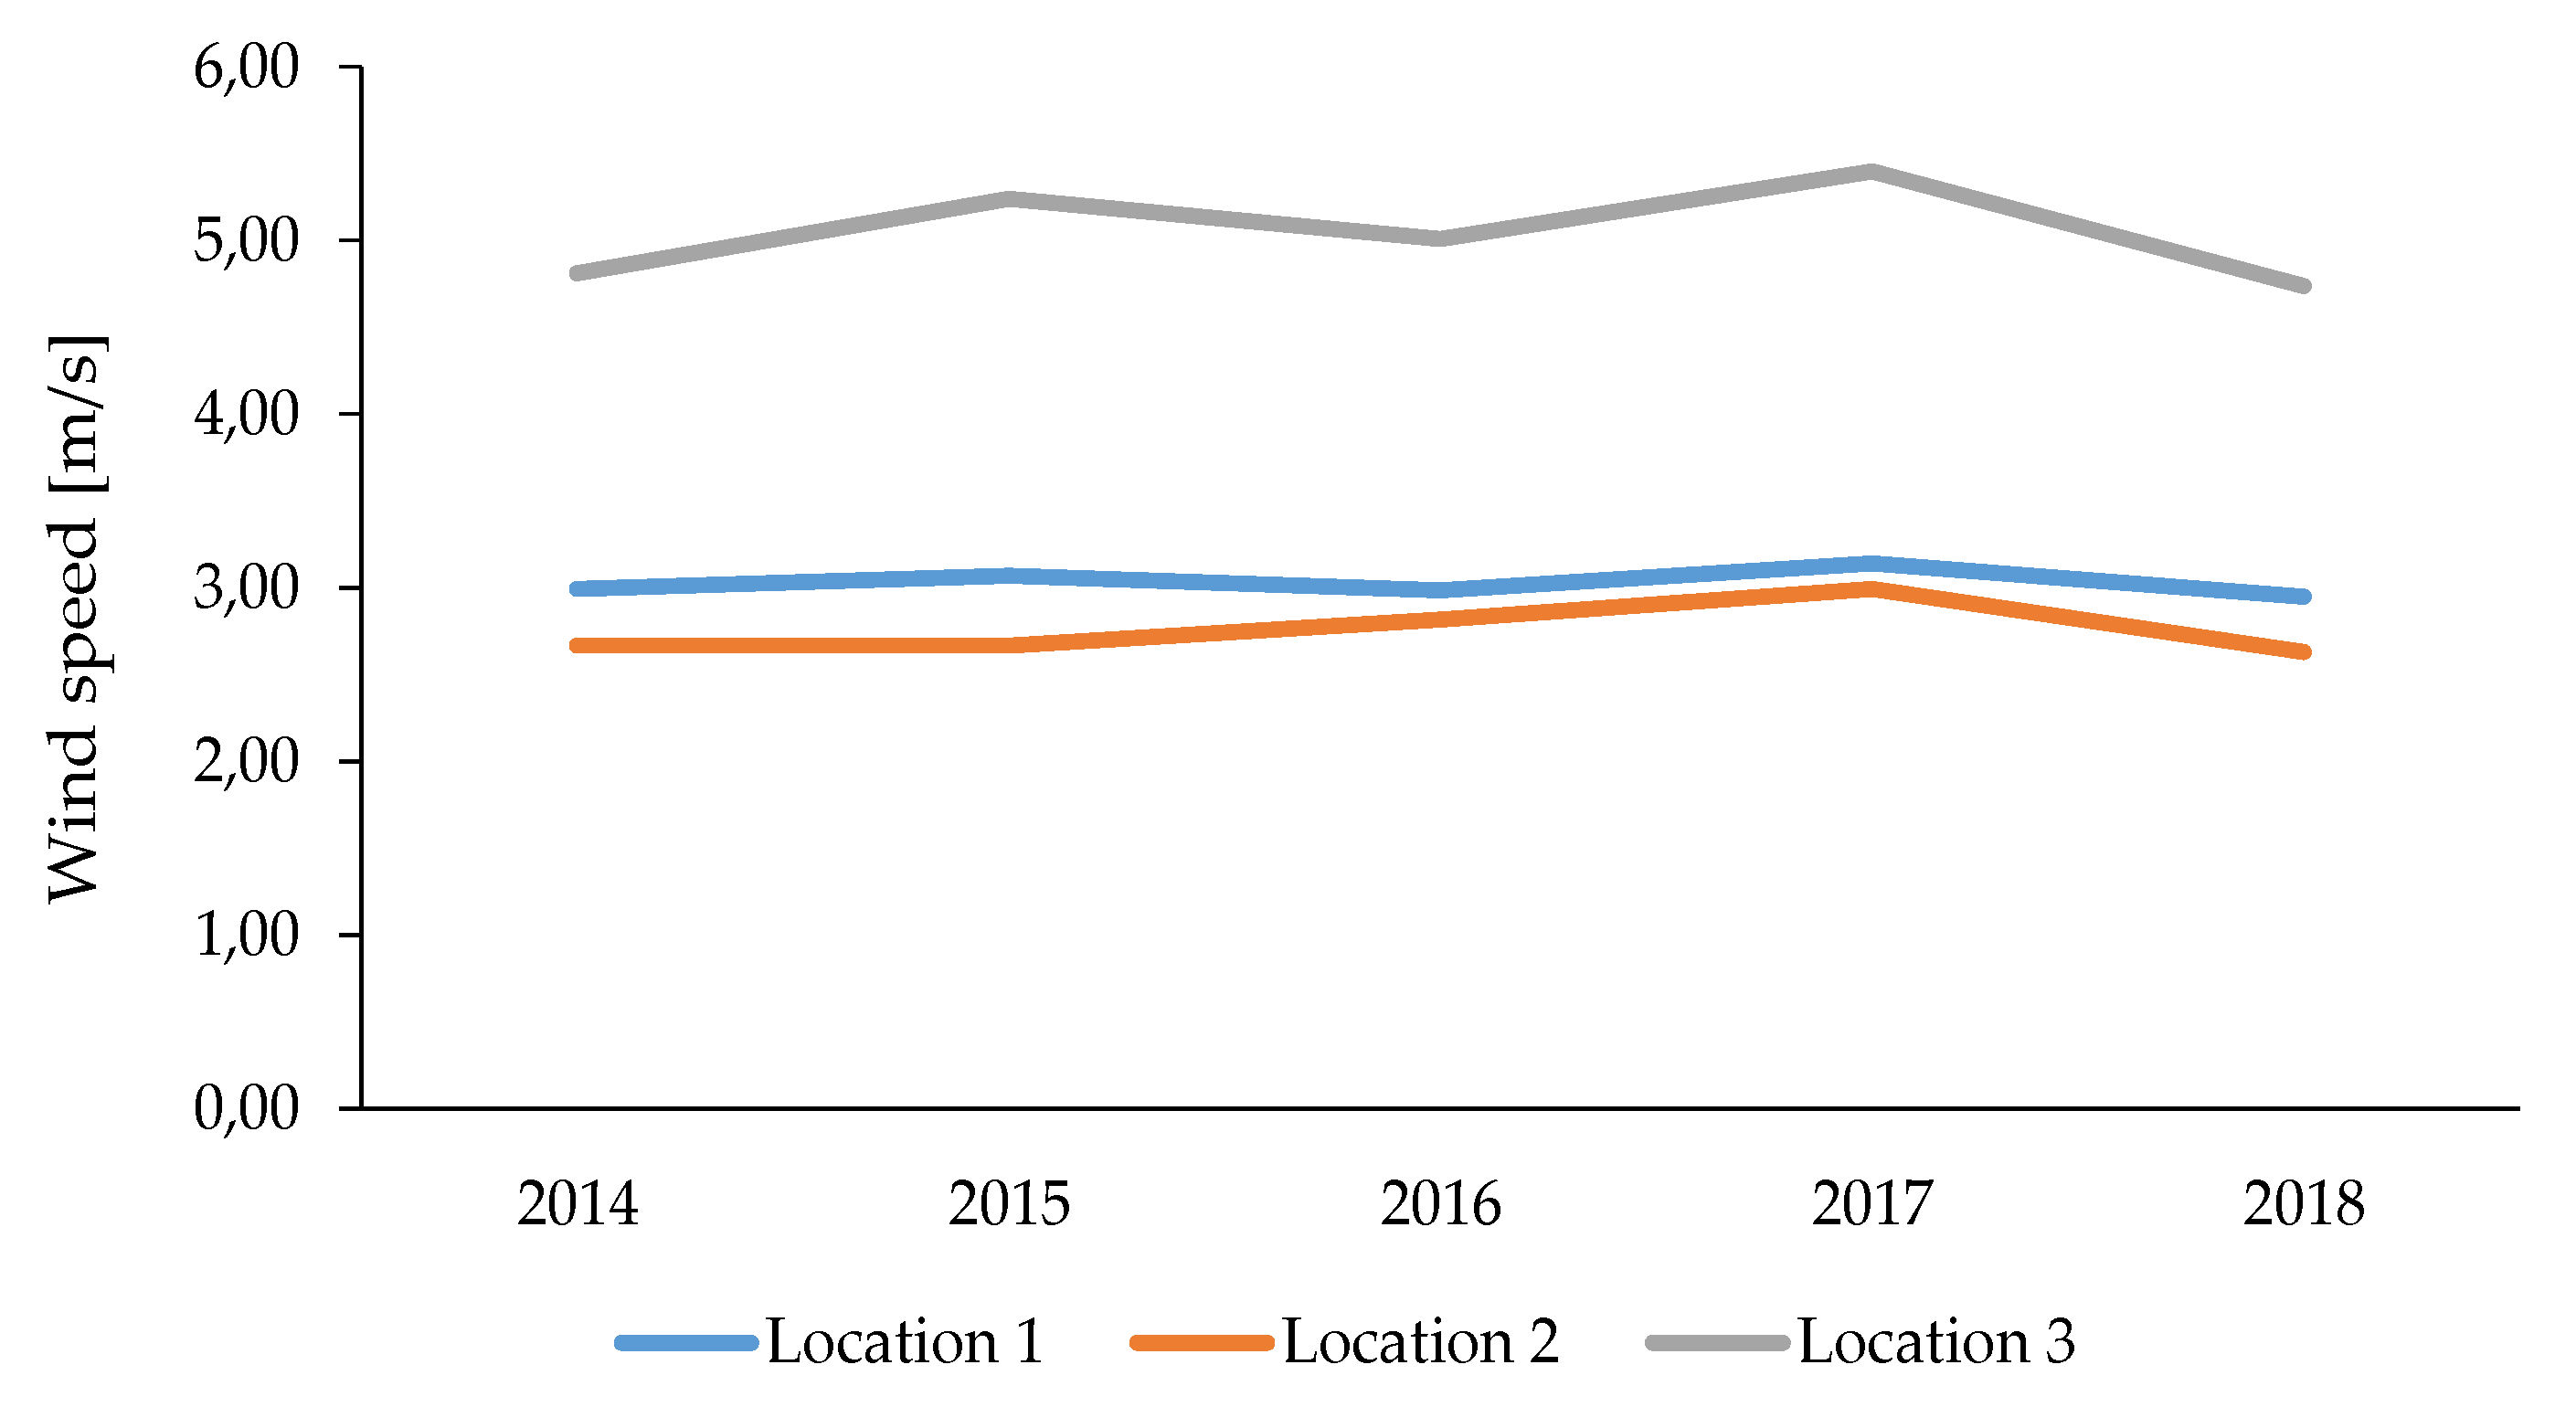
- The most favourable location for SWT installation in Poland is Location 3, which is located in the coastal belt (I wind zone).
- The conducted analysis gives an overview of the costs of wind resources in different parts of Poland, but it is not truly complete as the authors did not have all the required data for calculations, and therefore they partly used assumptions from the literature.
- Current SWTs are promising solutions for use in sparsely populated areas where there is no access to electricity from the distribution grid.
- The addition to SWTs of equipment such as diffusers to tunnel the rotor could increase SWT efficiency and promote further growth of the wind energy industry. Rotor tunnelling can also ensure efficient wind turbine operation, even in areas with less than ideal wind conditions.
Author Contributions
Funding
Institutional Review Board Statement
Informed Consent Statement
Data Availability Statement
Acknowledgments
Conflicts of Interest
Appendix A

| Wind Speed [m/s] | ||||||||||||
|---|---|---|---|---|---|---|---|---|---|---|---|---|
| January | February | March | April | May | June | July | August | September | October | November | December | |
| Location 1 | 3.59 | 3.23 | 3.26 | 3.24 | 2.77 | 2.68 | 2.55 | 2.40 | 2.69 | 2.96 | 3.25 | 3.71 |
| Location 2 | 3.49 | 2.99 | 2.96 | 2.91 | 2.33 | 2.31 | 2.35 | 2.14 | 2.26 | 2.87 | 3.02 | 3.40 |
| Location 3 | 5.44 | 4.84 | 4.80 | 5.45 | 4.62 | 4.79 | 4.81 | 4.44 | 4.87 | 5.32 | 4.98 | 6.07 |
Appendix B
| Wind Speed [m/s] | ||||||||||||
|---|---|---|---|---|---|---|---|---|---|---|---|---|
| January | February | March | April | May | June | July | August | September | October | November | December | |
| Location 1 | 3.92 | 3.32 | 3.37 | 2.82 | 3.02 | 2.74 | 2.32 | 2.40 | 2.43 | 2.67 | 3.28 | 3.60 |
| Location 2 | 4.25 | 2.89 | 2.98 | 2.49 | 2.52 | 2.03 | 2.28 | 2.13 | 2.15 | 2.38 | 2.82 | 3.05 |
| Location 3 | 5.28 | 4.61 | 5.24 | 4.86 | 5.20 | 4.80 | 4.58 | 4.78 | 4.75 | 4.15 | 3.62 | 5.78 |
| 2014 | 4.49 | 3.61 | 3.86 | 3.39 | 3.58 | 3.19 | 3.06 | 3.11 | 3.11 | 3.07 | 3.24 | 4.14 |
| Location 1 | 3.97 | 2.90 | 3.44 | 3.41 | 2.74 | 2.54 | 2.55 | 2.34 | 3.13 | 2.73 | 3.16 | 3.90 |
| Location 2 | 3.60 | 2.50 | 3.06 | 2.83 | 2.00 | 1.94 | 2.26 | 2.03 | 2.27 | 2.46 | 3.26 | 3.71 |
| Location 3 | 6.52 | 5.01 | 5.26 | 6.27 | 4.94 | 4.71 | 5.29 | 3.91 | 5.08 | 3.70 | 5.86 | 6.35 |
| 2015 | 4.70 | 3.47 | 3.92 | 4.17 | 3.23 | 3.07 | 3.36 | 2.76 | 3.49 | 2.96 | 4.09 | 4.65 |
| Location 1 | 3.34 | 3.86 | 2.79 | 2.93 | 2.63 | 2.47 | 2.74 | 2.66 | 2.03 | 3.04 | 3.78 | 3.52 |
| Location 2 | 3.08 | 3.59 | 2.94 | 2.68 | 2.20 | 2.39 | 2.54 | 2.26 | 1.82 | 3.36 | 3.34 | 3.64 |
| Location 3 | 4.94 | 5.41 | 4.42 | 5.03 | 4.29 | 4.07 | 4.65 | 4.67 | 4.04 | 5.86 | 6.02 | 6.71 |
| 2016 | 3.78 | 4.29 | 3.38 | 3.55 | 3.04 | 2.98 | 3.31 | 3.20 | 2.63 | 4.09 | 4.38 | 4.62 |
| Location 1 | 2.94 | 3.51 | 3.53 | 3.45 | 2.80 | 3.20 | 2.58 | 2.53 | 3.12 | 3.31 | 2.98 | 3.80 |
| Location 2 | 3.05 | 3.50 | 3.11 | 3.28 | 2.58 | 2.97 | 2.36 | 2.31 | 2.79 | 3.55 | 2.91 | 3.56 |
| Location 3 | 5.52 | 5.06 | 4.72 | 5.91 | 5.04 | 5.60 | 5.08 | 4.25 | 4.96 | 7.02 | 5.37 | 6.18 |
| 2017 | 3.84 | 4.02 | 3.79 | 4.21 | 3.48 | 3.92 | 3.34 | 3.03 | 3.62 | 4.63 | 3.75 | 4.51 |
| Location 1 | 3.76 | 2.58 | 3.17 | 3.60 | 2.63 | 2.42 | 2.58 | 2.09 | 2.71 | 3.04 | 3.05 | 3.72 |
| Location 2 | 3.47 | 2.47 | 2.74 | 3.28 | 2.37 | 2.23 | 2.31 | 1.98 | 2.27 | 2.62 | 2.76 | 3.05 |
| Location 3 | 4.96 | 4.12 | 4.35 | 5.18 | 3.64 | 4.78 | 4.44 | 4.59 | 5.53 | 5.85 | 4.01 | 5.32 |
| 2018 | 4.06 | 3.06 | 3.42 | 4.02 | 2.88 | 3.14 | 3.11 | 2.89 | 3.50 | 3.84 | 3.28 | 4.03 |
References
- Lee, J.; Zhao, F. Global Wind Report; Global Wind Energy Council: Brussels, Belgium, 2019. [Google Scholar]
- Gnatowska, R.; Was, A. Wind Energy in Poland—Economic Analysis of Wind Farm. In Proceedings of the E3S Web of Conferences, EDP Sciences, Cracow, Poland, 15 March 2017; Volume 14. [Google Scholar]
- Moc Zainstalowana (MW)—Potencjał Krajowy OZE w Liczbach—Urząd Regulacji Energetyki. Available online: https://www.ure.gov.pl/pl/oze/potencjal-krajowy-oze/5753,Moc-zainstalowana-MW.html (accessed on 8 February 2021).
- Igliński, B.; Iglińska, A.; Koziński, G.; Skrzatek, M.; Buczkowski, R. Wind Energy in Poland—History, Current State, Surveys, Renewable Energy Sources Act, SWOT Analysis. Renew. Sustain. Energy Rev. 2016, 64, 19–33. [Google Scholar] [CrossRef]
- Orkan Sabrina Nakręcił Polskie Wiatraki. Rekordowa Generacja|GRAMwZIELONE.Pl. Available online: https://www.gramwzielone.pl/energia-wiatrowa/102441/orkan-sabina-nakrecil-polskie-wiatraki-rekordowa-generacja (accessed on 10 February 2021).
- Global Wind Power Statistics—Wind Energy International Platform. Available online: https://library.wwindea.org/global-statistics/ (accessed on 8 February 2021).
- International Standard IEC 61400-2. Wind Turbines-Part 2: Small Wind Turbines; International Electrotechnical Commission: Geneva, Switzerland, 2013; ISBN 9782832212844. [Google Scholar]
- Tummala, A.; Velamati, R.K.; Sinha, D.K.; Indraja, V.; Krishna, V.H. A Review on Small Scale Wind Turbines. Renew. Sustain. Energy Rev. 2016, 56, 1351–1371. [Google Scholar] [CrossRef]
- Sonnichsen, N. Capacity of Small Wind Turbines Worldwide 2018|Statista. Available online: https://www.statista.com/statistics/269885/capacity-of-small-wind-turbines-worldwide/ (accessed on 10 February 2021).
- Bukala, J.; Damaziak, K.; Kroszczynski, K.; Krzeszowiec, M.; Malachowski, J. Investigation of Parameters Influencing the Efficiency of Small Wind Turbines. J. Wind Eng. Ind. Aerodyn. 2015, 146, 29–38. [Google Scholar] [CrossRef]
- Bukala, J.; Damaziak, K.; Karimi, H.R.; Kroszczynski, K.; Krzeszowiec, M.; Malachowski, J. Modern Small Wind Turbine Design Solutions Comparison in Terms of Estimated Cost to Energy Output Ratio. Renew. Energy 2015, 83, 1166–1173. [Google Scholar] [CrossRef]
- Pitteloud, J.-D.; Gsänger, S. Small Wind World Report; World Wind Energy Association: Bonn, Germany, 2016. [Google Scholar]
- Terrapon-Pfaff, J.; Dienst, C.; König, J.; Ortiz, W. A Cross-Sectional Review: Impacts and Sustainability of Small-Scale Renewable Energy Projects in Developing Countries. Renew. Sustain. Energy Rev. 2014, 40, 1–10. [Google Scholar] [CrossRef] [Green Version]
- Grijalva, S.; Tariq, M.U. Prosumer-Based Smart Grid Architecture Enables a Flat, Sustainable Electricity Industry. In Proceedings of the IEEE PES Innovative Smart Grid Technologies Conference Europe, ISGT Europe, Anaheim, CA, USA, 17–19 January 2011. [Google Scholar]
- Olasek, K.; Karczewski, M.; Lipian, M.; Wiklak, P.; Józwik, K. Wind Tunnel Experimental Investigations of a Diffuser Augmented Wind Turbine Model. Int. J. Numer. Methods Heat Fluid Flow 2016, 26, 2033–2047. [Google Scholar] [CrossRef]
- Bukala, J.; Damaziak, K.; Karimi, H.R.; Malachowski, J. Aero-Elastic Coupled Numerical Analysis of Small Wind Turbine-Generator Modelling. Wind Struct. Int. J. 2016, 23, 577–594. [Google Scholar] [CrossRef]
- Bukala, J.; Damaziak, K.; Karimi, H.R.; Malachowski, J.; Robbersmyr, K.G. Evolutionary Computing Methodology for Small Wind Turbine Supporting Structures. Int. J. Adv. Manuf. Technol. 2019, 100, 2741–2752. [Google Scholar] [CrossRef] [Green Version]
- Kim, K.; Lim, C.; Oh, Y.O.; Kwon, I.; Yoo, N.; Paek, I. Time-Domain Dynamic Simulation of a Wind Turbine Including Yaw Motion for Power Prediction. Int. J. Precis. Eng. Manuf. 2014, 15, 2199–2203. [Google Scholar] [CrossRef]
- Pagnini, L.C.; Burlando, M.; Repetto, M.P. Experimental power curve of small-size wind turbines in turbulent urban environment. Appl. Energy 2019, 154, 112–121. [Google Scholar] [CrossRef]
- Vita, G.; Šarkić-Glumac, A.; Hemida, H.; Salvadori, S.; Baniotopoulos, C. On the Wind Energy Resource above High-Rise Buildings. Energies 2020, 13, 3641. [Google Scholar] [CrossRef]
- Sakka, E.G.; Bilionis, D.V.; Vamvatsikos, D.; Gantes, C.J. Onshore Wind Farm Siting Prioritization Based on Investment Profitability for Greece. Renew. Energy 2020, 146, 2827–2839. [Google Scholar] [CrossRef]
- Ayodele, T.R.; Ogunjuyigbe, A.S.O.; Amusan, T.O. Wind Power Utilization Assessment and Economic Analysis of Wind Turbines across Fifteen Locations in the Six Geographical Zones of Nigeria. J. Clean. Prod. 2016, 129, 341–349. [Google Scholar] [CrossRef]
- Grieser, B.; Sunak, Y.; Madlener, R. Economics of Small Wind Turbines in Urban Settings: An Empirical Investigation for Germany. Renew. Energy 2015, 78, 334–350. [Google Scholar] [CrossRef]
- Rodriguez-Hernandez, O.; Martinez, M.; Lopez-Villalobos, C.; Garcia, H.; Campos-Amezcua, R. Techno-Economic Feasibility Study of Small Wind Turbines in the Valley of Mexico Metropolitan Area. Energies 2019, 12, 890. [Google Scholar] [CrossRef] [Green Version]
- Campisi, D.; Gitto, S.; Morea, D. Effectiveness of Incentives for Wind Energy: Models and Empirical Evidences from an Italian Case Study. J. Sustain. Sci. Manag. 2016, 11, 39–48. [Google Scholar]
- Morea, D.; Poggi, L.A. An Innovative Model for the Sustainability of Investments in the Wind Energy Sector: The Use of Green Sukuk in an Italian Case Study. Int. J. Energy Econ. Policy 2017, 7, 53–60. [Google Scholar]
- Gutiérrez-Pedrero, M.-J.; Ruiz-Fuensanta, M.J.; Tarancón, M.-Á. Regional Factors Driving the Deployment of Wind Energy in Spain. Energies 2020, 13, 3590. [Google Scholar] [CrossRef]
- DR ZĄBER ZEFIR. Available online: http://zaber.com.pl/zefir/ (accessed on 2 February 2021).
- Lydia, M.; Kumar, S.S.; Selvakumar, A.I.; Prem Kumar, G.E. A Comprehensive Review on Wind Turbine Power Curve Modeling Techniques. Renew. Sustain. Energy Rev. 2014, 30, 452–460. [Google Scholar] [CrossRef]
- Bakırcı, M.; Yılmaz, S. Theoretical and Computational Investigations of the Optimal Tip-Speed Ratio of Horizontal-Axis Wind Turbines. Eng. Sci. Technol. Int. J. 2018, 21, 1128–1142. [Google Scholar] [CrossRef]
- Karczewski, M.; Baszczynski, P.; Wiklak, P.; Sobczak, K.; Jozwik, K. Economic Analysis of Small Wind Turbines. J. Mach. Eng. 2017, 17, 112–123. [Google Scholar]
- Saint-Drenan, Y.M.; Besseau, R.; Jansen, M.; Staffell, I.; Troccoli, A.; Dubus, L.; Schmidt, J.; Gruber, K.; Simões, S.G.; Heier, S. A Parametric Model for Wind Turbine Power Curves Incorporating Environmental Conditions. Renew. Energy 2020, 157, 754–768. [Google Scholar] [CrossRef]
- Brzezińska-Rawa, A.; Goździewicz-Biechońska, J. Recent Developments in the Wind Energy Sector in Poland. Renew. Sustain. Energy Rev. 2014, 38, 79–87. [Google Scholar] [CrossRef]
- USER’S GUIDE Vaisala WINDCAP® Ultrasonic Wind Sensor WS425; Vaisala Oyj: Helsinki, Finland, 2010.
- Bukala, J.; Damaziak, K.; Kroszczynski, K.; Malachowski, J.; Szafranski, T.; Tomaszewski, M.; Karimi, H.R.; Jozwik, K.; Karczewski, M.; Sobczak, K. Small Wind Turbines: Specification, Design, and Economic Evaluation. In Wind Turbines—Design, Control and Applications; InTech: Rijeka, Croatia, 2016; pp. 73–93. [Google Scholar]
- Rao, K.R. Wind Energy Economics in Wind Energy for Power Generation; Springer: Cham, Switzerland, 2019; pp. 427–701. ISBN 9783319751344. [Google Scholar]
- Michalak, P. Ocena zasobów energii wiatru na potrzeby małej energetyki wiatrowej. Elektrotechnika i Elektron. 2009, 28, 14–19. [Google Scholar]
- Eurostat—Data Explorer. Available online: https://appsso.eurostat.ec.europa.eu/nui/show.do?dataset=nrg_pc_205&lang=en (accessed on 23 February 2021).
- Statistical Analyses. Energy Consumption in Households in 2018; Główny Urząd Statystyczny: Warsaw, Poland, 2019. [Google Scholar]
- Bussel, G.J.W. Electricity Generation with Small Wind Turbines in Renewable Energy Systems; Springer: New York, NY, USA, 2013; pp. 696–727. ISBN 9781461458203. [Google Scholar]
- Boczar, T. Wykorzystanie Energii Wiatru; PAK: Warszawa, Poland, 2010; ISBN 978-83-926319-6-5. [Google Scholar]
- Uniewicz, C. 10 Czy 30 Lat? Jaka Jest Rzeczywista Stopa Zwrotu Mikroinstalacji?|GRAMwZIELONE.Pl. Available online: https://www.gramwzielone.pl/energia-sloneczna/21908/10-czy-30-lat-jaka-jest-rzeczywista-stopa-zwrotu-mikroinstalacji (accessed on 25 February 2021).
- Jiang, H.; Li, Y.; Cheng, Z. Performances of Ideal Wind Turbine. Renew. Energy 2015, 83, 658–662. [Google Scholar] [CrossRef]
- Karczewski, M.; Sobczak, K.; Lipian, M.; Jozwik, K. Numerical and experimental tools for small wind turbine load analysis. In Structural Control and Fault Detection of Wind Turbine Systems; The Institution of Engineering and Technology: London, UK, 2018; pp. 45–79. ISBN 9781785613944. [Google Scholar]
- STOW Project Main Site. Available online: http://www.stow.wat.edu.pl/ (accessed on 25 February 2021).
- Lipian, M.; Dobrev, I.; Karczewski, M.; Massouh, F.; Jozwik, K. Small Wind Turbine Augmentation: Experimental Investigations of Shrouded- and Twin-Rotor Wind Turbine Systems. Energy 2019, 186, 115855. [Google Scholar] [CrossRef] [Green Version]
- Sliz-Szkliniarz, B.; Eberbach, J.; Hoffmann, B.; Fortin, M. Assessing the Cost of Onshore Wind Development Scenarios: Modelling of Spatial and Temporal Distribution of Wind Power for the Case of Poland. Renew. Sustain. Energy Rev. 2019, 109, 514–531. [Google Scholar] [CrossRef]


| Type of RES Installation | Installed Capacity [MW] | ||
|---|---|---|---|
| 2010 | 2015 | 2019 | |
| Biogas | 82.884 | 212.497 | 245.366 |
| Biomass | 356.190 | 1122.670 | 1492.875 |
| Solar energy | 0.033 | 71.031 | 477.679 |
| Wind energy | 1180.272 | 4582.036 | 5917.243 |
| Hydropower | 937.044 | 981.799 | 973.095 |
| Total | 2556.423 | 6970.033 | 9106.258 |
| Parameters | Value |
|---|---|
| Measured mast height | 15.0 m |
| Rotor diameter | 10.0 m |
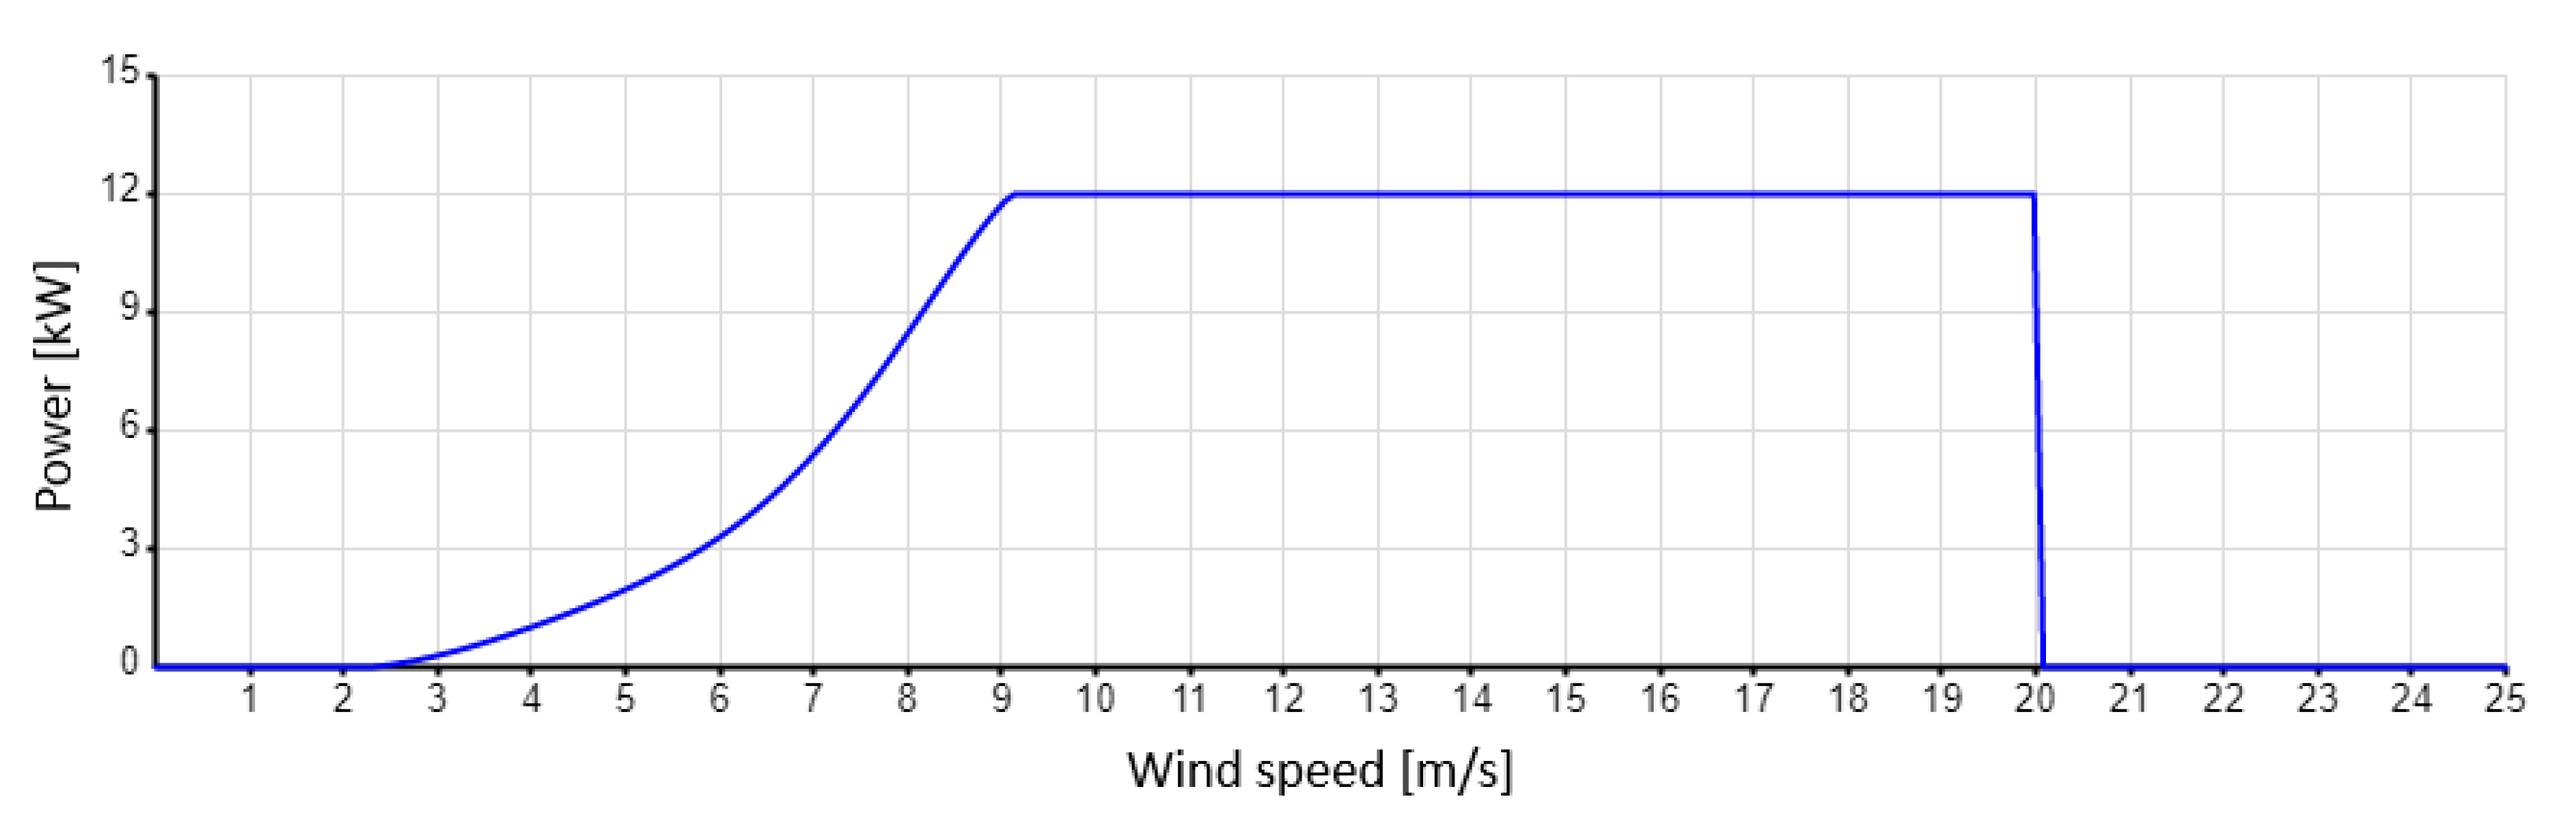
| Nominal power | 12.0 kW |
| Number of blades | 3 |
| Cut-in speed | 3.0 m/s↑ and 15.0 m/s↓ (10 min. average) |
| Cut-out speed | 2.0 m/s↑ and 20.0 m/s↓ (10 min. average) |
| Wind speed for nominal power (rated) | 9.0 m/s |
| Rotational speed range | 30–125 rpm |
| Net price of the power plant | 173,000.00 PLN = 38,022.00 EUR |
| Tip speed ratio (TSR) | 5.82 |
| 2014 | 2015 | 2016 | 2017 | 2018 | |
|---|---|---|---|---|---|
| Location 1 | 2.99 | 3.07 | 2.98 | 3.14 | 2.95 |
| Location 2 | 2.67 | 2.66 | 2.81 | 2.99 | 2.63 |
| Location 3 | 4.81 | 5.24 | 5.01 | 5.39 | 4.73 |
| Amount of Electric Energy Produced [kWh] | ||||||
|---|---|---|---|---|---|---|
| 2014 | 2015 | 2016 | 2017 | 2018 | Total 2014–2018 | |
| Location 1 | 6946.0 | 8089.0 | 7287.0 | 8661.0 | 6831.0 | 37,815.0 |
| Location 2 | 5333.0 | 5481.0 | 5945.0 | 6898.0 | 4933.0 | 28,590.0 |
| Location 3 | 23,375.0 | 28,963.0 | 26,519.0 | 31,403.0 | 23,416.0 | 133,676.0 |
| Location | AEP [kWh] | COE [EUR/kWh] | s [EUR/Year] | Capacity Factor | SPBT [Years] | Payback Time for a Turbine with a Diffuser [Years] |
|---|---|---|---|---|---|---|
| Location 1 | 7562.92 | 0.53 | 974.23 | 0.07 | 44.2 | 17.7 |
| Location 2 | 5718.02 | 0.70 | 746.75 | 0.05 | 57.5 | 23.0 |
| Location 3 | 26,735.28 | 0.16 | 3338.18 | 0.25 | 12.9 | 5.2 |
Publisher’s Note: MDPI stays neutral with regard to jurisdictional claims in published maps and institutional affiliations. |
© 2021 by the authors. Licensee MDPI, Basel, Switzerland. This article is an open access article distributed under the terms and conditions of the Creative Commons Attribution (CC BY) license (https://creativecommons.org/licenses/by/4.0/).
Share and Cite
Zalewska, J.; Damaziak, K.; Malachowski, J. An Energy Efficiency Estimation Procedure for Small Wind Turbines at Chosen Locations in Poland. Energies 2021, 14, 3706. https://doi.org/10.3390/en14123706
Zalewska J, Damaziak K, Malachowski J. An Energy Efficiency Estimation Procedure for Small Wind Turbines at Chosen Locations in Poland. Energies. 2021; 14(12):3706. https://doi.org/10.3390/en14123706
Chicago/Turabian StyleZalewska, Justyna, Krzysztof Damaziak, and Jerzy Malachowski. 2021. "An Energy Efficiency Estimation Procedure for Small Wind Turbines at Chosen Locations in Poland" Energies 14, no. 12: 3706. https://doi.org/10.3390/en14123706
APA StyleZalewska, J., Damaziak, K., & Malachowski, J. (2021). An Energy Efficiency Estimation Procedure for Small Wind Turbines at Chosen Locations in Poland. Energies, 14(12), 3706. https://doi.org/10.3390/en14123706