Article

Aerodynamic Characterization of Hypersonic Transportation Systems and Its Impact on Mission Analysis

1
Mechanical and Aerospace Engineering Department, Politecnico di Torino, 10129 Turin, Italy
2
Aerothermodynamics Department, Centro Italiano Ricerche Aerospaziali, 81043 Capua, Italy
*
Author to whom correspondence should be addressed.
Energies 2021, 14(12), 3580; https://doi.org/10.3390/en14123580
Submission received: 3 May 2021 / Revised: 9 June 2021 / Accepted: 12 June 2021 / Published: 16 June 2021
(This article belongs to the Special Issue Aerodynamics and Aerothermodynamics of High-Speed Vehicles)

Abstract

:
This paper aims to provide technical insights on the aerodynamic characterization activities performed in the field of the H2020 STRATOFLY project, for the Mach 8 waverider reference configuration. Considering the complexity of the configuration to be analyzed at conceptual/preliminary design stage, a build-up approach has been adopted. The complexity of the aerodynamic model increases incrementally, from the clean external configuration up to the complete configuration, including propulsion systems elements and flight control surfaces. At each step, the aerodynamic analysis is complemented with detailed mission analysis, in which the different versions of the aerodynamic databases are used as input for the trajectory simulation. eventually, once the contribution to the aerodynamic characterization of flight control surfaces is evaluated, stability and trim analysis is carried out. The comparison of the results obtained through the different mission analysis campaigns clearly shows that the accuracy of aerodynamic characterization may determine the feasibility or unfeasibility of a mission concept.

1. Introduction

Hypersonic cruisers are currently considered as the long-term future of long-range civil aviation. The expected high-level performance are challenging engineers and scientists from around the world in different technological and operational areas. Despite the wide range of solutions that are emerging for these challenges, everybody agrees on the urgent need to improve the conceptual design stage, defining innovative and agile design methodologies able to capture all the most impacting design, performance, and operational characteristics since the beginning of the process and implementing multi-fidelity modelling strategies. The development of such an integrated methodology is one of the outcomes of the STRATOFLY Project, a Horizon 2020 Project funded by the European Commission in 2018, aimed at assessing the potential of this type of high-speed civil transport to reach TRL6 by 2035, with respect to key technological, societal and economical aspects, such as thermal and structural integrity, low-emissions combined propulsion cycles, subsystems design and integration including smart energy management, environmental aspects impacting climate change, noise emissions and social acceptance, and economic viability accounting for safety and human factors.
The aerodynamic characterization is one of the crucial activities of a multidisciplinary conceptual design approach for high-speed vehicles. It will support the definition and characterization of the aircraft configuration, suggesting possible improvements necessary to meet performance and operational requirements. Nowadays, the high-speed air and space transportation systems are experiencing a revolution in the design process, which is resulting in highly innovative and integrated concepts, able to push the performance barrier beyond the limits. This is especially visible in the case of hypersonic civil transportation systems, such as the STRATOFLY MR3 concept, where the need to meet a set of challenging technical and operational requirements may impose the adoption of highly integrated waverider configurations [1,2,3,4]. In these cases, it is fundamental to support the vehicle design process with a set of aerodynamic investigations and mission analysis, with an increasing level of complexity. In this context, this paper aims at presenting the results of the build-up approach adopted in the framework of the H2020 STRATOFLY Project, to improve the configuration of the reference vehicle, incrementally increasing the complexity of the aerodynamic model, from the clean external configuration up to the complete configuration, including propulsion systems elements and flight control surfaces. At each step, the aerodynamic analysis is complemented with detailed mission analysis, in which the different versions of the aerodynamic databases are used as input for the trajectory simulation (see Figure 1).
Specifically, after this short introduction, Section 2 briefly provides the reader with a summary description of the STRATOFLY MR3 vehicle configuration and its reference mission. Then, Section 3 focuses on the step-by-step aerodynamic characterization of the vehicle from the clean to the complete vehicle configuration. Even if the aerodynamic characterization approach is well-known, Section 3 points out specific innovative aspects which have been introduced to better cope with the analysis of a highly integrated waverider configuration at conceptual design level. The build-up approach starts from the investigation of the clean configuration, which consists of the external vehicle layout, including empennages and undeflected control surfaces. Inviscid CFD simulation techniques are applied to better describe the subsonic and transonic regime. Complementary, an updated mathematical formulation for viscous effect corrective factor is disclosed. In the following steps of the build-up approach, the contributions of the internal flow-path of the propulsive system, and of the deflected control surfaces are evaluated and added to the clean configuration. These last steps are extremely important for highly integrated vehicle waverider configurations where the propulsive subsystems flow-path may represent up to 30–40% of the vehicle available volume and where non-conventional flight control surfaces architecture may be adopted. The importance of properly addressing these contributions for the aerodynamic characterization of the vehicle is testified in Section 4, the comparison of the results obtained through the different mission analysis campaigns clearly shows that the accuracy of aerodynamic characterization may determine the feasibility or unfeasibility of the mission concept. In this context, special attention is devoted to the longitudinal stability analysis, which shows that in order to meet the high-level design and operational requirements (such as maximum take-off weight and range), the stability concept should be relaxed into the low supersonic speed regime. Finally, ideas for future investigations are reported and main conclusions are drawn.

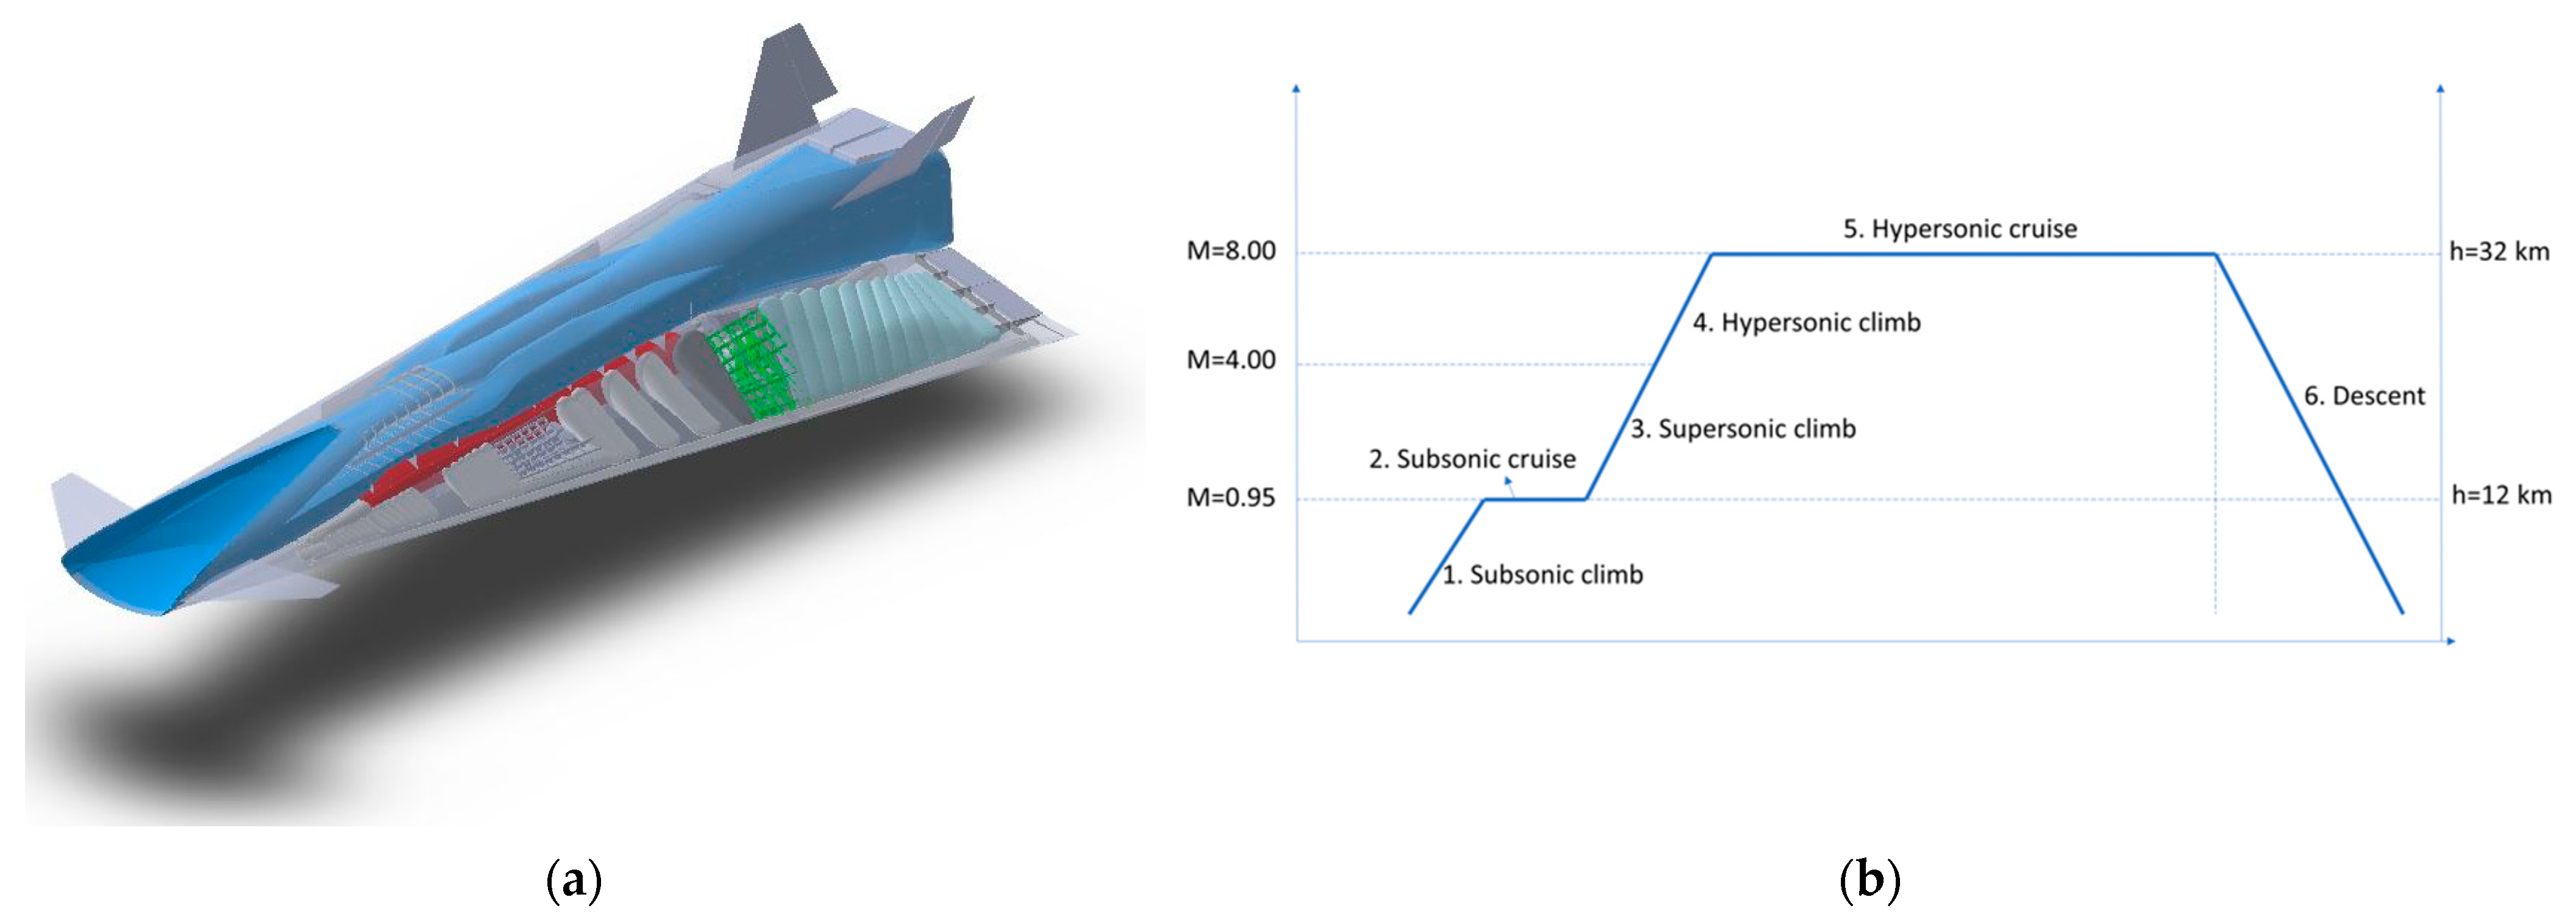
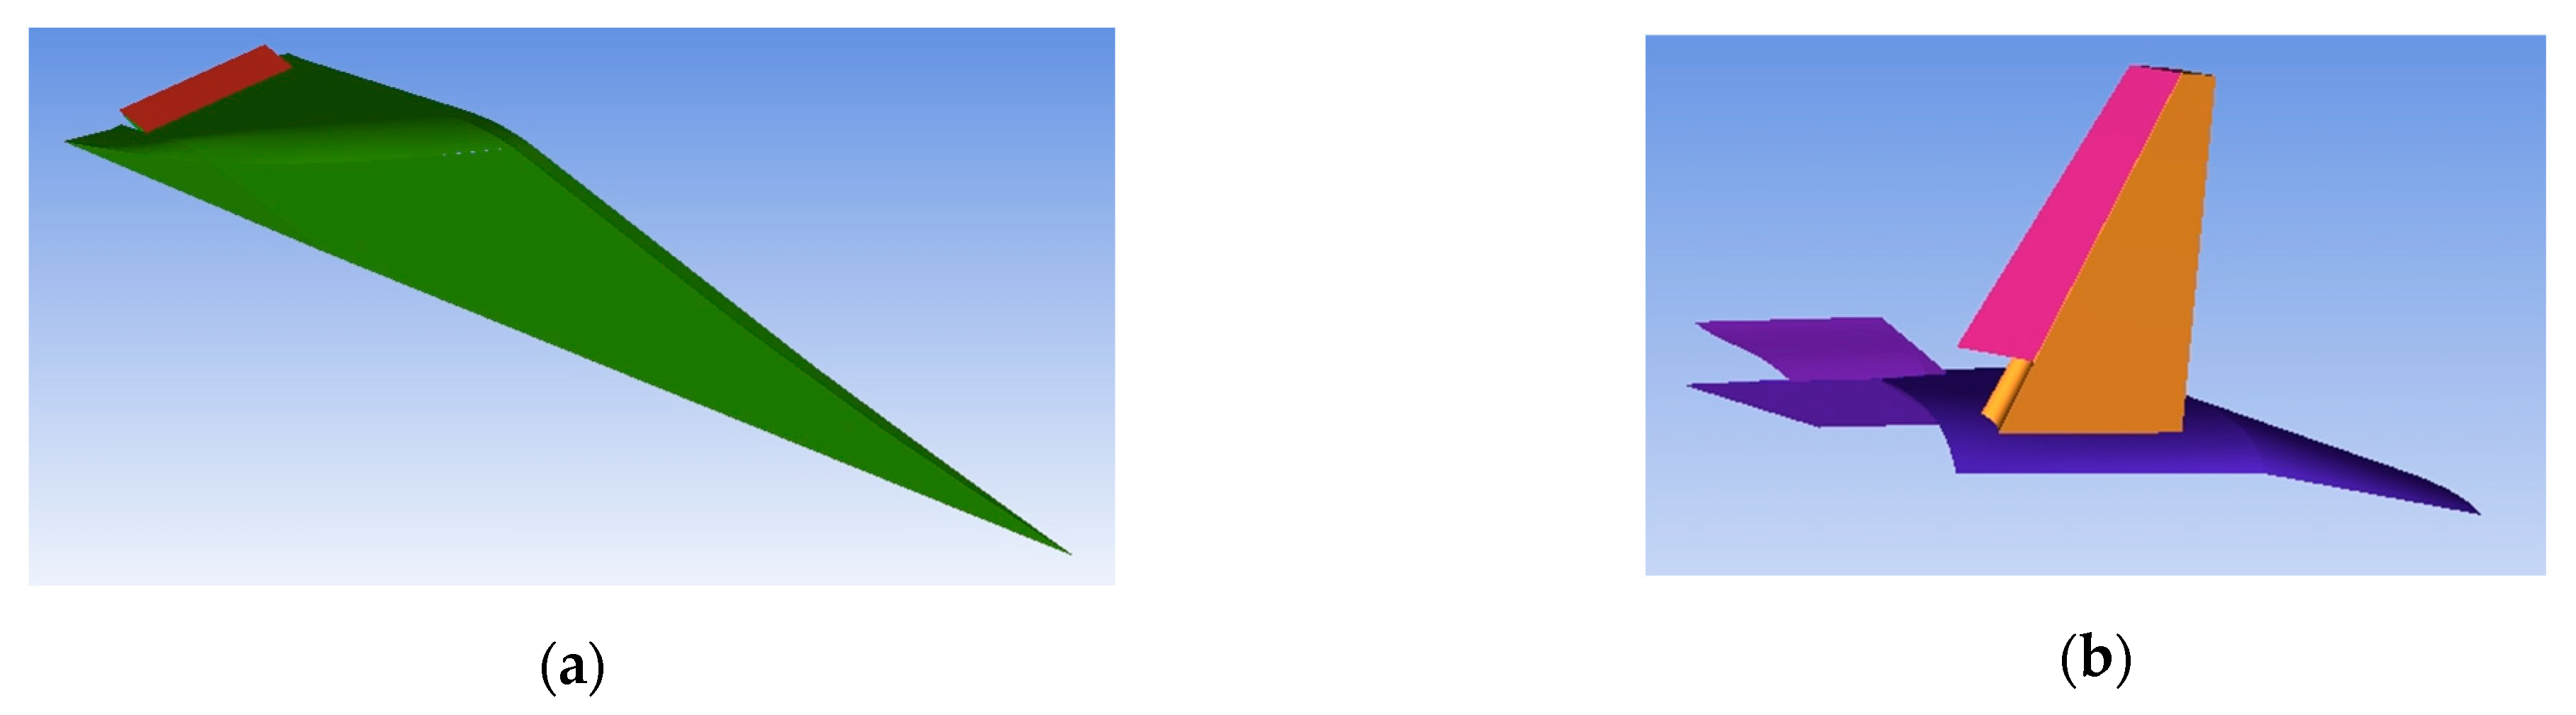
2. STRATOFLY MR3: Vehicle and Mission Overview

The STRATOFLY MR3 vehicle is the result of research activities carried out by several international partners in the framework of the Horizon 2020 STRATOFLY Project funded by the EC since June 2018. Benefitting from the heritage of past European funded projects and, in particular, from the LAPCAT II project led by ESA [1], the waverider configuration has been adopted and investigated in-depth throughout all flight phases. STARTOFLY MR3 is a highly integrated system, where propulsion, aerothermodynamics, structures and on-board subsystems are strictly interrelated to one another, as highlighted in Figure 2a [2,3].
Looking at the configuration, the STRATOFLY MR3 design is driven by its peculiar mission concept, which can be summarized as follows: STRATOFLY MR3 will be able to fly along long-haul routes reaching Mach 8 during the cruise phase at a stratospheric altitude (h > 30,000 m) carrying 300 passengers as payload. Figure 2a shows STRATOFLY MR3 external configuration. STRATOFLY MR3 has a waverider configuration with the engines and related air duct embedded into the airframe and located at the top. The integration of the propulsive system at the top of the vehicle allows maximization of the available planform for lift generation without additional drag penalties, thus increasing the aerodynamic efficiency, and it allows optimizing the internal volume. This layout guarantees furthermore to expand the jet to a large exit nozzle area without the need to perturb the external shape which would lead to extra pressure drag.
The mission profile (Figure 2b) is based on the LAPCAT reference [5]. During the first part of the mission the ATR engines are used and the vehicle performs the first climb phase, which terminates at Mach = 0.95 and at an altitude between 11 and 13 km. The air turbo–rocket (ATR) is a particular case of turbine-based combined cycles cycle engines which brings together elements of the turbojet and rocket motors and provides a unique set of performance characteristics. This engine offers a high thrust-to-weight ratio and specific thrust over a wide range of speed and altitude, constituting an excellent choice as an accelerator engine up to high-supersonic speeds. Then, the vehicle performs the subsonic cruise. This phase is needed to prevent a sonic boom while flying on land. A constraint on the distance flown from the departure site should be considered to fulfill this requirement: the subsonic cruise phase ends when the vehicle is at 400 km from the departure airport. Then, the supersonic climb starts, and the vehicle accelerates up to Mach = 4. At the end of this phase, the ATR engines are turned off and the DMR is activated to accelerate up to Mach = 8. Dual Mode Ramjet engine (DMR) is the high-speed engine that can be operated in both ramjet and scramjet modes. The next phase is the hypersonic cruise: in case of a Europe to Asia or Australia mission, the vehicle should point towards the Bering strait, then it flies over the Pacific Ocean to reach the designated destination. The cruise altitude should be in the range from 30 to 35 km. Eventually, the engines are turned off and the vehicle performs the descent towards the landing site.
An overview of the vehicle dimensions is also reported in Table 1 [2].

3. Aerodynamic Characterization

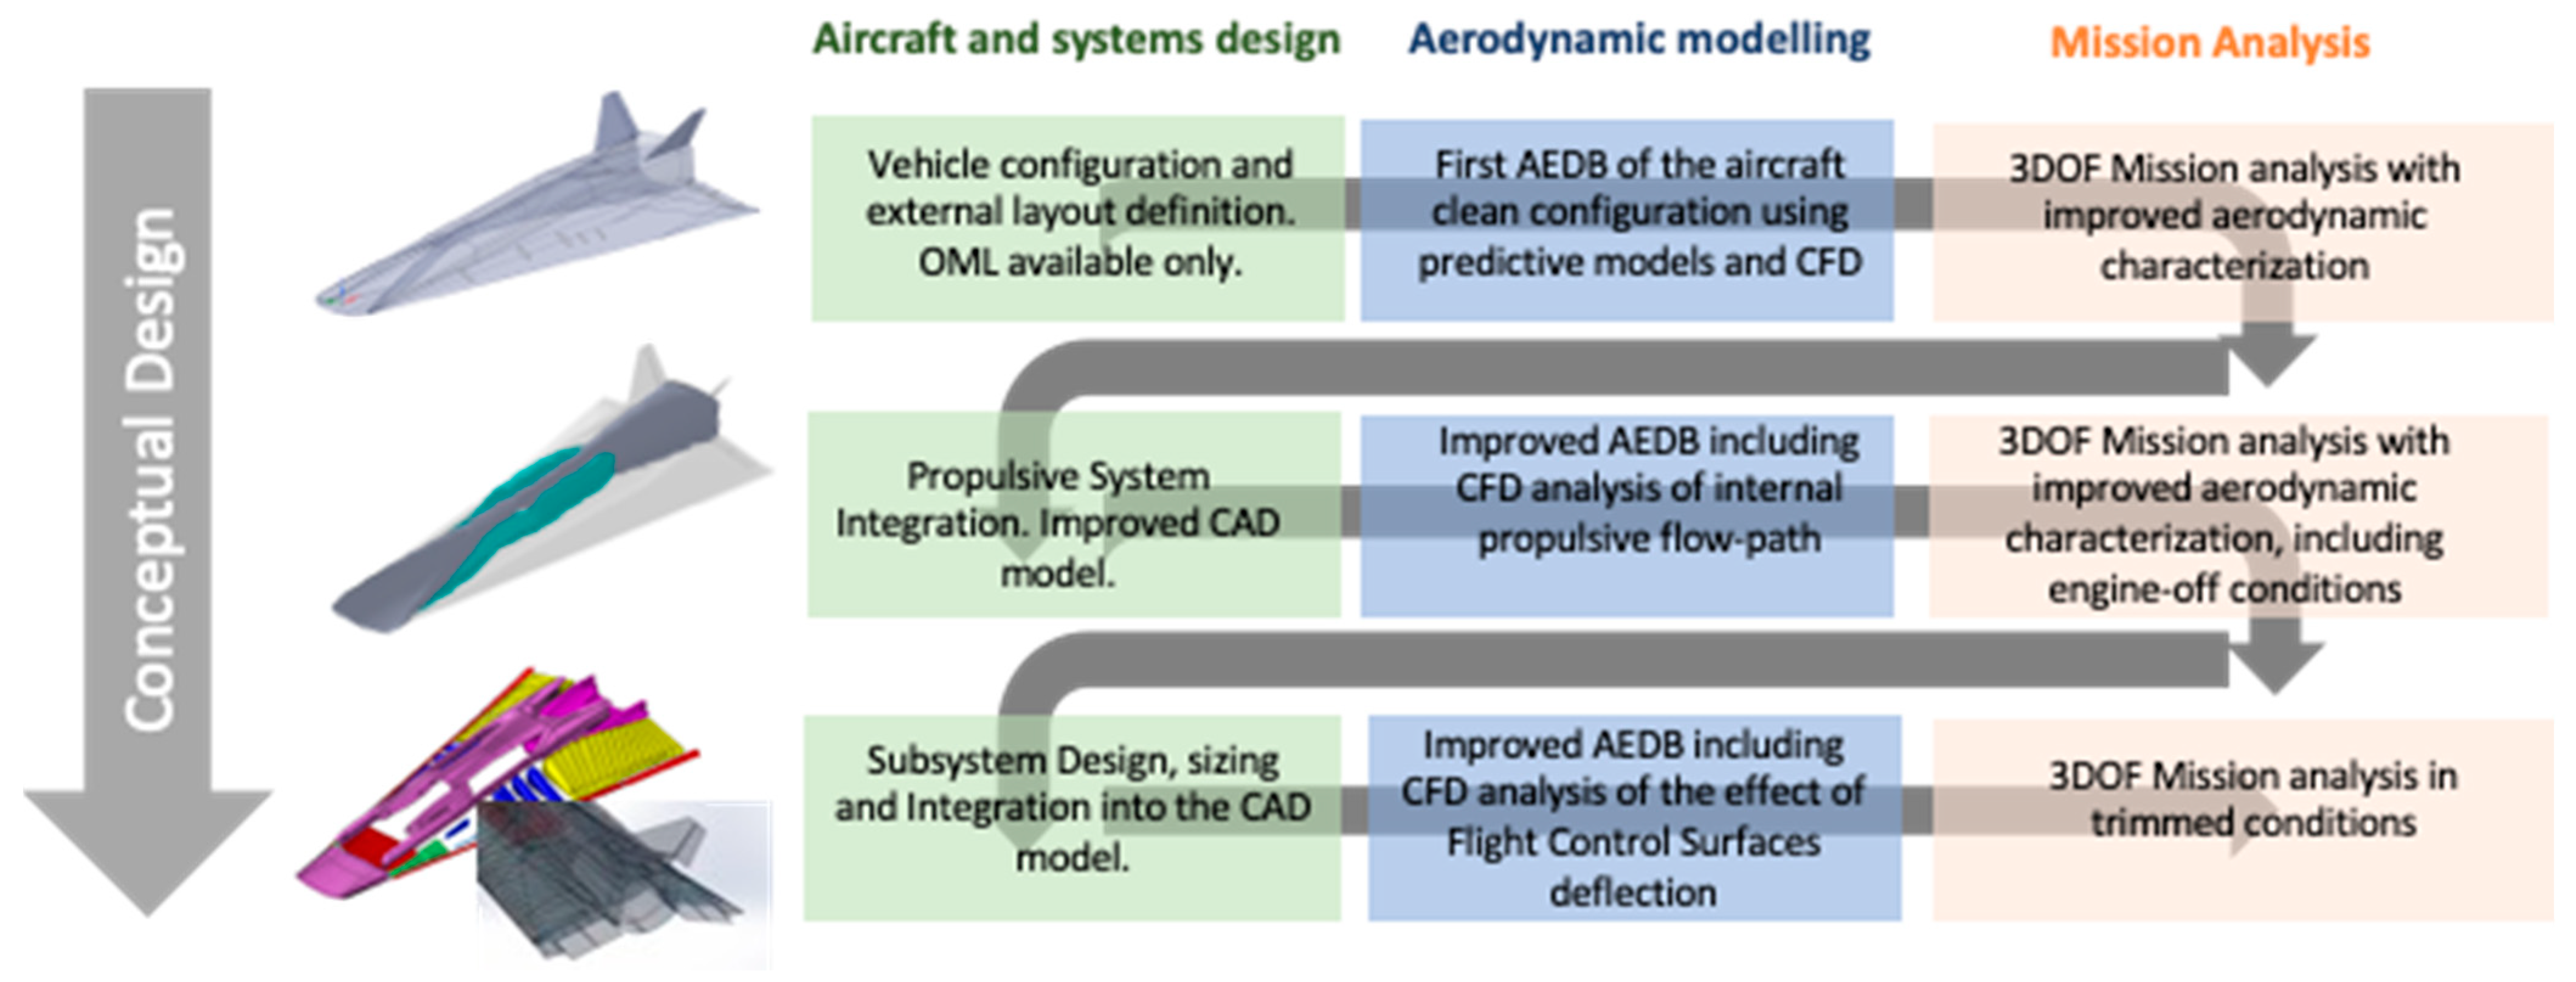
3.1. Methodology Overview

This section aims at describing the methodology used to perform the aerodynamic characterization of the STRATOFLY MR3 vehicle concept. Considering that the project deals with the conceptual and preliminary design of the vehicle, an incremental build-up approach has been exploited [6,7,8,9]. The approach starts from the investigation of the clean configuration which consists of the external vehicle layout, including empennages and undeflected control surfaces. Then, when additional details on the integration of the propulsive flow-path and of the control surface deflections are available, the aerodynamic database is improved with new contributions. In details, the lift coefficient is evaluated adding to the clean configuration, the contributions to lift of all the control surfaces i (i.e., i = 1 n ( Δ C L ) i   ). Similarly, the drag coefficient is evaluated adding to the clean configuration, the contributions to drag of all the control surfaces. Finally, the y-moment coefficient is evaluated by summing to the value of the clean configuration, the single effects of the control surfaces, and the additional effects of the misalignment of thrust vector with respect to the longitudinal vehicle axis.
C L = ( C L ) c l e a n + i = 1 n ( Δ C L ) i  
C D = ( C D ) c l e a n i n v   + ( Δ C D ) v i s c e x t + ( Δ C D ) v i s c i n t + i = 1 n ( Δ C D ) i  
C M y = ( C M y ) c l e a n + i = 1 n ( Δ C M y ) i   + ( Δ C M y ) T
When dealing with conceptual design, due to the time and budget constraints, simplified approaches are preferred for the aerodynamic characterization, such as the Panel Methods. However, in this case, taking into account the complexity of the vehicle configuration, and remembering that one of the main goals of the H2020 STRATOFLY Project is to better investigate the behavior of the vehicle concept in subsonic and transonic speed regimes, simplified CFD simulation campaigns have been selected, as the most appropriate approach. Specifically, inviscid CFD simulation techniques have been applied at all Mach numbers from low subsonic to the hypersonic speed regime (from Mach 0.3 to Mach 8.0) and viscous effects have been added later through innovative simplified engineering formulations. In this case, starting from available mathematical formulations, new parametric equations have been developed to better capture the peculiarities of waverider configuration with integrated dorsal propulsive flow-path. The exploitation of simplified CFD simulations guarantees more reliable results without excessively compromising the available resources.

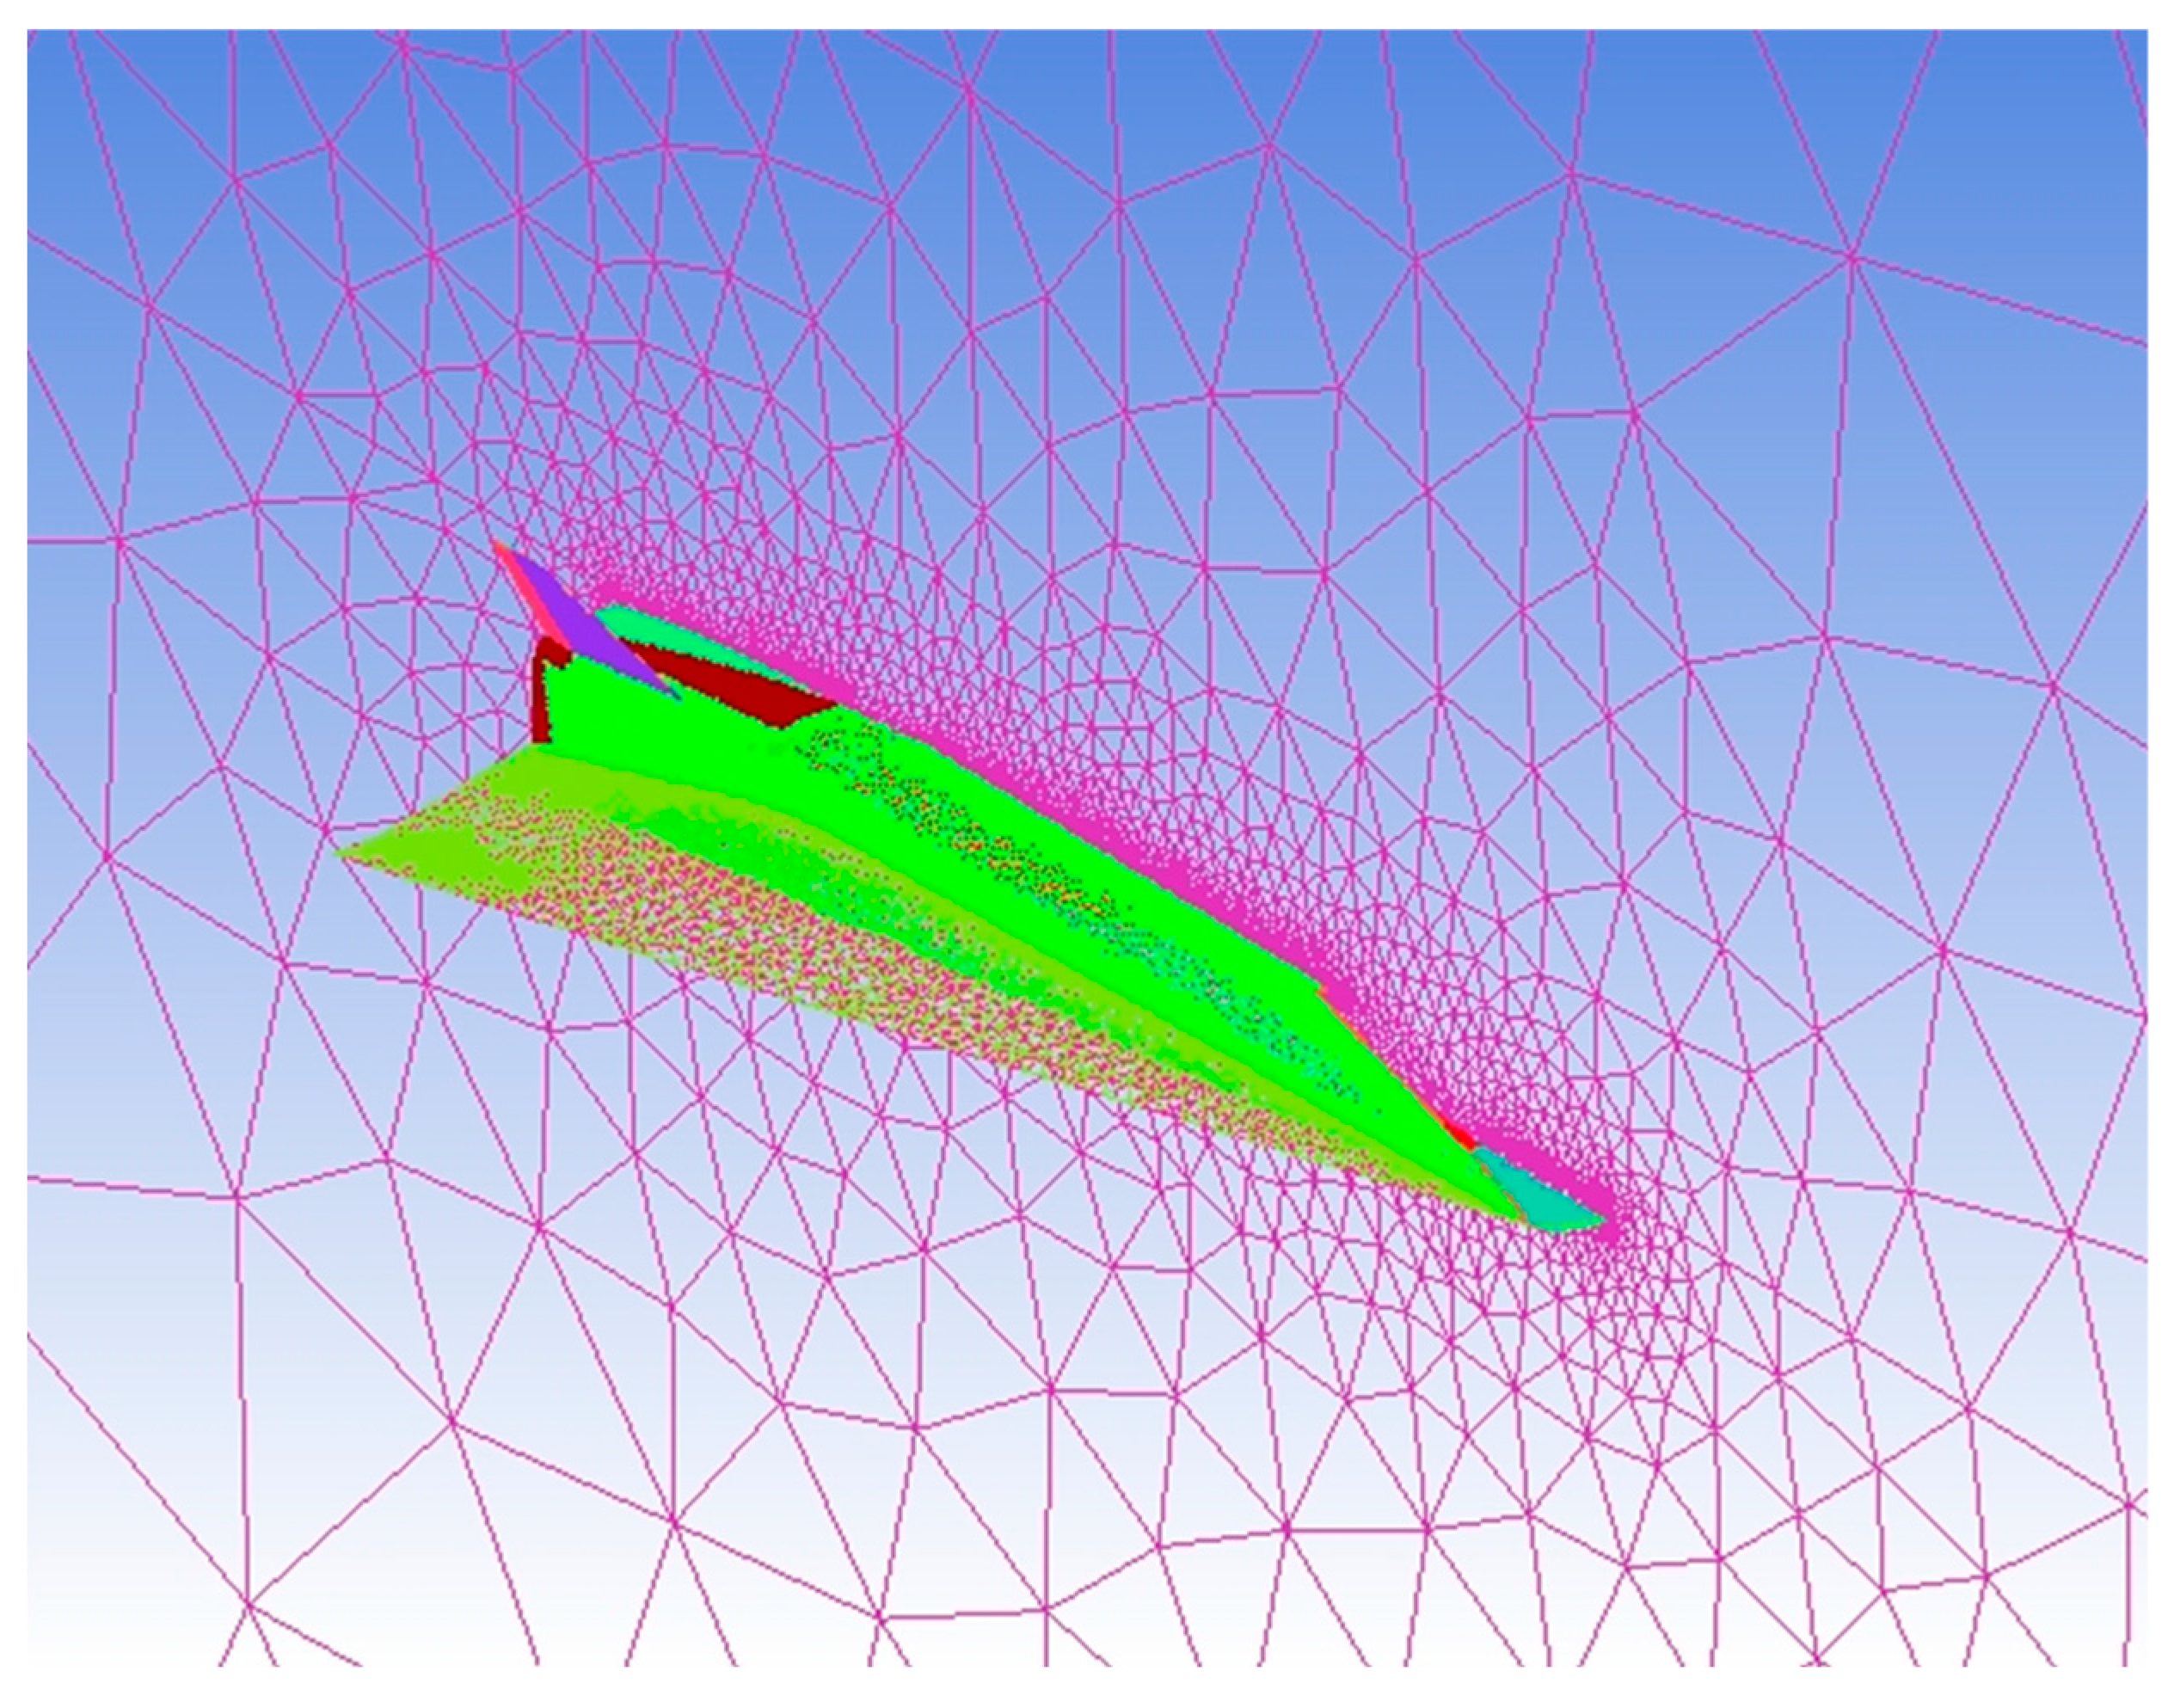
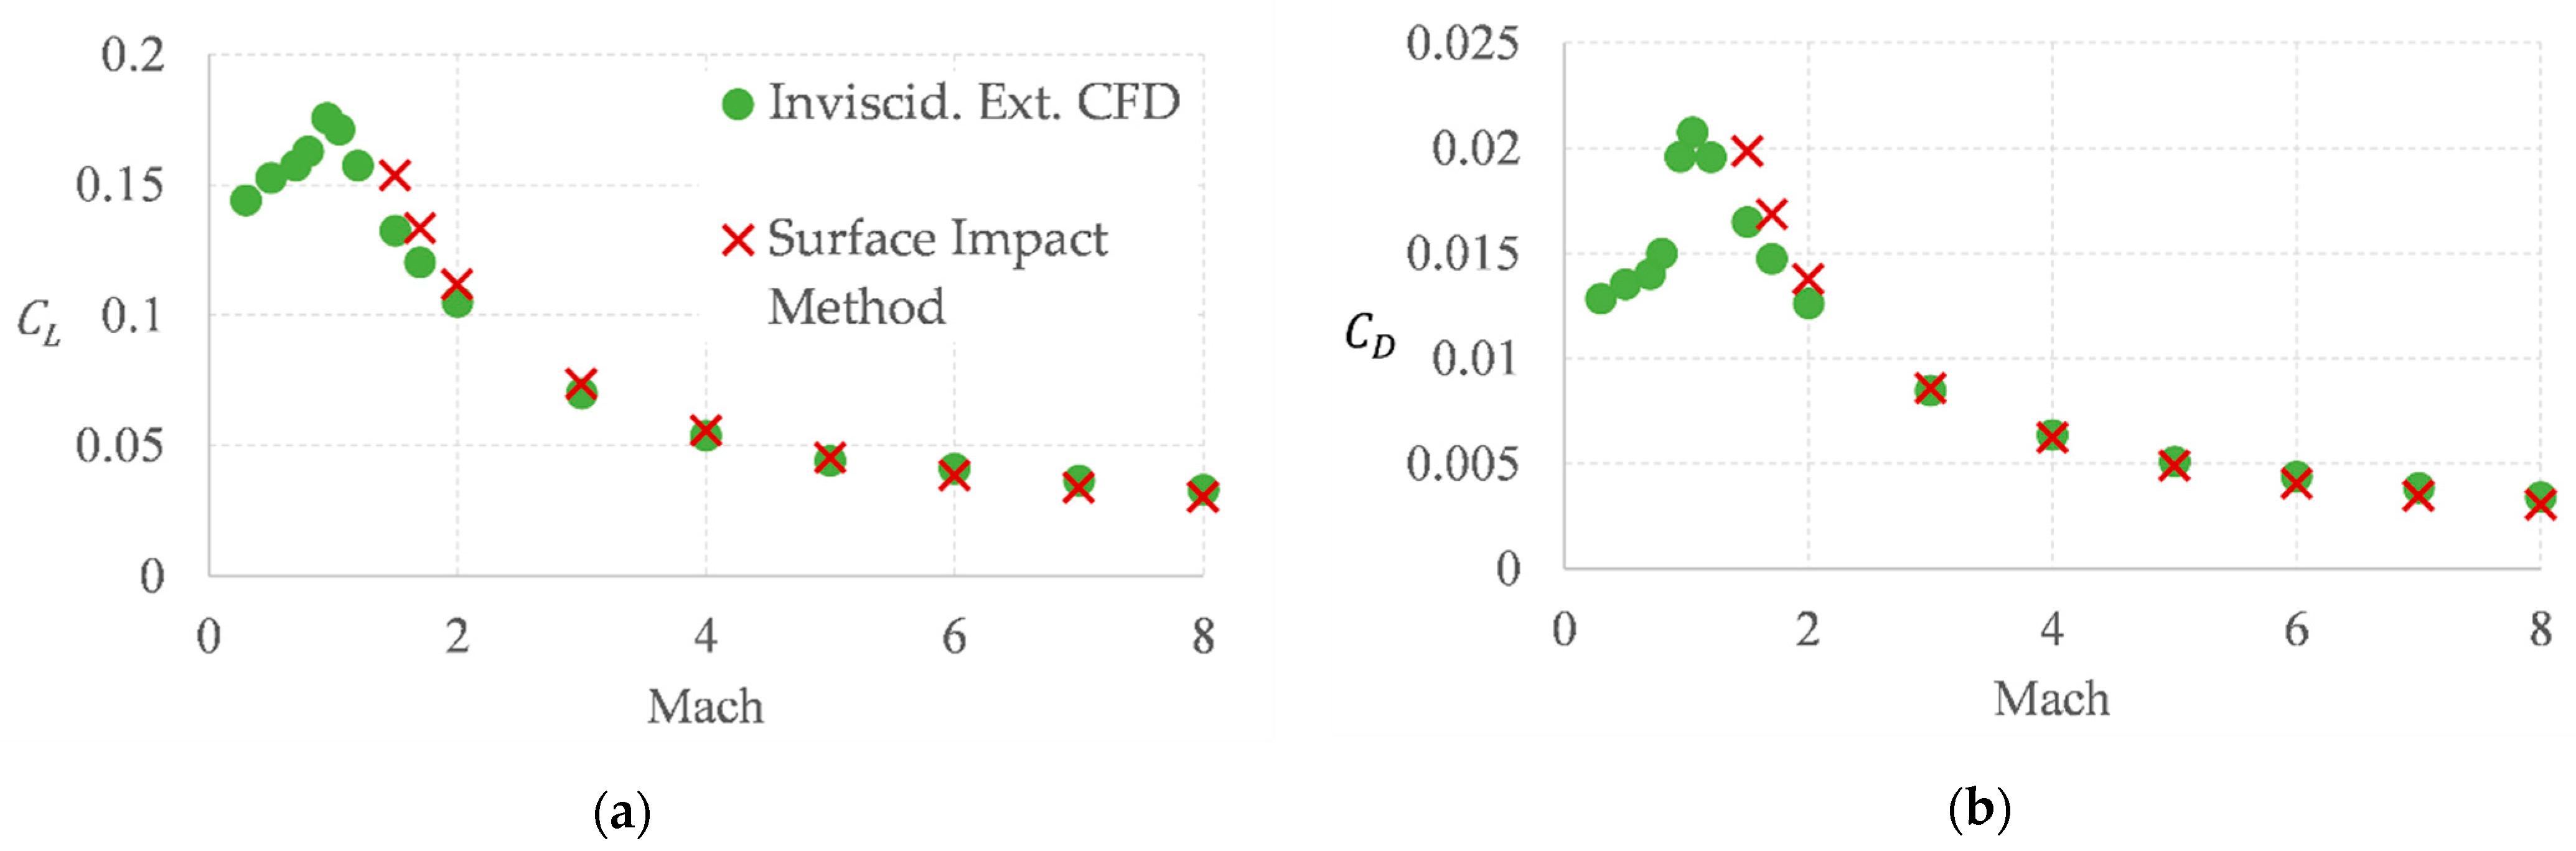
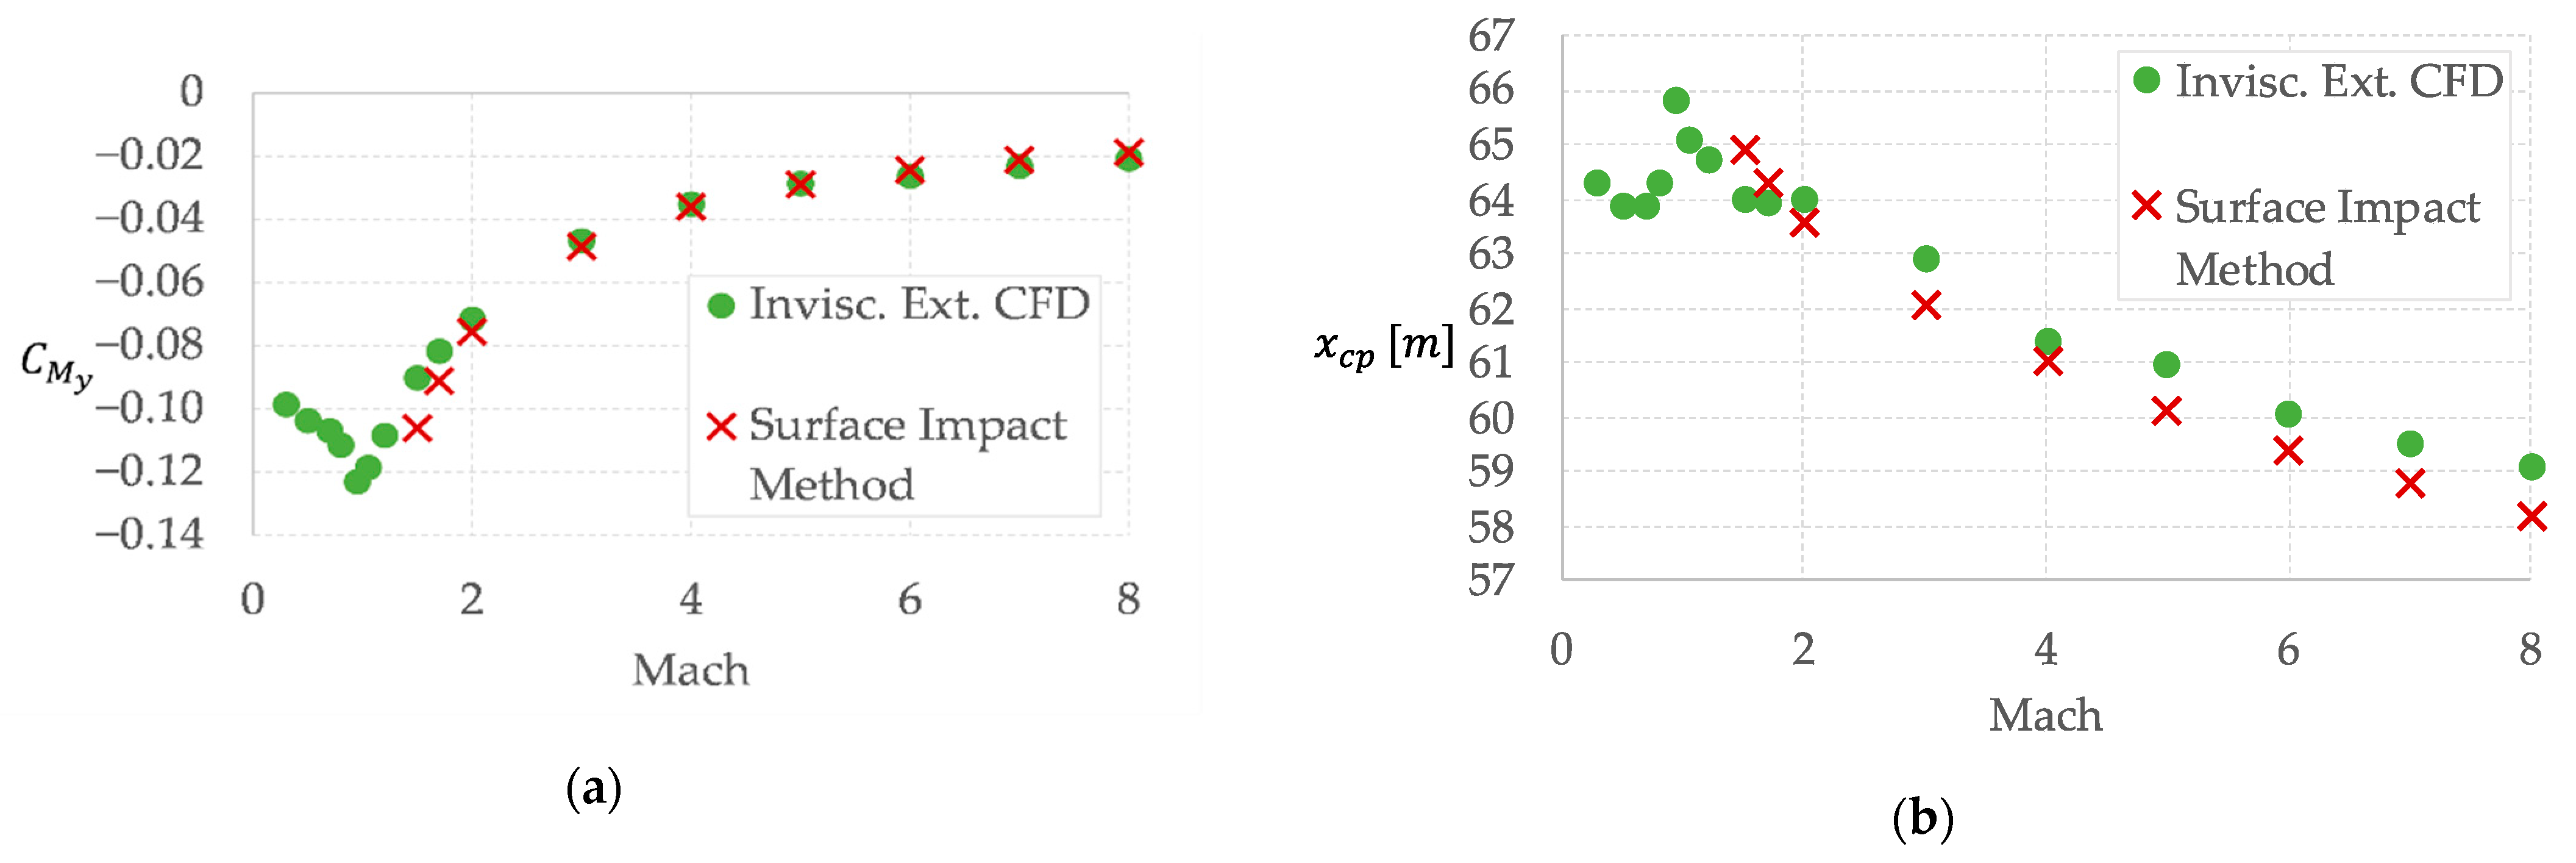
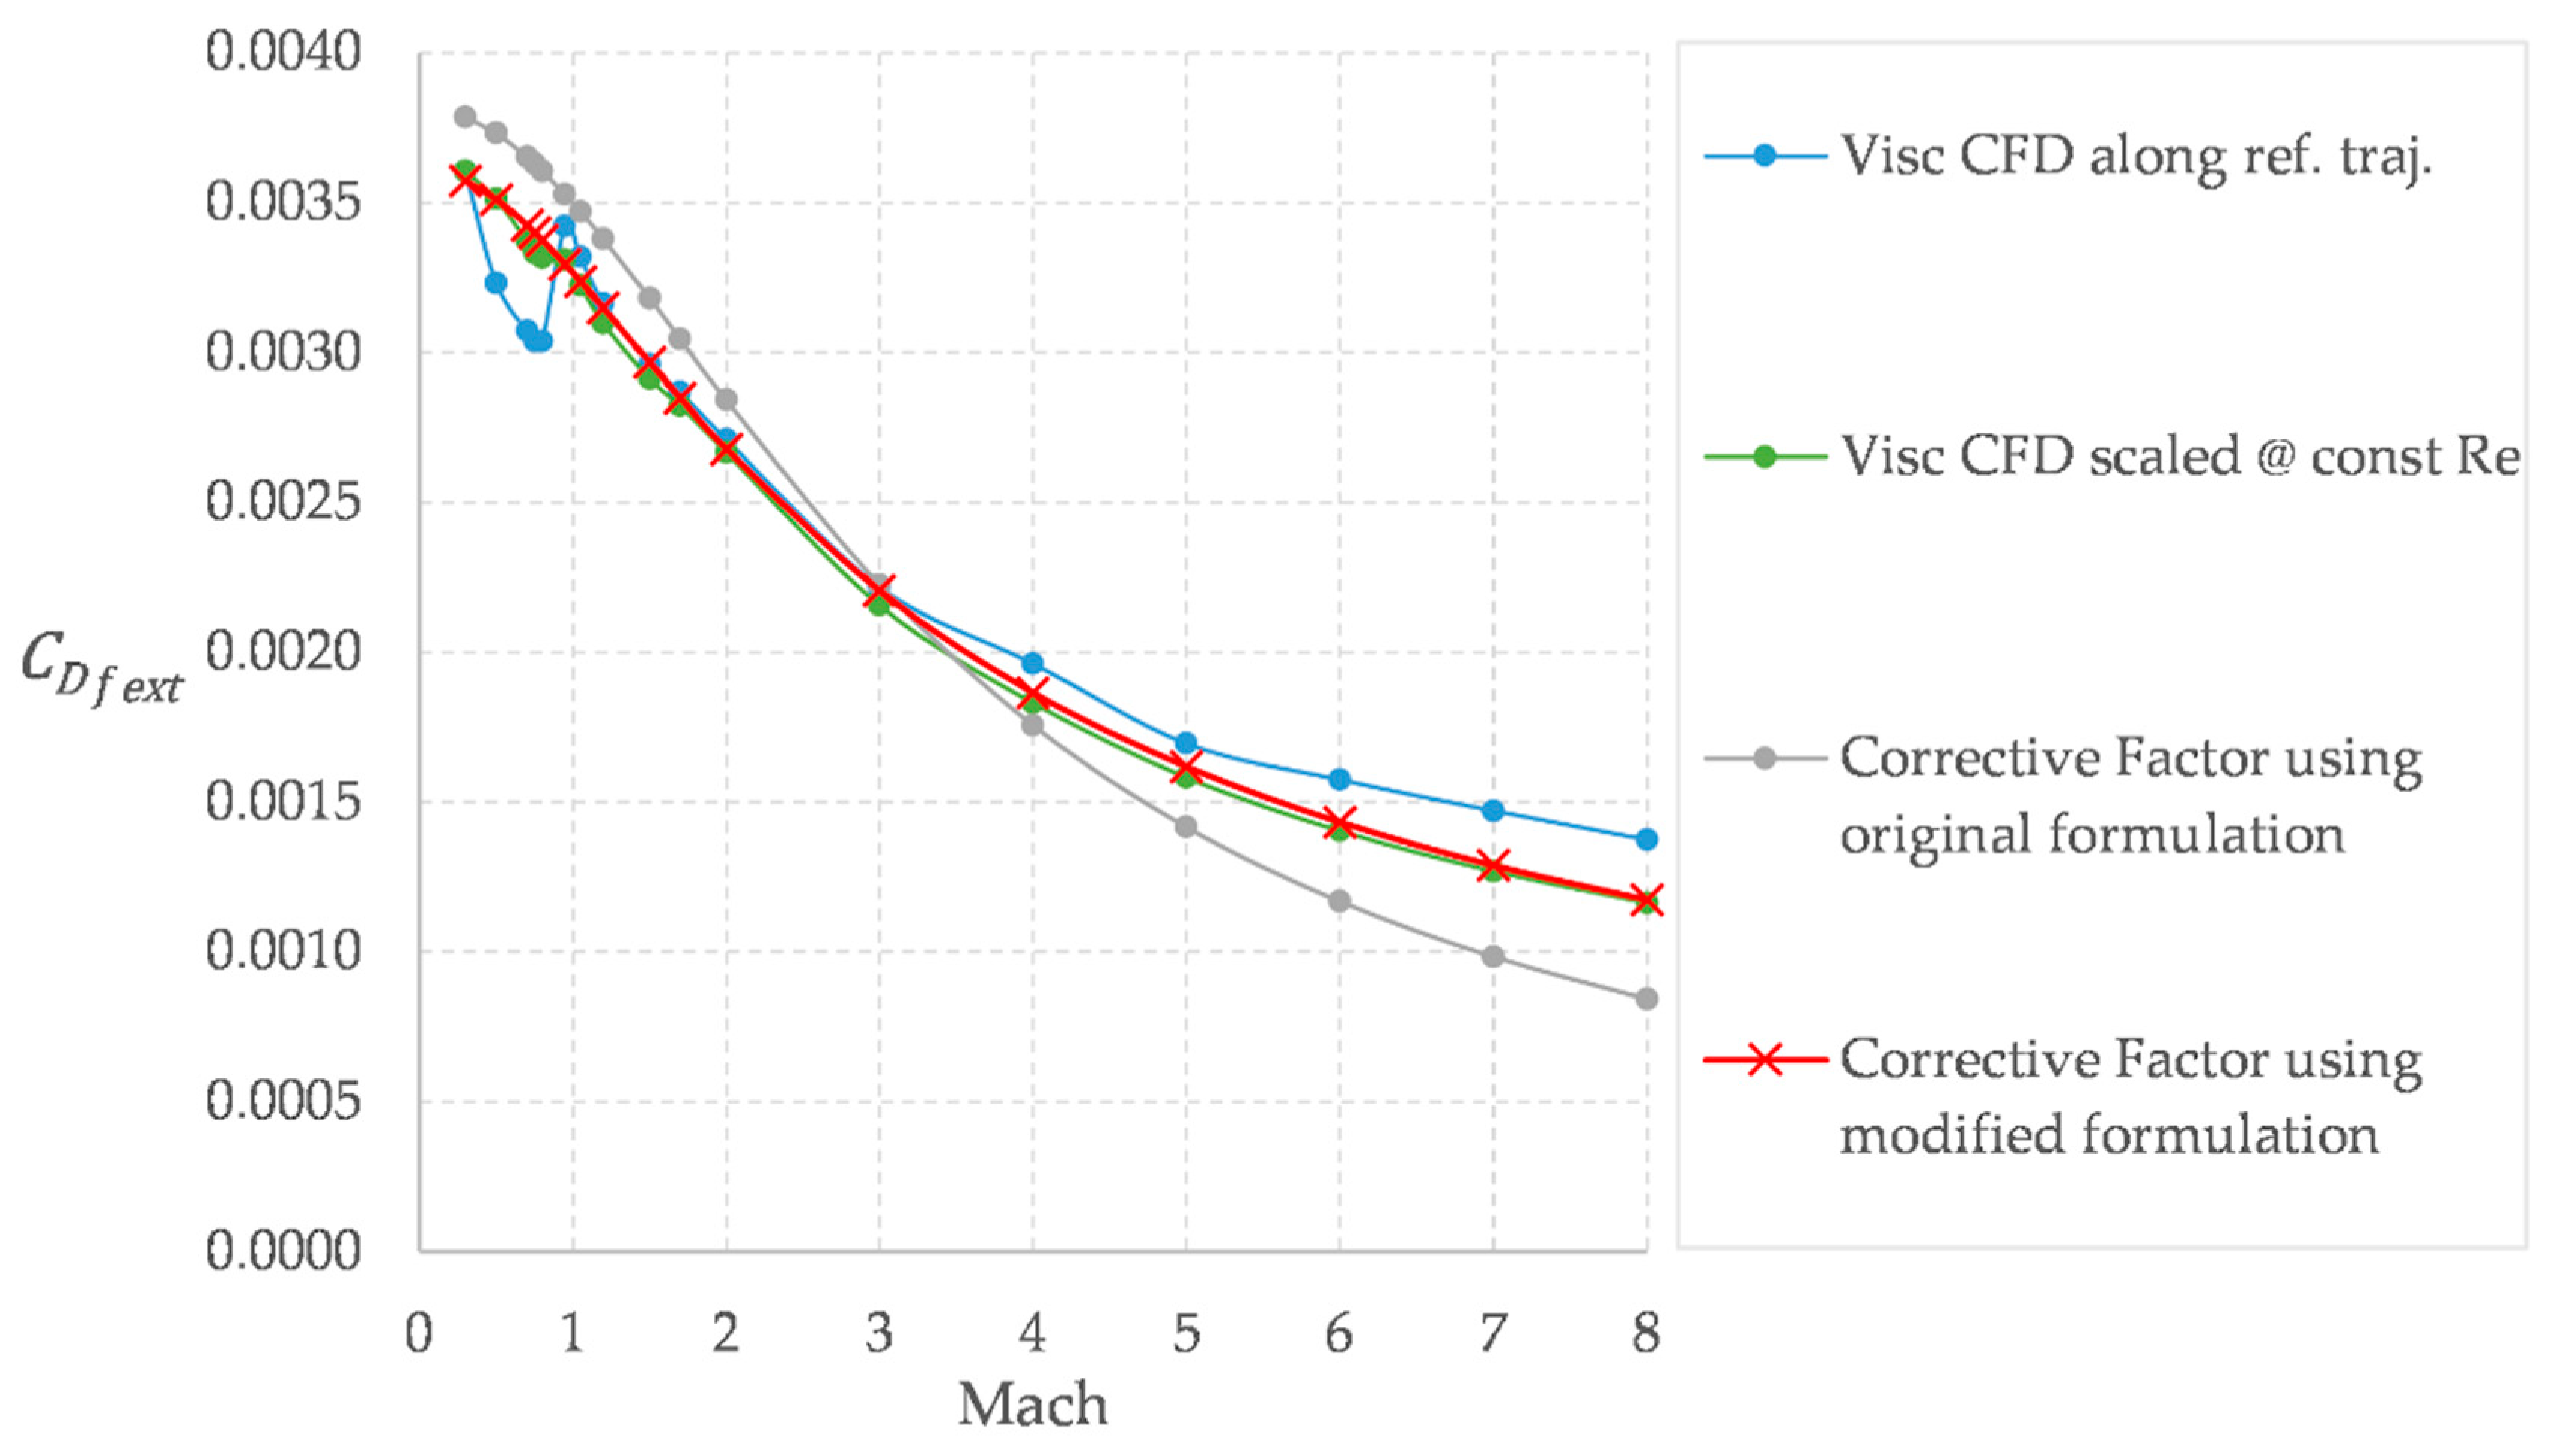
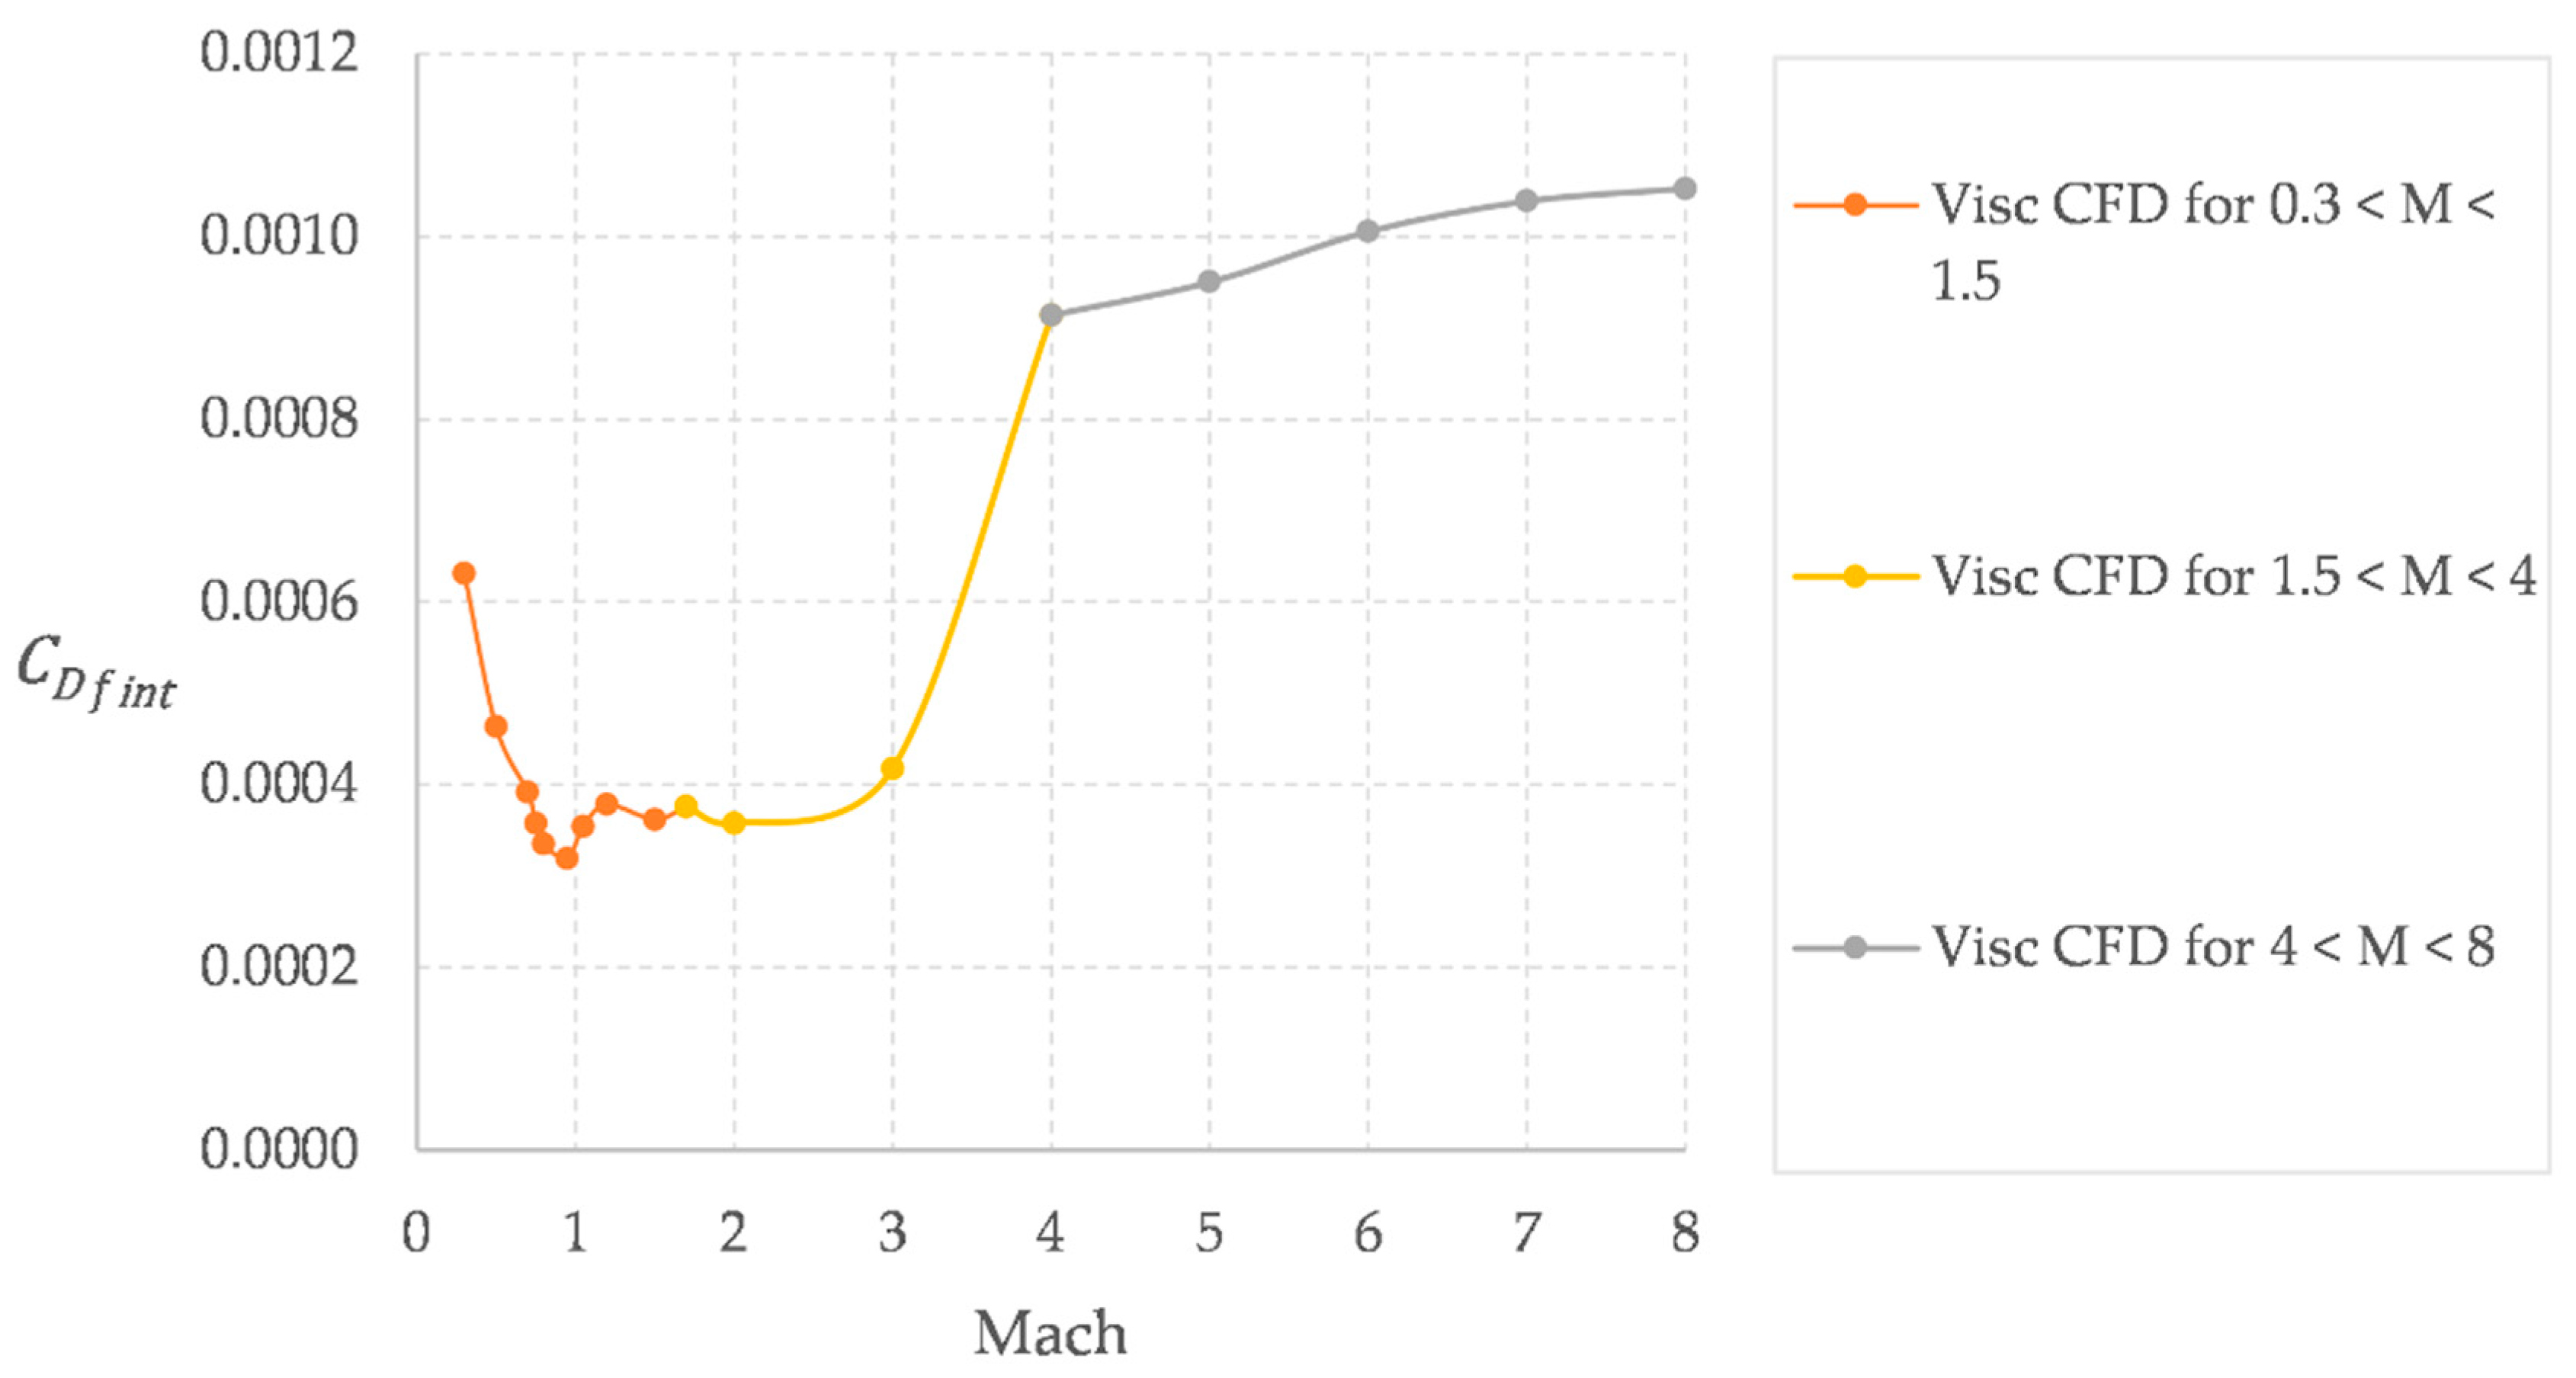
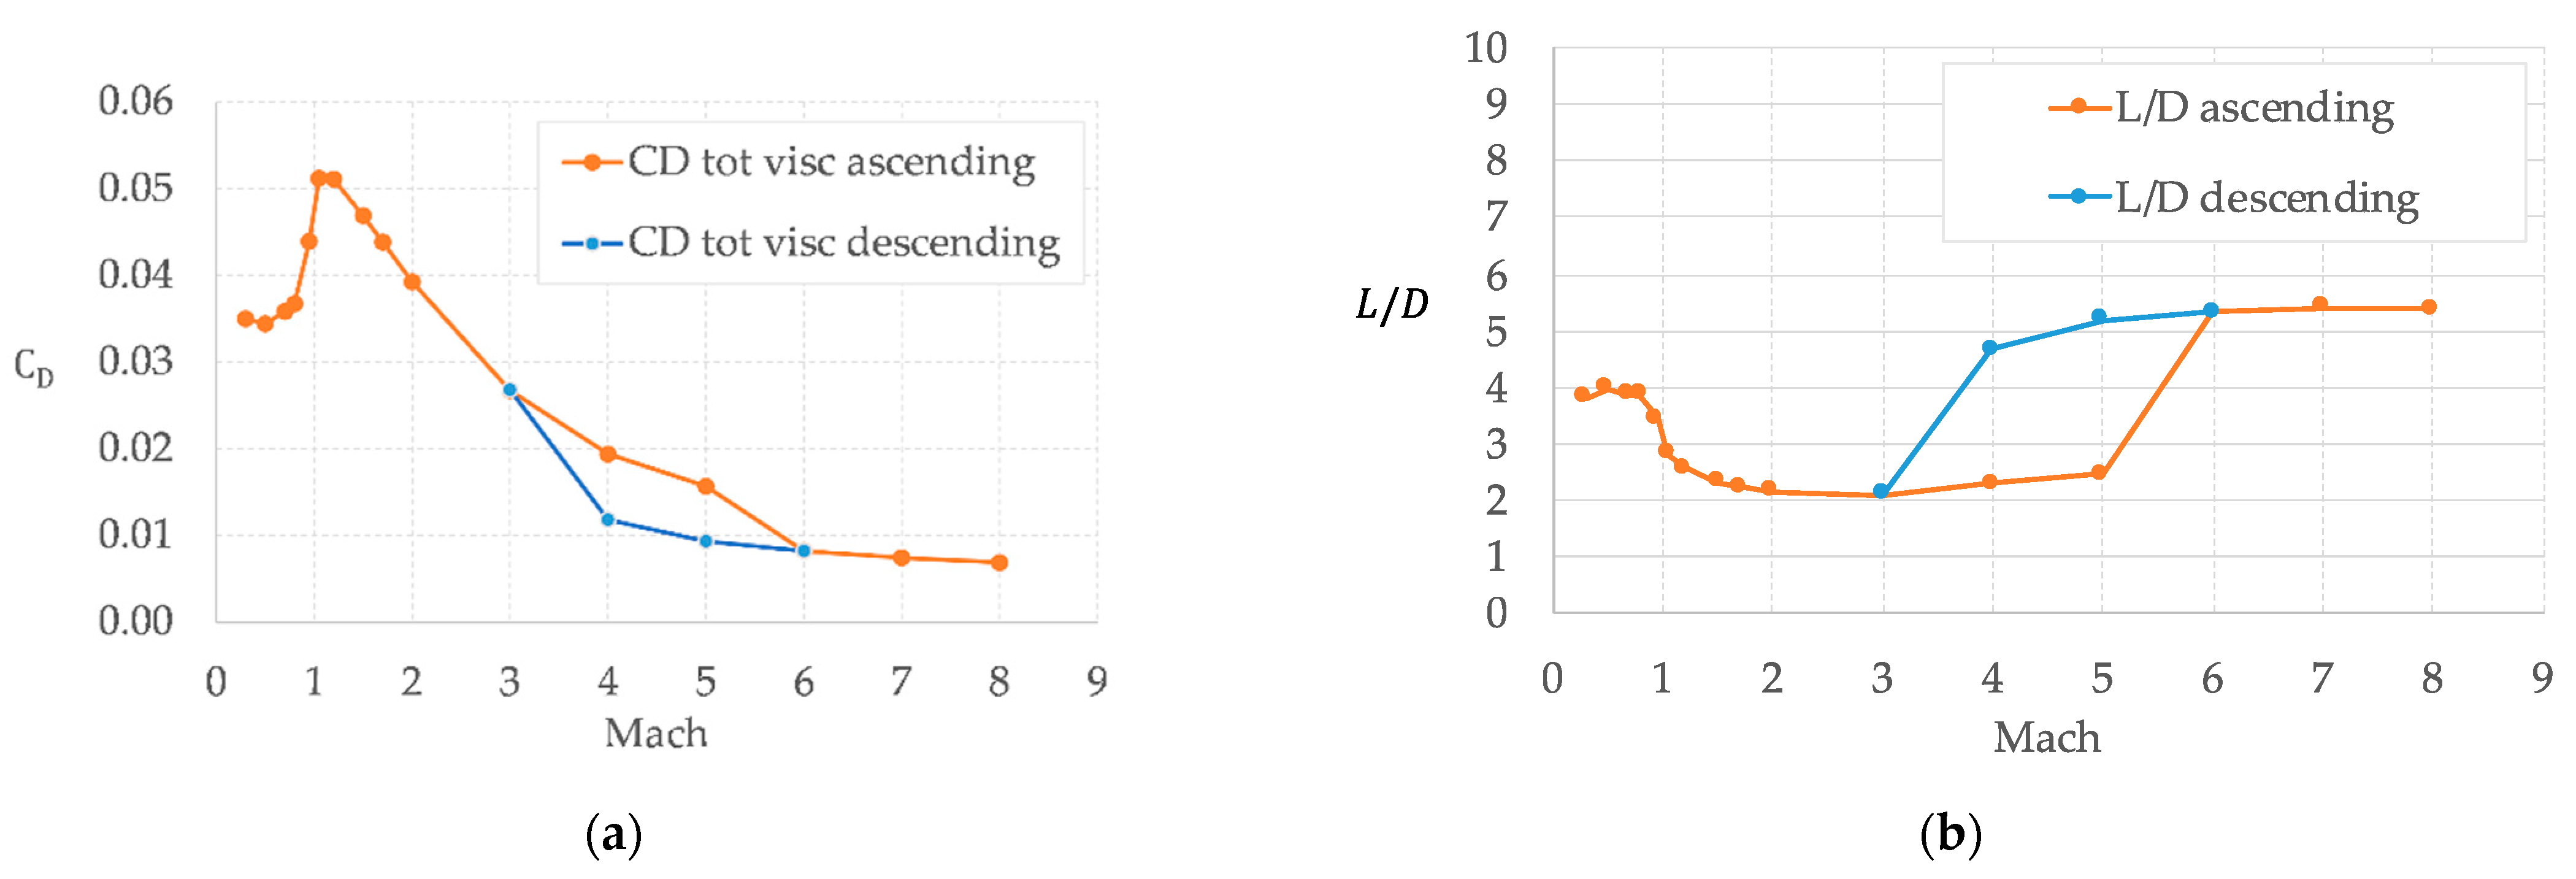
3.2. Clean Configuration: Inviscid CFD and Innovative Viscous Corrections

The first step of the build-up approach for the aerodynamic characterization of the STARTOFLY MR3 vehicle consists in the analysis of the clean configuration, i.e., the vehicle external layout including empennages and undeflected flight control surfaces. For the clean configuration, a Eulerian unstructured grid of about one million of cells (half configuration) has been generated by means of ICEMCFD-TETRA grid generator (Figure 3). and the commercial code Fluent has been adopted for the numerical calculations. Based on past experiences with very similar problems [7,8], the number of cells has been selected to guarantee a good compromise between calculation time and accuracy. Please note that a grid convergence analysis has not been done due to the simplified and preliminary approach. However, a grid error less than 10% is expected [7]. However, grid convergence analysis will be carried on as soon as high-fidelity calculations will be performed.
Some results are reported in the Figure 4 and Figure 5 where the results of the inviscid external CFD simulations are compared with already available results previously obtained by means of Supersonic/Hypersonic Panels Method (Surface Impact Method tool), based on classical Modified-Newtonian, Tangent-Wedge, and Shock-Expansion Theories. In the supersonic-hypersonic range down to Mach = 3, the comparisons show good results, at least for small angles of attack (i.e., the case reported in Figure 4 and Figure 5). The discrepancy between the two methods is expected to increase for higher angles of attack. However, this is not the case for the STRATOFLY MR3 vehicle whose angle of attack throughout the mission is between −2° and +2°.
An updated mathematical formulation for viscous effect corrective factor is disclosed hereafter. The innovation lays in the fact that formulations, already available in the literature, have been modified to better capture the peculiarities of highly integrated waverider configurations. The viscous effect is added in a second step by means of an engineering formula available in the literature ([10,11,12]) which can be generalized as in Equation (4).
( Δ C D ) v i s c e x t = α 1 [ L o g ( R e ) ] 2.58 1 ( 1 + β M 2 ) γ A w e t A r e f ,
The parametric formulation reported in Equation (4) allows for the estimation of the viscous effect by correcting the turbulent flat plate theory (represented by the term 1 [ L o g ( R e ) ] 2.58 , see [10]) with (i) the factor 1 ( 1 + β M 2 ) γ which takes into account the compressibility effect [11], (ii) the wetted and the reference areas ratio and (iii) the parameter α will be customized depending on the vehicle configuration. In the original formulation which was used to support the Space Ship 2 Aerodynamic Characterization [12], the values suggested for these parameters are as follows: α = 0.455 , β = 0.144, and γ = 0.65 .
Considering the substantial differences between STRATOFLY MR3 and the Space Ship 2 configurations, a new formulation of the parameters has been considered. Firstly, the peculiar shape of STRATOFLY MR3 prevents use of Equation (4) for the entire vehicle configuration, but it allows for applying it only at the external surface. Therefore, in this case the vehicle presented an integrated propulsive flow-path, the ratio A w e t A r e f will be evaluated by considering the external wetted area only, without taking into account the integrated propulsive flow-path, which characterizes STRATOFLY MR3 configuration. For STRATOFLY MR3, this leads to a value of about 2.31. Then, α ,   β , and γ coefficients have been tuned to use a set of viscous CFD simulations carried out at angle of attack zero all over the range of Mach number. To achieve reliable results, the previous grid (Figure 3) has been stretched close to the vehicle wall by adding a prism layer and thus reaching a total number of cells of about 3.2 million. The k-ω-SST turbulence modeling, which can be used for a wide range of fluid flows as in the present calculations (see [13]) has been adopted. Pressure-far-field conditions have been applied for the external surfaces of the domain (assigning Mach number, pressure, and temperature), while the surfaces of the vehicle are treated as no-slip adiabatic walls. The AUSM scheme (upwind) for numerical convective flux is used, coupled with a density-based approach and an implicit time discretization that allows for higher than 1 CFL number (up to 6). Considering that viscous CFD runs require much more CPU time than the inviscid Eulerian ones, the viscous CFD runs have been performed only at angle of attack zero for the tuning of previous formula (Equation (4)). Results of the viscous external CFD simulations carried out throughout the reference trajectory are reported in blue in Figure 6. The strange behavior of the curve for low Mach numbers is mainly due to the fact that for each Mach number, the CFD simulation has been conducted keeping the real flight altitude, resulting therefore in a different Reynolds number. In order to make the tuning easier, the CFD results have been scaled to the same Reynolds number (the value of Mach 0.3, which is 6.54 × 10⁸) as reported in green. At the same time, the ( Δ C D ) v i s c e x t predicted using the original formulation has been plotted (see the grey line). Eventually, α ,   β , and γ coefficients have been tuned to better predict the trend of the green line through the analytical formulation, thus obtaining a new modified analytical formulation, which is more accurate for wave-rider configurations. The curve obtained at the end of the tuning process is reported in red, and it corresponds to Equation (4) with α = 0.43 ,   β = 0.31 , and γ = 0.37 .
This procedure cannot be applied to the internal flow-path, where strong section area variations cause significantly different behavior of the air flow with respect to the simple flat plate. Therefore, for the internal part, the viscous internal CFD results are directly used, scaled only for the Reynolds effect, using Equation (5):
C D f i n t = [ L o g ( R e n o m ) ] 2.58 [ L o g ( R e f l i g h t ) ] 2.58 P o l y n o m i a l CFD A w e t i n t A r e f ,
where R e n o m is the Reynolds number of the reference trajectory (used for CFD calculations), R e f l i g h t is the actual trajectory Reynolds number, and Polynomial_CFD is the stepwise interpolation of CFD data all along the Mach number (Figure 7).
The test matrix used to produce the results of the clean aero-database considers 16 Mach Numbers at 7 angles of attack for a total number of 112 runs. The commercial code Fluent has been used running on CIRA Linux Cluster (“Turing” 50 Teraflops, 1440 computing cores) and taking about one day for each polar with 16 parallel cores.

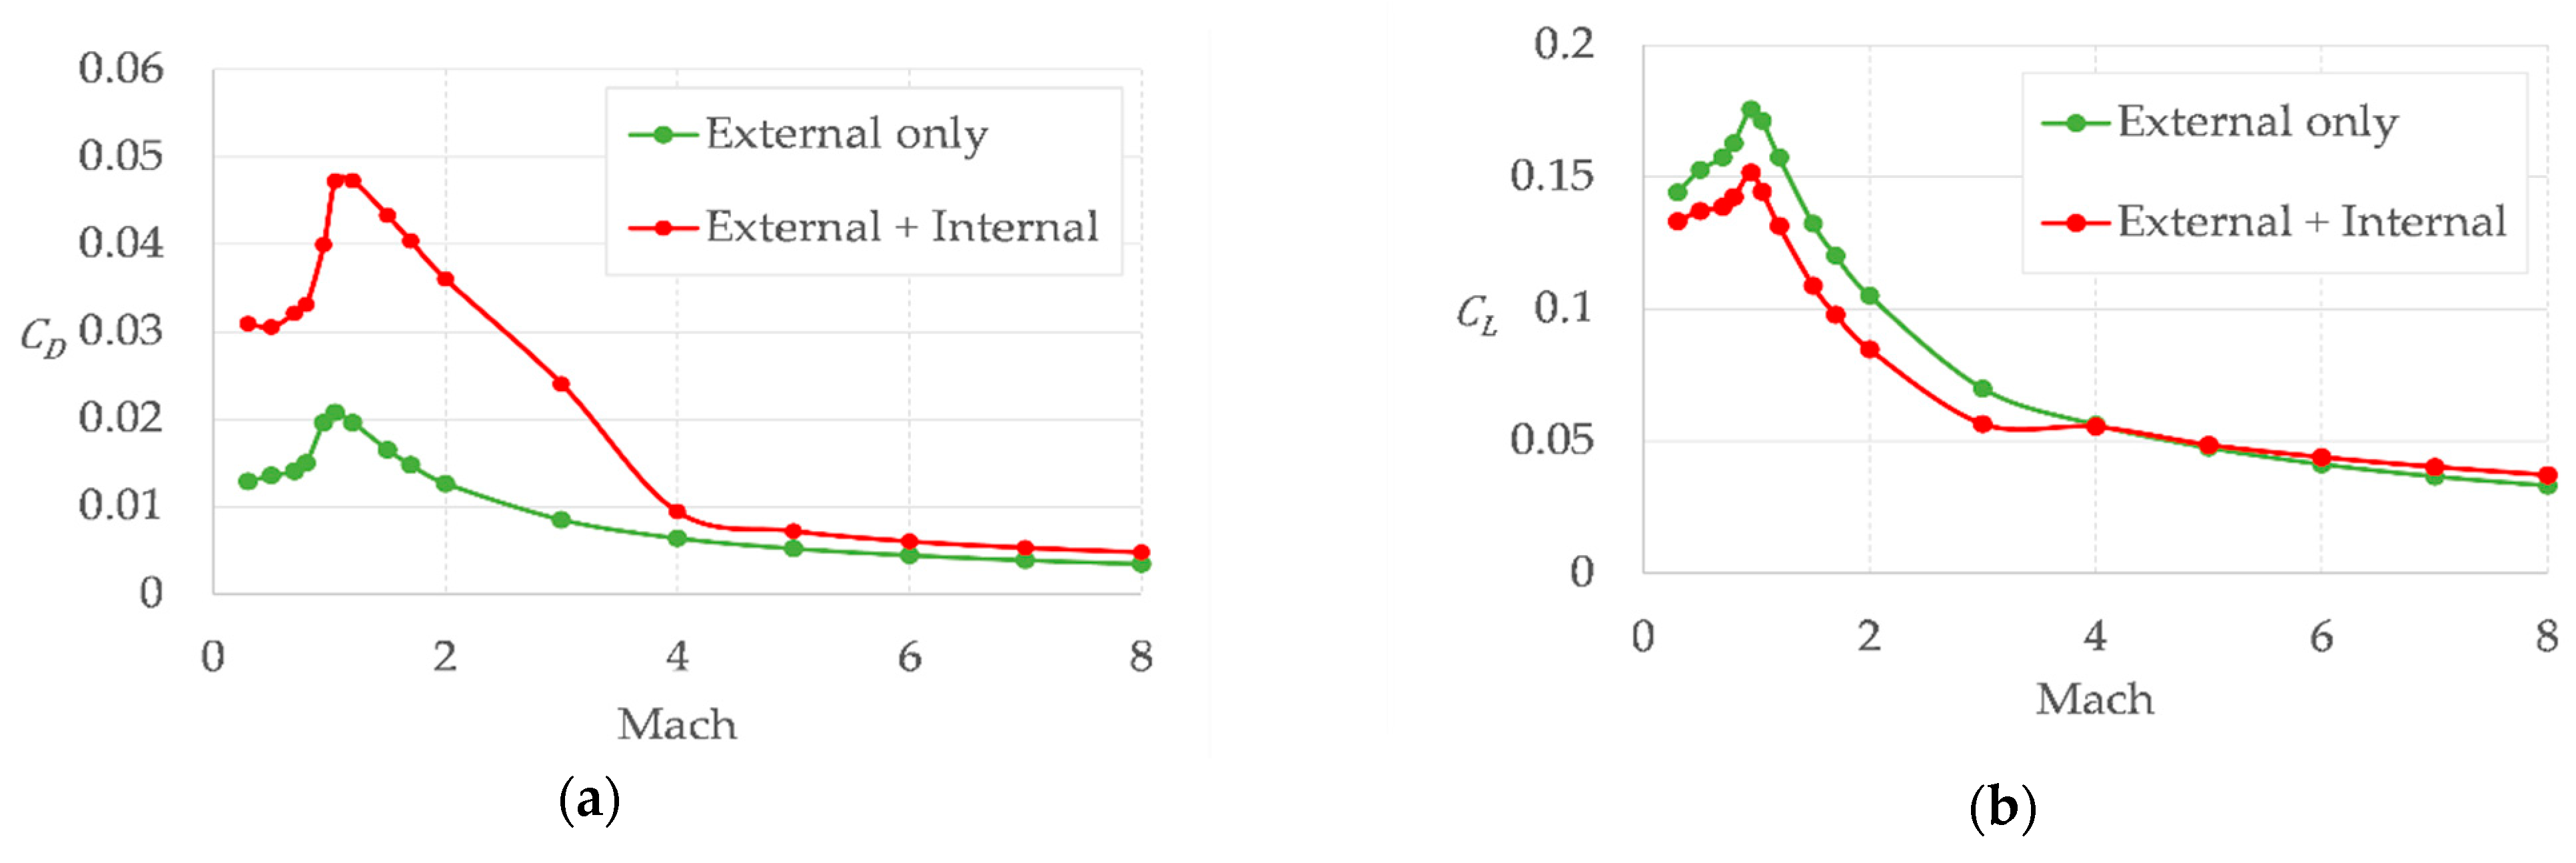
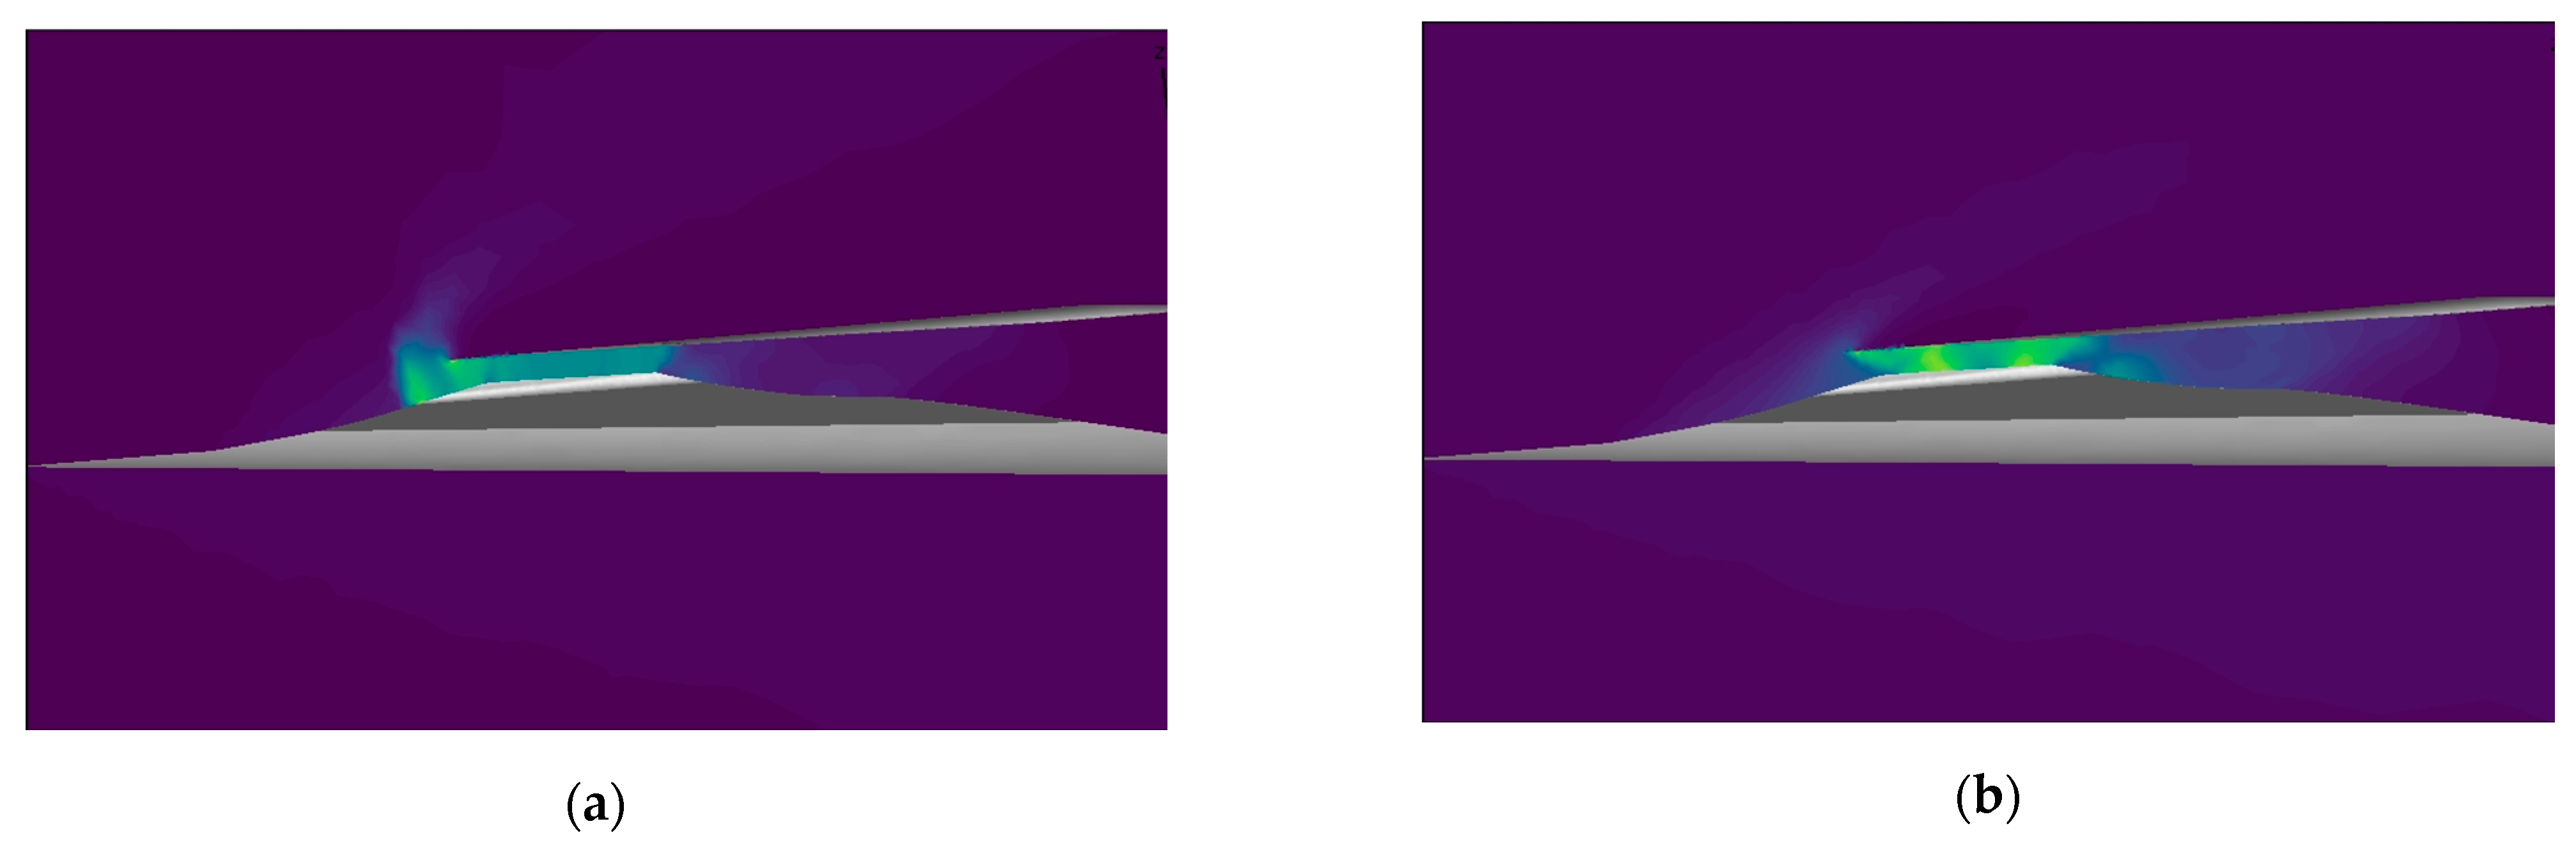
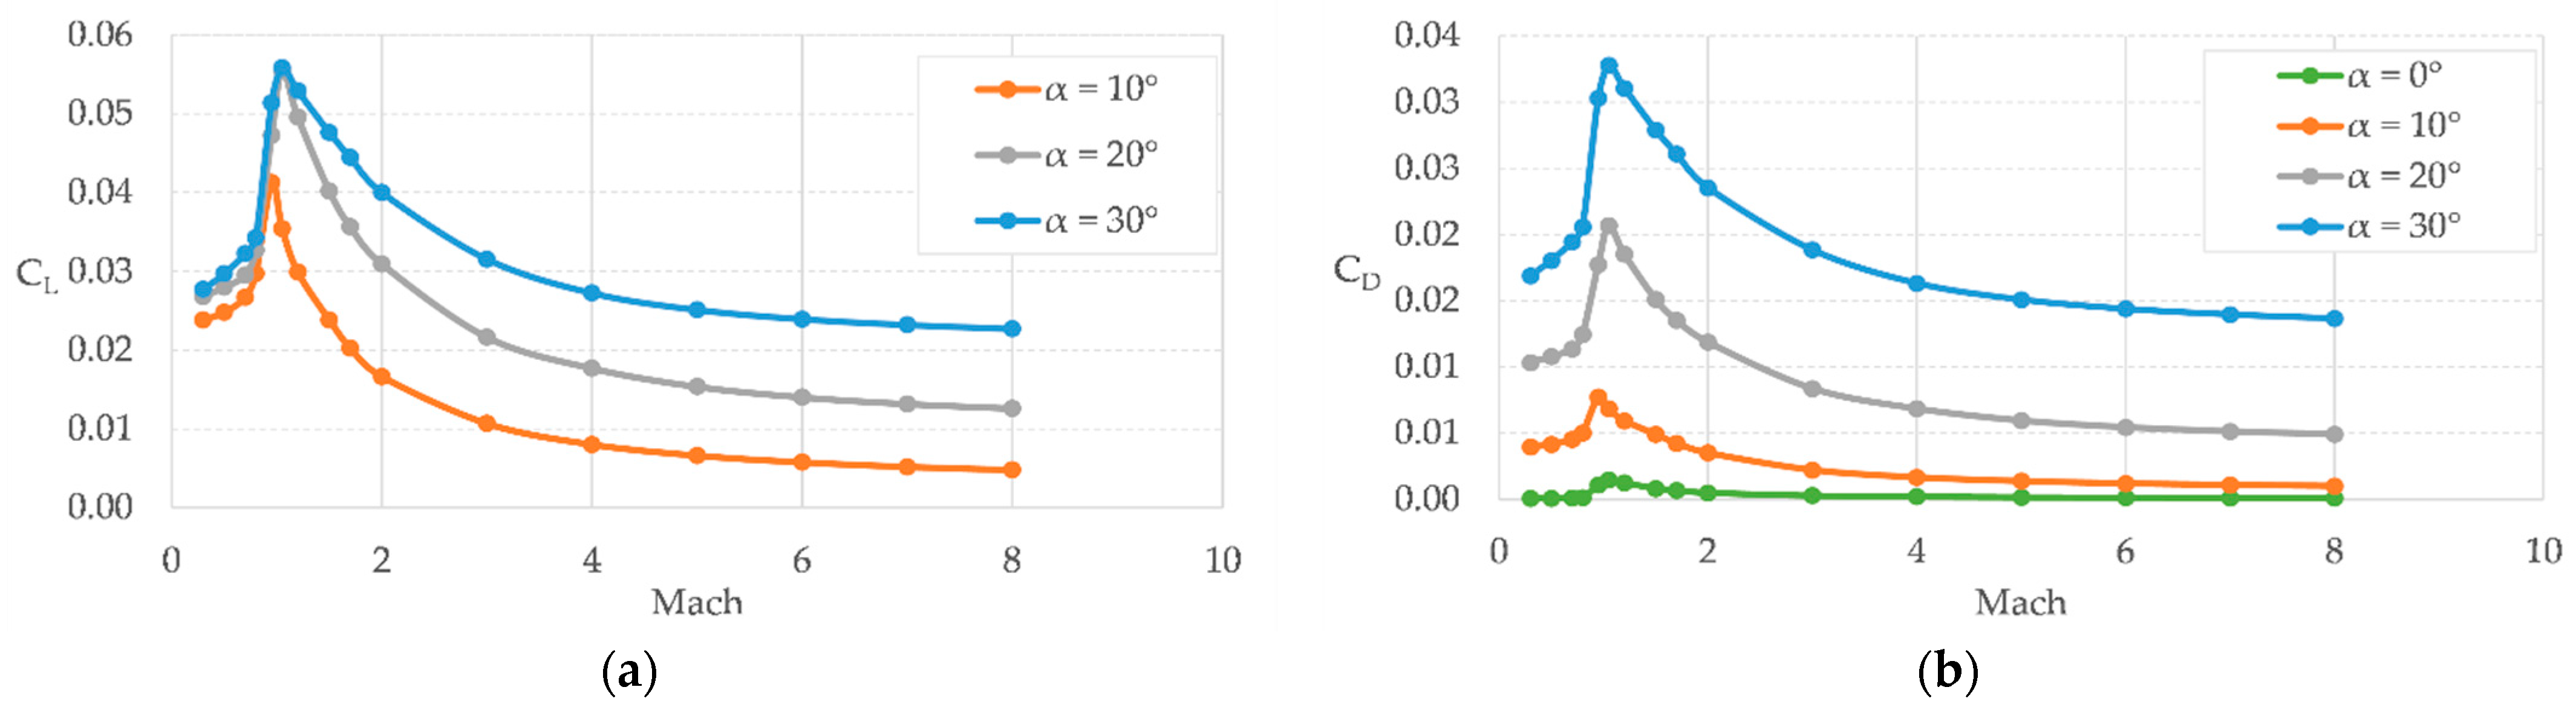
3.3. Impact of Propulsive Flow Path

This section further exploits the CFD simulations already presented in the previous sections (that includes both the external and the internal domain of the vehicle) and provides suggestions on how to evaluate the contribution of the integrated propulsive flow path which consists of an intake, a combustor, and a nozzle, all embedded inside the waverider vehicle layout. As is reported in Figure 8, the flow-path substantially contributes to the overall aerodynamic forces, especially in subsonic, transonic, and low supersonic speed regimes. The main effects are the additional drag and a down-lift, both mainly due to the intake.
The sudden reduction of drag at M = 4 (Figure 8a) can be explained because the combustor swallows the shock wave, and in addition, the intake down-lift disappears (Figure 8b). The swallowing of the shock wave provides the aerodynamic characteristics with a hysteresis phenomenon, as can be seen in Figure 9. The investigated configuration shows that the shock wave is captured by the combustor between Mach 5 and Mach 6 during the ascent trajectory, while it is expelled between Mach 4 and Mach 3 during the descent trajectory. This different behavior of the air-intake can be noted in Figure 10 where we can see the Mach number contours at M = 4 and AoA = 0° far field conditions during ascent and descent phases. However, looking at the envisaged in-flight operations of the MR3 propulsion subsystem, only the descending branch of the hysteresis graph has been considered. Indeed, the ATR ducts are expected to be open, thus facilitating the entrance of the shock wave into the combustor between Mach 3 and Mach 4.

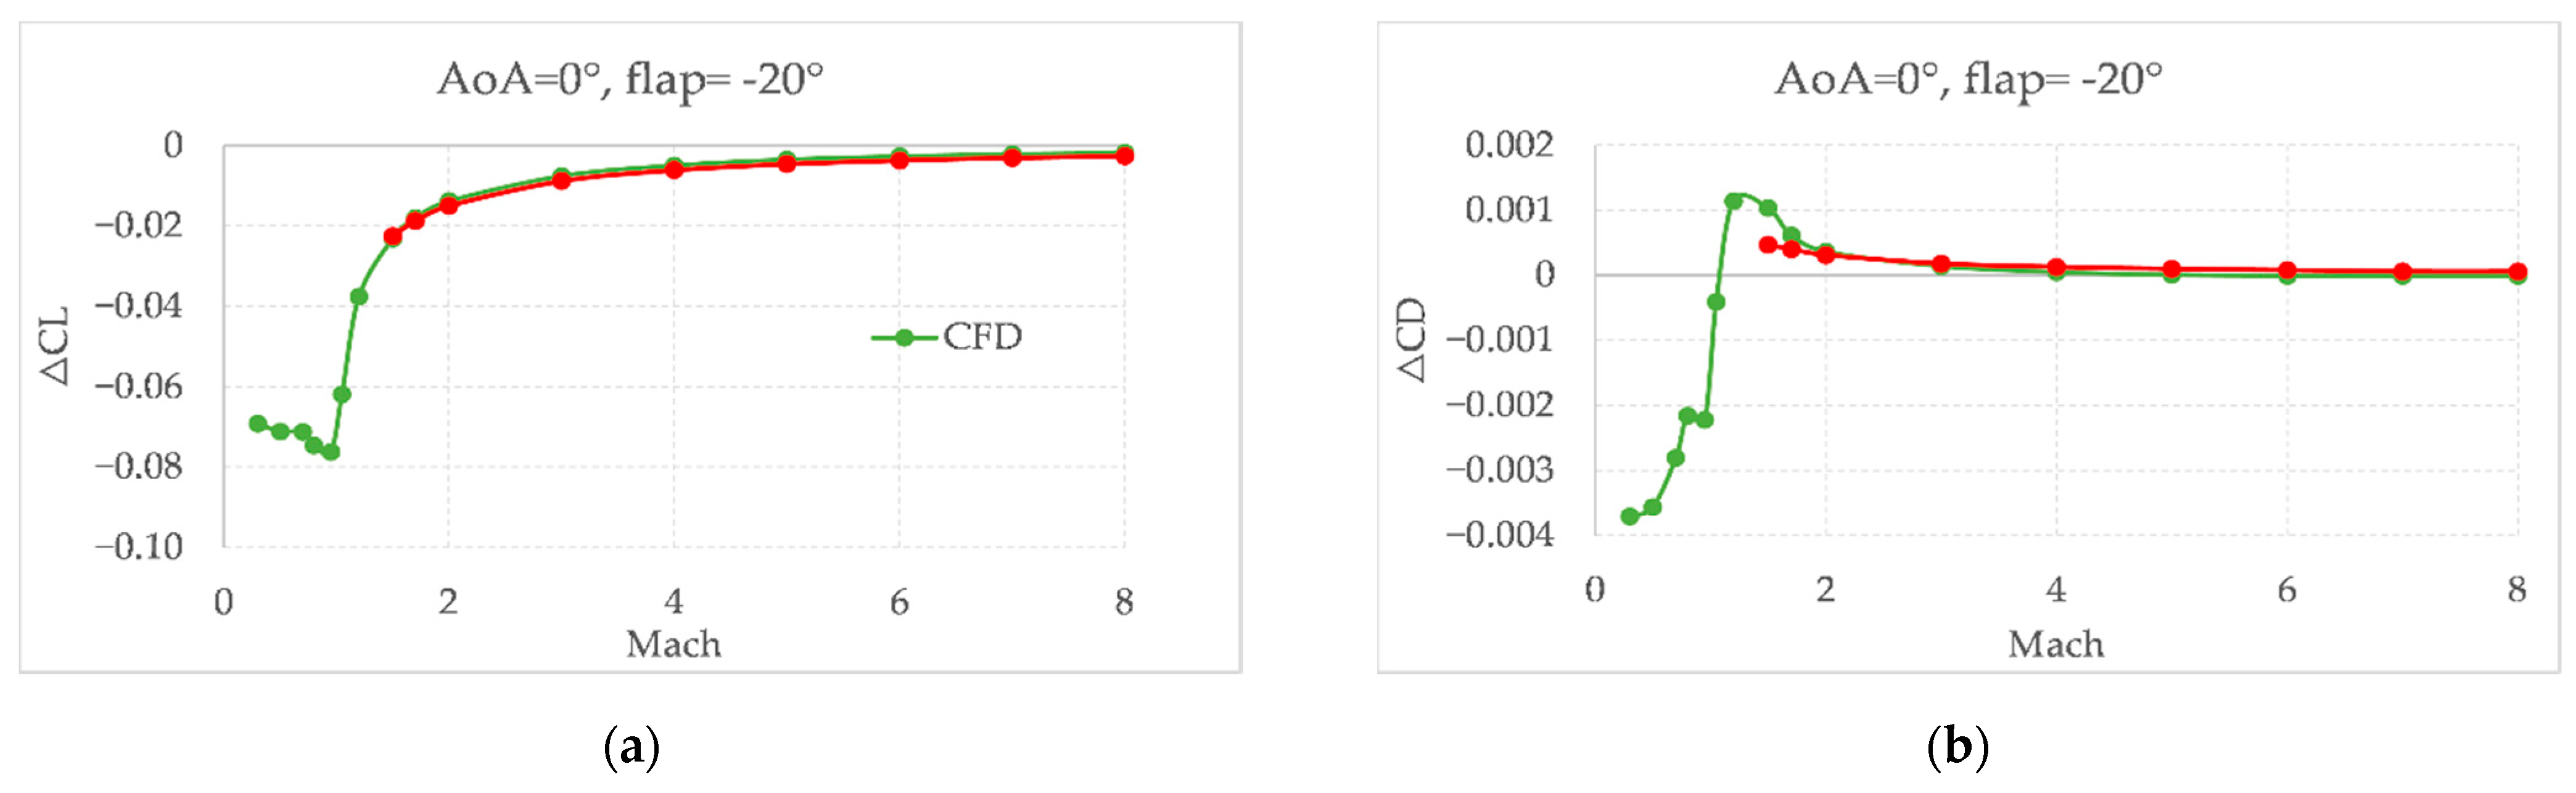
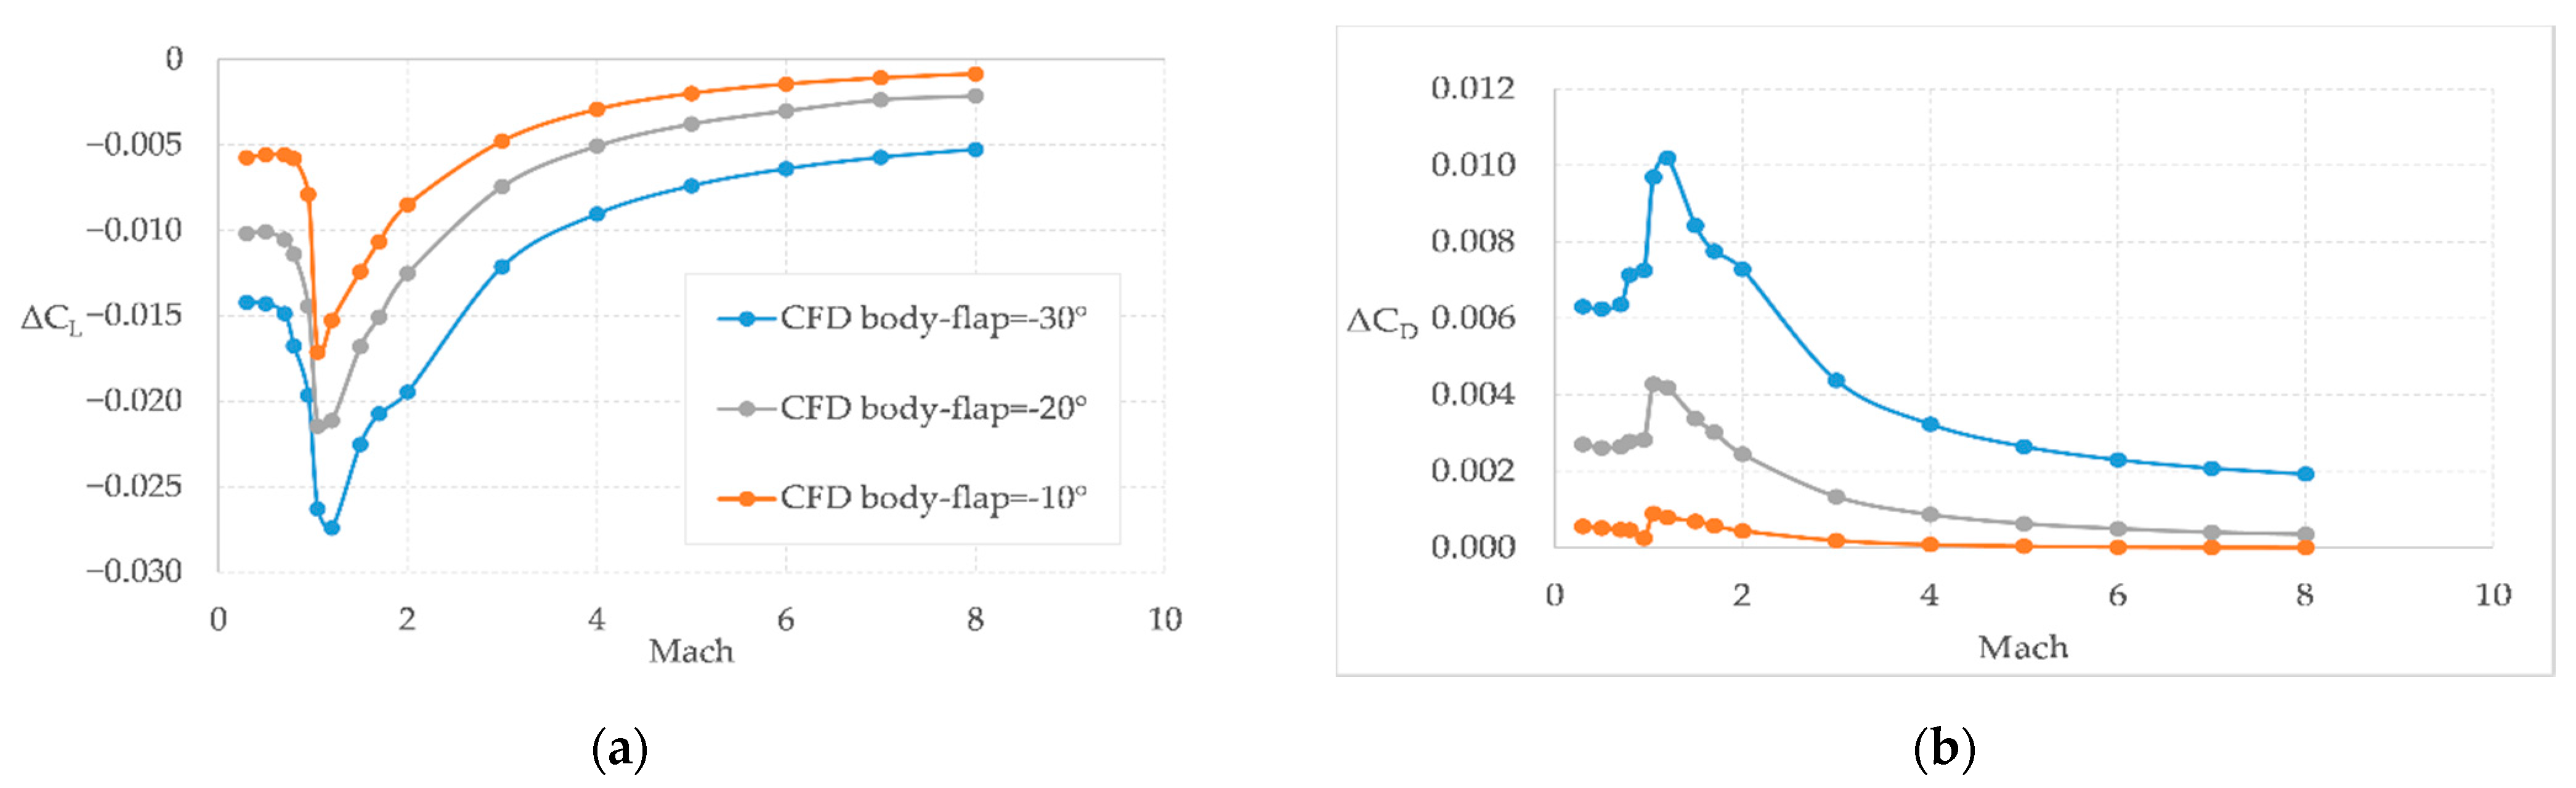
3.4. Impact of Control Surfaces

The effect of control surfaces is taken into account through a simplified approach (inviscid calculations) and simplified configuration selecting only the parts of the vehicle of interest. For example, for the effect of flaps, a wing-flap configuration is used (Figure 11a), while for the canard, a stand-alone one. As far as the body-flap is concerned, a more complex configuration has been generated, accounting for both the rear part of the fuselage and the vertical tail (Figure 11b). Viscous corrections are not considered, since the delta values (with respect to the clean configuration) are used.
From Figure 12, Figure 13 and Figure 14, the effect of control surfaces is reported. The contribution of the control surfaces is evaluated with respect to the clean configuration case (undeflected control surfaces); this effect is referred here as ΔCL and ΔCD. There is good agreement with the Surface Impact Method (SIM) except for with the body-flap configuration, which is due to the strong effect of fuselage and vertical tail not considered by SIM (Figure 14).

4. Mission Analysis

The Aerodynamic analysis performed for the STRATOFLY MR3 vehicle is complemented by a parallel mission analysis which exploits the available aerodynamic database. As the complexity of the aerodynamic model increases and consequently, the aerodynamic database, the accuracy of the results of the mission simulations increases as well. In the following subsections, details on the mission simulation, performed with ASTOS 9.17, are provided.

4.1. Methodology Overview

The mission analysis is carried out mirroring the steps of the build-up approach used for the aerodynamic database, and three main steps can be identified.
First, a preliminary mission simulation is run considering only the aerodynamic data of the vehicle clean configuration, which does not take into account the deflection of the flight control surfaces or any aerodynamic contributions due to propulsive system components. A very first estimation of the vehicle performance along the trajectory can be evaluated in the preliminary phases of the Aerodynamic Analysis.
Then, once the contribution of the flight control surfaces is added to the aerodynamic database, a more detailed mission simulation can be performed. However, one main limitation exists: ASTOS does not include the possibility to perform a static stability and trim analysis. For that reason, the trimmed conditions are separately evaluated through a Matlab script for each Mach number, and then used to create the trimmed aerodynamic database. Therefore, as final step, different mission simulations are carried out, considering the trimmed aerodynamic database and different possible routes.
A detailed description of the vehicle model, including aerodynamics and propulsion characteristics, flight phases, and constraints are provided as inputs to the software for the mission simulation. For all the simulations, the standard atmosphere model contained in ASTOS has been used, and no cross winds have been considered. The vehicle structural mass is equal to 218.75 Mg, while the propellant mass is 181.25 Mg. The maximum take-off weight is then equal to 400 Mg [2]. The propulsive database contains the data of the ATR and DMR engines, and it is derived from LAPCAT MR2 project. Moreover, the angle of attack and the throttle are the two parameters which are used to control the vehicle throughout the simulation. The AoA is set to vary in the range −2°/+2°, while the throttle can vary between 0 (engine-off conditions) and 1 (full thrust).
Based on the LAPCAT MR2.4 reference vehicle and mission [5], the STRATOFLY MR3 vehicle has been originally conceived to cover antipodal routes with a range up to 19,000 km, such as a Brussels to Sydney mission. However, as the aerodynamic database accuracy increases, the simulations show a detrimental effect for the vehicle aerodynamic performance due to the more accurate modelling of the propulsion flow-path. These effects practically prevent the MR3 vehicle from meeting the antipodal range. Therefore, a shorter mission connecting Brussels to Tokyo is also considered, with a range of approximately 12,000 km. The vehicle initial conditions are reported in Table 2.
The simulation starts at the end of the take-off phase, as the runway acceleration at take-off cannot be properly simulated in ASTOS. An initial velocity of 128 m/s is set to ensure lift-off and to guarantee the stability of the trajectory simulation.

4.2. Mission Analysis with Clean Configuration
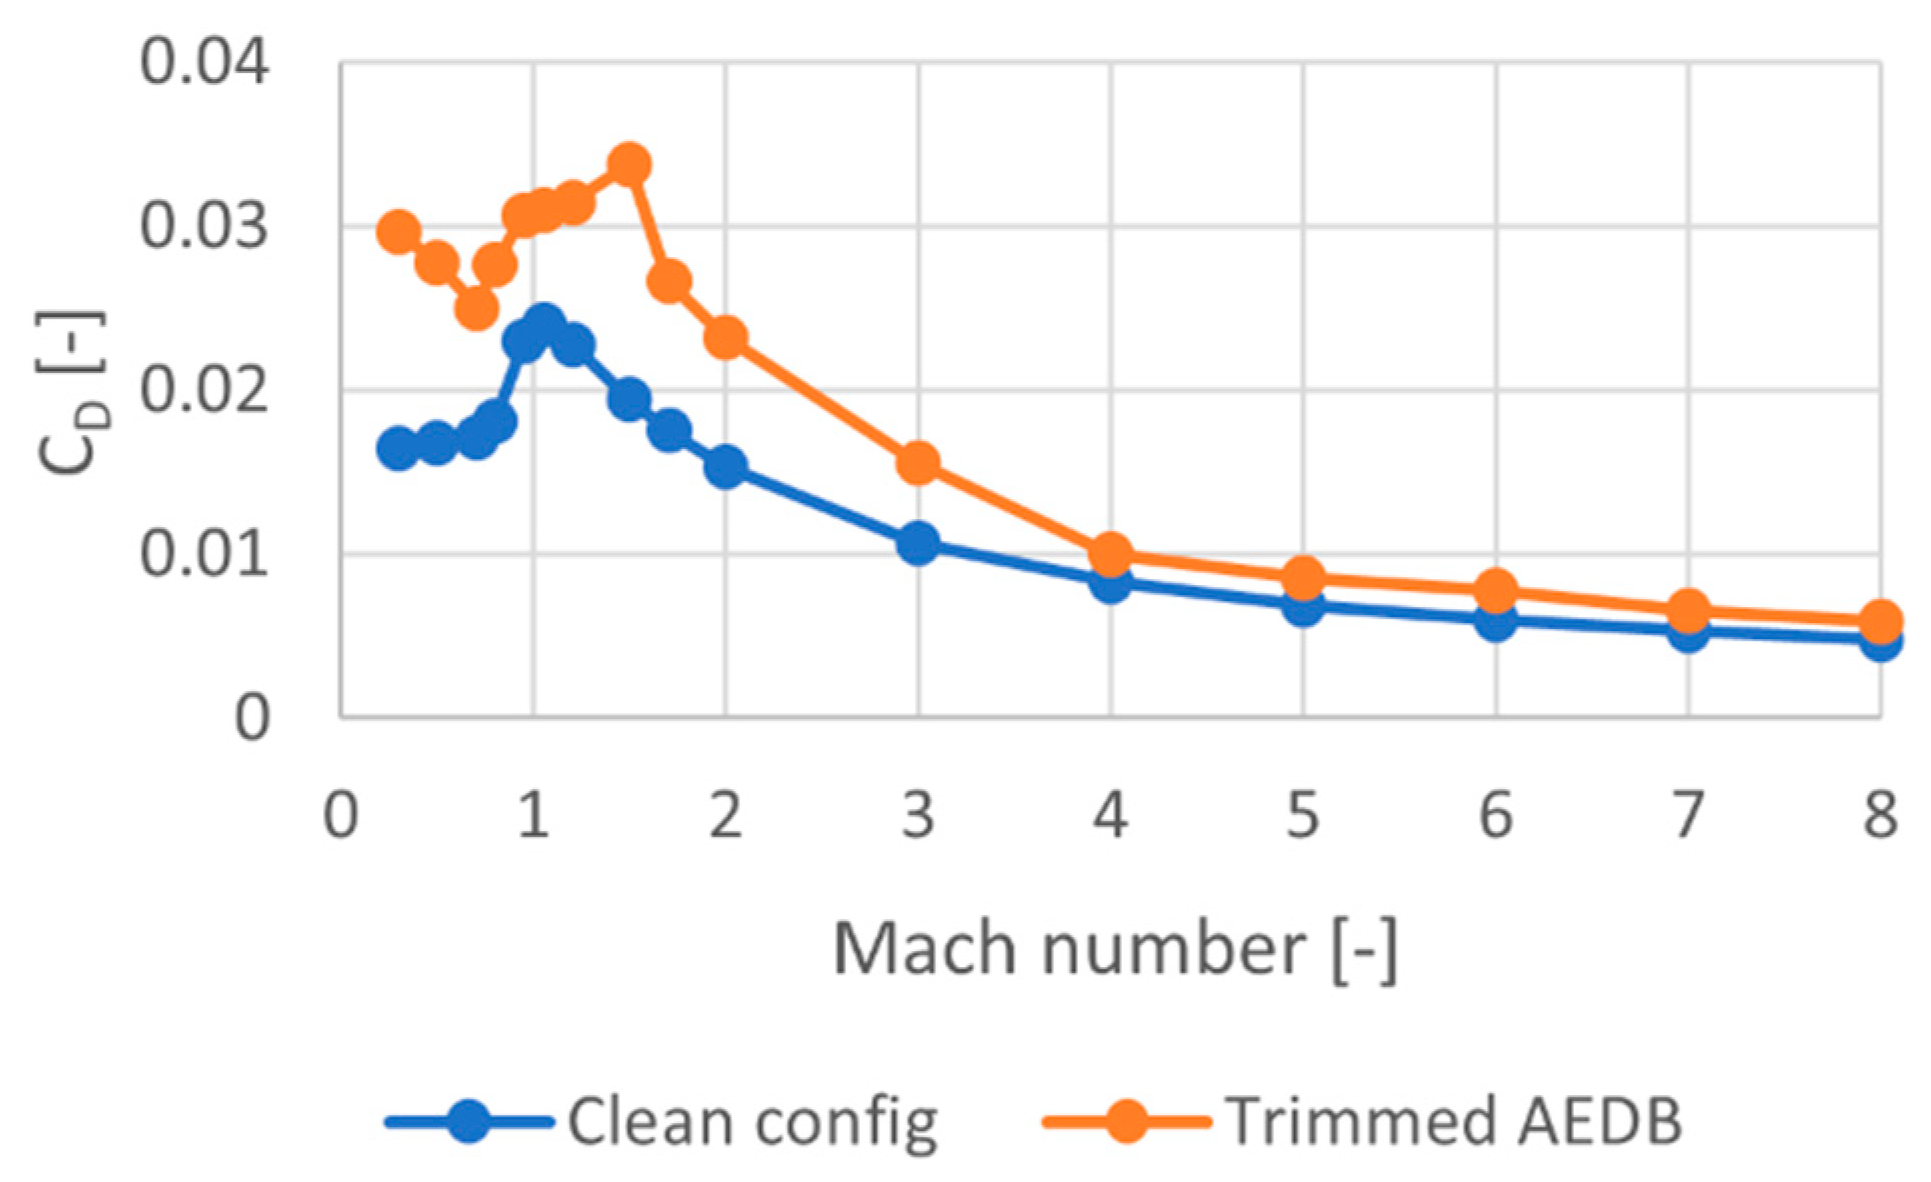
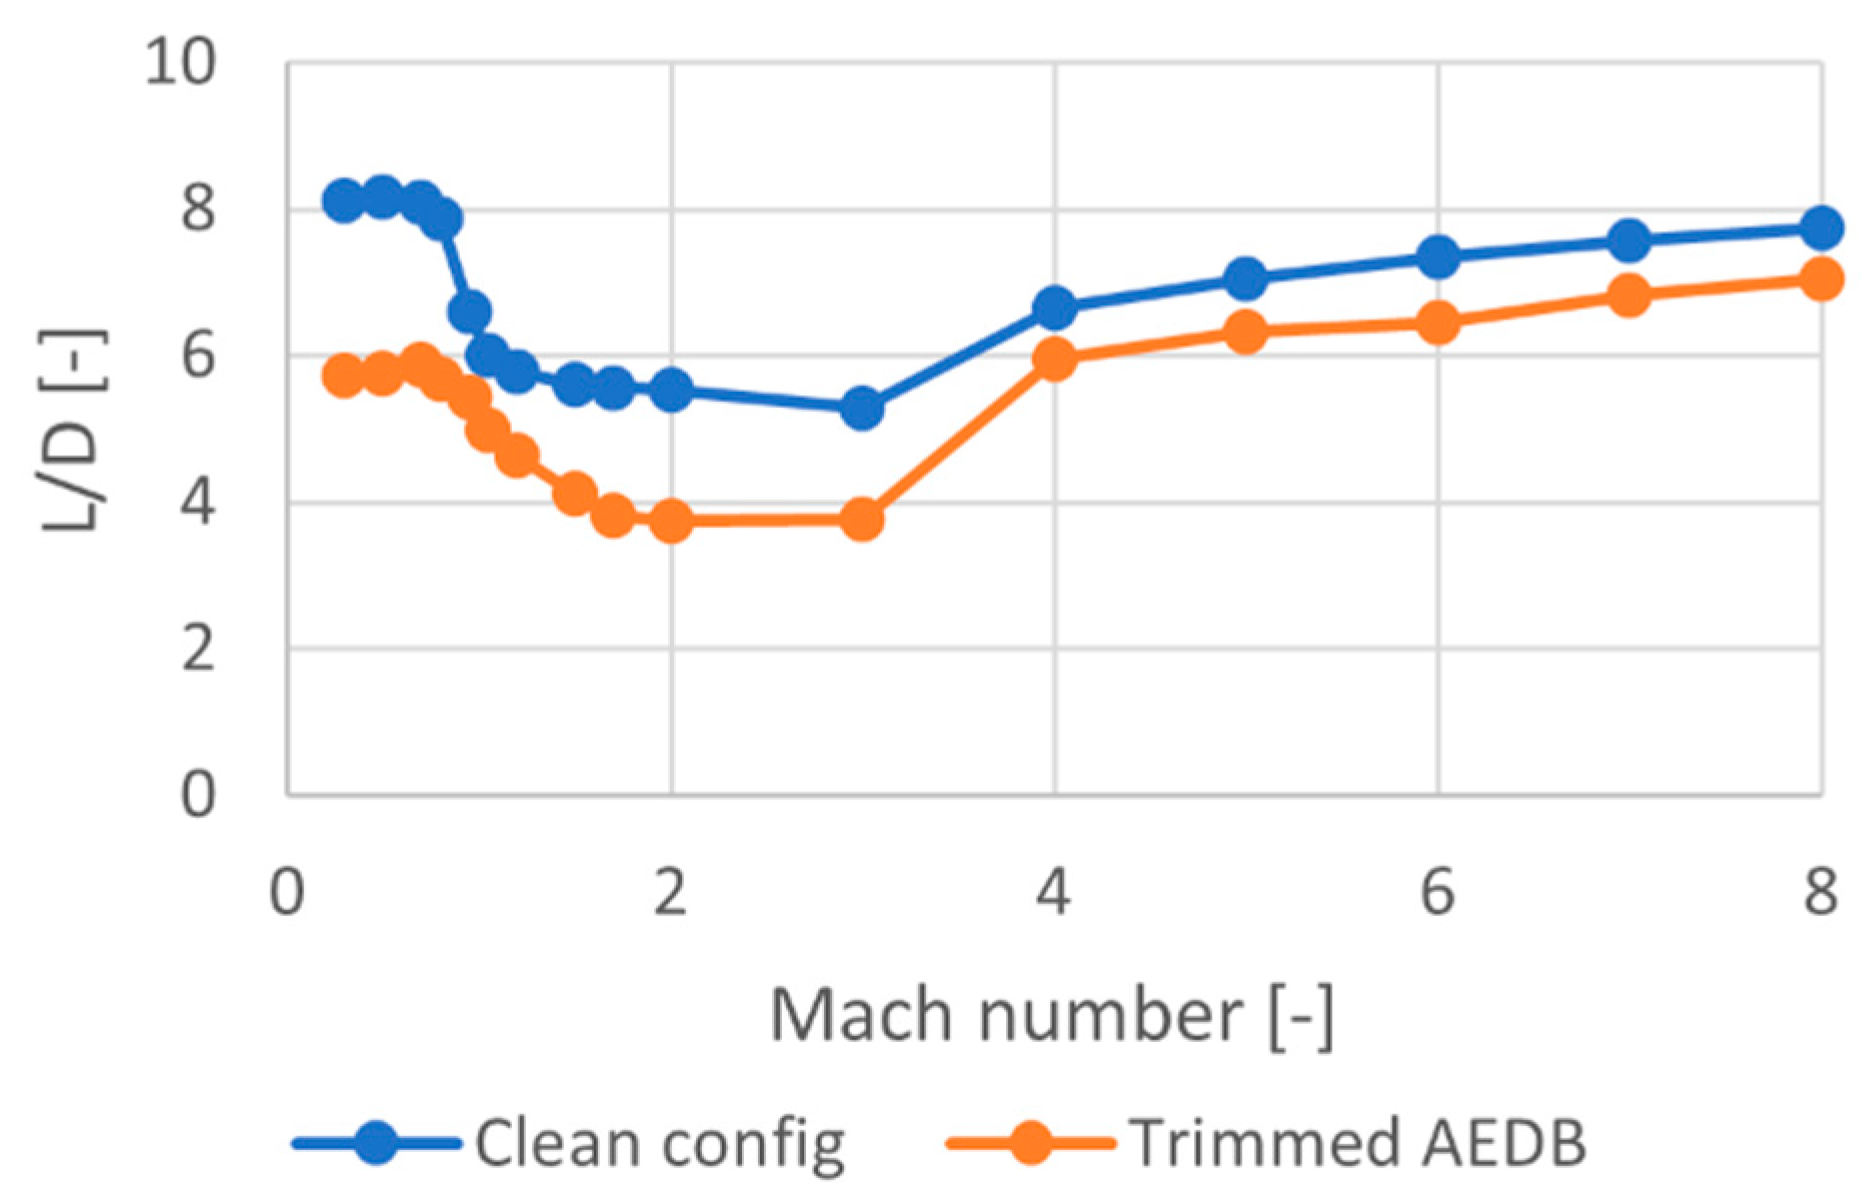
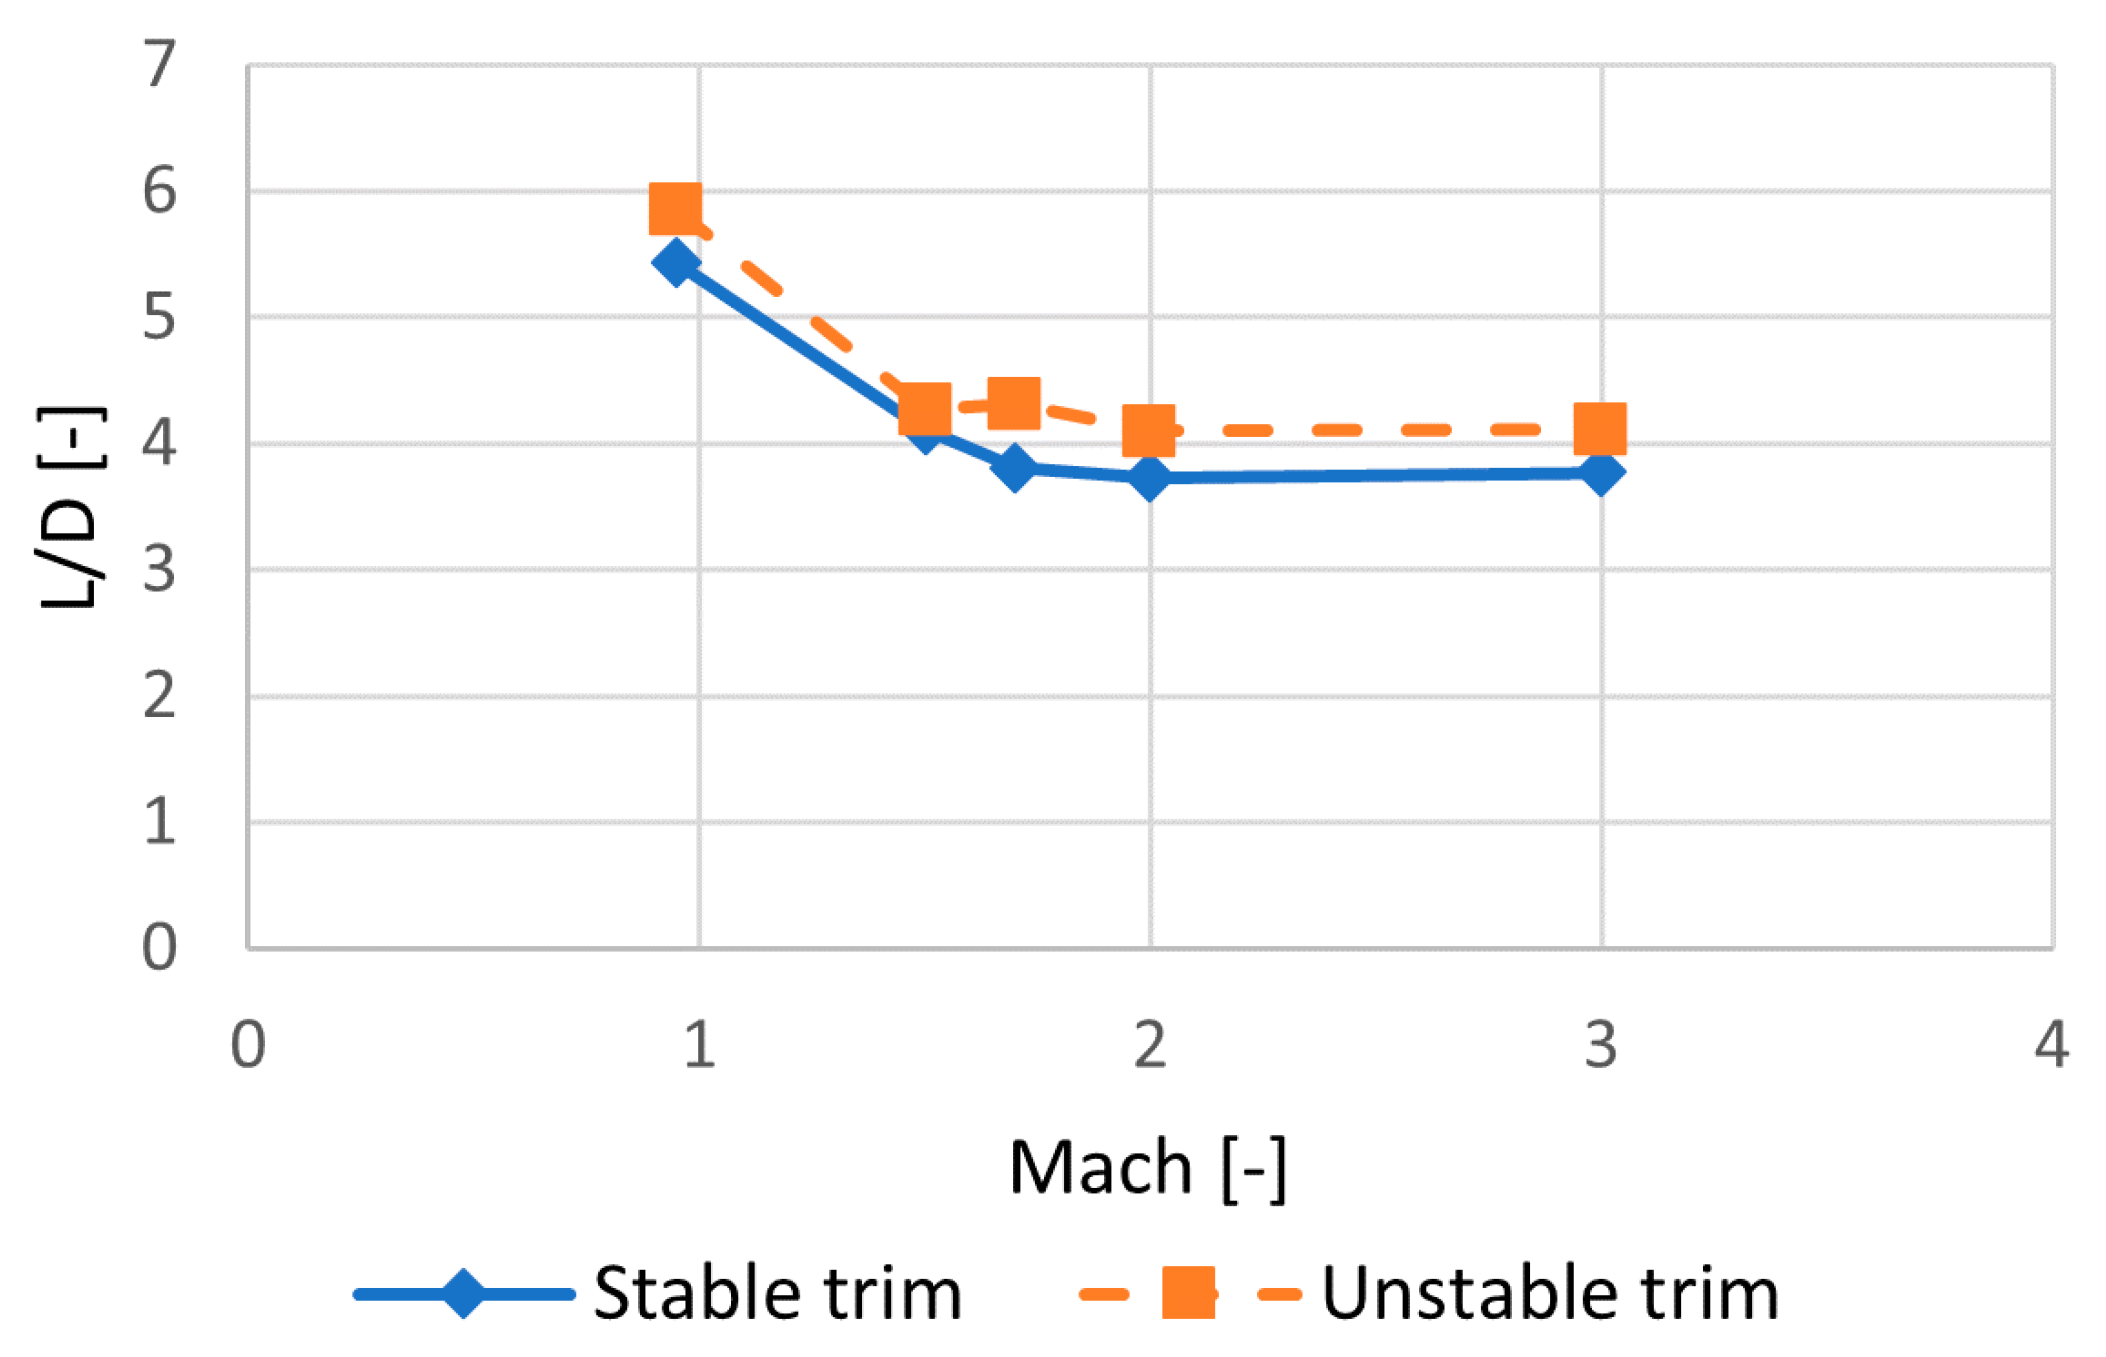
The first set of mission simulations is run considering the initial version of the aerodynamic database, which is referred to the vehicle clean configuration only. A complete view of the mission trajectory is reported in Figure 15, where the line is colored by Mach numbers.
The Mach and altitude profiles are reported in Figure 16 and Figure 17. The vehicle performs the hypersonic cruise at M = 8 and an altitude that varies from 31 to 36.8 km. The latter altitude is higher than the 35 km maximum altitude of the reference mission profile and this is mainly due to the higher lift coefficient during the climb phase. The total mission time is equal to 2 h 52 m (10,300 s).
The Lift-to-Drag ratio profile is shown in Figure 18. The maximum L/D is equal to 9 and it is reached during the subsonic flight. However, the L/D drops to the minimum value of 4 during the supersonic climb between Mach 2 and 3, where the aerodynamic performances are very poor. Then, during the hypersonic cruise the L/D is increasing to 7.8. The final part of the mission involves an unpowered descent. The internal duct is empty, and the air flows through the internal duct, negatively affecting the overall aerodynamic characteristics of the vehicle. This results in a poor aerodynamic performance in engine-off conditions, where the L/D ranges between 3 and 5.
The angle of attack used during the simulation is reported in Figure 19. During the climb phases, the AoA is set to negative values to limit the excess of lift which is produced due to the large vehicle surface. If the vehicle flew at higher angles of attack, it would quickly increase its altitude. Conversely, during the unpowered descent, the AoA is set to the maximum value of 2°. During this phase, since the Lift-to-Drag ratio is very low, it is necessary to increase the lift generated by the vehicle as much as possible, to avoid a steep descent.
The value of the propellant mass contained on-board at each instant is reported in Figure 20. The highest fuel consumption rate is experienced during the supersonic and hypersonic climb, where the thrust is increased up to the maximum available thrust. Almost all fuel is burnt during the mission and only 1 Mg is left at the end of the last propelled phase (Hypersonic cruise). These results seem to be not promising, considering that the clean configuration represent the best-case scenario for what concerns the aerodynamic performance. If the flight control surfaces contribution is added to the aerodynamic database, the aerodynamic performance degrades, and the fuel consumption increases.

4.3. Trim Analysis

Once the complete aerodynamic database has been delivered, the static longitudinal stability and trim analysis has been performed. This activity is crucial for the design of a civil passenger aircraft that is expected to fly stable through the mission phases. However, it has to be noticed that the need to fly through different speed regimes and the peculiarities of high-speed vehicle configurations, and therefore the Center of Gravity (CoG) shift throughout the mission, may suggest relaxing the stability requirements, taking advantage from the modern guidance and navigation equipment.
The complete aerodynamic database is composed of different contributions, namely the clean configuration and the flight control surfaces (canards, flaps, and bodyflap). The viscous correction is also added for the drag coefficient. An additional contribution is considered when evaluating the pitching moment coefficient CMy. Since the thrust vector is not aligned with the vehicle x-axis, the thrust produces a not negligible pitching moment.
C M _ T = C T · Δ z / L
where CT is the thrust force coefficient, Δz is the z distance between the thrust vector and the vehicle x-axis, and L is the vehicle length.
The propulsive database already contains the net thrust, which is evaluated considering both the gross thrust and the contribution of the internal drag. Thus, the thrust contribution to the total CD is not considered here. Moreover, the thrust is supposed to be applied along the x-axis, and it does not contribute to the total CL. The total value of the aerodynamic coefficients CL, CD, and CMy is evaluated as the sum of the different contributions:
C L = C L   c l e a n + C L   f l a p + C L   c a n a r d + C L   b o d y f l a p
C D = C D   c l e a n + C D   f l a p + C D   c a n a r d + C D   b o d y f l a p + C D   v i s c o u s
C M = C M   c l e a n + C M   f l a p + C M   c a n a r d + C M   b o d y f l a p + C M   T h r u s t
The different contributions are also listed in Table 3.
Canards and flaps deflection ranges between −20° and +20°, while the bodyflap deflection is in the range −30°/0°. The resulting total CMy is evaluated for each possible combination of surfaces deflections and for the entire Mach range. The aim is to understand which conditions guarantee longitudinal static stability, namely δ C M y / δ α < 0 , at a given Mach number and CoG position. The latter is derived from the preliminary CoG shift model which has been evaluated by PoliTO. A specific value of the CoG position is considered for each Mach number, as reported in Figure 21.
Then, the trim analysis can be performed. Among the full set of stable conditions evaluated during the previous step, it is possible to select the surfaces deflections and the corresponding angle of attack αtrim which guarantee CMy = 0. The first output of this analysis is a set of trim maps, as the ones reported in Figure 22 and Figure 23. The 3D map shows the resulting αtrim, which corresponds to the trimmed state, as a function of bodyflap and flap deflections, for Mach = 8 and CoG = 48 m. Each canard deflection δcanard is reported with a different color. Figure 23 also shows similar results. However, in this plot, the bodyflap deflection is fixed and the angle of attack αtrim varies only with the flap deflection δflap.
Since the STRATOFLY MR3 vehicle is supposed to fly at low angles of attack, only αtrim between −2° and 2° is considered for the analysis. For each αtrim the corresponding CL and CD can be also evaluated and, accordingly, the L/D. Moreover, for a given Mach number and CoG position, the same αtrim can be achieved with different combinations of Control Surfaces deflections. However, only one combination should be selected to be used as an input for the mission simulation in ASTOS. The combination that corresponds to the highest L/D is selected.
Eventually, the complete trimmed aerodynamic database can be derived and used to perform the mission simulation. The resulting CL, CD and L/D, at different Mach numbers and for AoA = 0°, are reported in Figure 24, Figure 25 and Figure 26 for the clean configuration and the trimmed case. The impact of the Control Surface deflections is clearly visible, especially for what concerns the increase in total drag and, consequently, the decrease in the aerodynamic efficiency along the entire Mach range. Eventually, an example of the database used in ASTOS is given in Table 4 where only some Mach numbers, representative of the different Mach regimes, are reported.

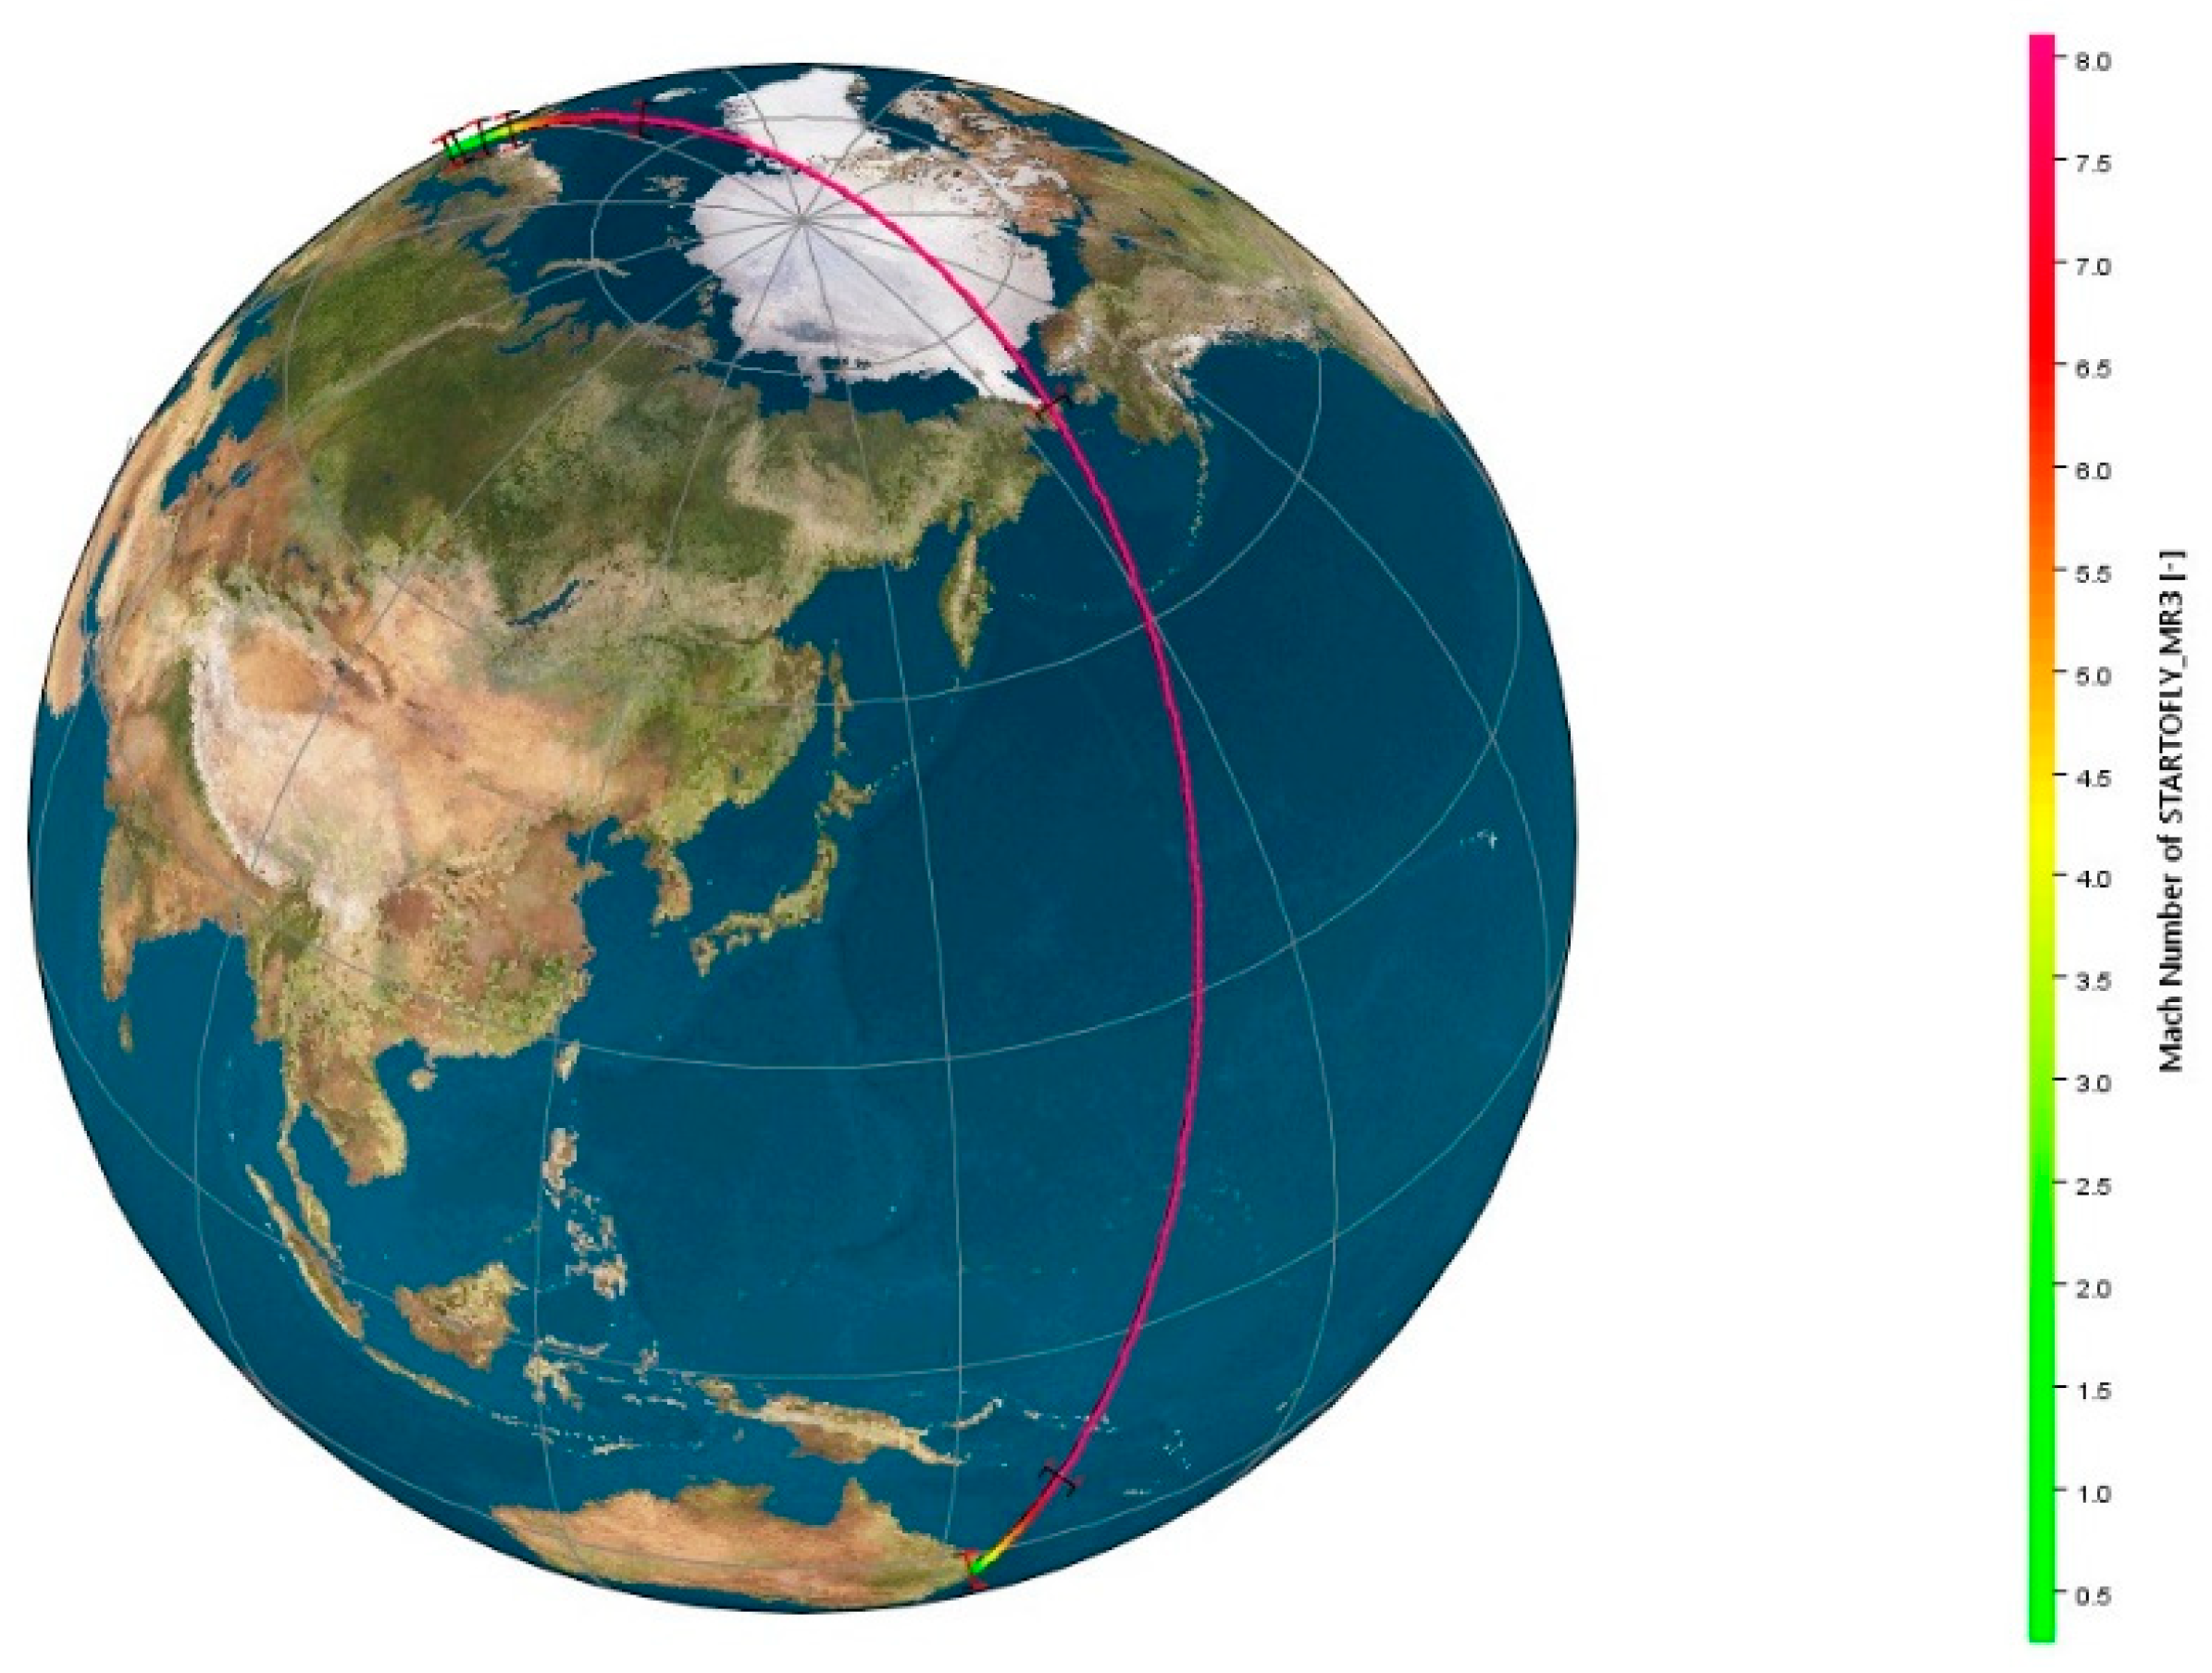
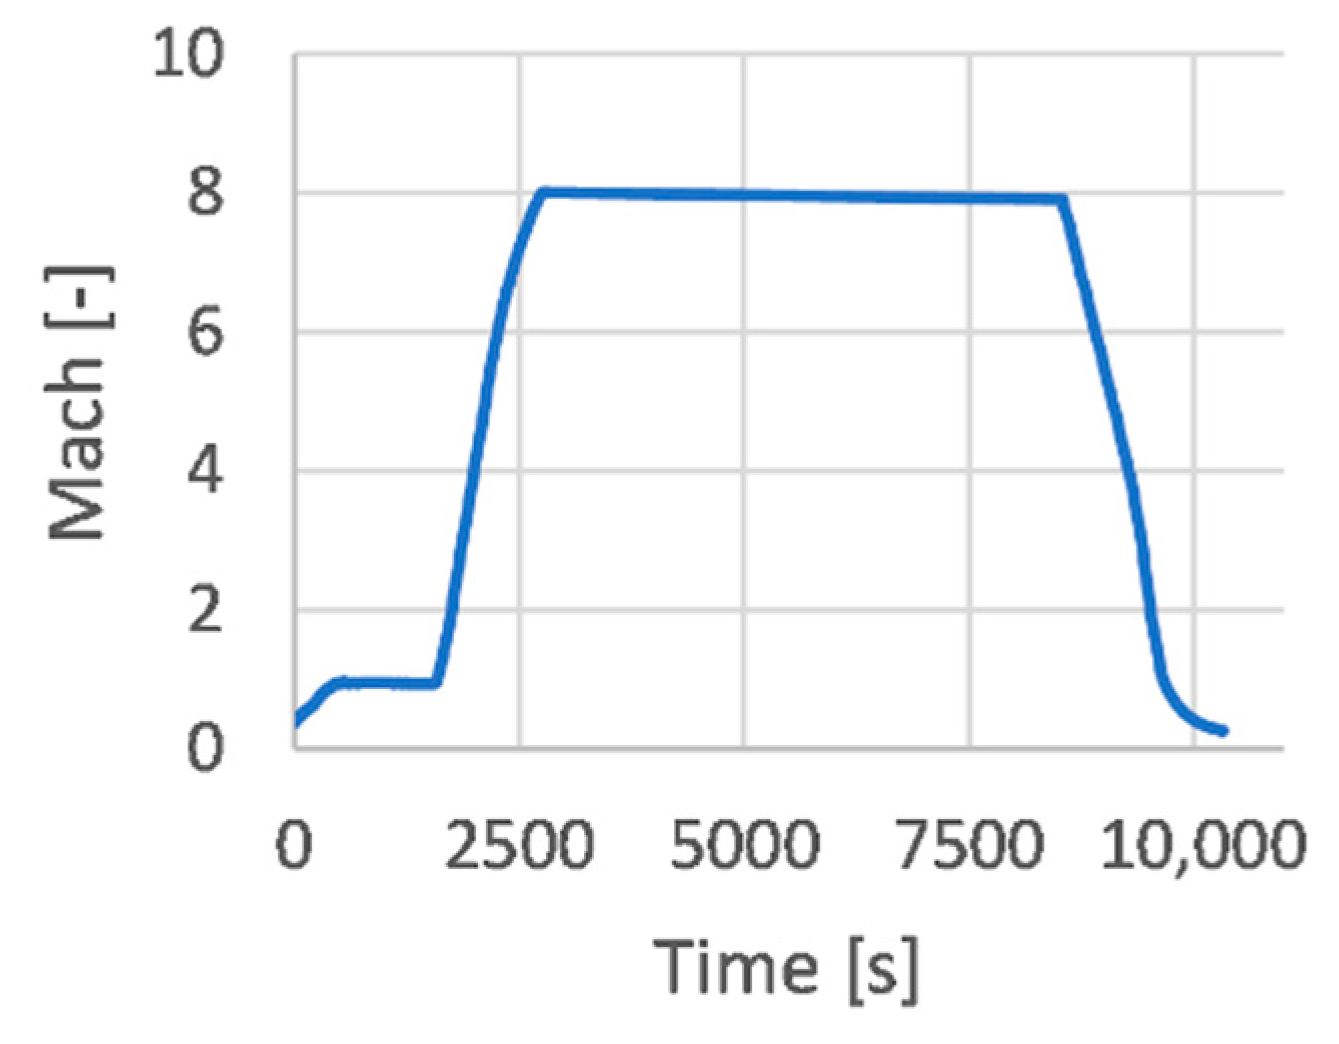
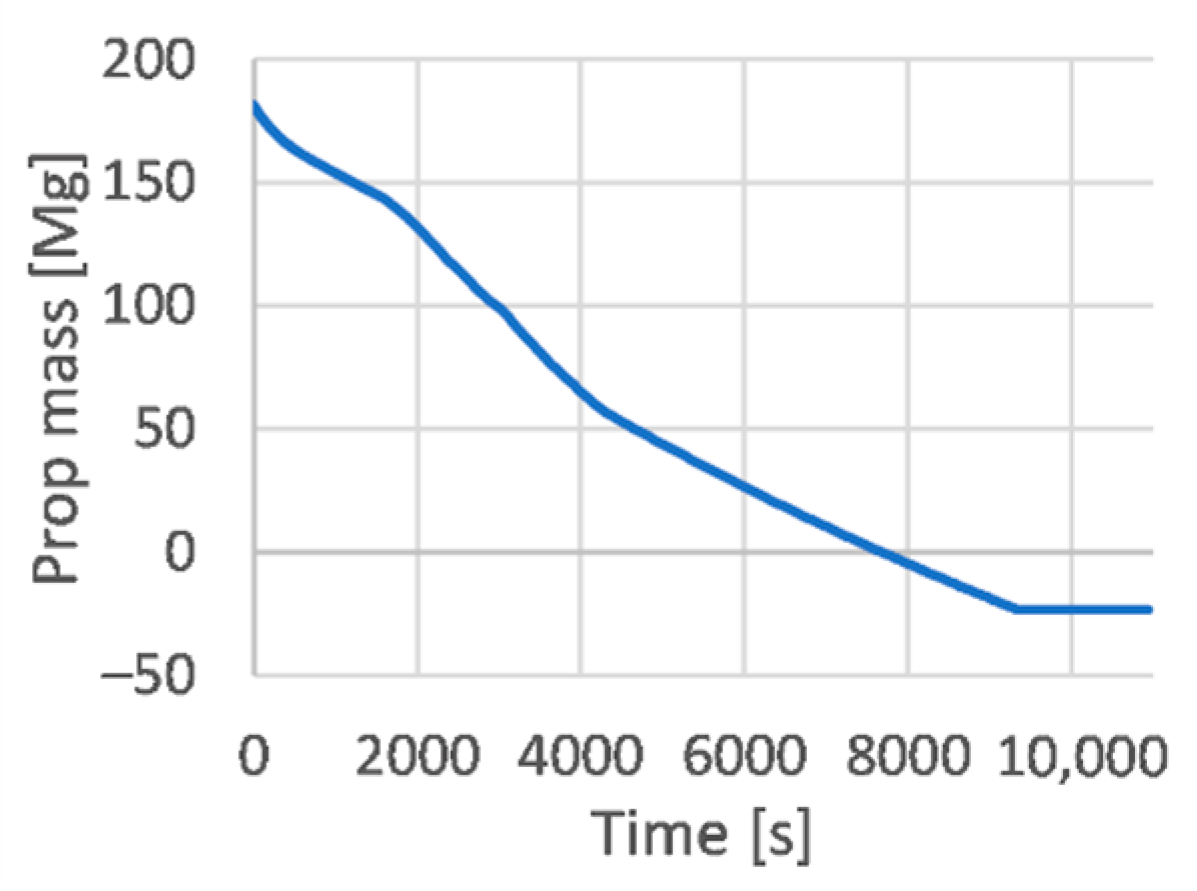
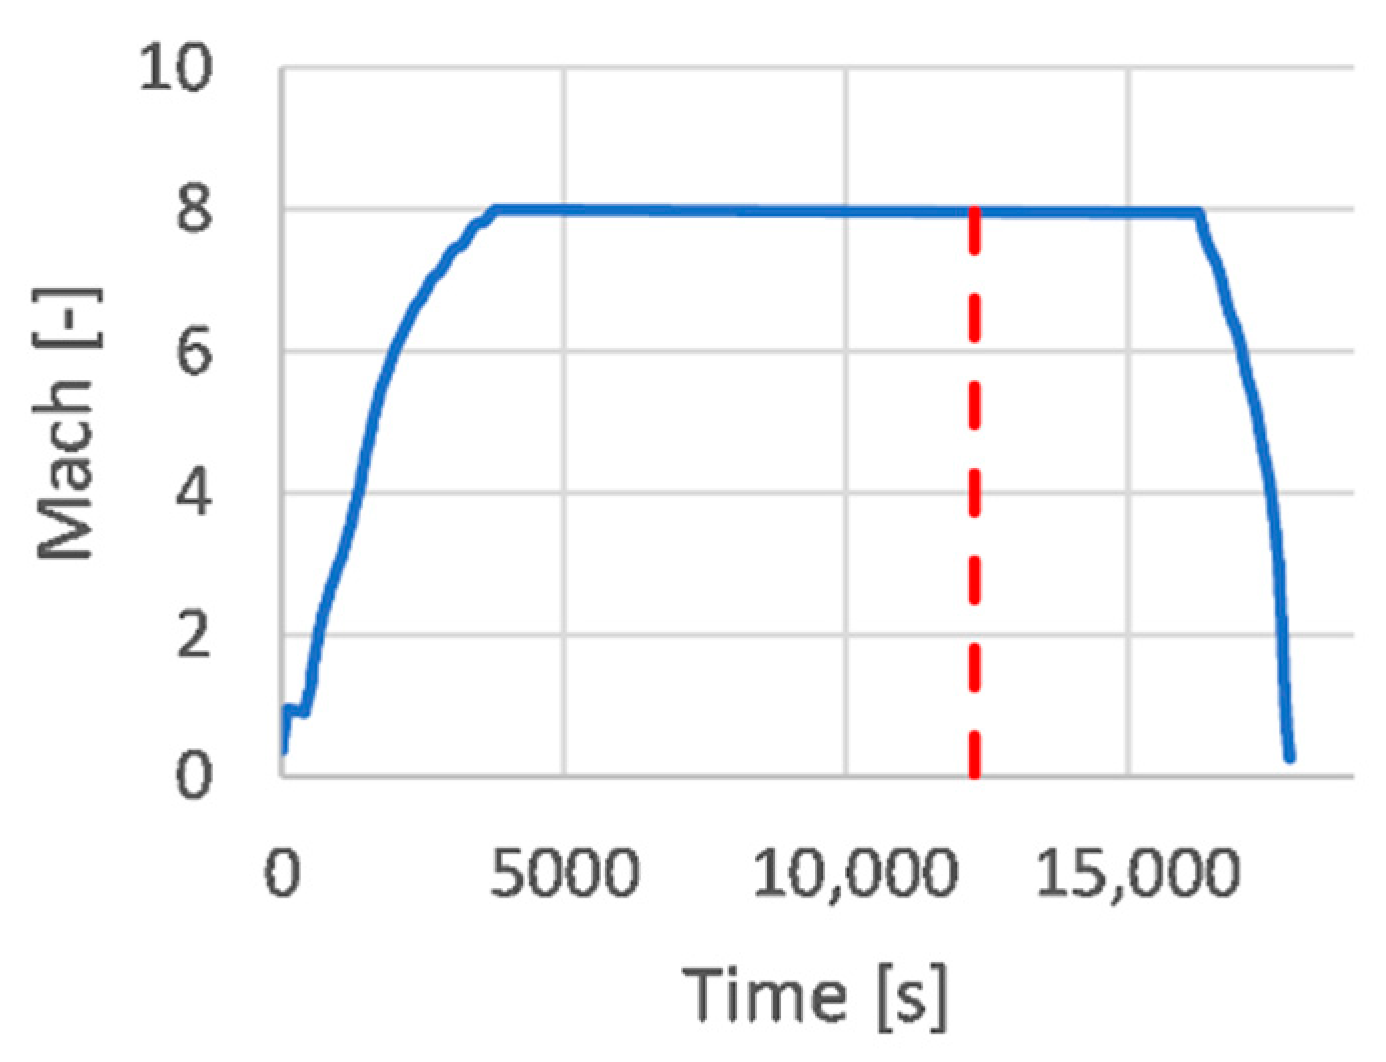
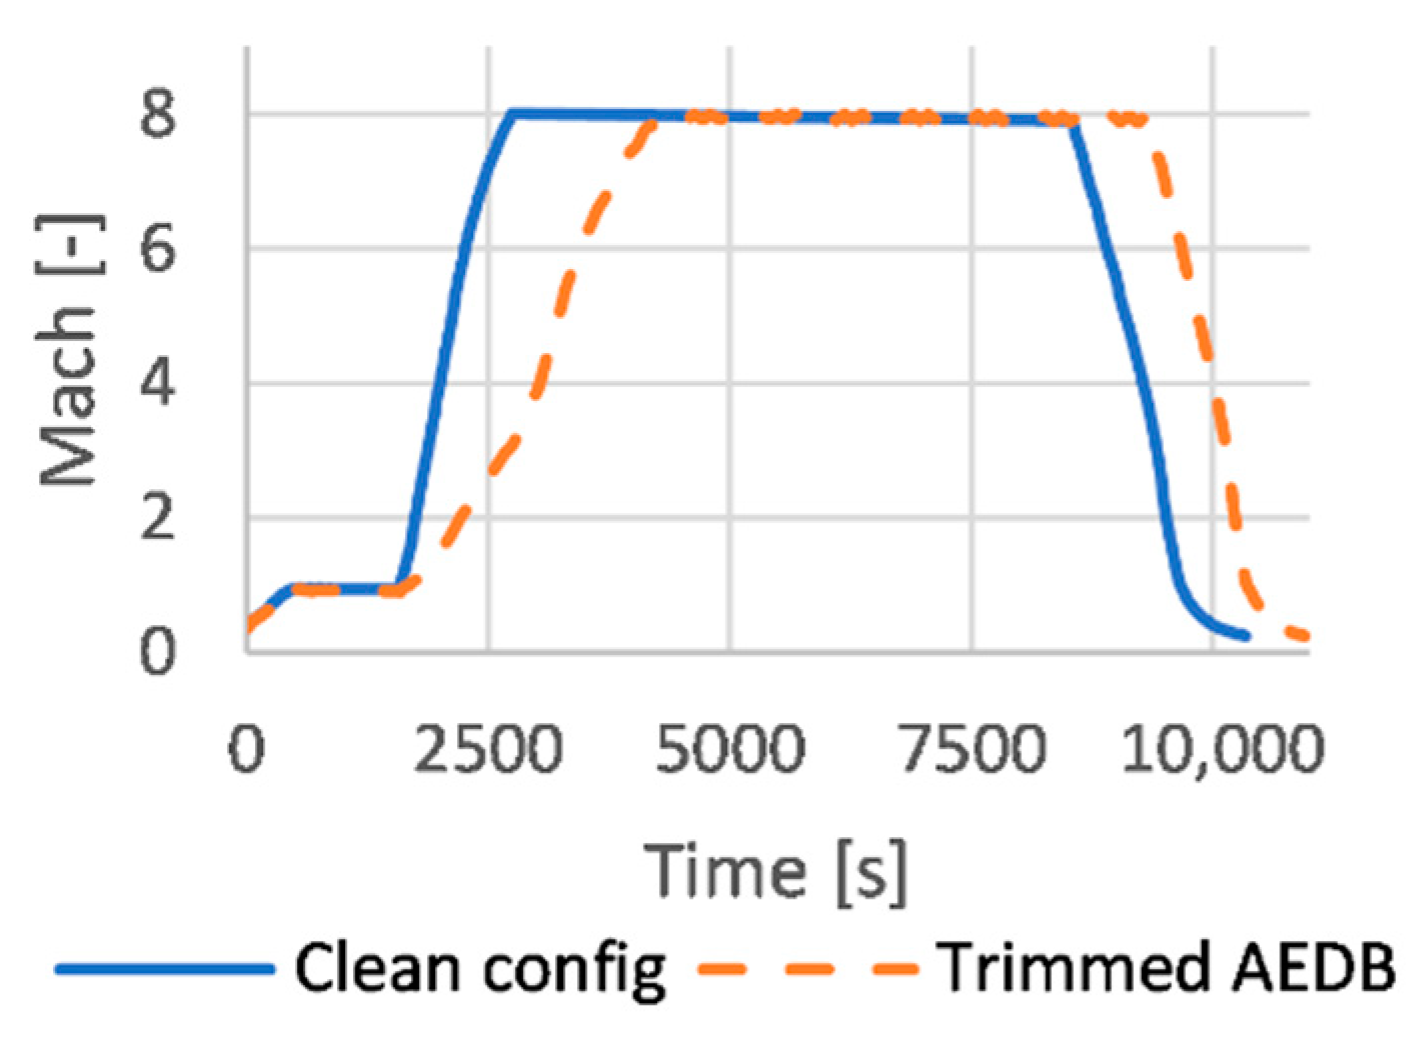
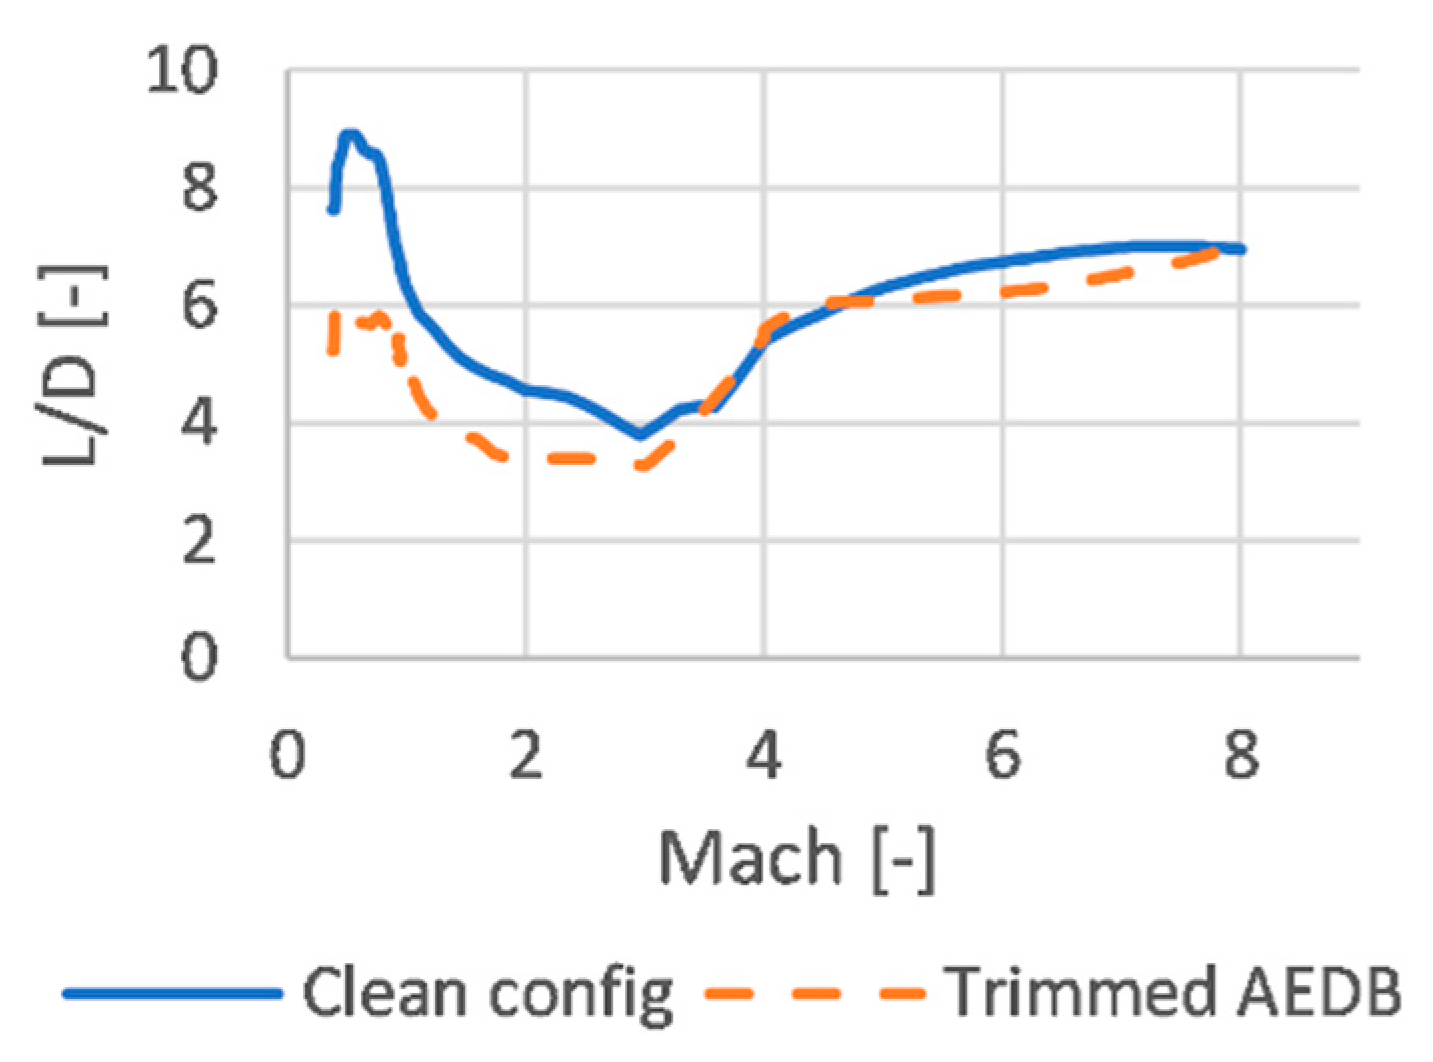
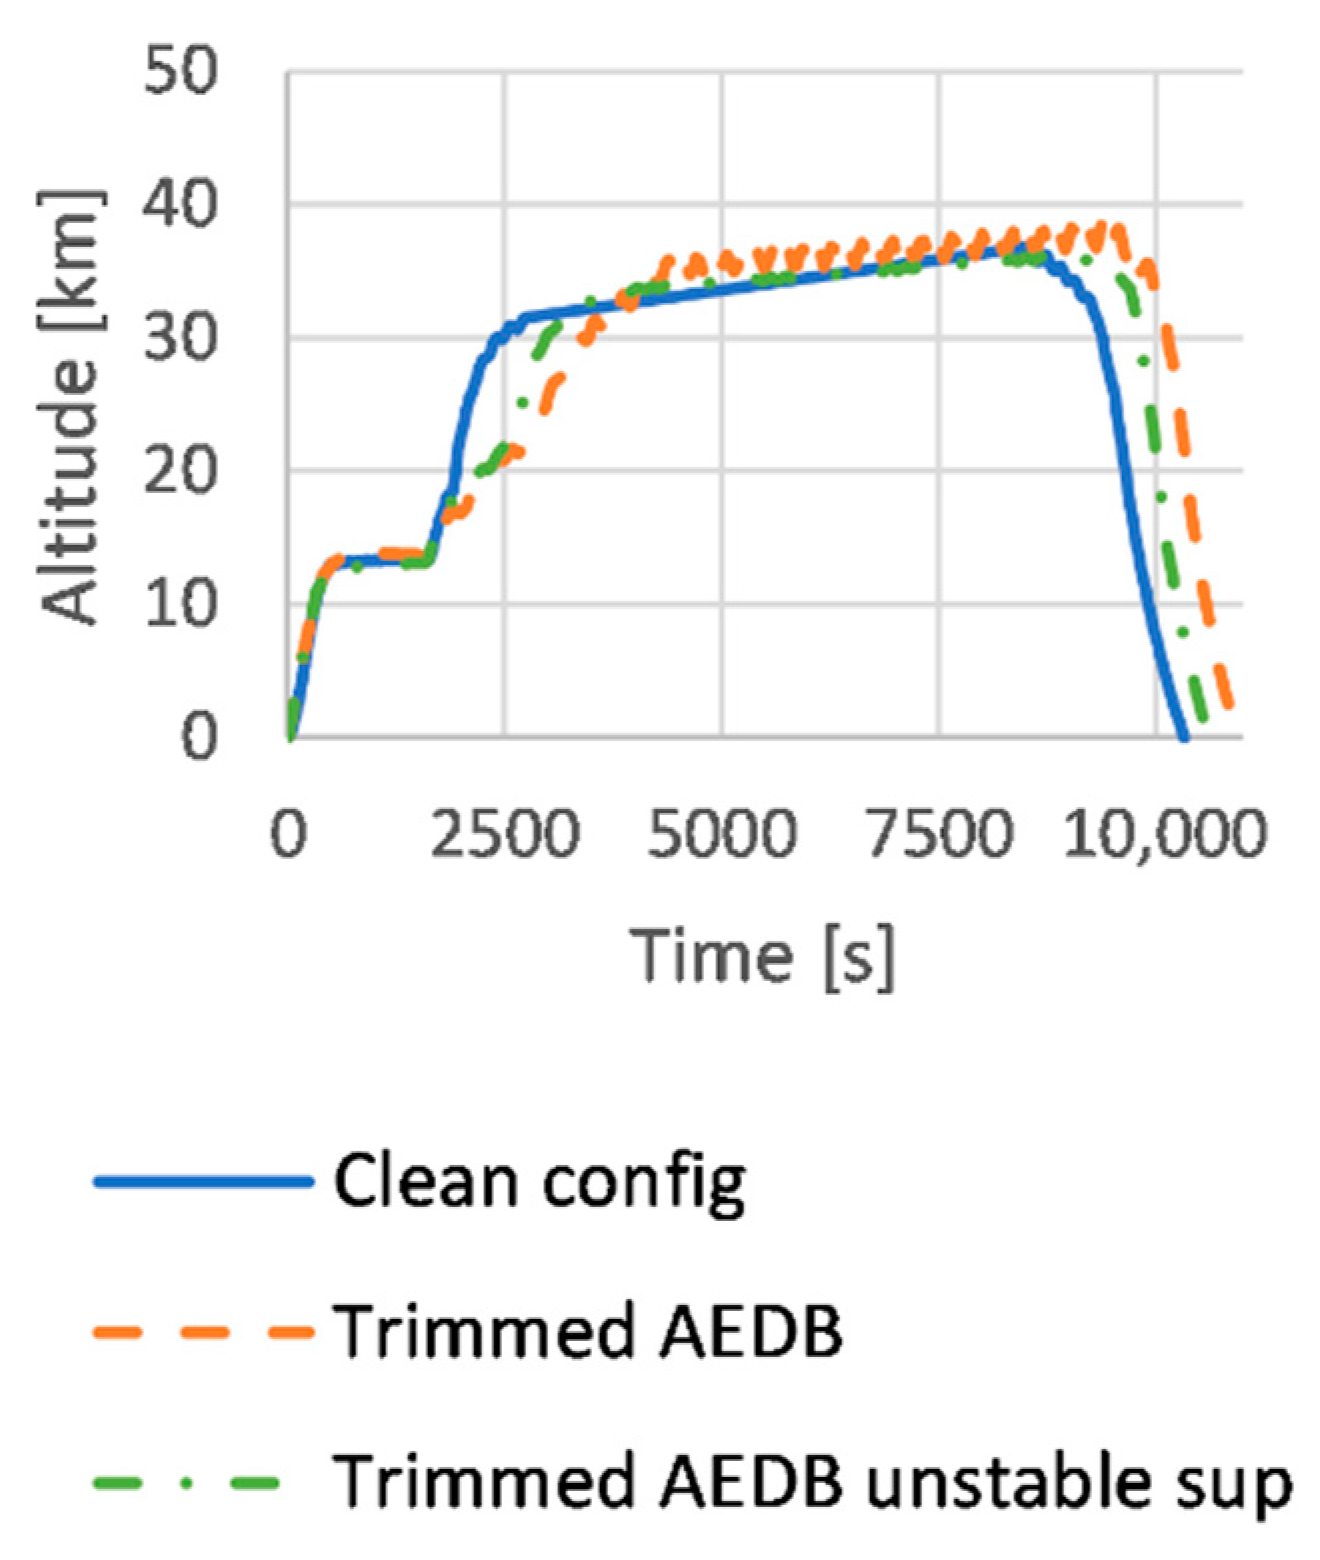
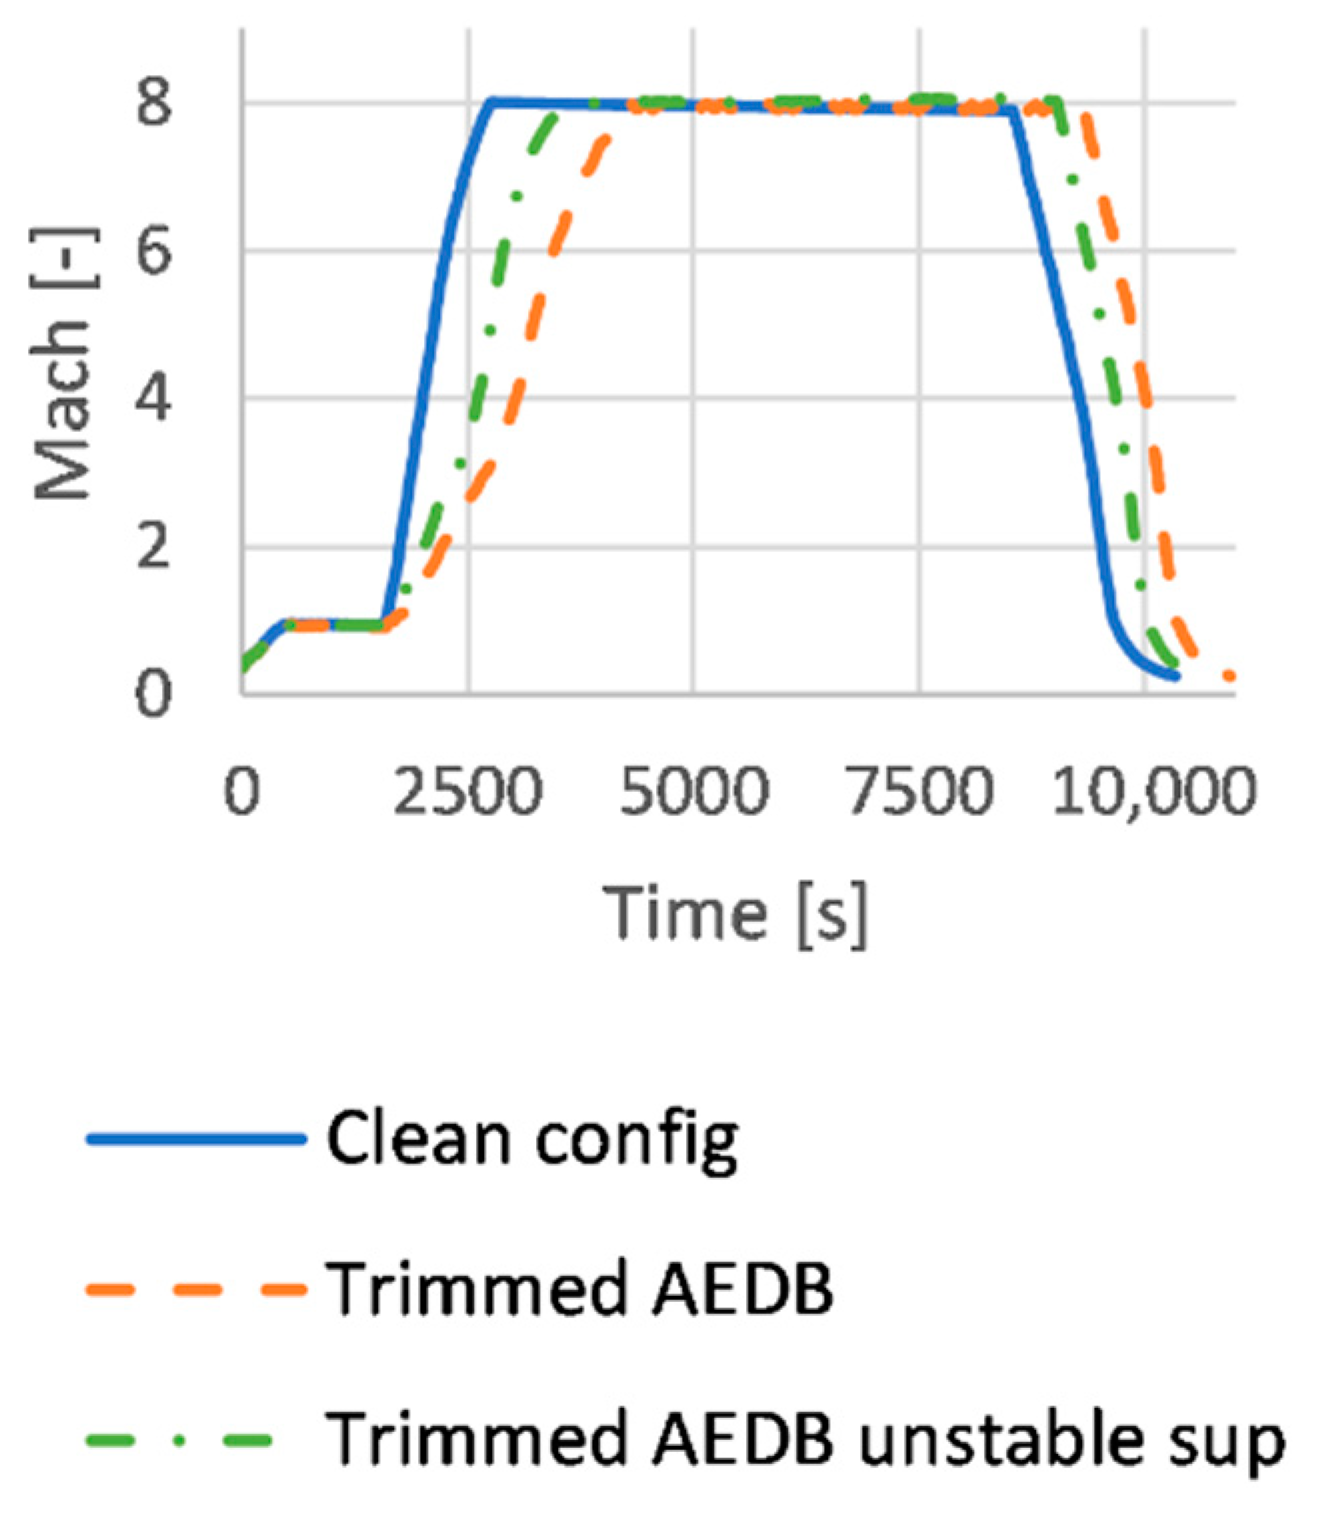
4.4. Mission Analysis with Trimmed Configuration: BRU-SYD Mission Simulation

Once the aerodynamic analysis is complete, further mission simulations can be performed, considering the complete trimmed aerodynamic database. The reference trajectory is Brussels to Sydney and the other input parameters are the same used for the clean. The new simulation shows that the fuel consumption increases considerably during the entire mission, as reported in Figure 27. As a result, the vehicle runs out of fuel at approximately 7700 s (2 h 8 m), while flying the last part of the hypersonic cruise. It is worth noting that the propulsive database has remained unchanged in the simulations with clean configuration and trimmed aerodynamic database. Figure 28 shows the Mach number variation with range (i.e., the distance flown by the aircraft during the mission), and the vertical dashed line represents the point in which all the fuel is consumed. An estimation of the maximum range achievable in these conditions can be obtained from these results which is equal to approximately 12,200 km. However, it should also be highlighted that the ASTOS simulation can be continued even if the fuel mass becomes 0, so the results from that point on are not realistic.
The time needed to perform the climb phase is increasing considerably with respect to the previous simulation (Figure 29). This increment is due to the reduced aerodynamic performances, if compared to the clean configuration, as reported in Figure 30. The trimmed aerodynamic performances are poorer compared to those of the clean configuration: the L/D ratio ranges between 5 and 6 in the subsonic regime, while it drops below 3.5 during the supersonic climb.
This highly affects the duration of the supersonic climb and limits the capability of the STRATOFLY MR3 vehicle to cover the antipodal route from Brussels to Sydney.
However, if the vehicle performance is improved, the fuel mass consumption could be reduced. A possible solution could be to relax the stability conditions in the Mach range from 0.95 to 3, where the lift-to-drag ratio reaches the lowest value. Therefore, the constraint on longitudinal static stability is removed and the trim conditions are evaluated again in this range, considering that δ C M y / δ α > 0 . The resulting L/D is reported in Figure 31, where the continuous line represents the trim conditions with static stability and the dashed line refers to the unstable case. The aerodynamic efficiency is slightly increasing in this range, even if the increase is limited to values below 0.5.
A further simulation is then run considering the unstable trim conditions from M = 0.95 to M = 3, while the same set of trim data is used for the other Mach numbers. The results are reported in Figure 32 and Figure 33 with the dash-dot line, where the altitude and Mach profiles are compared to the other cases. The time needed to perform the supersonic climb decreases to 1040 s, a mid-value with respect to the two previous cases. However, a significant difference still exists if compared to the clean configuration mission profile.
The resulting aerodynamic efficiency is reported in Figure 34. The L/D is still low at supersonic speeds, but the vehicle is now able to accelerate in a shorter time. However, the overall fuel consumption is still too high. The vehicle runs out of fuel during the hypersonic cruise after 2 h 5 m (7500 s), while flying the last part of the hypersonic cruise (Figure 35). The altitude and Mach profile vs. range are reported in Figure 36 and Figure 37, where the vertical dashed line shows the point where the fuel ends. The maximum range is equal to approximately 12,600 km.

4.5. Mission Analysis with Trimmed Configuration: BRU-NRT Mission Simulation

The results of the previous mission simulation suggest that the STRATOFLY MR3 vehicle could not be able to complete the 19,000 km range mission. For that reason, a shorter mission should also be considered. The range is decreased to about 12,000 km and the selected route is Brussels to Tokyo Narita (BRU-NRT). This route is chosen since it allows the vehicle to fly entirely over the sea at Mach greater than 1, as it also happens for the BRU-SYD mission. An overview of this trajectory is reported in Figure 38. The first part of the mission up to the Bering strait is equivalent to the previous case. From this point on, the vehicle performs a right turn heading towards Tokyo.
The resulting altitude and Mach profiles are reported in Figure 39 and Figure 40. The hypersonic cruise duration is 3100 s (52 min), a value that is shorter than the BRU-SYD case, due to the reduced range. Therefore, the altitude at the end of the cruise is limited to 35.5 km. The total mission duration is equal to 2 h 17 m (8200 s). The propellant mass of 181.25 Mg is sufficient to cover the BRU-NRT mission, and the residual propellant at the end of the mission is equal to 10.45 Mg, as can be seen in Figure 41. The L/D and AoA profiles are reported in Figure 42 and Figure 43, respectively.
The following table (Table 5) summarizes the major results of the mission simulations performed in this study. The 3rd column has been added to highlight if the mission can be properly achieved with the available fuel on board. If this is possible, the distance flown, the residual fuel and the time needed to perform the mission are reported. Conversely, the distance flown and time reported refer to the condition in which all the fuel is used.

5. Conclusions

This paper provides technical insights on the aerodynamic characterization activities coupled with detailed mission analysis simulations, performed in the field of the H2020 STRATOFLY project, for the Mach 8 waverider reference configuration. Considering the complexity of the configuration to be analyzed at conceptual/preliminary design stage, a build-up approach has been adopted, incrementally increasing the complexity of the aerodynamic model, from the clean external configuration up to the complete configuration, including propulsion system elements and flight control surfaces. The comparison of the results obtained through the different mission analysis campaigns clearly shows that the accuracy of aerodynamic characterization may determine the feasibility or unfeasibility of the mission concept. It is worth noting that in all the simulations presented in the previous section, the descent was performed in engine-off conditions. However, due to the poor aerodynamic performance during this phase, the rate of descent could become too high. During the final part of the mission, the aerodynamic efficiency drops to values ranging between 2.5 and 5, causing the vehicle to quickly loose altitude. Therefore, the authors are currently working to remove the constraints on the unpowered descent, understanding the benefits of a sustained descent phase.

Author Contributions

Conceptualization, N.V. and R.F.; methodology, N.V., R.F., P.R. and O.G.; software, P.R. and O.G.; validation, R.F. and N.V.; formal analysis, P.R. and O.G.; writing—original draft preparation, O.G. and P.R.; writing—review and editing, R.F. and N.V.; visualization, R.F.; supervision, N.V.; project administration, N.V. All authors have read and agreed to the published version of the manuscript.

Funding

This research was funded by European Union’s Horizon 2020 research and innovation programme under grant agreement No 769246—Stratospheric Flying Opportunities for High-Speed Propulsion Concepts (STRATOFLY) Project.

Institutional Review Board Statement

Not Applicable.

Informed Consent Statement

Not Applicable.

Conflicts of Interest

The authors declare no conflict of interest.

References

  1. Steelant, J.; Varvill, R.; Walton, C.; Defoort, S.; Hannemann, K.; Marini, M. Achievements obtained for sustained hypersonic flight within the LAPCAT-II project. In Proceedings of the 20th AIAA International Space Planes and Hypersonic Systems and Technologies Conference, Glasgow, Scotland, 6–9 July 2015; p. 3677. [Google Scholar] [CrossRef]
  2. Viola, N.; Fusaro, R.; Gori, O.; Marini, M.; Roncioni, P.; Saccone, G.; Saracoglu, B.; Ispir, A.C.; Fureby, C.; Nilson, T.; et al. STRATOFLY MR3–how to reduce the environmental impact of high-speed transportation. In Proceedings of the AIAA Scitech 2021 Forum, Online, 11 January 2021; p. 1877. [Google Scholar] [CrossRef]
  3. Ferretto, D.; Fusaro, R.; Viola, N. Innovative Multiple Matching Charts approach to support the conceptual design of hypersonic vehicles. Proc. Inst. Mech. Eng. Part G J. Aerosp. Eng. 2020, 234, 1893–1912. [Google Scholar] [CrossRef]
  4. Ferretto, D.; Fusaro, R.; Viola, N. A conceptual design tool to support high-speed vehicle design. In Proceedings of the AIAA AVIATION 2020 FORUM, Virtual Event, Online, 15–19 June 2020; p. 2647. [Google Scholar] [CrossRef]
  5. Langener, T.; Erb, S.; Steelant, J. Trajectory Simulation and Optimization of the LAPCAT MR2 Hypersonic Cruiser Concept. In Proceedings of the 29th Congress of the International Council of the Aeronautical Sciences, St. Petersburg, Russia, 7–12 September 2014. [Google Scholar]
  6. Pamadi, B.N.; Brauckmann, G.J.; Ruth, M.J.; Fuhrmann, H.D. Aerodynamic Characteristics, Database Development and Flight Simulation of the X-34 Vehicle. In Proceedings of the 38th Aerospace Sciences Meeting & Exhibit, Reno, NV, USA, 10–13 January 2000. [Google Scholar] [CrossRef] [Green Version]
  7. Roncioni, P.; Rufolo, G.C.; Votta, R.; Marini, M. An Extrapolation-To-Flight Methodology for Wind Tunnel Measurements Applied to the Prora-USV FTB1 Vehicle. In Proceedings of the 57th International Astronautical Congress, Valencia, Spain, 2–6 October 2006. [Google Scholar] [CrossRef]
  8. Rufolo, G.C.; Roncioni, P.; Marini, M.; Votta, R.; Palazzo, S. Experimental and Numerical Aerodynamic Data Integration and Aerodatabase Development for the PRORA-USV-FTB_1 Reusable Vehicle. In Proceedings of the 14th AIAA/AHI Space Planes and Hypersonic Systems and Technologies Conference, Canberra, Australia, 6–9 November 2006. [Google Scholar] [CrossRef]
  9. Bonelli, F.; Cutrone, L.; Votta, R.; Viggiano, A.; Magi, V. Preliminary design of a hypersonic air-breathing vehicle. In Proceedings of the 17th AIAA International Space Planes and Hypersonic Systems and Technologies Conference, AIAA 2011-2319, San Francisco, CA, USA, 11–14 April 2011. [Google Scholar] [CrossRef]
  10. Schlichting, H. Boundary Layer Theory; McGRAW-HILL: New York, NY, USA, 1979. [Google Scholar]
  11. Raymer, D. Aircraft Design: A Conceptual Approach, 5th ed.; AIAA: Reston, VA, USA, 2012. [Google Scholar]
  12. Deng, A. Aerodynamic Performance Prediction of SpaceShipTwo. December 2012. Available online: https://www.researchgate.net/publication/289538639_Aerodynamic_Performance_Prediction_of_SpaceShipTwo (accessed on 15 June 2021).
  13. Fluent Theory Guide; Release 19.2; ANSYS, Inc.: Canonsburg, PA, USA, 2018.
Figure 1. Incremental approach to Aerodynamic Characterization and Mission Analysis investigations.
Energies 14 03580 g001
Figure 2. (a) STRATOFLY MR3 Vehicle and (b) Idealized Mission Concept.
Energies 14 03580 g002
Figure 3. Inviscid Grid. Half body and symmetry plane. Cells = 1 M.
Energies 14 03580 g003
Figure 4. Lift (a) and Drag (b) coefficients versus Mach at α = 0°.
Energies 14 03580 g004
Figure 5. Pitching Moment (a) and Centre of Pressure (b) versus Mach at α = 0°.
Energies 14 03580 g005
Figure 6. Tuning of engineering formula for the ( Δ C D ) v i s c e x t .
Energies 14 03580 g006
Figure 7. Internal friction coefficient versus Mach.
Energies 14 03580 g007
Figure 8. Drag (a) and Lift (b) coefficients versus Mach at α = 0°. Comparison between full part and external part.
Energies 14 03580 g008
Figure 9. Drag coefficient (a) and Lift-to-Drag ratio (b) versus Mach at α = 0°. Comparison between full part and external part.
Energies 14 03580 g009
Figure 10. Ascent (a) and Descent (b) Mach number contour on symmetry plane at M = 4 and α = 0° far field conditions.
Energies 14 03580 g010
Figure 11. Simplified configuration of the Wing-Flap (a) and Body-Flap (b).
Energies 14 03580 g011
Figure 12. ΔCL (a) and ΔCD (b) due to the flap effect at α = 0° and flap = −20°. Compared with SIM method in supersonic regime.
Energies 14 03580 g012
Figure 13. CL (a) and CD (b) due to the canard effect at several angle of attack.
Energies 14 03580 g013
Figure 14. ΔCL (a) and ΔCD (b) due to the body-flap effect at α = 0° and several values of body-flap. Compared with SIM method in supersonic regime.
Energies 14 03580 g014
Figure 15. BRU-SYD mission trajectory.
Energies 14 03580 g015
Figure 16. Mach number vs. mission time for clean configuration.
Energies 14 03580 g016
Figure 17. Altitude vs. mission time for clean configuration.
Energies 14 03580 g017
Figure 18. Lift-to-Drag ratio vs. mission time for clean configuration.
Energies 14 03580 g018
Figure 19. Angle of attack vs. mission time for clean configuration.
Energies 14 03580 g019
Figure 20. Propellant mass vs. mission time for clean configuration.
Energies 14 03580 g020
Figure 21. CoG position at different Mach numbers.
Energies 14 03580 g021
Figure 22. A 3D trim map example.
Energies 14 03580 g022
Figure 23. A 2D trim map example.
Energies 14 03580 g023
Figure 24. CL vs. Mach comparison between clean configuration and trimmed case.
Energies 14 03580 g024
Figure 25. CD vs. Mach comparison between clean configuration and trimmed case.
Energies 14 03580 g025
Figure 26. L/D vs. Mach comparison between clean configuration and trimmed case.
Energies 14 03580 g026
Figure 27. Propellant mass vs. Time with Trimmed aerodynamic database.
Energies 14 03580 g027
Figure 28. Mach number vs. Range with Trimmed aerodynamic database.
Energies 14 03580 g028
Figure 29. Mach number vs. mission time. Comparison between clean and trimmed configuration.
Energies 14 03580 g029
Figure 30. Lift-to-Drag ratio vs. Mach. Comparison between clean and trimmed configuration.
Energies 14 03580 g030
Figure 31. Comparison of the Lift-to-Drag ratio between stable and unstable conditions in the supersonic Mach regime.
Energies 14 03580 g031
Figure 32. Altitude vs. mission time comparison for the three cases analyzed.
Energies 14 03580 g032
Figure 33. Mach number vs. mission time comparison for the three cases analyzed.
Energies 14 03580 g033
Figure 34. Lift-to-Drag ratio vs. mission time for trimmed AEDB with unstable conditions at supersonic Mach numbers.
Energies 14 03580 g034
Figure 35. Propellant mass vs. mission time for trimmed AEDB with unstable conditions at supersonic Mach numbers.
Energies 14 03580 g035
Figure 36. Altitude vs. Range for trimmed AEDB with unstable conditions at supersonic Mach numbers.
Energies 14 03580 g036
Figure 37. Mach number vs. Range for trimmed AEDB with unstable conditions at supersonic Mach numbers.
Energies 14 03580 g037
Figure 38. BRU-NRT mission trajectory.
Energies 14 03580 g038
Figure 39. Altitude vs. mission time for trimmed AEDB with unstable conditions at supersonic Mach numbers. BRU-NRT mission.
Energies 14 03580 g039
Figure 40. Mach number vs. mission time for trimmed AEDB with unstable conditions at supersonic Mach numbers.BRU-NRT mission.
Energies 14 03580 g040
Figure 41. Propellant mass vs. mission time for trimmed AEDB with unstable conditions at supersonic Mach numbers. BRU-NRT mission.
Energies 14 03580 g041
Figure 42. Lift-to-Drag ratio vs. mission time for trimmed AEDB with unstable conditions at supersonic Mach numbers. BRU-NRT mission.
Energies 14 03580 g042
Figure 43. Angle of attack vs. mission time for trimmed AEDB with unstable conditions at supersonic Mach numbers. BRU-NRT mission.
Energies 14 03580 g043
Table 1. STRATOFLY MR3 vehicle dimensions.
ParameterValueUnit of Measure
Length94 m
Wingspan41 m
Wing surface1365 m 2
Aspect ratio~1-
Table 2. Initial condition for mission simulation.
Initial ConditionValue
Latitude50.9°
Longitude4.49°
Altitude0 m
Velocity128 m/s
Heading−15°
Table 3. Aerodynamic coefficients.
CoefficientClean ConfigViscous CorrectionCanardsFlapsBodyflapThrust Correction
CLx xxx
CDxxxxx
CMyx xxxx
Table 4. Excerpt of the trimmed aerodynamic database.
Mach (-)Alpha (°)CL (-)CD (-)L/D (-)δflap (°)δcanard (°)δbodyflap (°)CoG (m)
0.5−20.1180.0215.494.1511−2653
0.500.1600.0285.754.97−2953
0.520.2200.0415.336.5510−3053
0.95−20.1210.0254.83−6.616−151.5
0.9500.1670.0315.43−6.213−751.5
0.9520.2150.0415.29−7.612−551.5
3−20.0360.0172.142.9520−2050.5
300.0590.0163.77−7.9513−2350.5
320.1030.0234.58−18.116−450.5
8−20.0200.0045.37−11.1512−248
800.0420.0067.05−7.5513−348
820.0640.0106.63−10.413−548
Table 5. Overview of trajectory simulations results.
RouteAerodynamic
Configuration
Mission
Completed?
Distance flown (km)Residual fuel (Mg)Time
(hr:min)
Brussels to
Sydney
CleanYes18,2001.002 h 52 m
Trimmed and
stable
No12,2000.002 h 8 m
Trimmed and
unstable
No12,6000.002 h 5 m
Brussels to
Tokyo
Trimmed and
unstable
Yes12,24510.452 h 17 m
Publisher’s Note: MDPI stays neutral with regard to jurisdictional claims in published maps and institutional affiliations.

