Article

Baselines for Energy Use and Carbon Emission Intensities in Hellenic Nonresidential Buildings

by
Kalliopi G. Droutsa
1,2,*,
Constantinos A. Balaras
1,
Spyridon Lykoudis
3,
Simon Kontoyiannidis
1,
Elena G. Dascalaki
1 and
Athanassios A. Argiriou
2
1
Group Energy Conservation, Institute for Environmental Research & Sustainable Development, National Observatory of Athens, 118 10 Athens, Greece
2
Laboratory of Atmospheric Physics, Department of Physics, School of Science, University of Patras, 265 04 Patras, Greece
3
Enargia WG, Akrita 66, 24132 Kalamata, Greece
*
Author to whom correspondence should be addressed.
Energies 2020, 13(8), 2100; https://doi.org/10.3390/en13082100
Submission received: 27 February 2020 / Revised: 7 April 2020 / Accepted: 16 April 2020 / Published: 23 April 2020
(This article belongs to the Special Issue Building Energy Audits-Diagnosis and Retrofitting)

Abstract

:
This work exploits data from 30,000 energy performance certificates of whole nonresidential (NR) buildings in Greece. The available information is analyzed for 30 different NR building uses (e.g., hotels, schools, sports facilities, hospitals, retails, offices) and four main services (space heating, space cooling, domestic hot water and lighting). Data are screened in order to exclude outliers and checked for consistency with the Hellenic NR building stock. The average energy use and CO2 emission intensities for all building uses are calculated, as well as the respective energy ratings in order to gain a better understanding of the NR sector. Finally, in an attempt to determine whether these values are representative for the various Hellenic NR building uses, their temporal evolution is investigated. The average primary energy use intensity is 448.0 kWh/m2 for all NR buildings, while the CO2 emissions reach 147.5 kgCO2/m2. The derived energy baselines reveal that indoor sports halls/swimming pools have the highest energy use, while private cram schools/conservatories have the lowest, due to their operational patterns. Generally, from the four services taken into account, lighting is the most energy consuming, followed by cooling, heating and finally domestic hot water. For a total of 11 building uses, more data from the certificates will be necessary for deriving representative baselines, but, when it comes to buildings categories, more data are required.

1. Introduction

Built environment is a key target in European (EU) policies in order to achieve a sustainable and competitive low-carbon economy. EU buildings account for nearly 40% of energy consumption and 36% of CO2 emissions [1], despite covering only 3.35% of the total land area [2]. About 35% of the building stock is old (over 50 years) and energy inefficient, while the annual renovation rate ranges between 0.4% and 1.2% depending on the country. Therefore, increased renovation of existing buildings may lead to significant savings both in total energy consumption and CO2 emissions by about 5% [1].
Nonresidential (NR) buildings, accounting for about a quarter of the total EU building stock, comprise a very heterogeneous sector with various building types, different building sizes and energy characteristics. Limited information is available on construction characteristics, installed systems for different services and energy use for the entire NR sector as well as for the various types and branches of activity.
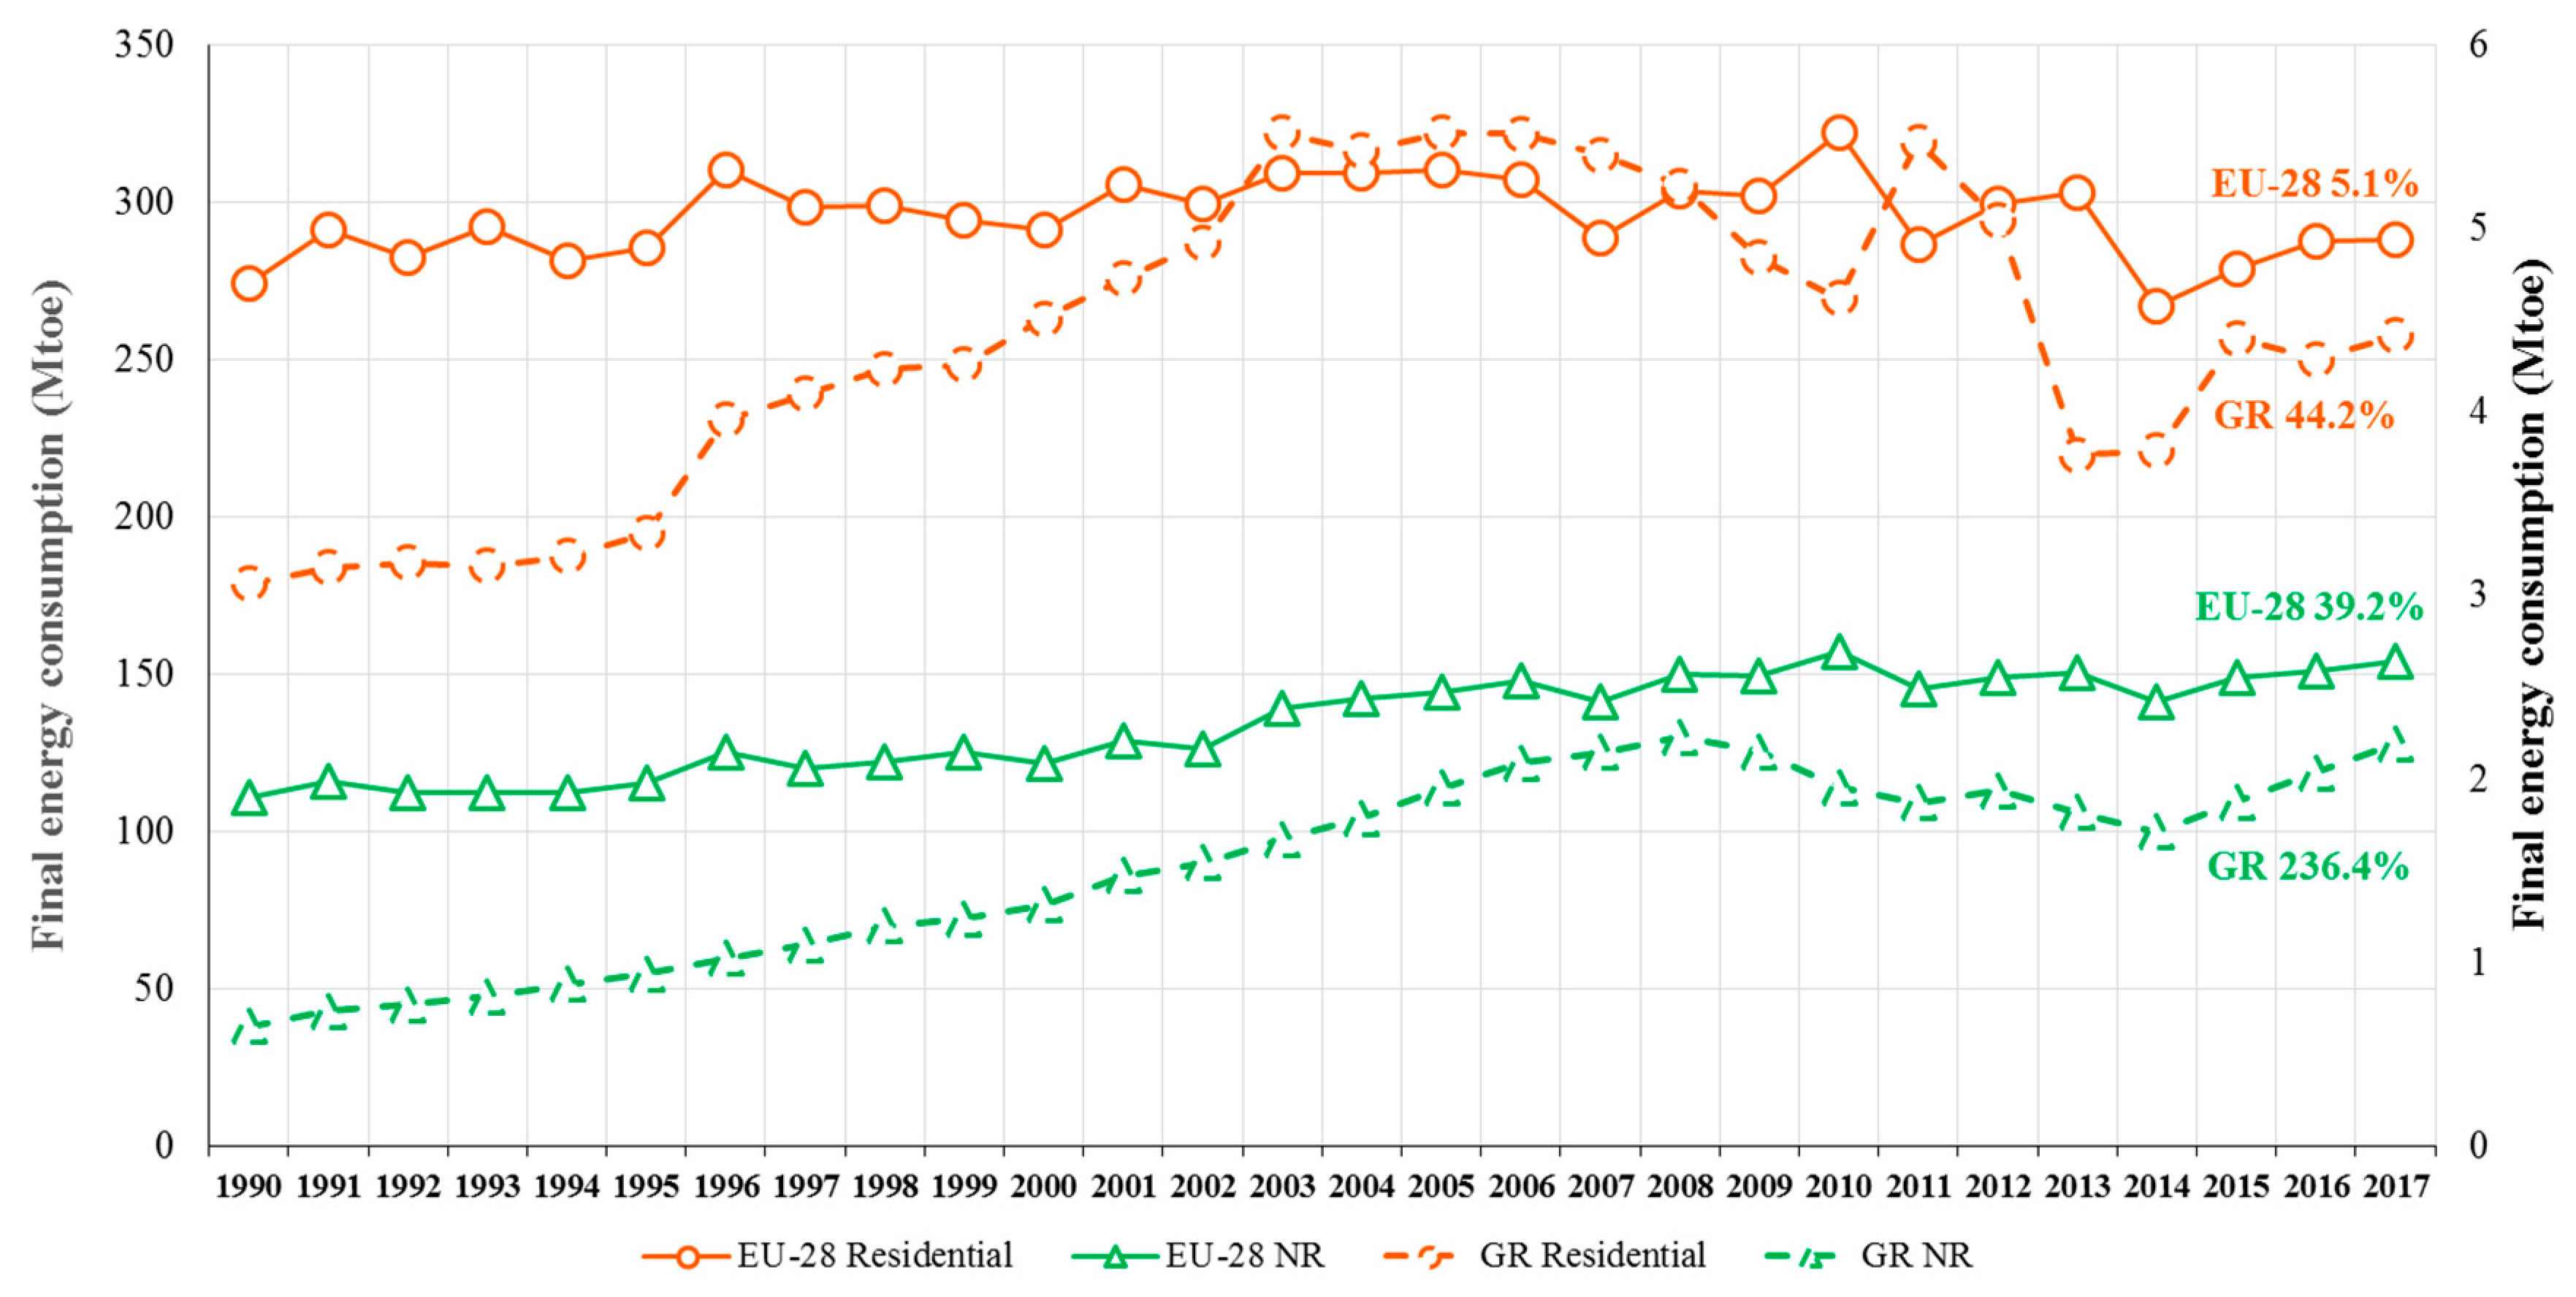
Over the past decades, the total final energy consumption in the EU Member States (EU-28) has remained practically stable, rising only from 1033.4 million tonnes of oil equivalent (Mtoe) in 1990 to 1060.0 Mtoe in 2017 [3]. However, the final energy consumption in NR buildings has boomed by 39.2%, from 110.7 Mtoe in 1990 to 154.0 Mtoe in 2017, keeping a relative stable share ranging from 11% to 15% of the total. The highest share in NR building’s sector final energy consumption is electricity with 50.14%, followed by gas with 30.12% [4]. For 2050, the projection is that the NR buildings’ sector will account for about 17% of the total final energy use [5].

1.1. Hellenic Nonresidential Buildings

Based on the most recent building census, the Hellenic Nonresidential Building Stock (NR BS) includes about 690,000 exclusive-use buildings (excluding churches, monasteries, industrial buildings and parking stations), representing 21% of the national building stock, with the majority being wholesale/retail trade and offices [6]. The estimated total floor area is about 73.52 Mm2, with the majority being hotels and restaurants [3], while the total final energy in 2017 reached 16.05 Mtoe increased by 15.6% compared to 1990. NR buildings consumed 2.19 Mtoe in 2017, showing an increase by 236.4% since 1990 (Figure 1). Although until 2008 the NR sector’s final consumption was steadily increasing by an average of 7% per year, it was one of the first sectors that was affected by the economic recession. This is reflected by the decrease of final energy consumption since 2009, with the exception of 2012, where a slight increase occurred due to an increase of electricity consumption. From 2015, there was again a clear upward trend. Detailed information for the different NR building types is limited to only to a few studies [7,8].
To boost energy performance of buildings, the EU has established an ambitious legislative framework that includes the Directive on Energy Efficiency (EED) recently revised by the Directive (EU) 2018/2002 amending Directive 2012/27/EU on energy efficiency, setting an EU target for energy consumption at less than 1273 Mtoe of primary energy and/or 956 Mtoe of final energy [9]. Another main instrument for addressing these challenges is the Energy Performance of Buildings Directive (EPBD) recently amended by the Directive 2018/844, promoting cost-effective building renovations, with the vision of a decarbonized building stock by 2050 [10]. Both directives are part of the new energy rulebook Clean Energy for All Europeans [11], according to which each Member State should draft an integrated 10-year national energy and climate plan (NECPs) for the time period 2021 to 2030.
Building energy certification plays a central role in the enhancement of the energy performance of buildings. The energy performance certificate (EPC) is a core instrument of the EPBD for existing and new buildings. The general idea behind the EPC is to influence the building market, by providing information on a building’s energy use and typical energy costs and by making recommendations for cost-effective improvements [12]. Available information included in the EPCs should also be of great value for decision makers and energy planners at regional and national scales.

1.2. Literature Overview

While national statistical agencies provide detailed information on the residential building stock, there is a general lack of data on nonresidential buildings. Only a small number of studies have attempted to fill this gap by providing estimates on the total final and specific energy use. In most cases, these studies have focused on particular building services like offices, schools, health care or hotels. Some field work provide actual operational energy data from energy audits using utility bills or monitoring data, while others are theoretical or parametric investigations using building simulations. The challenge though remains when considering the diversities and complexities of large pool of buildings and building stocks.
As the EPC databases are progressively enriched with more data, studies have emerged in different countries that exploit this information to map the characteristics of different categories of buildings and gain a better insight on their energy performance. The majority of them focus on residential buildings. This is to be expected since most EPCs throughout Europe have been issued for dwellings or houses that are commonly rented or sold, and residential buildings constitute the majority of the existing building stock.
For example, in Italy, studies have been carried out by analyzing approximately 90,000 energy certificates of flats in order to establish a method for estimating primary energy for space heating and the main building characteristics (e.g., envelope U-values) that influence their energy performance [13]. According to another study in Italy, exploiting about 17,600 energy certificates for residential buildings, average primary energy for the representative old buildings (up to 1992), ranges between 392–178 kWh/m2 for existing buildings, 321–158 kWh/m2 for partially renovated buildings and 113–53 kWh/m2 after major renovations [14]. In Spain, almost 130,000 energy performance certificates for existing residential buildings were examined [15]. Most were rated at a low energy class E (53.6%). On average, single-family houses use 248.0 kWh/m2, which is higher than individual dwellings that average 183.2 kWh/m2. In Switzerland, the thermal performance of the residential building stock was analyzed using about 10,400 cantonal EPCs. The results revealed that about 75% of the buildings’ envelope are below new buildings’ standards and about 50% of the surface area is still heated by inefficient oil-fired boilers, confirming the high potential for significant energy savings from thermal renovations of the Swiss residential building stock [16]. Finally, an initial study in Greece [17] analyzing early EPC data, concluded that the average primary energy use for residential buildings is 260 kWh/m2, with thermal energy accounting for 72%. MFH have a lower energy consumption averaging 241 kWh/m2 compared to 367 kWh/m2 for SFH.
As the number of issued EPCs grows with time, so does the available number of certificates that have been issued for NR buildings. As a result, studies have progressively been performed exploiting this valuable resource of information. For example, an overview of the NR sector in different countries focusing on building characteristics, energy performance, efficiency measures and energy savings is presented in [18]. A more detailed focus is given to office buildings, which represent the most common building category in the database. The average consumption of existing offices before renovation is 203 kWh/m2, while for new office buildings it is considerably lower at 122.9 kWh/m2.
In Catalonia, Spain, researchers exploiting data from about 14,000 certificates found that offices have an average annual energy use of 207.4 kWh/m2. Their energy ranking is mostly labeled in classes-C and –D (64%), while high energy ratings at the top ranked energy class A and –B are limited to ~8% of the database [19]. NR buildings in Spain, were found to have slightly better energy performance than residential buildings, with an average energy consumption of 317.8 kWh/m2 [15].
In Sweden, the current energy consumption baseline for NR buildings is defined by exploiting data from about 186,000 EPCs issued for some common commercial building types [20]. Accordingly, the average energy use is 175 kWh/m2 for hotels and restaurants, 151 kWh/m2 for rental premises-offices, 169.2 kWh/m2 for healthcare facilities, 171.8 kWh/m2 for schools and 174 kWh/m2 for sports facilities [20]. In another study, energy use in the public sector office stock in England and Wales is explored using a database of 2,600 certificates. The electrical and fossil-thermal energy use profiles for different office types range between 68–211 kWh/m2 and 132–53 kWh/m2 respectively [21]. The energy use in English schools was derived using data from 8500 EPCs of primary or secondary schools [22]. Electrical energy use ranged between 44–50 kWh/m2, and thermal energy use between 138–140 kWh/m2 [22]. Finally, from an earlier study of a limited number of certificates for NR buildings in Greece, the average primary energy use averaged 459 kWh/m2, ranging from 211 kWh/m2 for schools to 1023 kWh/m2 for hospitals [17].
This work exploits for the first time the most comprehensive data included in the national EPC electronic repository (buildingcert) over a nine-year period (i.e., from January 2011 to the end of 2019). The main novelty and objective of the present work is to present a well-structured, modular methodology for the exploitation of data included in EPC databases, in order to fill the gap of knowledge on the performance of the existing NR building stock. The proposed methodology provides a complete approach, starting with the data quality control, the data clustering into building uses and building categories, and the definition of practical baselines on the energy use and CO2 emissions for different clusters. The work demonstrates the application using the national EPC database in Greece and further investigates whether the derived baselines can be regarded as typical for the Hellenic building stock. The paper is structured as follows: Section 2 provides an overview of the national EPC database. Section 3 presents the method used in the analysis for deriving the baselines and for assessing the time evolution of the indicators. Section 4 applies the overall approach to the national EPC database and presents the results of the analysis. Finally, Section 5 discusses the main findings, outlines the limitations of the work and concludes by summarizing the main findings.

2. National EPC Database

The national regulation on the energy performance of buildings, KENAK, which was the EPBD transposition in Greece, was implemented in 2010 and updated in July 2017, imposing stricter building requirements. The regulation is supported by four Technical Guidelines that govern its practical implementation, first published in 2010 and revised in 2012 and in 2017. The normative calculations for estimating the building’s energy demand are in accordance to the European standards (e.g., EN 13790) using the quasi-steady-state monthly method and are included in the official national calculation engine (TEE-KENAK) [23]. The national tool was initially developed in 2010 and was periodically updated to comply with the evolution of the national Technical Guidelines.
Based on the Technical Guidelines, the end uses taken into account for the assessment of the building’s energy performance are heating, cooling, domestic hot water (DHW) and lighting. Mechanical ventilation is included in heating and cooling accordingly. Other office and miscellaneous plug loads (e.g., electronic or computing equipment) and process loads (e.g., elevators, escalators) are not considered.
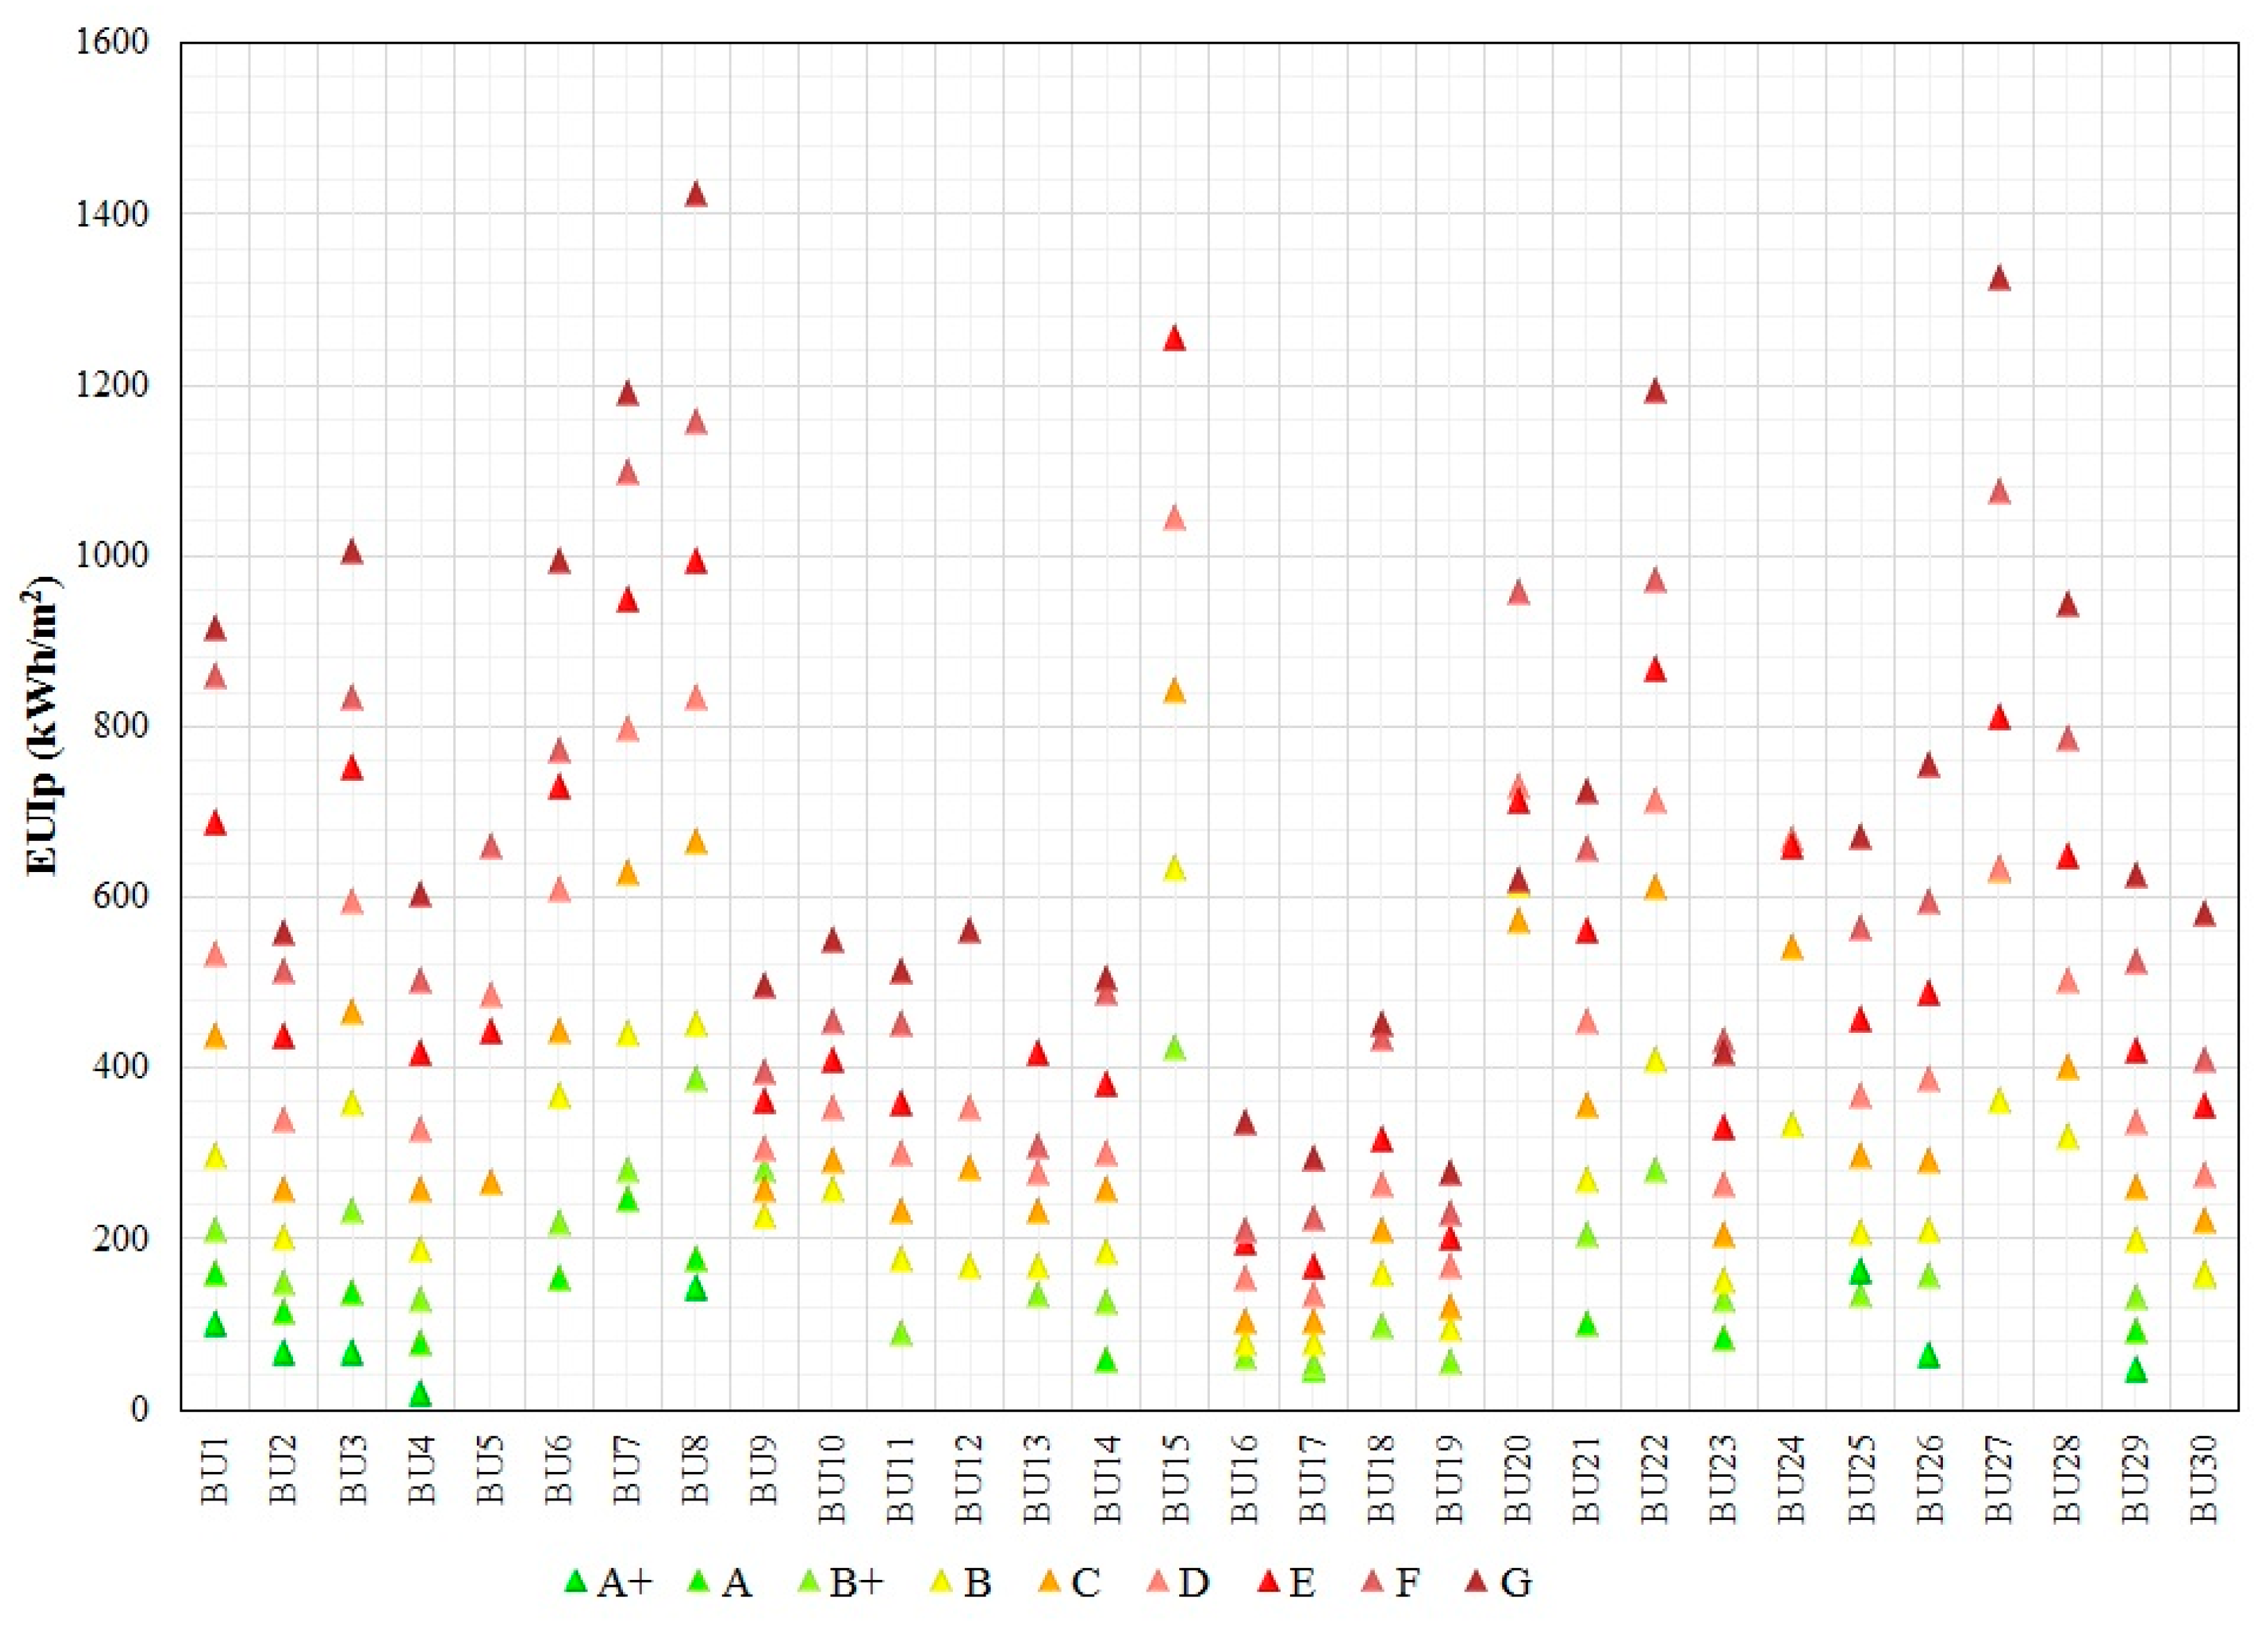
According to the Hellenic labelling scheme, the energy rating of a building is based on the ratio of its calculated primary energy use to that of the corresponding reference building. As a result there are nine energy classes ranging from class G (lowest performance) up to class A+ (highest performance). The reference building is an exact copy of the audited building, complying with the minimum requirements for specific envelope and systems characteristics defined in the national regulation, e.g., U-values, system efficiencies etc. The reference building is ranked by definition at energy class B. A building can be characterized as a nearly zero-energy building (nZEB) when it is ranked at least at energy class A for new constructions, and at energy class B+ for renovated buildings [24].
Based on the national Technical Guidelines, Greece is divided in four climate zones. The coverage was determined on the basis of the heating degree days (HDD), i.e., zone A in the south with mild conditions (averaging 859 HDD), to zone D in the north with the coldest conditions (averaging 2260 HDD).
In addition, the Technical Guidelines define a total of 60 different building types for the NR building sector, grouped into seven building categories (BC I-VII). In this work, the building types are further grouped into 30 building uses (BU 1-30) identified in Table 1, based on the criterion that each group includes similar building types sharing the same common assumptions and default values (i.e., building types hospital and clinic are grouped in one building use BU20—hospital/clinic). For example, BU20 refers to hospital/clinic with continuous annual operation (i.e., 24 hr/day, 7 days/week, 12 months/year); operative temperature at 22 °C for heating and 26 °C for cooling and operative relative humidity at 35% and 50%, respectively; fresh air requirements at 10.5 m3/hr/m2 heated floor area; DHW consumption, depending on the bed capacity, at 22.00–43.90 m3/bed; annual artificial lighting hours at 7571 hr, internal heat gains from occupants at 27 W/m2 heated floor area and from appliances at 7.5 W/m2 heated floor area (internal heat gains from lighting are calculated based on the installed power) [25]. Note that, for some building uses (e.g., BU17—primary/secondary school), the DHW is considered negligible and is not taken into account in the calculations.
As of January 2011, issuing an EPC is compulsory for all buildings that are being sold and for whole buildings that are being rented. From January 2011 until December 2019, a total of about 1,820,000 EPCs have been issued, out of which 16.9% are for NR buildings. These include whole buildings, i.e., stand-alone buildings with the same use (e.g., office, school) and part buildings, i.e., building units (e.g., office spaces) in a multi-floor building. The exploited information from the EPCs include the calculated primary energy use per unit floor area (kWh/m2) for the total consumption (EUIp) and for the different end uses, i.e., space heating (EUIp,H), space cooling (EUIp,C), domestic hot water (EUIp,DHW) and lighting (EUIp,L), as well as the total CO2 emissions per unit floor area (kgCO2/m2). According to KENAK, the national primary energy conversion factors per energy carrier are 2.9 for electricity, 1.1 for heating oil and 1.05 for natural gas. Correspondingly, the carbon emission national conversion factors are 0.989 kgCO2/kWh, 0.264 kgCO2/kWh and 0.196 kgCO2/kWh.

3. Method

The following sections provide an overview of the approach used in this work to exploit the available information from the EPCs and derive practical baselines on the energy use and CO
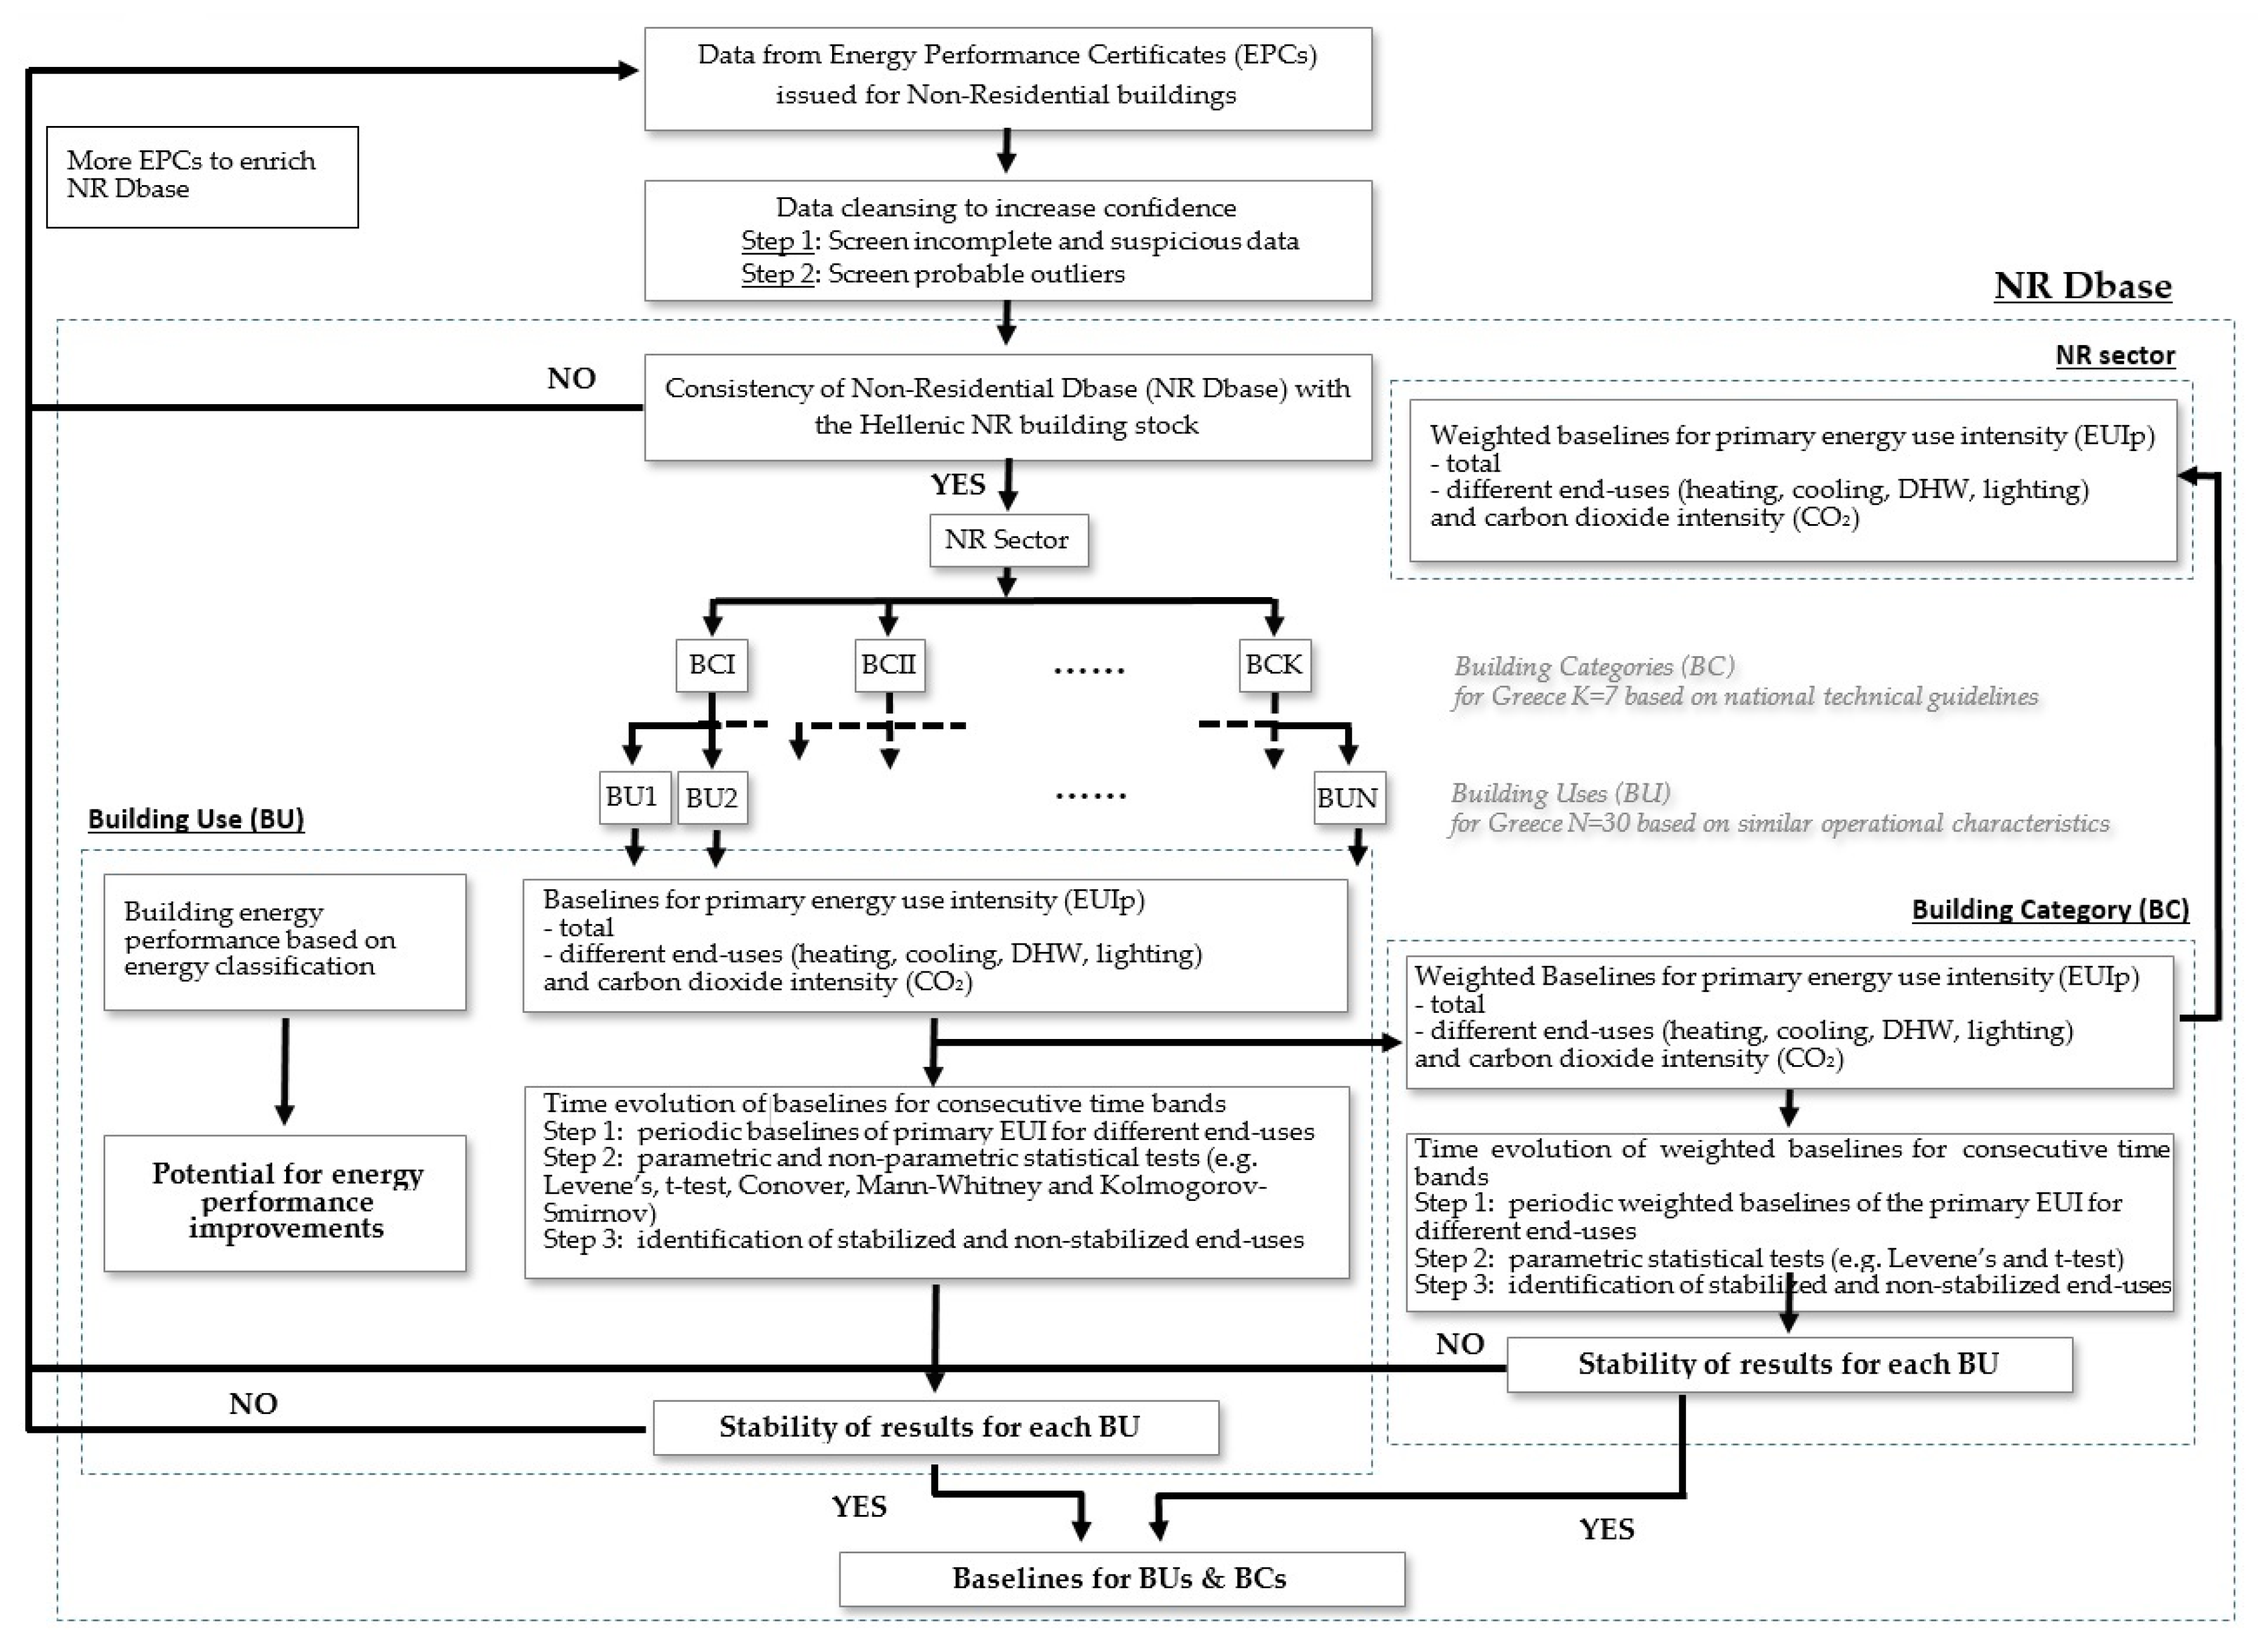
2 emissions for NR buildings. The evolution of these baselines over time are also investigated in order to conclude whether they can be considered as representatives. The main steps of the method used in this work is illustrated in Figure 2 and elaborated in the following sections.

3.1. Data Cleansing

Since EPC databases are one of the main sources of information about the energy use for various types of buildings, the quality of stored data is of vital importance [26]. By 2014, some kind of quality control processes of the EPCs were established in all EU member states [27]. In Greece, the first level data quality controls are performed by the responsible authority [28]. To further increase data confidence and ensure compliance, the available data were also screened before being used in the following analysis. The data cleansing process involved a series of checks in order to remove incomplete, erroneous, or otherwise suspicious data, thus ensuring that the data used are within reasonable limits and that derived baselines are reliable [29]. Accordingly, EPCs were excluded if they were:
  • Not complying with the national regulation requirements;
  • Issued by penalized energy inspectors;
  • Issued in the initial phase of the national energy efficiency subsidy program;
  • Incomplete or not finally submitted;
  • Including negative values, heated floor area greater than or less than 20% of the total floor area, zero CO2 emissions (when the energy carrier is not exclusively biomass), EUIp less than 5 kWh/m2 (for buildings with no RES) and greater than 8000 kWh/m2;
The resulting valid data for NR buildings reached about 235,000 EPCs or 76% of the initial database. As expected, most of the valid EPCs (86%) were issued for part buildings. However, since whole buildings are considered more representative of the various building uses, the following analysis is based on the available data for whole buildings. Accordingly, the valid data for NR whole buildings are about 31,700 EPCs.
Most data sets contain errors that can be identified as outliers having unusually large or small values. Such data may influence the statistical analysis and bias the results. A widely used method to screen data for outliers is the so-called Tukey boxplot method [30]. The method employs the interquartile range (IQR) as a measure of how spread-out the values are, being equal to the difference between 75th (Q3) and 25th (Q1) percentiles. Tukey defined Q1 – 1.5 × IQR and Q3 + 1.5 × IQR as “inner fences”, Q1 – 3 × IQR and Q3 + 3 × IQR as “outer fences”, the observations between an inner fence and the corresponding outer fence as “possible outliers”, and anything beyond outer fences as “probable outliers”.
In order to decide on the proper selection of the cut-off point one needs to know the shape of the empirical distribution of the data. Each end use of the different BUs was treated separately, since in the NR sector, BUs have very different energy profiles. Skewness and kurtosis are good indicators for nonsymmetrical distributions and the size and direction of the tails. Skewness is the degree of distortion from a symmetrical distribution. Skewness values between −0.5 and 0.5 indicate fairly symmetrical data, while skewness values less than −1 or greater than 1 correspond to skewed data. Kurtosis is actually the measure of outliers present in the distribution. The standard normal distribution has a kurtosis of three [31]. In more than 90% of the cases, the skewness of the end uses’ empirical distribution differed significantly (at the 95% confidence level) from that corresponding to a normal distribution, reaching values higher than 10 in some cases. Similarly, more than 85% of the kurtosis values differed significantly (at the 95% confidence level) from those corresponding to a normal distribution, being, in some cases, higher than 100. The results indicated nonsymmetrical data distributions with long, heavy tails to the right (high positive skewness values).
The distance from normality was confirmed by a set of Kolmogorov–Smirnov tests against the data following the normal distribution [32]. Accordingly, as an additional quality control step, the valid EPCs for NR whole-buildings were further screened in order to identify and exclude outliers, using the aforementioned Tukey boxplot method. For more than half of the valid EPCs setting the cut-off point at the inner fence would label more than 15% (and up to 37%) of the cases as outliers, whereas for the outer fence the percentage of the data points considered outliers was more reasonable, less than 10% for about 75% of the cases (and up to 24%).
Applying the additional screening on the valid data for NR whole buildings (setting the cut-off point at the outer fence), the resulting database for NR whole buildings comprises about 28,800 EPCs, referred to as the NR Dbase in the following analysis.

3.2. NR Dbase

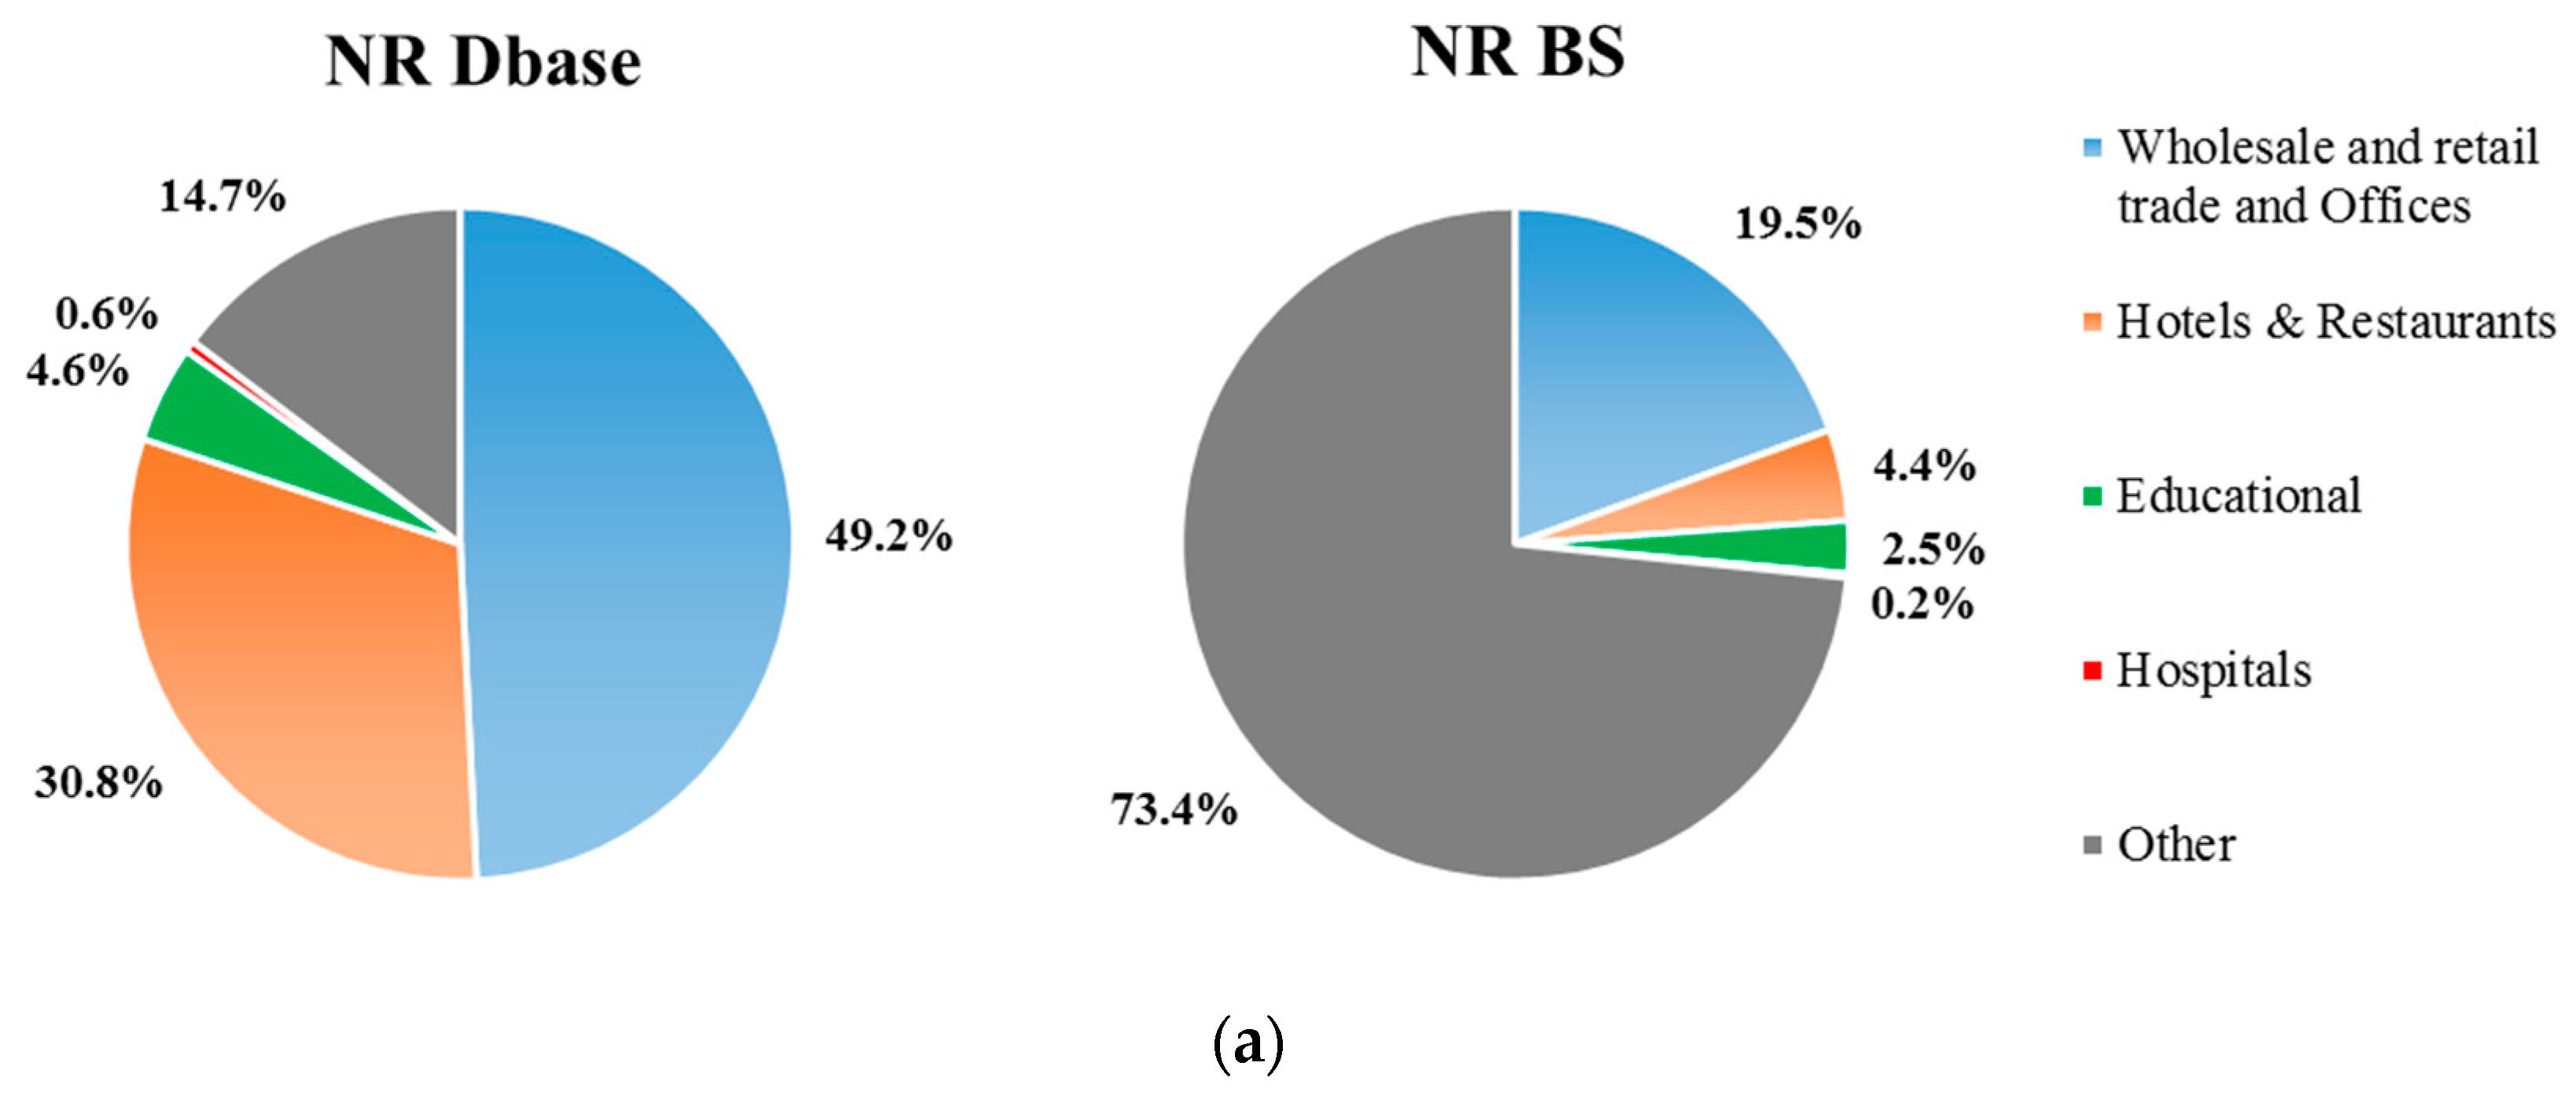
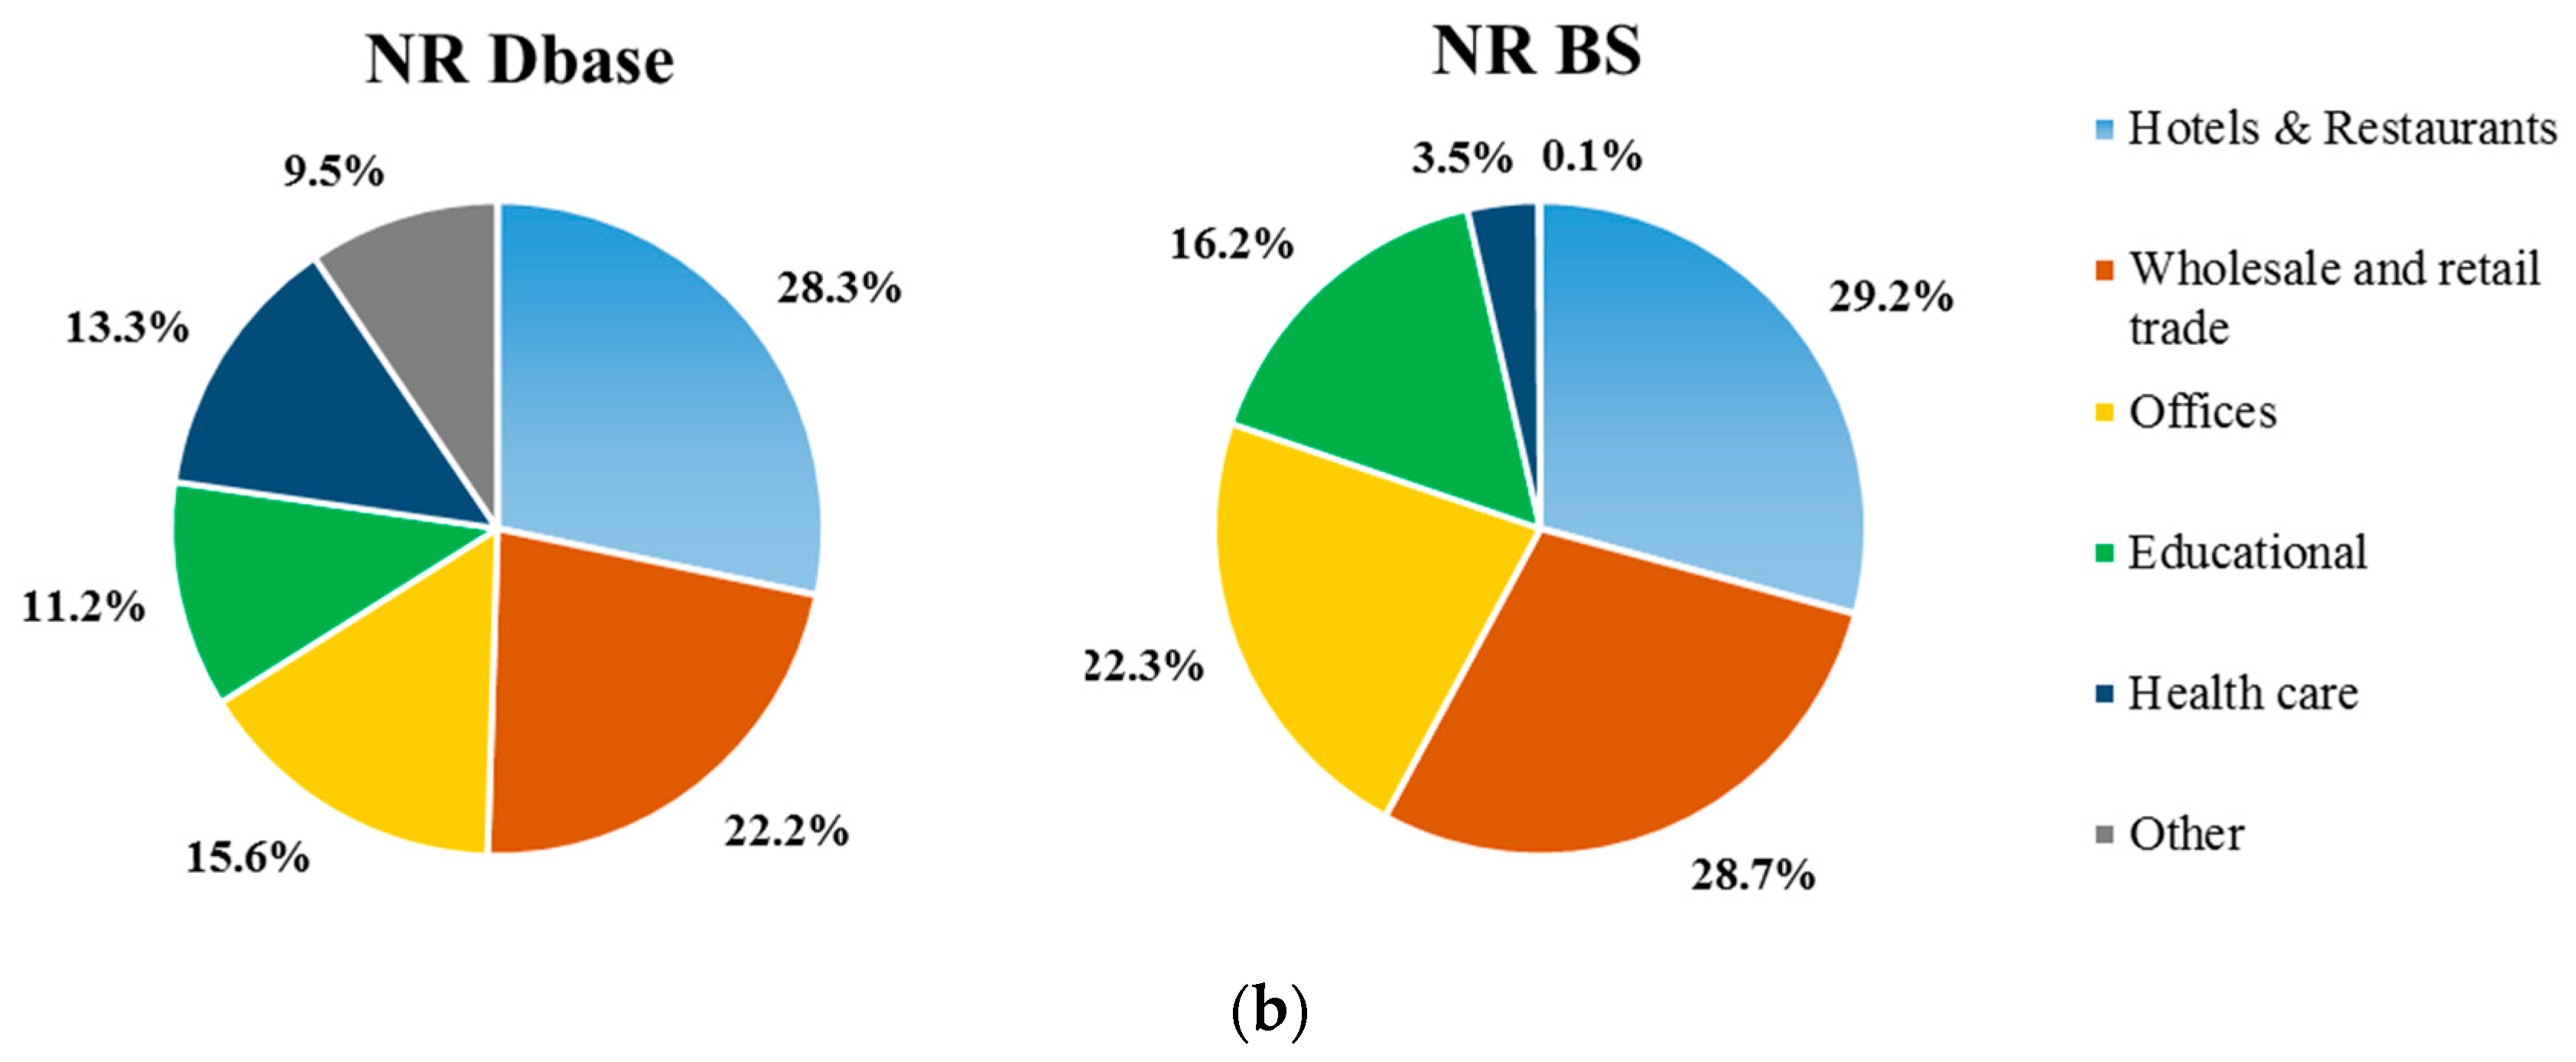
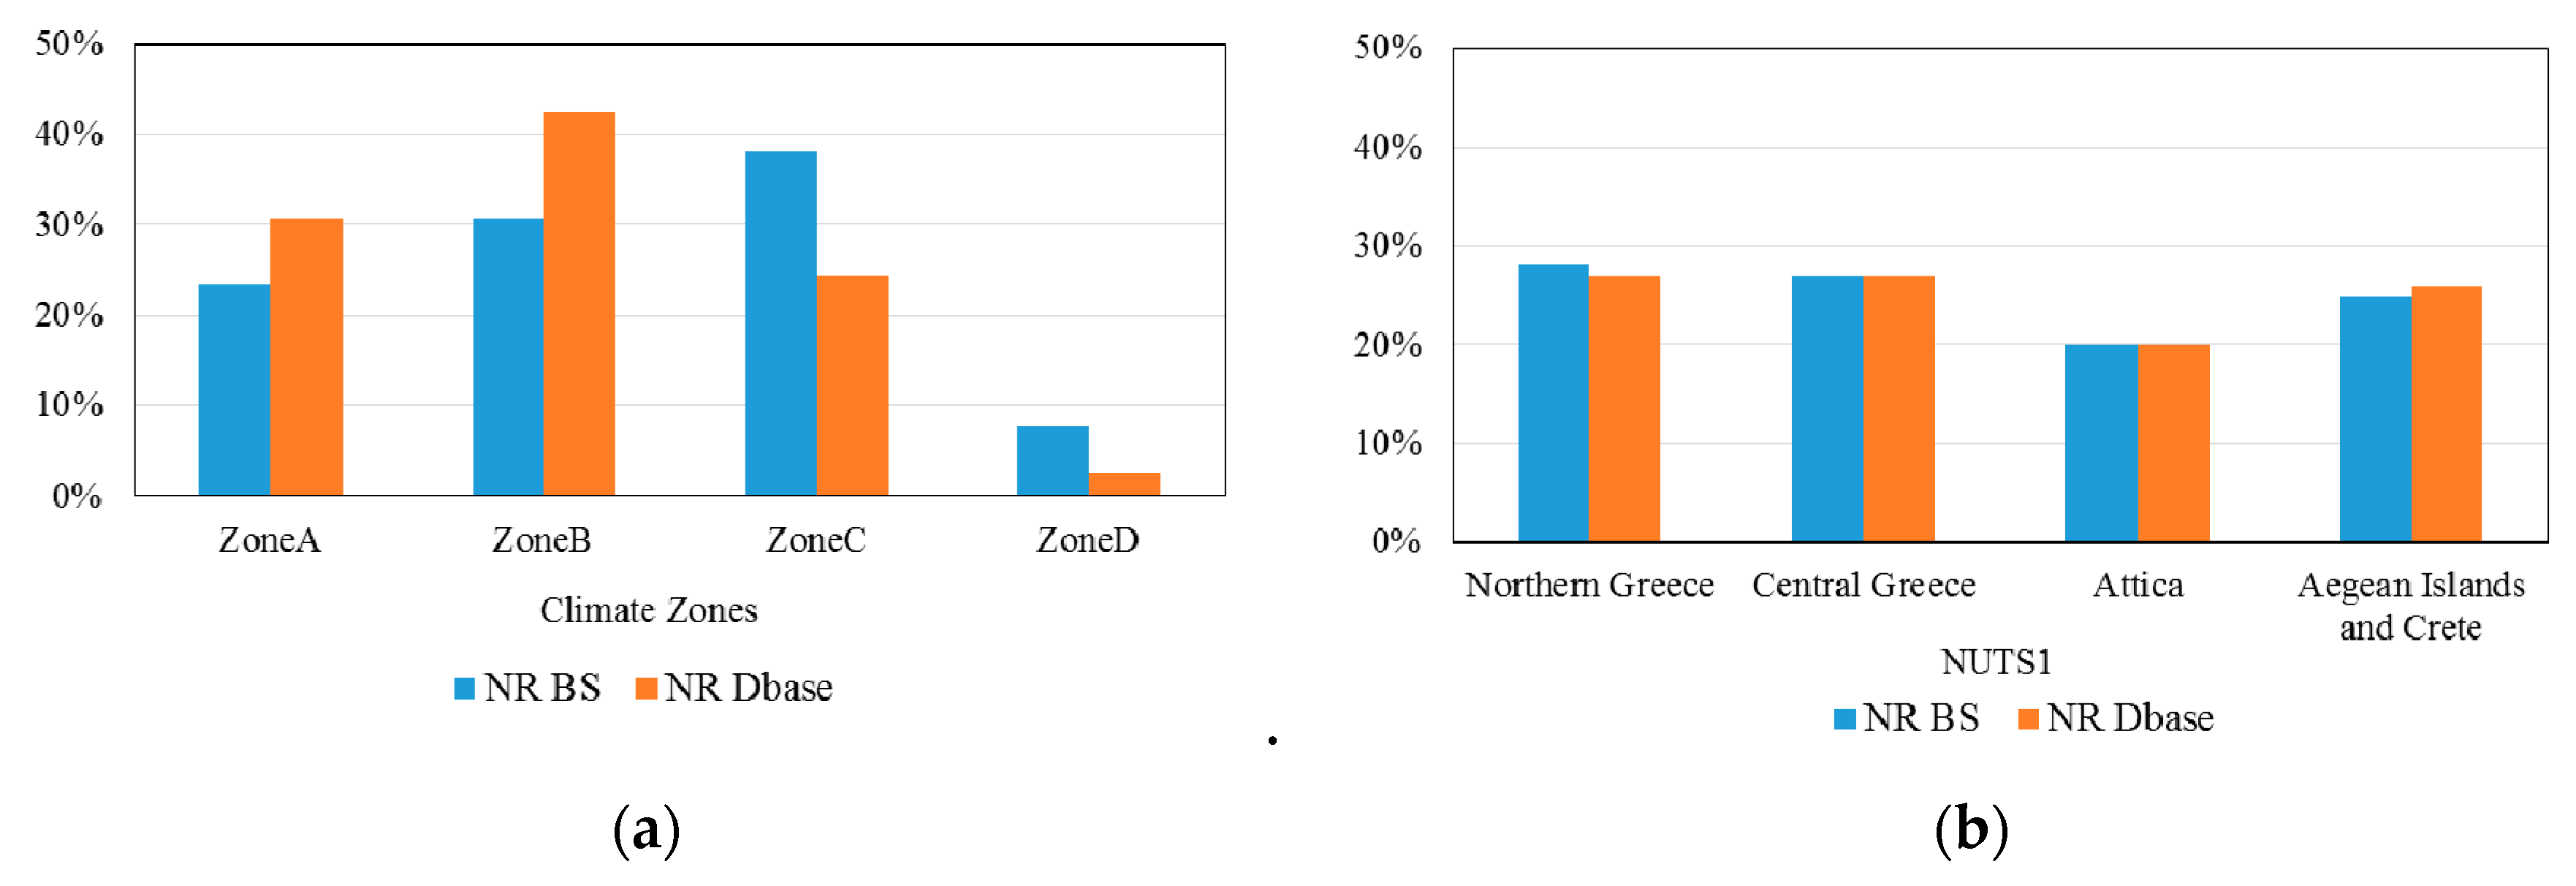
In order to justify the use of the resulting average values as baselines for the different BUs, the work assesses whether the NR Dbase could be considered representative of the Hellenic NR BS. The distribution of available data is defined for the number of buildings and size (i.e., heated floor area) and is then compared to the corresponding distribution of the NR BS from official national statistics [3,6]. In addition, the spatial distributions of the audited buildings according to climate zones, as well as to the four major socioeconomic regions (NUTS1 regions) are defined and compared to the corresponding distribution of the NR BS [6]. In case of similarity in profiles, the NR Dbase can be considered representative. Otherwise the results should be used with caution and the definition of baselines should be repeated at a later date when more data become available.

3.3. Primary Energy Use and CO2 Intensities

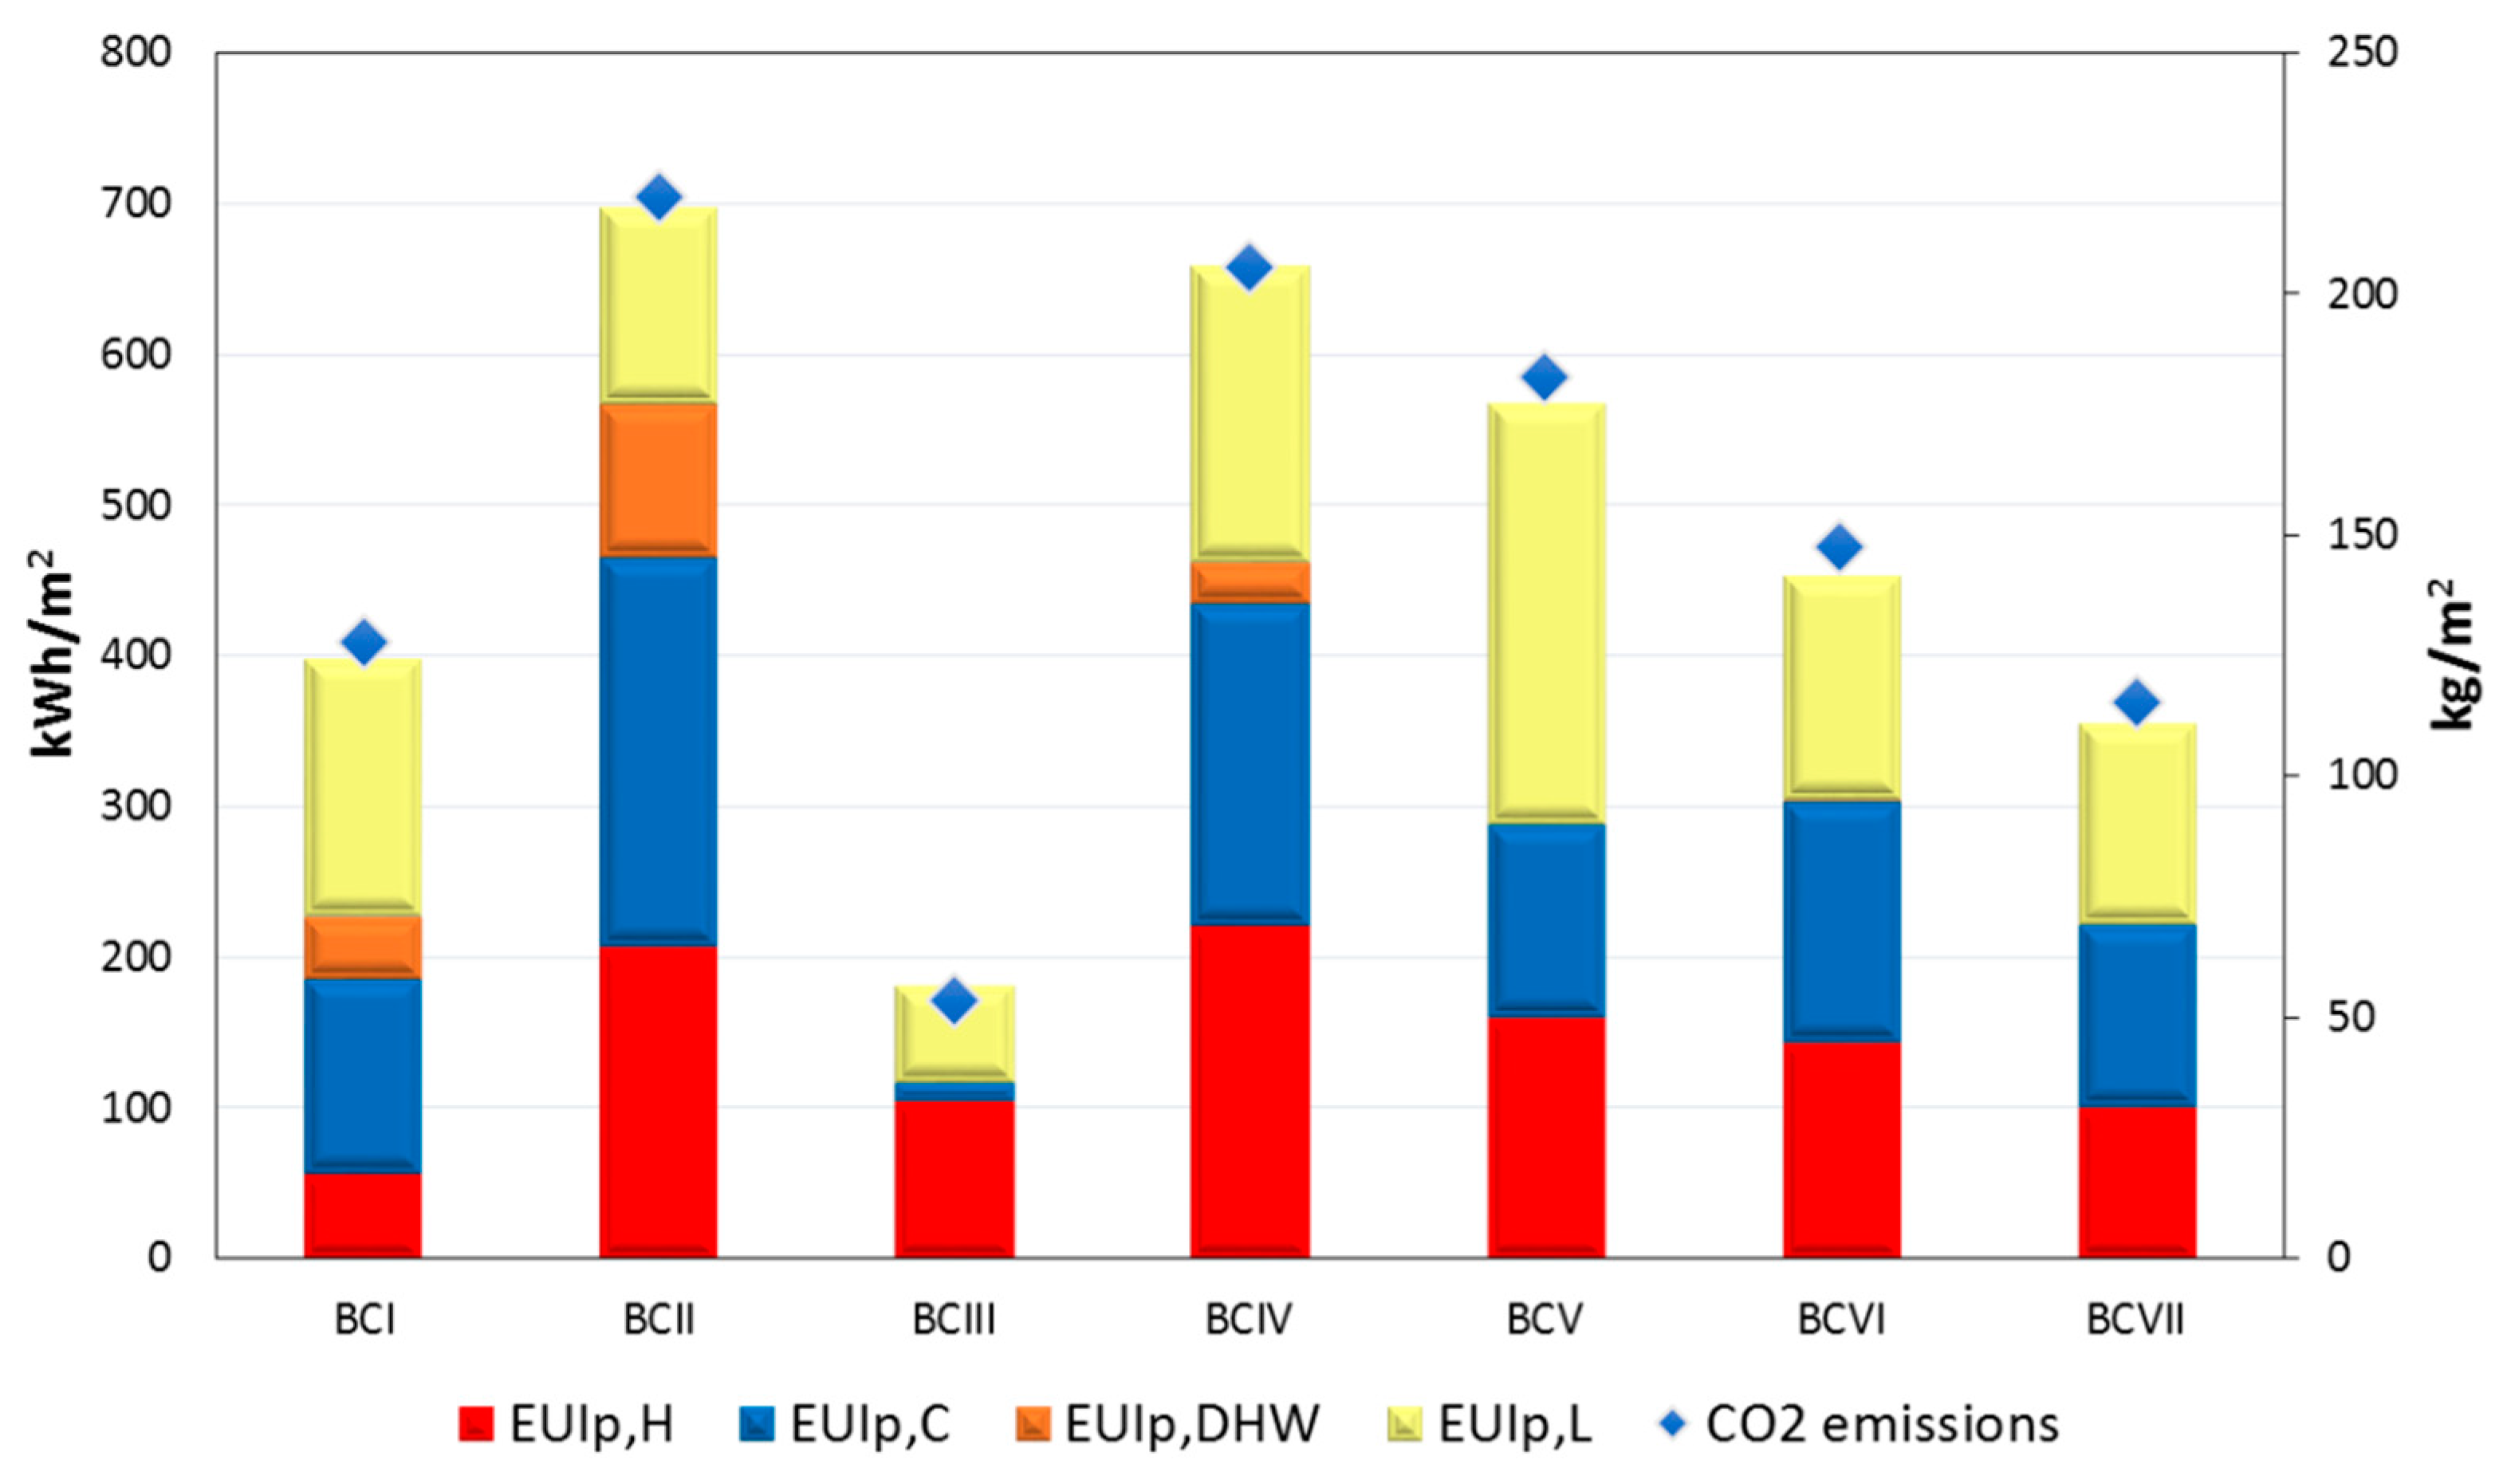
The calculated primary energy use intensity is derived for the total consumption and for the four end uses taken into account for each BU, since these independent variables can give a better insight than the aggregated total. Similarly, the total CO2 emissions per unit floor area are also derived for all BUs. The corresponding averages of the primary energy use and CO2 intensities, for the different building categories, are calculated as the weighted average of all building uses included in the category, using the total heated area as weight. Finally, the average primary energy use and CO2 intensities for the entire Hellenic NR sector are calculated as the weighted average of the corresponding values of the different building categories.

3.4. Building Energy Performance

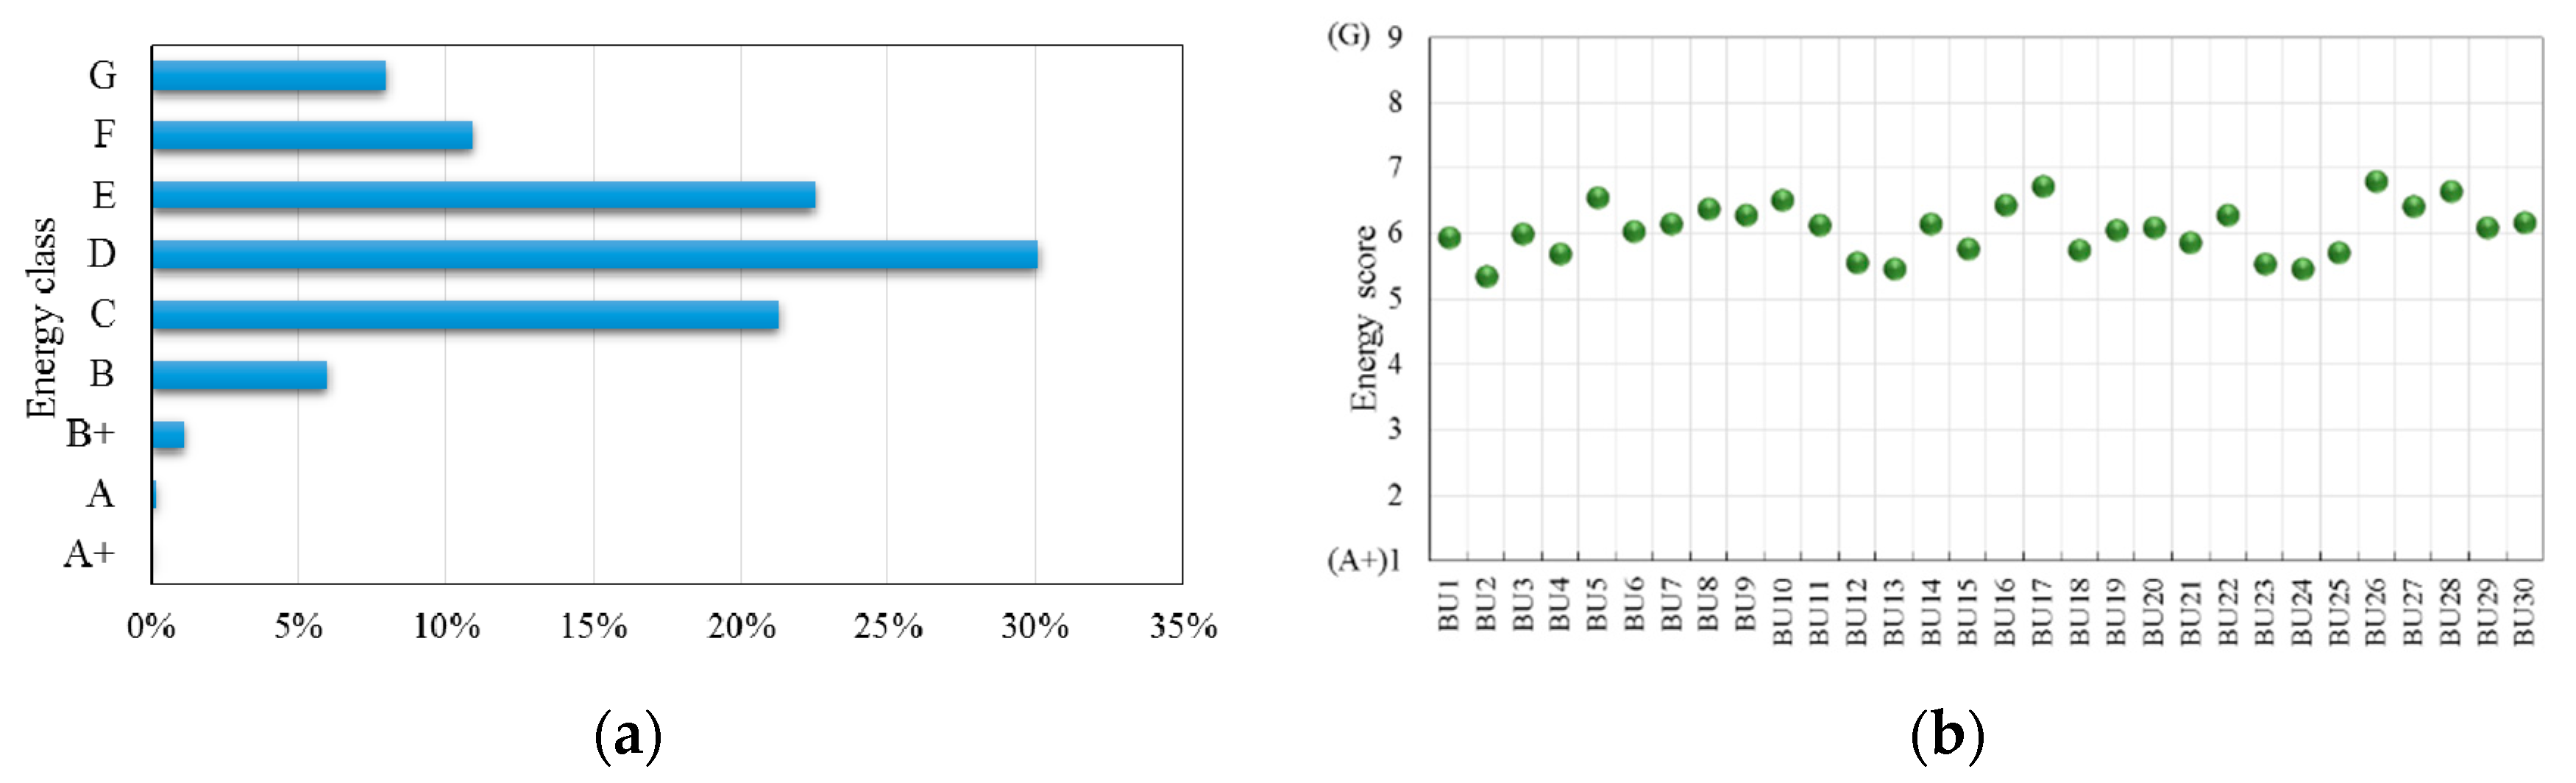
In order to evaluate the energy performance of NR buildings, the distribution of the audited buildings into the nine energy classes of the national rating system is considered. In an attempt to compare the BUs as to their energy behavior, the energy classes are given a score from 1 (highest energy class A+) to 9 (lowest energy class G). The weighted average energy score for each BU (based on the number of buildings in each energy class) is then calculated, providing an indication about the average energy behavior of each BU.
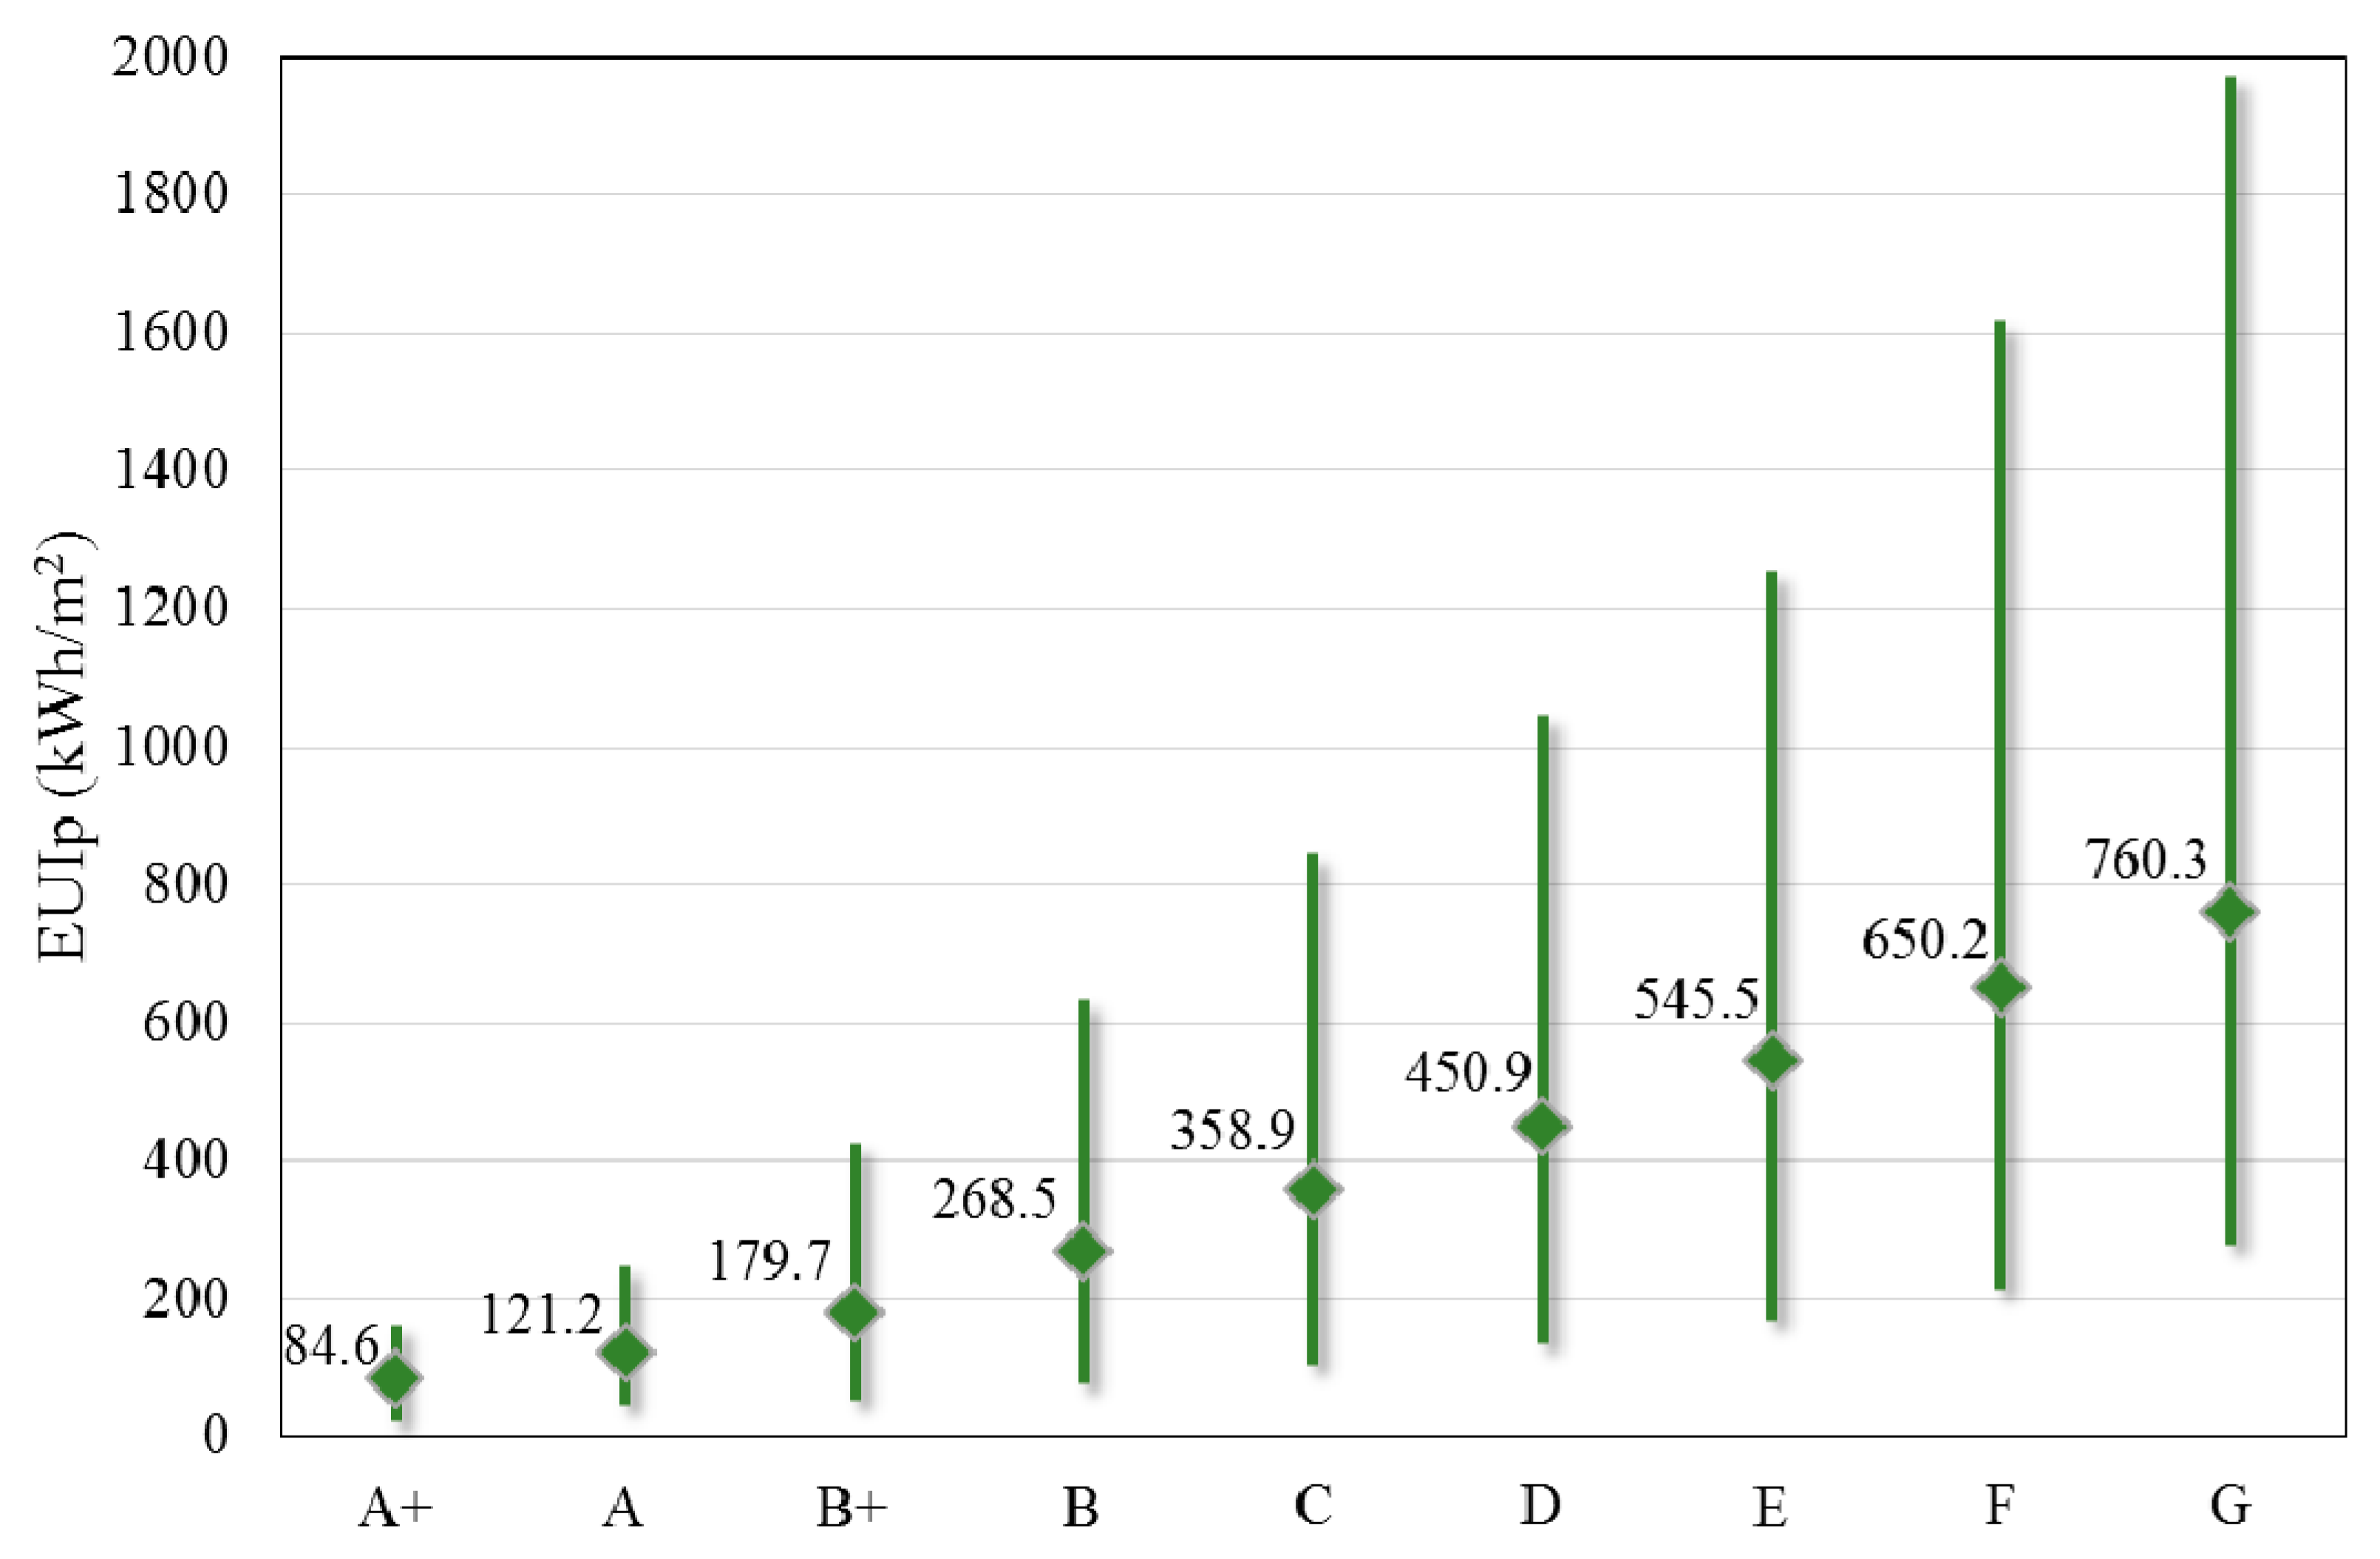
Further analysis also investigates the distribution of energy use intensity per energy class for all the BUs, as well as for the entire NR sector. This can provide some insight on the gap of the audited buildings from the excellent energy performance.

3.5. Time Evolution of Intensities

Issued EPCs for whole NR buildings have increased from 184 by the end of 2011 to 28,790 by the end of 2019. The following analysis focuses on the differences between the periodic average EUIp values over time, in order to conclude whether they can be considered stabilized and therefore representative.
As a first step, the time series of the EPCs in NR Dbase is organized in the cumulative datasets of consecutive years. For the available national database, this refers to nine time bands, covering the entire period of implementation and available EPCs from 2011 until 2019. For example, the first time band includes the data from the EPCs issued up to 2011, the second time band includes all the data issued up to 2012, and so forth till the ninth (last) time band that includes the entire database up to 2019. The periodic averages of EUIp and CO2 and the respective standard errors are then calculated for all 30 BUs for each time band.
As a second step, the degree of differentiation of the specific indicators (e.g., EUIp for the different end uses, CO2 emissions) is investigated among pairs of consecutive time bands. For the available national database, this refers to eight pairs of the available data. For example, the first pair considers the data from the EPCs issued up to 2011 and those issued up to 2012. The second pair considers the data from the EPCs issued up to 2012 and those issued up to 2013 and so forth till the eighth pair with data from the EPCs issued up to 2018 and those issued up to 2019. Initially, two parametric tests are performed for each building use for the comparison of their (a) variances, and (b) averages.
Available statistical methods testing for the homogeneity of variance include Barlett’s, Hartley’s, Cochran’s and Levene’s tests [33]. From these, Levene’s test is the most common assessment for homogeneity of variance, since it does not require normality of the underlying data. In this work, the vast majority of EPCs’ probability distribution per BU is non-normal, as already discussed in Section 3.1. Accordingly, the Levene’s test [34] is used to evaluate the possible changes in the variances of the indicators (e.g., total primary energy use intensity and for the different end uses) among pairs of consecutive time bands. The null hypothesis being tested is that the population variances of the two samples are equal, so in other words there is no change in their variance with the addition of new data.
One of the most common tests for equality of averages of two unrelated samples is the t-test [35]. In this work, the two independent samples’ t-test was used for equal or unequal variances, depending on the Levene’s test results, in order to check for possible changes in the average values among consecutive time bands. The null hypothesis is that the population average values of the two unrelated samples are equal.
Supplementary to the parametric tests, three nonparametric tests are also applied to compare the respective frequency distributions. The complementary nonparametric tests include the Conover test for equality of variances, the Mann–Whitney (M–W) test for equality of the averages, and the Kolmogorov–Smirnov (K–S) homogeneity test [32].
A crucial step in these parametric and nonparametric tests is evaluating how compatible the sample data is with the null hypothesis. This probability is called the p-value. The null hypothesis is rejected for small p-values (typically ≤0.05) as they indicate strong evidence against it. The null hypothesis is retained for large p-values (>0.05).
These two parametric and three nonparametric tests are applied for all BUs, for the specific indicators across the eight pairs of consecutive time bands. The results include the statistic values and the p-values of the respective tests. A dataset is characterized as stabilized (S) when there are no failures of the null hypotheses for any of the five tests, for all pairs of the time bands. If any two pairs of time bands fail in the variance tests, the dataset is characterized almost stabilized (AS), provided that the average tests and the K–S homogeneity test have no failures. In all other cases, the dataset is considered as nonstabilized (NS).
A similar approach is followed for testing the results for the different building categories (BCI–BCVII), applying the two parametric tests. Accordingly, the Levene’s test and the appropriate two independent samples’ t-test were used to test the weighted averages of EUIp for the different end uses and for the CO2 emissions. The use of nonparametric tests is not suitable since the database is composed of weighted averages for the different indicators.

4. Results

4.1. NR Dbase

The profiles of the number of buildings and the total floor area for the NR BS and NR Dbase are illustrated in Figure 3. The buildings included in the NR Dbase comprise only 4.1% of the NR BS, but the total floor area the percentage reaches 23.5%. Figure 3b indicates that the breakdown of the data available in the NR Dbase into the various building uses is similar to that of the national building stock.
The spatial distribution of buildings according to climate zones as well as NUTS1 region for the NR BS and NR Dbase are illustrated in Figure 4. The available data in the NR Dbase are distributed throughout the country, resembling the distribution of the national building stock, according to NUTS1. On the other hand, it appears that the number of certificates issued in the two southern zones (A and B) is relatively higher than the northern/colder zones (C and D). These observations should be taken into account when considering national average values.

4.2. Primary Energy Use and CO2 Intensities

The derived indicators of energy use and CO2 emissions for the different building categories and building uses are summarized in Table 1. The lowest calculated EUIp corresponds to BU19—private cram school/conservatory averaging 167.2 kWh/m2, since these buildings have limited operating and artificial lighting hours and small internal heat gains from occupants and appliances, while DHW is not considered. On the other hand, BU15—indoor sports hall/swimming pool buildings have the highest calculated EUIp, averaging 1003.9 kWh/m2, due to their high fresh air requirements, high internal loads and high DHW demand. For information, the corresponding values for residential whole buildings range from 252.7 kWh/m2 in multifamily houses (MFH) to 383.5 kWh/m2 in single-family houses (SFH). The average CO2 emissions for NR and residential buildings range from 49.2 kg/m2 (BU17—primary/secondary school) to 318.6 kg/m2 (BU15) and from 72.2 kg/m2 in MFH to 99.5 kg/m2 in SFH.
Analysis of the calculated primary energy per end use (Table 1) reveals that, in NR buildings, lighting is the most energy-consuming service in 40% of the BUs, followed by space heating (33%), space cooling (23%) and DHW (4%). Lighting is about half of the total primary energy for some building uses like BU2—hotel (summer) and BU18—university/college/lecture rooms, which may be attributed to the combination of high requirements for light levels and older lighting technology used. As expected, space heating is the most significant end use for school buildings, contributing up to 70% of the total in BU16—kindergarten and 63% in BU17—primary/secondary school, due to their unique operational characteristics (e.g., limited to the heating season and mainly morning hours). Space cooling reaches about half of the total energy use in BU10—theater/cinema and BU11—exhibition hall/museum, mainly due to their large volumes, high internal gains and fresh air requirements. The energy use for DHW starts from zero for several BUs, which covers all their needs with solar collectors and reaches up to 36% for BU27—fitness center. Once again, keep in mind that for some BUs the national technical guidelines neglect the DHW demand.
The public assembly buildings (BCII) usually include building uses with many operating hours, large volumes, latent loads and internal heat gains and as a result, they exhibit the highest weighted average EUIp (695.8 kWh/m2) and CO2 emissions (220.2 kg/m2). On the other hand, educational buildings (BCIII) have the lowest weighted average EUIp (181.6 kWh/m2) and CO2 emissions (53.3 kg/m2), since they have limited operating hours and they don’t have special energy requirements (Figure 5). As expected, DHW is not a significant end use for NR buildings. Space heating is the predominant end use for BCIII—educational buildings (58% of the total primary energy use), space cooling for BCII—public assembly buildings (37%), while lighting for BCV—justice/public order/safety and BCI—temporary residence buildings (49% and 43% respectively). For the remaining BCs, the contributions of the three end uses are more balanced.
Looking at the Hellenic NR sector, the weighted average EUIp and CO2 emissions are 448.0 kWh/m2 and 142.9 kg/m2; this is about 26% and 52% greater than the corresponding weighted averages for the residential sector. Lighting is the most energy-consuming service (33%), followed by cooling (32%), heating (29%) and DHW (6%).

4.3. Energy Performance

The data analysis confirmed the relatively low energy performance of existing NR buildings in Greece (Figure 6a). About 30% of the buildings are rated at class D; yet, this is better than the Hellenic residential buildings for which about 50% are rated at class G [36]. Similar results are reported in Spain [18] where NR buildings have a slightly better energy performance than residential buildings, with 26.4% of NR buildings rated at class D, followed by class E (22.8%) and class C (19.8%).
The weighted average energy score for each building use is presented in Figure 6b. Generally, all BUs have similar energy performance, with the average energy performance ranging between class C and class E. The building uses with the higher energy performance (best average energy scores) are BU2—hotel (summer), BU24—police station and BU13—bank. On the other hand, the worst energy performance (lowest scores) corresponds to BU17—primary/secondary school, BU28—barber shop/hair salon and BU26—small retail building/drugstore.
As expected, the average EUIp increases from the highest to the lowest energy class, ranging from 84.6 kWh/m2 (class A+) to 760.3 kWh/m2 (class G), as presented in Figure 7. Considering that 41% of the NR buildings are ranked in energy class E or lower, there is a significant potential for energy performance improvements by renovating the existing building stock. More insight is gained by referring to the distribution of average EUIp per energy class for the different building uses (Figure 8). The overall trend is similar, with the exception of some building uses (i.e., BU5, BU13, BU20 and BU24) for which the available sample is currently very small for detailed discretization. Overall, there is a very large range of EUIp between the highest and lowest energy class. The average decrease in EUIp between class G and class B (which corresponds to good energy behavior, according to KENAK) is about 65%. Comparatively, to reach the nZEB, the EUIp of the existing buildings will have to be improved by 76%, which demonstrates the challenges ahead for the national efforts to meet the ambitious energy targets in the coming decades, towards a decarbonized building stock by 2050.

4.4. Time Evolution of Intensities

The periodic baselines of the primary energy use and CO2 intensities, as well as their respective standard error, according to the nine time bands, are summarized in Table 2, Table 3, Table 4, Table 5, Table 6 and Table 7, for all building uses and building categories. Overall, there is no clear trend regarding the periodic averages amongst the different time bands. On the other hand, in most cases, standard errors are decreasing. This trend indicates that progressively the average values are becoming more accurate since there are smaller deviations in the available data.
A total of five statistical tests were applied to investigate the differentiation of the specific indicators across the eight pairs of the consecutive time bands, namely two parametric (Levene’s and t-test) and three nonparametric (Conover, M–W and K–S) tests (see Section 3.5). The t-test and M–W test used to test the equality of averages, the Levene’s and the Conover tests were for the equality of the variances, while the K–S test was used for the equality of the homogeneity.
As an example, the detailed results from all these tests (statistic values and p-values) as well as the retention or the rejection of the respective null hypothesis (equality of variances, averages and distributions) are summarized in Table 8 for one indicative building use (i.e., BU2—hotel (summer)). The failure codes (F-codes) summarize the rejections of the null hypothesis from the various tests, using a three-digit convention: the first digit refers to the results from the equality of averages tests; the second to the equality of the variances tests; the third to the results from the homogeneity test. For the first two digits, “0” represents retention of the null hypothesis in both parametric and nonparametric tests, while “1” signifies the rejection of the null hypothesis in at least one of the tests. For the third digit, “0” represents the retention of the null hypothesis in the K–S test, while “1” signifies its rejection. Accordingly, the nomenclature of “000” indicates that there is no failure in any of the tests, while “111” represents failure in all tests. As another example, for EUIp, L under the T2 time band “101” represents failure in the average tests (in this case both the t-test and the M–W test fail), no failure in any variance tests (Levene’s and Conover test) and failure in the K–S test.
Similar results have been produced for all BUs. The failures of the various null hypothesis for the different energy use and CO2 emission intensities are summarized in Table 9, following the same three-digit nomenclature that was previously elaborated. To facilitate the interpretation of the results, failures are illustrated with shaded cells. Note that the datasets of the first two pairs of time bands (T1 and T2) that cover the early implementation years of the certification scheme, are not considered representative, due to the very small number of cases. Accordingly, these two pairs (T1 and T2) are not included in Table 9 and were not considered in the following analysis.
Looking at the four end uses, the average values of energy use intensities don’t differentiate significantly across the consecutive time bands in more than half of the building uses. Overall, 13 out of 30 building uses exhibit failures of the average or/and variance tests in one or more of the end uses, which might indicate that there is not yet homogeneity of the respective building uses.
Depending on the results of the statistical tests, an indicator (e.g., EUIp, EUIp,H) can be characterized as stabilized (S), almost stabilized (AS), and nonstabilized (NS), according to the discussion in Section 3.5. Based on the characterization of the respective end uses, the overall status of a building use is considered stabilized when all its end uses are stabilized, nonstabilized when at least one end use is nonstabilized, and almost stabilized in all other cases. The stabilization status of the specific indicators, as well as the overall status of all BUs are summarized in Table 10. The total primary energy use and CO2 intensity were not taken into account for the overall characterization of a BU, since these may be the result of counteracting variations among the different end uses. Nevertheless the characterization of these two specific parameters was included in Table 10 only for comparison.
Overall, a total of 10 BUs (33%) are nonstabilized (Table 10), indicating that the analysis results of available data should be used with caution since they might not yet be sufficiently representative of the respective building population. Among them, BU26 is the most problematic, since all of its end uses are nonstabilized, followed by BU29 and BU17, for which two out of their three end uses have not yet reached steady-state behavior. From the analysis of the available data from the NR Dbase, there were no evident reasons for nonstabilization of the specific building uses. Probably, in a second phase, having access and analyzing the raw data of the corresponding EPCs would allow a more detailed investigation of the driving forces for this behavior.
A similar approach was followed for the six building categories, excluding BCV since it only refers to a single building use (BU24) and was not considered again in the analysis. The temporal evolution of the weighted average primary energy use and CO2 intensities and their respective standard errors for the building categories, are also in Table 2, Table 3, Table 4, Table 5, Table 6 and Table 7. The results are listed for the nine time bands from 2011 to 2019. For the building categories, only the two parametric statistical tests were applied, and the resulting failures of the null hypothesis are summarized in Table 11. This time, a two-digit convention is used; the first digit refers to equality of averages test and the second to equality of the variances test. The coding interpretation is the same as the one used for BUs. Again, “0” represents retention of the null hypothesis, while “1” signifies its rejection. Failures (rejections) are illustrated with shaded cells, in order to facilitate the interpretation of the results. Again, the first two pairs of time bands (T1 and T2) are not included in Table 11. Finally, the derived stabilization status is summarized in Table 12, following similar characterization rules as in the building use level. Overall, assessing the currently available data at the building category level, for the different end uses as well as for the overall behavior, the results indicate that they are nonstabilized yet. This level of detail is very demanding, so there is a need to accumulate additional data in the future.

5. Discussion and Conclusions

This paper examined the energy performance of existing Hellenic NR buildings, by analyzing the data from about 30,000 EPCs for whole buildings that have been issued up to the end of 2019. The data were clustered into seven building categories, according to the definitions in the national technical guidelines, and into a total of thirty building uses based on similarities between building types. The calculated primary energy use and CO2 emission intensities were analyzed, taking into account heating, cooling, DHW and lighting (heating and cooling include mechanical ventilation).
The first objective of this work was to derive practical baselines for the energy use and CO2 emission intensities for different NR buildings. Although the number of buildings in the NR Dbase is rather small, the total floor area of the audited buildings reaches a significant percentage of the national building stock, justifying the use of the findings as baselines, at least for most of the building uses.
The calculated primary energy use intensity for the Hellenic NR sector averages 448.0 kWh/m2, ranging from 167.2 kWh/m2 to 1003.9 kWh/m2 for the different buildings uses. Lighting and space cooling are the most consuming services, contributing about 33% each to the total primary energy use, following by space heating with 29% and finally by DHW with only 5%. The average calculated CO2 emissions for NR buildings is 147.5 kg/m2.
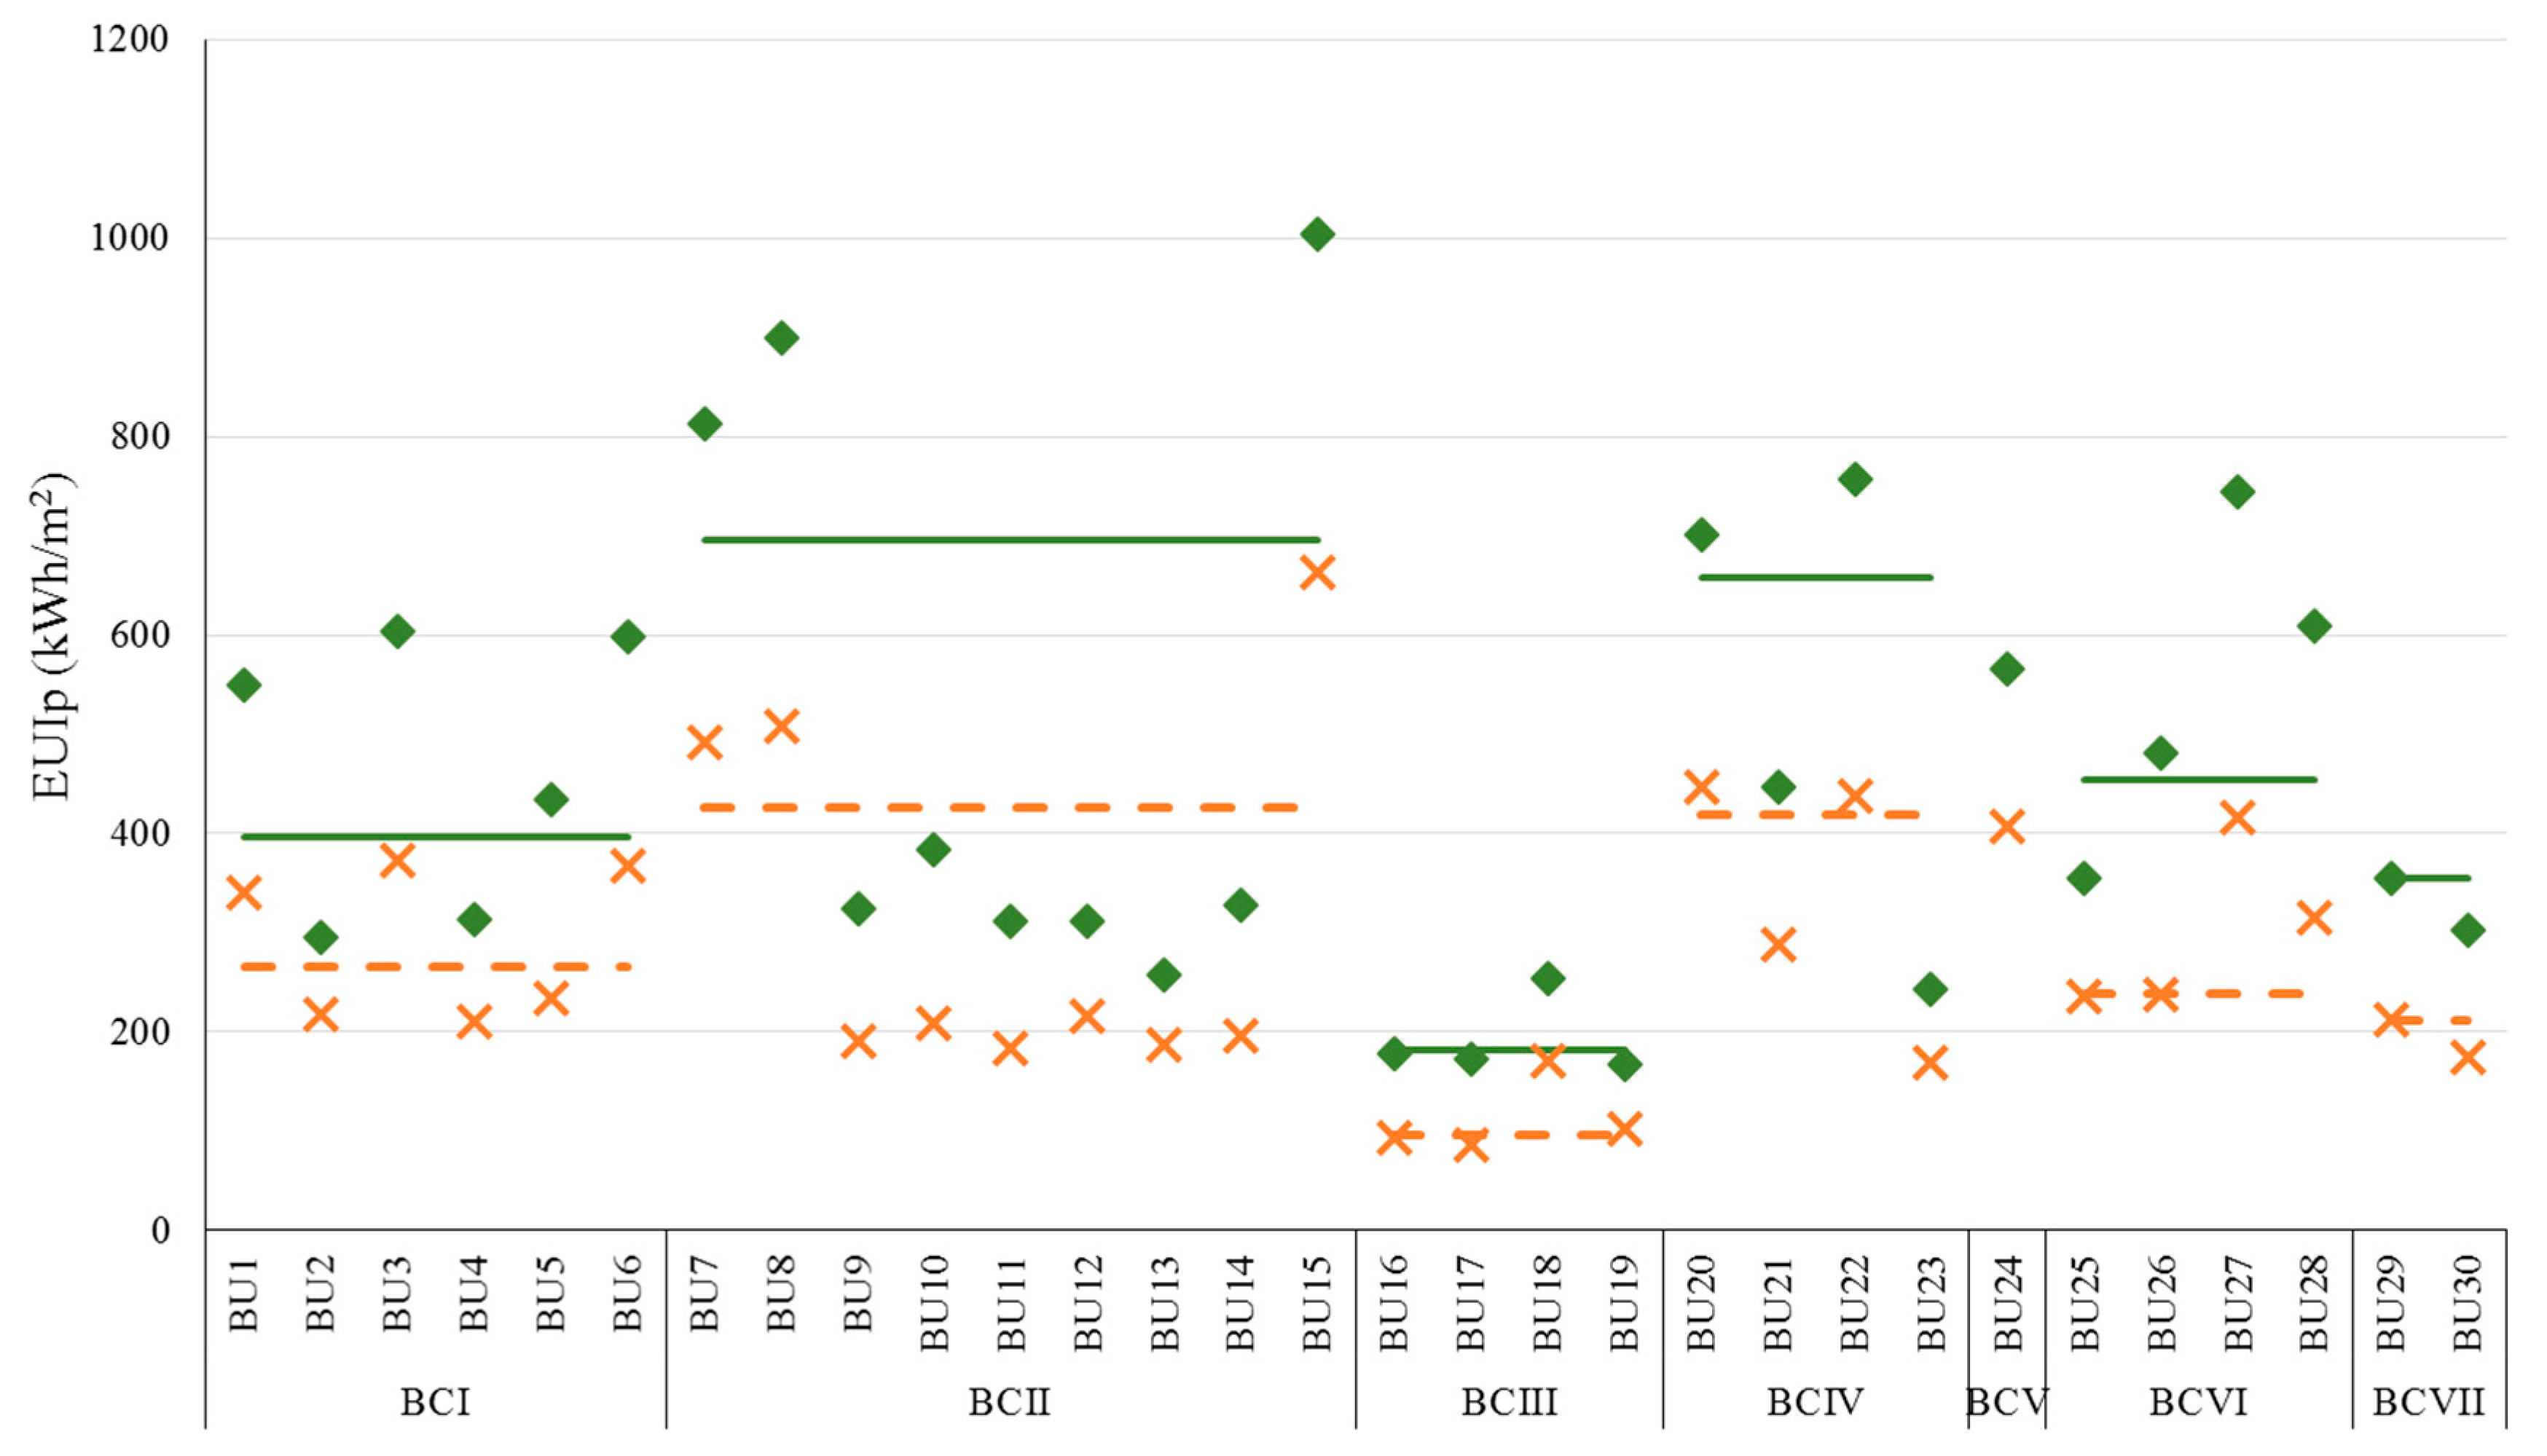
The relatively low energy performance of NR buildings is also reflected by their poor energy rating. They average an energy class -D by 30%, while only 1.3% are ranked in energy class -B+ or better towards nZEB. Apparently, there is a great potential for significant energy conservation by renovating the existing building stock, comparing the average total primary energy use intensity to the corresponding values for the reference buildings (indicating a “good” building) as illustrated in Figure 9.
The primary energy use and the carbon emissions were estimated using the national conversion factors per energy carrier, which were defined in 2010. This may impact the results for electricity since they do not reflect the recent evolution of the energy mix used for power generation. This is expected to change even more in the near future, given the national efforts to decarbonize power generation and the national policy to abandon lignite power plants by 2028, according to the proposed NECP [37]. As a result, the calculated average intensities are much higher than they should be. For example, in NECP it is reported that in 2016 for electricity the conversion factor to primary energy was 2.17 and to CO2 emissions 0.606. The use of these updated factors would result in a reduction of about 25% in the primary energy use for lighting and cooling and about 39% in CO2 emissions. The total primary energy use would also be reduced by a smaller yet significant percentage, since lighting and cooling are important end uses for NR buildings.
The second objective of this paper was to analyze the time evolution of the average primary energy use and CO2 emission intensities (arranged in nine consecutive time bands) and conclude about their stabilization status The cumulative datasets for first two time bands (up to 2011 and up to 2012) included very few cases and for this reason were not taken into account in the analysis.
Accordingly, for the time bands after 2013, the majority of the building uses (i.e., 19 out of 30 building uses) could be considered as stabilized, based on the test results performed on their end uses. For some of them (i.e., 11 building uses identified in Table 10) more EPCs should be gathered in order to constitute a more representative sample. Investigating only the stabilization of the EUIp (e.g., in case of lack of more detailed data), a total of 26 BUs could be considered as stabilized, indicating that when less detailed data are used, the results can be misleading. It is interesting to note that although the stabilized BUs are more than the nonstabilized ones, they represent only 28% of the total heated area, indicating that the NR Dbase as a whole is nonstabilized.
The variations in the last two pairs of consecutive time bands (T7:upto2017-upto2018 and T8:upto2018-upto2019) could be attributed to the updates incorporated in the national calculation engine in late 2017, which have affected—to some extent—the calculations of EPCs issued in 2018 and 2019. Generally, regular updating of the methodology and the software results to disruptions in the continuity of the time series, nullifying the possibility for assessing the degree of representativity of the dataset. Another limitation of the followed procedure is that for datasets with relative small number of cases, the statistical tests may not be so accurate, thus, in these cases, even if they are characterized as stabilized, more data will be required.
As expected, most of the building categories are nonstabilized, since they included heavy, nonstabilized BUs, covering between 44% and 99% of their heated area. On the other hand, BCIV is characterized nonstable, even though its only unstable building use is BU21, which corresponds to only 8% of the category’s heated area. One possible cause for this is that different variations from the four building uses comprising this category may not be statistically significant at the BU level, but, when aggregated at the BC level, they became significant. This is another example of results obtained from less detailed data having the potential to be misleading, albeit at the opposite direction than the case of EUIp discussed above. In any case, even though for many BUs the population may be sufficient, when it comes to BCs, more data are required.
Furthermore, it would be desirable to evaluate and analyze the impact of the end use on EUIp in conjunction with the construction period and the climate at the location of the buildings. The national regulation recognizes three construction periods and four climate zones across Greece. However, the population of the currently available dataset is not yet sufficient to support such a discretization of the data.
As a general benefit, this work presented a well-structured integrated approach for clustering the building stock, screening the data, performing statistical tests and overall data assessment. The proposed methodology has numerous advantages, since it is a modular approach with sequential steps that can also be implemented independently, can be extended and adopted for other types of buildings (i.e., residential buildings), and can be replicated in other countries with their national certificate databases. Even if building uses and building categories are not yet all stabilized and representative, the analysis of the available data comprises a first step for bridging the gap of knowledge about the Hellenic NR building uses. The derived practical baselines on the energy use and CO2 emission intensities, elaborated for the first time at this level of detail, provide new insight for practically all NR building uses defined in Greece for gaining a deeper understanding of national building stock modeling.

Author Contributions

Conceptualization, C.A.B. and K.G.D.; methodology, K.G.D. and C.A.B.; formal analysis, K.G.D., S.K., S.L., E.G.D. and C.A.B.; investigation, K.G.D.; data curation, K.G.D. and S.K.; writing—original draft, K.G.D.; writing—review and editing, C.A.B., S.K., S.L., E.G.D. and A.A.A.; visualization, K.G.D. All authors have read and agreed to the published version of the manuscript.

Funding

This research received no external funding.

Acknowledgments

This research is part of K.G.D. dissertation work as doctorate candidate at the Department Physics, University of Patras, Greece. The national EPC repository (buildingcert) has been developed and maintained by the Hellenic Ministry of Environment & Energy (YPEN) in collaboration with the Centre for Renewable Energy Sources. The authors wish to acknowledge YPEN for allowing access to the EPC database. The analysis presented herein does not necessarily reflect the opinion of the Ministry.

Conflicts of Interest

The authors declare no conflict of interest.

Nomenclature

BCBuilding Category
BUBuilding Use
DHWDomestic Hot Water
EEDDirective on Energy Efficiency
EPBDEnergy Performance of Building Directive
EPCEnergy performance certificate
EUEuropean
EUIpTotal Primary Energy Use per unit floor area
EUIp,HPrimary Energy Use per unit floor area for space heating
EUIp,CPrimary Energy Use per unit floor area for space cooling
EUIp,DHWPrimary Energy Use per unit floor area for domestic hot water
EUIp,LPrimary Energy Use per unit floor area for lighting
HDDHeating Degree Days
IQRInterquartile Range
MFHMultifamily Houses
NECPsNational Energy and Climate Plan
NRNonresidential
NR BSNonresidential Building Stock
NR DbaseScreened data base for NR whole-buildings from the certificates
SFHSingle-Family Houses

References

  1. European Commission. Energy Performance of Buildings. Available online: https://ec.europa.eu/energy/en/topics/energy-efficiency/energy-performance-of-buildings/energy-performance-buildings-directive (accessed on 29 January 2020).
  2. Organisation for Economic Co-Operation and Development. Built-up Area and Built-up Area Change in Countries and Regions. Available online: https://stats.oecd.org/Index.aspx?DataSetCode=BUILT_UP (accessed on 29 January 2020).
  3. EU Energy in Figures. Statistical Pocketbook. 2019. Available online: https://ec.europa.eu/energy/en/data-analysis/energy-statistical-pocketbook (accessed on 29 January 2020).
  4. Bertoldi, P.; Atanasiu, B. An In-Depth Analysis of the Electricity End-Use Consumption and Energy Efficiency Trends in the Tertiary Sector of the European Union. Int. J. Green Energy 2011, 8, 306–331. [Google Scholar] [CrossRef]
  5. Capros, P.; de Vita, A.; Tasios, N.; Siskos, P.; Kannavou, M.; Petropoulos, A.; Evangelopoulou, S.; Zampara, M.; Papadopoulos, D.; Nakos, C.; et al. EU Reference Scenario 2016 Energy, Transport and GHG Emissions to 2050; Publications Office of the European Union: Luxembourg, 2016; Available online: https://ec.europa.eu/energy/sites/ener/files/documents/20160713%20draft_publication_REF2016_v13.pdf (accessed on 29 January 2020).
  6. ELSTAT. Buildings Census 2011. Athens: Hellenic Statistical Authority. 2015. Available online: www.statistics.gr/census-buildings-2011 (accessed on 29 January 2020).
  7. Gaglia, A.G.; Balaras, C.A.; Mirasgedis, S.; Georgopoulou, E.; Sarafidis, Y.; Lalas, D.P. Empirical Assessment of the Hellenic Non-Residential Building Stock, Energy Consumption, Emissions and Potential Energy Savings. Energy Convers. Manag. 2007, 48, 1160–1175. [Google Scholar] [CrossRef]
  8. Hellenic Ministry of Environment & Energy. Long Term Strategy Report Mobilizing Investments in the Renovation of Residential and Commercial Buildings, Public and Private, of the National Building Stock; Pursuant to Article 4 of Directive 2012/27/EU; Hellenic Ministry of Environment, Energy and Climatic Change: Athens, Greece, 2014.
  9. European Commission. The Amending Directive (2018/2002). Available online: https://ec.europa.eu/energy/en/topics/energy-efficiency/targets-directive-and-rules/energy-efficiency-directive#content-heading-0 (accessed on 29 January 2020).
  10. DIRECTIVE (EU) 2018/844. Official Journal of the European Union. 2018. Available online: https://eur-lex.europa.eu/legal-content/EN/TXT/PDF/?uri=CELEX:32018L0844&from=EN (accessed on 29 January 2020).
  11. European Commission. Clean Energy for All Europeans Package. Available online: https://ec.europa.eu/energy/en/topics/energy-strategy-and-energy-union/clean-energy-all-europeans (accessed on 29 January 2020).
  12. Maldonado, E. (Ed.) Implementing the Energy Performance of Buildings Directive (EPBD); ADENE: Lisbon, Portugal, 2015. [Google Scholar]
  13. Attanasio, A.; Piscitelli, M.S.; Chiusano, S.; Capozzoli, A.; Cerquitelli, T. Towards an Automated, Fast and Interpretable Estimation Model of Heating Energy Demand: A Data-Driven Approach Exploiting Building Energy Certificates. Energies 2019, 12, 1273. [Google Scholar] [CrossRef] [Green Version]
  14. Dall’O, G.; Sarto, L.; Sanna, N.; Tonetti, V.; Ventura, M. On the use of an energy certification database to create indicators for energy planning purposes: Application in northern Italy. Energy Policy 2015, 85, 207–217. [Google Scholar] [CrossRef]
  15. Gangolells, M.; Casals, M.; Forcada, N.; Macarulla, M.; Cuerva, E. Energy mapping of existing building stock in Spain. J. Clean. Prod. 2016, 112, 3895–3904. [Google Scholar] [CrossRef]
  16. Streicher, K.N.; Padey, P.; Parra, D.; Bürer, M.C.; Patel, M.K. Assessment of the current thermal performance level of the Swiss residential building stock: Statistical analysis of energy performance certificates. Energy Build. 2018, 178, 360–378. [Google Scholar] [CrossRef]
  17. Dascalaki, E.G.; Kontoyiannidis, S.; Balaras, C.A.; Droutsa, K.G. Energy Certification of Hellenic Buildings: First findings. Energy Build. 2013, 65, 429–437. [Google Scholar] [CrossRef]
  18. D’Agostino, D.; Cuniberti, B.; Bertoldi, P. Energy consumption and efficiency technology measures in European non-residential buildings. Energy Build. 2017, 153, 72–86. [Google Scholar] [CrossRef]
  19. Gangolells, M.; Casals, M.; Ferré-Bigorra, J.; Forcada, N.; Macarulla, M.; Gaspar, K.; Tejedor, B. Energy Benchmarking of Existing Office Stock in Spain: Trends and Drivers. Sustainability 2019, 11, 6356. [Google Scholar] [CrossRef] [Green Version]
  20. Hjortling, C.; Björk, F.; Berga, M.; af Klintberg, T. Energy mapping of existing building stock in Sweden—Analysis of data from Energy Performance Certificates. Energy Build. 2017, 153, 341–355. [Google Scholar] [CrossRef]
  21. Armitage, P.; Godoy-Shimizu, D.; Steemers, K.; Chenvidyakarn, T. Using Display Energy Certificates to Quantify Public Sector Office Energy Consumption. Build. Res. Inf. 2014, 43, 691–709. [Google Scholar] [CrossRef] [Green Version]
  22. Godoy-Shimizu, D.; Armitage, P.; Steemers, K.; Chenvidyakarn, T. Using Display Energy Certificates to Quantify Schools’ Energy Consumption. Build. Res. Inf. 2011, 39, 535–552. [Google Scholar] [CrossRef]
  23. Dascalaki, E.G.; Balaras, C.A.; Gaglia, A.G.; Droutsa, K.G.; Kontoyiannidis, S. Energy performance of buildings—EPBD in Greece. Energy Policy 2012, 45, 469–477. [Google Scholar] [CrossRef]
  24. Ministerial Decision No 85251/242/2018—FEK 5447/Β/5-12-2018 (in Greek). Available online: https://www.e-nomothesia.gr/kat-periballon/upourgike-apophase-upendepea-85251-242-2018.html (accessed on 29 January 2020).
  25. Droutsa, K.G.; Balaras, C.A.; Dascalaki, E.G.; Kontoyiannidis, S.; Argiriou, A.A. Energy Use Intensities for Asset Rating of Hellenic Non-Residential Buildings. Glob. J. Energy Technol. Res. Updates 2018, 5, 19–36. [Google Scholar] [CrossRef]
  26. Arcipowska, A.; Anagnostopoulos, F.; Mariottini, F.; Kunkel, S. Energy Performance Certificates across the EU; Buildings Performance Institute Europe (BPIE): Brussels, Belgium, 2014; Available online: http://bpie.eu/wp-content/uploads/2015/10/Energy-Performance-Certificates-EPC-across-the-EU.-A-mapping-of-national-approaches-2014.pdf (accessed on 29 January 2020).
  27. Pasichnyi, O.; Wallin, J.; Levihn, F.; Shahrokni, H.; Kordas, O. Energy performance certificates—New opportunities for data-enabled urban energy policy instruments? Energy Policy 2019, 127, 486–499. [Google Scholar] [CrossRef]
  28. Report on Quality of Statistical Data from EPCs (in Greek). Available online: http://ypeka.gr/Default.aspx?tabid=907&language=el-GR (accessed on 29 January 2020).
  29. Mathew, P.A.; Dunn, L.N.; Sohn, M.D.; Mercado, A.; Custudio, C.; Walter, T. Big-data for building energy performance: Lessons from assembling a very large national database of building energy use. Appl. Energy 2015, 140, 85–93. [Google Scholar] [CrossRef] [Green Version]
  30. Tukey, J.W. Exploratory Data Analysis. Addison-Wesley Publishing Company Reading, Mass.—Menlo Park, Cal., London, Amsterdam, Don Mills, Ontario, Sydney 1977, XVI, 688 S. Biom. J. 1981, 23, 413–414. [Google Scholar] [CrossRef]
  31. Skew and Kurtosis. 2 Important Statistics Terms You Need to Know in Data Science. Available online: https://codeburst.io/2-important-statistics-terms-you-need-to-know-in-data-science-skewness-and-kurtosis-388fef94eeaa (accessed on 29 January 2020).
  32. Sprent, P. Applied Nonparametric Statistical Methods, 2nd ed.; Chapman and Hall: London, UK, 1993. [Google Scholar]
  33. Homogeneity of Variance Tests. Available online: www.unistat.com/guide/homogeneity-of-variance-tests/ (accessed on 29 January 2020).
  34. Levene, H. Contributions to Probability and Statistics: Essays in Honor of Harold Hotelling; Olkin, I., Ed.; Stanford University Press: Redwood City, CA, USA, 1960; pp. 278–292. [Google Scholar]
  35. Devore, J. Probability and Statistics for Engineering and the Sciences, 3rd ed.; Brooks/Cole: Pacific Grove, CA, USA, 1991. [Google Scholar]
  36. Droutsa, K.G.; Kontoyiannidis, S.; Dascalaki, E.G.; Balaras, C.A. Mapping the Energy Performance of Hellenic Residential Buildings from EPC (energy performance certificate) Data. Energy 2016, 98, 284–295. [Google Scholar] [CrossRef]
  37. National Plan for Energy and Climate (in Greek). Available online: www.opengov.gr/minenv/?p=10155 (accessed on 29 January 2020).
Figure 1. Time evolution of final energy consumption in residential (circles) and nonresidential (NR) (triangles) buildings for EU-28 (solid line, primary axis) and Greece (dashed line, secondary axis). The percentages refer to the corresponding increase of the final consumption in 2017 compared to 1990. (Data source [3]).
Energies 13 02100 g001
Figure 2. The main steps of the method.
Energies 13 02100 g002
Figure 3. Distribution of (a) number of buildings and (b) total floor area of buildings in the nonresidential database from the certificates (NR Dbase) and the national building stock data (NR BS).
Energies 13 02100 g003aEnergies 13 02100 g003b
Figure 4. Spatial distribution of nonresidential buildings in the database from the certificates (NR Dbase) and the national building stock data (NR BS) (a) to climate zones and (b) to NUTS1 classification.
Energies 13 02100 g004
Figure 5. Weighted average primary energy use intensities (EUIp) per end use (columns, primary axis) and CO2 emissions (diamonds, secondary axis) for the seven building categories (BCI-VII).
Energies 13 02100 g005
Figure 6. The distribution of NR buildings in energy classes (a) and the weighted energy score of NR buildings (b).
Energies 13 02100 g006
Figure 7. Calculated maximum, minimum and average (diamond) total primary energy use intensity for the different energy classes.
Energies 13 02100 g007
Figure 8. Calculated average primary energy use intensity per energy class (from A+ to G) for the various building uses (1 to 30, defined in Table 1).
Energies 13 02100 g008
Figure 9. Calculated average total primary energy use intensity for the various building uses (diamond) and for the reference building of each BU (cross). The weighted average for the various building categories is presented with the green solid line and for the reference buildings with the orange dash line.
Energies 13 02100 g009
Table 1. Energy use (kWh/m2) and CO2 emission (kg/m2) intensities for the different building categories and building uses in the NR Dbase.
Building Category Building Use# Bldgs/Heated Area (m2)EUIp,H
Av [Min–Max]
EUIp,C
Av [Min–Max]
EUIp,DHW
Av [Min–Max]
EUIp,L
Av [Min–Max]
EUIp
Av [Min–Max]
CO2 Emissions
Av [Min–Max]
BCI. Temporal Residence6393/3,778,97857.2129.540.5170.3397.3127.9
BU1—Hotel (annual)940/1,066,594132.5 [0.1–586.2]143.5 [5.5–451.8]70.2 [0.0–287.9]203.3 [2.9–689.0]549.2 [102.0–1347.6]172.9 [25.4–445.2]
BU2-—Hotel (summer)2270/1,844,0697.4 [0.1–29.7]120.0 [8.9–453.5]24.2 [0.0–122.4]143.9 [12.7–393.0]259.4 [66.4–797.9]97.0 [15.2–272.4]
BU3—Guest house (annual)992/279,233168.0 [0.5–665.4]146.7 [1.7–503.3]64.0 [0.0–288.1]224.4 [12.2–583.6]602.8 [67.2–1584.0]191.1 [31.9–540.7]
BU4-—Guest house (summer)2073/524,4468.7 [0.1–35.2]123.3 [3.5–425.9]22.0 [0.0–117.1]159.7 [2.9–449.9]313.4 [11.9–849.3]103.3 [18.1–289.9]
BU5—Guest house (winter)9/3882258 [117.2–503.4]6.0 [1.0–17.0]22.9 [13.2–37.0]146.2 [118.2–204.3]433.6 [263.1–659.3]128.5 [79.2–177.5]
BU6—Boarding school/Quarters/Dormitory109/60,754143.9 [0.5–763.7]152.2 [8.1–403.7]63.4 [0.0–329.9]238.6 [80.4–475.8]597.5 [155.8–1414.5]194.6 [52.7–497.7]
BCII. Public assembly5955/1,573,991206.6257.4101.2130.9695.8220.2
BU7—Restaurant2597/439,908235.5 [0.4–905.5]272.0 [3.2–766.1]165.8 [0.0–410.8]140.2 [0.2–500.1]813.4 [150.1–1945.7]257.1 [51.0–660.9]
BU8—Pastry/Coffee shop2153/252,214353.5 [0.1–1405.1]321.7 [5.7–938.2]49.8 [0.0–81.5]174.9 [0.3–564.5]899.7 [100.8–2243.5]277.6 [33.4–1294.5]
BU9—Night/Music hall428/154,744104.5 [0.2–371.5]121.1 [8.8–408.4]53.5 [0.0–86.0]45.4 [5.8–208.7]324.5 [74.6–707.3]103.5 [24.9–239.4]
BU10—Theater/Cinema50/29,467103.8 [14.9–337.6]206.5 [36.9–431.2] 74.3 [22.7–290.4]384.6 [183.3–701.8]126.8 [62.6–239.6]
BU11—Exhibition hall/Museum120/135,48779.0 [3.1–317.8]166.0 [8.4–414.0] 68.1 [4.8–210.3]312.5 [65.8–632.5]102.6 [22.4–210.5]
BU12—Conference hall/Auditorium/Courthouse16/23,70371.3 [14.0–211.9]135.2 [51.1–296.1] 105.1 [40.9–254.2]311.6 [145.0–657.3]104.0 [48.4–211.3]
BU13—Bank69/43,74866.7 [4.4–215.4]77.7 [4.4–229.6] 114.4 [17.7–219.8]257.8 [69.6–487.1]85.5 [23.7–160.4]
BU14—Multi-purpose venue278/160,915107.1 [0.3–396.9]138.0 [5.3–432.0] 83.1 [1.3–250.8]328.2 [58.6–740.8]106.9 [20.0–252.9]
BU15—Indoor Sports hall/Swimming Pool244/333,805241.4 [0.1–853.4]384.0 [41.2–792.5]196.0 [0.0–704.6]182.6 [48.3–455.0]1003.9 [162.4–1971.9]318.6 [55.4–673.1]
BCIII. Educational1336/1,645,060105.112.5 64.2181.653.3
BU16—Kindergarten152/45,203134.8 [12.2–427.6]4.1 [0.2–13.9] 49.6 [15.7–99.4]177.6 [41.5–491.1]50.5 [14.0–159.8]
BU17—Primary/Secondary School898/1,360,392107.8 [1.8–421.7]8.8 [0.0–38.6] 55.6 [14.1–118.3]172.0 [41.7–647.4]49.2 [13.9–150.9]
BU18—University/College/Lecture rooms116/192,89587.6 [5.5–316.8]40.4 [3.2–111.7] 126.0 [17.8–308.8]254.0 [51.3–567.2]82.7 [17.5–192.3]
BU19—Private cram school/Conservatory170/46,57180.7 [1.4–326.6]10.9 [0.0–45.4] 75.9 [11.8–150.9]167.2 [26.2–396.1]53.6 [8.9–128.1]
BCIV. Health and Social Welfare796/2,068,699221.3212.327.7197.0657.8205.6
BU20—Hospital/Clinic161/1,644,060234.1 [4.3–771.6]232.5 [37.2–820.1]28.7 [0.0–112.4]205.4 [37.7–446.0]700.3 [222.4–1707.0]218.9 [69.9–555.0]
BU21—Health care/Rural outpatient clinic/Consultation room230/162,686154.8 [9.2–630.9]121.5 [8.3–302.5]13.6 [0.0–41.8]157.5 [8.3–318.5]446.7 [101.8–1009.4]141.3 [34.8–328.9]
BU22—Foundling hospital/Nursing home/Asylum119/141,938255.0 [8.6–822.6]208.4 [28.4–577.5]37.6 [0.0–159.5]256.9 [78.2–621.1]757.1 [219.5–1620.3]235.4 [66.5–530.8]
BU23—Nursery286/120,01695.7 [1.7–345.9]63.7 [0.7–208.4]20.6 [0.0–70.8]63.8 [10.8–142.3]243.5 [50.7–548.1]75.9 [17.3–165.8]
BCV. Justice/public order/safety22/38,474160.6127.4 278.5566.5182.6
BU24—Police station22/38,474160.6 [15.7–637.2]127.4 [37.2–222.8] 278.5 [60.8–579.1]566.5 [288.2–896.3]182.6 [83.7–278.1]
BCVI. Commercial11,564/3,293,795143.2159.91.9148.6453.4147.6
BU25—Shopping mall/Large retail building435/759,46563.9 [0.9–312.0]141.7 [3.1–504.8] 149.4 [2.6–389.4]354.6 [54.6–822.6]118.6 [26.7–280.8]
BU26—Small retail building/Drugstore11,022/2,508,652167.1 [0.1–729.6]165.3 [0.1–588.4] 148.3 [0.2–342.3]480.5 [63.5–1399.8]155.5 [9.9–477.1]
BU27—Fitness center53/22,397138.0 [1.3–575.4]173.7 [8.6–507.0]268.2 [0.1–565.3]164.1 [29.3–335.4]744.1 [248.8–1325.9]237.0 [79.2–452.6]
BU28—Barber shop/Hair salon54/3280239.6 [24.3–577.0]156.4 [16.5–441.9]66.4 [0.0–105.3]146.3 [45.0–335.4]608.8 [320.8–1058.1]195.7 [78.9–361.2]
BCVII. Office/Library2728/2,308,452100.7121.2 354.3115.4
BU29—Office2706/2,292,503100.5 [0.4–483.4]121.4 [0.8–438.5] 133.2 [5.2–299.7]354.7 [29.7–952.8]115.5 [16.7–325.3]
BU30—Library18/15,949130.5 [10.9–421.9]99.7 [24.8–250.2] 81.4 [38.6–148.3]303.5 [144.6–581.0]94.9 [49.3–160.0]
NR Dbase28,970/14,707,447128.0147.225.5147.5448.0142.9
Empty cells refer to BUs that have no DHW in the calculations according to the national regulation.
Table 2. Time evolution of number of EPCs and calculated average total primary energy use for the different building categories and building uses in the NR Dbase.
Consecutive Time Bands
BCUpto2011Upto2012Upto2013Upto2014Upto2015Upto2016Upto2017Upto2018Upto2019
BUNumber of Buildings/EUIp ± Standard Error of the Mean (kWh/m2)
BCI57/399.4 ± 32.0654/428.0 ± 8.01686/407.6 ± 4.82112/405.3 ± 4.22394/401.1 ± 3.93328/407.6 ± 3.44587/404.8 ± 2.95465/399.0 ± 2.66393/397.3 ± 2.4
BU111/658.5 ± 68.398/605.1 ± 23.4208/589.5 ± 15.1268/581.9 ± 12.9324/577.1 ± 11.7484/565.7 ± 9.2610/566.5 ± 8.4758/551.9 ± 7.6940/549.2 ± 6.9
BU240/265.7 ± 19.5243/291.2 ± 7.8651/294.3 ± 4.1814/294.8 ± 3.6943/291.1 ± 3.41181/292.2 ± 3.01686/295.0 ± 2.41947/294.4 ± 2.32270/295.4 ± 2.1
BU32/739.4 ± 193.6118/608.5 ± 18.2281/619.9 ± 11.6343/619.6 ± 10.7384/613.9 ± 10.1559/603.4 ± 8.8743/600.4 ± 7.7874/601.6 ± 7.1992/602.8 ± 6.7
BU43/315.8 ± 35.2190/326.8 ± 7.9535/327.5 ± 4.6670/324.0 ± 4.1724/321.0 ± 3.91075/314.7 ± 3.21468/314.0 ± 2.81789/315.1 ± 2.62073/313.4 ± 2.4
BU5 1/659.34/437.9 ± 100.84/437.9 ± 100.84/437.9 ± 100.84/437.9 ± 100.89/433.6 ± 46.69/433.6 ± 46.6
BU61/640.05/575.9 ± 93.310/593.5 ± 68.113/587.4 ± 58.215/557.5 ± 57.225/585.7 ± 53.976/563.3 ± 25.088/581.0 ± 23.2109/597.5 ± 21.9
BCII50/863.8 ± 67.71053/741.3 ± 12.22073/710.4 ± 8.02473/703.0 ± 7.32743/692.0 ± 6.83726/672.8 ± 5.94581/662.2 ± 5.25249/695.1 ± 5.15955/695.8 ± 4.9
BU721/969.1 ± 108.9452/901.2 ± 16.5920/844.6 ± 9.91095/835.2 ± 8.81195/826.6 ± 8.41602/819.0 ± 7.01996/807.1 ± 6.02283/811.8 ± 5.72597/813.4 ± 5.4
BU8 17/995.8 ± 144.5407/919.5 ± 20.0782/881.7 ± 12.4914/874.4 ± 11.2993/869.0 ± 10.61384/863.5 ± 8.61687/863.1 ± 7.61897/881.8 ± 7.42153/899.7 ± 7.2
BU95/286.6 ± 30.1104/336.8 ± 11.1208/324.0 ± 7.8242/319.1 ± 7.0252/318.6 ± 6.9324/318.4 ± 5.8369/317.9 ± 5.5398/321.1 ± 5.3428/324.5 ± 5.3
* BU10 8/387.4 ± 23.813/344.7 ± 21.619/389.1 ± 30.220/390.6 ± 28.730/366.0 ± 21.738/372.6 ± 19.844/375.8 ± 17.950/384.6 ± 16.8
* BU111/217.615/342.1 ± 26.828/314.5 ± 24.834/322.9 ± 23.945/323.8 ± 19.562/306.7 ± 16.480/310.5 ± 14.3103/315.9 ± 12.6120/312.5 ± 11.6
* BU12 1/355.14/287.9 ± 68.64/287.9 ± 68.66/286.4 ± 47.27/271.6 ± 42.511/273.0 ± 29.614/313.7 ± 37.716/311.6 ± 35.1
* BU133/10.3 ± 68.76/293.0 ± 33.910/289.6 ± 20.316/287.6 ± 17.124/287.6 ± 16.537/271.8 ± 13.655/262.3 ± 10.159/261.8 ± 9.669/257.8 ± 9.5
* BU14 26/298.6 ± 21.554/301.5 ± 14.077/297.9 ± 11.4104/305.5 ± 10.3150/308.5 ± 8.7191/311.6 ± 7.9234/318.4 ± 7.8278/328.2 ± 7.6
BU153/1133.7 ± 68.834/1019.1 ± 48.454/979.8 ± 38.372/1001.2 ± 34.1104/970.1 ± 27.3130/977.7 ± 23.5154/969.5 ± 22.2217/1009.8 ± 21.4244/1003.9 ± 20.6
BCIII15/224.2 ± 27.3150/176.8 ± 5.5247/179.3 ± 4.6381/187.3 ± 3.8657/174.8 ± 2.8840/171.1 ± 2.5948/172.1 ± 2.31183/179.7 ± 2.21336/181.6 ± 2.1
* BU161/206.16/205.8 ± 34.613/167.5 ± 20.226/170.9 ± 15.359/166.1 ± 9.487/169.8 ± 9.099/165.9 ± 8.5133/182.0 ± 8.2152/177.6 ± 7.4
* BU1713/186.0 ± 26.5118/169.6 ± 5.7154/169.2 ± 5.1261/179.1 ± 4.5491/169.1 ± 3.3594/163.6 ± 2.9650/164.3 ± 2.8816/172.8 ± 2.7898/172.0 ± 2.6
* BU181/290.810/252.5 ± 20.326/257.2 ± 21.631/251.0 ± 18.536/245.7 ± 16.959/253.6 ± 13.375/255.3 ± 11.491/254.1 ± 10.3116/254.0 ± 8.7
* BU19 16/177.3 ± 15.454/158.9 ± 6.463/161.7 ± 6.671/162.3 ± 6.0100/165.3 ± 5.6124/162.9 ± 4.9143/165.1 ± 4.5170/167.2 ± 4.4
BCIV10/793.5 ± 147.760/555.7 ± 44.1145/551.6 ± 19.9211/572.7 ± 20.4302/571.4 ± 14.5412/607.3 ± 13.3545/607.2 ± 11.4683/633.8 ± 10.2796/657.8 ± 9.5
BU202/265.1 ± 19.13/471.7 ± 206.910/529.6 ± 63.725/592.0 ± 57.947/621.1 ± 40.565/650.0 ± 34.292/657.0 ± 28.0129/673.4 ± 24.0161/700.3 ± 21.1
BU211/245.617/460.1 ± 43.138/470.1 ± 29.057/464.3 ± 24.181/463.2 ± 17.9112/456.8 ± 15.7164/437.6 ± 11.9203/448.5 ± 10.4230/446.7 ± 10.1
BU224/993.8 ± 162.810/865.9 ± 90.131/815.8 ± 47.739/776.5 ± 41.648/747.1 ± 35.469/698.4 ± 33.586/721.6 ± 30.5112/753.1 ± 26.1119/757.1 ± 25.5
BU233/219.1 ± 23.730/248.3 ± 14.266/258.1 ± 10.890/257.7 ± 8.9126/251.8 ± 8.2166/247.2 ± 7.0203/241.4 ± 6.5239/245.5 ± 6.1286/243.5 ± 5.6
BCV 5/560.4 ± 90.48/578.4 ± 72.88/578.4 ± 72.89/575.2 ± 64.310/558.2 ± 60.015/595.5 ± 43.319/586.4 ± 35.722/566.5 ± 35.0
* BU24 5/560.4 ± 90.48/578.4 ± 72.88/578.4 ± 72.89/575.2 ± 64.310/558.2 ± 60.015/595.5 ± 43.319/586.4 ± 35.722/566.5 ± 35.0
BCVI43/327.0 ± 20.01006/423.7 ± 4.62792/429.2 ± 2.63576/427.3 ± 2.44017/419.1 ± 2.36351/428.6 ± 1.98555/432.7 ± 1.79876/443.2 ± 1.611564/453.4 ± 1.6
* BU259/250.9 ± 14.548/342.7 ± 15.1120/363.9 ± 11163/352.6 ± 10.4191/344.7 ± 9.6262/345.6 ± 8.1354/348.6 ± 7.1388/354.2 ± 7.0435/354.6 ± 6.7
* BU2634/378.8 ± 28.2950/444.1 ± 5.12646/446.2 ± 2.93382/446 ± 2.63795/443.4 ± 2.46035/452.5 ± 28129/457.9 ± 1.89396/469.3 ± 1.811022/480.5 ± 1.8
BU27 5/568.4 ± 110.917/647.3 ± 45.520/656.4 ± 41.920/656.4 ± 41.929/666.5 ± 35.239/662.6 ± 28.946/711.0 ± 33.053/744.1 ± 34.3
BU28 3/511.4 ± 116.29/640 ± 63.111/624.5 ± 53.511/624.5 ± 53.525/593.6 ± 37.433/578.2 ± 32.846/601.8 ± 28.554/608.8 ± 27.0
BCVII9/293.5 ± 42.5251/335.3 ± 7.7577/341.7 ± 5.0769/338.5 ± 4.1974/334.0 ± 3.71601/345.6 ± 2.82000/346.7 ± 2.52314/350.1 ± 2.42724/354.3 ± 2.3
* BU299/293.5 ± 42.9249/335.2 ± 7.6571/341.8 ± 5.3762/338.5 ± 4.4963/334.1 ± 3.91588/345.9 ± 3.21986/347.1 ± 2.92300/350.4 ± 2.82706/354.7 ± 2.6
* BU30 2/360.6 ± 87.86/334 ± 35.97/333.4 ± 30.311/322.3 ± 23.213/310.5 ± 22.814/299.5 ± 23.814/299.5 ± 23.818/303.5 ± 27.5
* BUs that have no DHW in the calculations according to the national regulation.
Table 3. Time evolution of calculated average primary energy use for space heating for the different building categories and building uses in the NR Dbase.
Consecutive Time Bands
BCUpto2011Upto2012Upto2013Upto2014Upto2015Upto2016Upto2017Upto2018Upto2019
BUEUIp,H ± Standard Error of the Mean (kWh/m2)
BCI98.5 ± 19.270.2 ± 3.859.4 ± 2.260.2 ± 1.958.8 ± 1.861.7 ± 1.559.8 ± 1.357.7 ± 1.257.2 ± 1.1
BU1228.5 ± 46.7146.8 ± 12.2143.2 ± 8.1145.3 ± 6.8140.7 ± 6.1133.3 ± 4.7136.5 ± 4.3132.4 ± 3.8132.5 ± 3.5
BU25.7 ± 0.68.1 ± 0.47.1 ± 0.27 ± 0.27 ± 0.27 ± 0.27.2 ± 0.17.2 ± 0.17.4 ± 0.1
BU3126 ± 31.2172.2 ± 10.8177.4 ± 7.6180.5 ± 7.2177.6 ± 6.6173.8 ± 5.6170.2 ± 4.8167.4 ± 4.4168 ± 4.2
BU414.8 ± 6.69.5 ± 0.58.7 ± 0.38.4 ± 0.28.2 ± 0.28.2 ± 0.28.5 ± 0.28.5 ± 0.28.7 ± 0.1
BU5 503.4284.1 ± 96.7284.1 ± 96.7284.1 ± 96.7284.1 ± 96.7258.5 ± 44.5258.5 ± 44.5
BU6376.7187.7 ± 58.1169.8 ± 33.7159 ± 31.2156.6 ± 28.9195.8 ± 34.4131 ± 15.8136.8 ± 14.5143.9 ± 13.4
BCII259.1 ± 36.9230.0 ± 6.2210.0 ± 3.9205.9 ± 3.5199.6 ± 3.2195.3 ± 2.7192.3 ± 2.4203.5 ± 2.3206.6 ± 2.2
BU7314.4 ± 57.1273.3 ± 9.0237.7 ± 5.7233.6 ± 5.1230.3 ± 4.8227.5 ± 4.0222.6 ± 3.5229.8 ± 3.4235.5 ± 3.3
BU8 463.9 ± 102.0382.5 ± 15.1347.1 ± 9.4339.4 ± 8.5336.5 ± 8.1331.8 ± 6.6330.2 ± 5.8341.1 ± 5.7353.5 ± 5.5
BU966.2 ± 30.9106.1 ± 6.9100.1 ± 4.998.3 ± 4.497.5 ± 4.398 ± 3.898.1 ± 3.6101.4 ± 3.6104.5 ± 3.6
BU10 124.5 ± 14.0100.6 ± 13.4107.5 ± 12.0103.8 ± 12.094.1 ± 8.8102.8 ± 10.6102.8 ± 9.3103.8 ± 8.3
BU1131.593.1 ± 19.680 ± 11.683.6 ± 12.084.3 ± 9.479 ± 7.479.9 ± 6.879.7 ± 6.079.1 ± 5.3
BU12 70.949.3 ± 9.749.3 ± 9.757.2 ± 13.251 ± 12.758.8 ± 9.071.4 ± 13.271.3 ± 12.2
BU13104.8 ± 34.387.2 ± 22.071.8 ± 14.975.4 ± 13.675.4 ± 10.971.9 ± 9.367.8 ± 7.068.1 ± 6.666.7 ± 6.0
BU14 81.7 ± 10.285.8 ± 7.784.5 ± 6.289.2 ± 5.692.6 ± 4.994.9 ± 4.6100.8 ± 4.8107.1 ± 4.8
BU15138.1 ± 66.9228.4 ± 25.3208.2 ± 19.0216.2 ± 16.6212.5 ± 13.3215.8 ± 12.2216.8 ± 11.3245 ± 11.3241.4 ± 10.6
BCIII105.9 ± 20.2101.3 ± 5.496.9 ± 4.0109.0 ± 3.7103.5 ± 2.698.6 ± 2.398.7 ± 2.1106.4 ± 2.1105.1 ± 1.9
BU16138.5149.5 ± 36.7117.8 ± 21.0121.9 ± 15.3113 ± 8.8116 ± 8.4112.3 ± 7.9129.2 ± 8.0123.8 ± 7.2
BU17112.6 ± 24.9104 ± 5.8101.1 ± 5.1115.4 ± 4.5107 ± 3.3100.6 ± 2.9100.9 ± 2.9108.8 ± 2.8107.8 ± 2.6
BU1893.572.1 ± 16.475.2 ± 9.871.8 ± 8.669 ± 7.678.3 ± 7.379 ± 6.484.2 ± 6.287.6 ± 5.5
BU19 85.3 ± 17.371.6 ± 6.574.7 ± 6.876.4 ± 6.279 ± 5.675.6 ± 4.977.3 ± 4.580.7 ± 4.4
BCIV449.7 ± 102.9253.5 ± 31.0183.6 ± 13.5194.1 ± 10.5203.9 ± 7.7199.3 ± 6.5186.9 ± 5.5206.0 ± 5.0221.3 ± 4.8
BU20133.7 ± 3.1197.5 ± 63.9150.3 ± 26.2193.1 ± 27.9219.9 ± 21.3209.4 ± 16.8196.5 ± 13.9215.7 ± 12.5234.1 ± 12.0
BU2167.7198.8 ± 40.2191.7 ± 26.2185.4 ± 20.1177.1 ± 14.8163.4 ± 12.7141.3 ± 9.7153 ± 8.8154.8 ± 8.5
BU22576.1 ± 133.0421 ± 100.1296.6 ± 41.5281.4 ± 34.0261.3 ± 28.6233.4 ± 22.8240.5 ± 20.7254.4 ± 17.8255 ± 17.5
BU2367.2 ± 10.890.8 ± 11.198.6 ± 8.8101.2 ± 7.1103 ± 6.497.8 ± 5.494.3 ± 4.897.5 ± 4.595.7 ± 4.1
BCV 234 ± 42.8263.8 ± 62263.8 ± 62.0246.3 ± 57.4228.2 ± 54.5190.9 ± 40.5177.1 ± 33.0160.6 ± 29.9
BU24 234 ± 42.8263.8 ± 62263.8 ± 62.0246.3 ± 57.4228.2 ± 54.5190.9 ± 40.5177.1 ± 33.0160.6 ± 29.9
BCVI118.5 ± 12.4135.7 ± 3.1126.1 ± 1.8123.5 ± 1.6118.7 ± 1.4124.9 ± 1.2127.0 ± 1.0135.1 ± 1.1143.2 ± 1.1
BU25143.3 ± 22.692.8 ± 9.978.7 ± 5.968.1 ± 4.764.3 ± 4.163.9 ± 3.763 ± 3.263.8 ± 3.163.9 ± 2.9
BU26101.6 ± 16.3146.9 ± 4.0140.1 ± 2.1138.8 ± 1.9137.8 ± 1.8143.9 ± 1.5148.1 ± 1.3157.7 ± 1.3167.1 ± 1.3
BU27 165.6 ± 37.7127.9 ± 22122.1 ± 19.2122.1 ± 19.2110.4 ± 16.9101.1 ± 13.1117.9 ± 13.7138.0 ± 17.1
BU28 201.4 ± 63.1250.6 ± 42.6240.3 ± 37.9240.3 ± 37.9237.1 ± 27.5220.7 ± 23.9230.4 ± 20.3239.6 ± 20.4
BCVII110.5 ± 39.886.1 ± 3.885.9 ± 2.584.9 ± 2.284.1 ± 2.090.8 ± 1.693.2 ± 1.596.0 ± 1.5100.7 ± 1.4
BU29110.5 ± 3985.7 ± 5.085.6 ± 3.484.6 ± 2.983.6 ± 2.690.6 ± 2.193 ± 1.995.9 ± 1.8100.5 ± 1.8
BU30 178.2 ± 129.3123.9 ± 41.2120.3 ± 35.0137 ± 27.2125.5 ± 24.1119.6 ± 23.1119.6 ± 23.1130.5 ± 26.2
Table 4. Time evolution of calculated average primary energy use for space cooling for the different building categories and building uses in the NR Dbase.
Consecutive Time Bands
BCUpto2011Upto2012Upto2013Upto2014Upto2015Upto2016Upto2017Upto2018Upto2019
BUEUIp,C ± Standard Error of the Mean (kWh/m2)
BCI111.0 ± 9.5129.9 ± 2.6124.4 ± 1.5123.4 ± 1.4122.7 ± 1.3122.5 ± 1.1123.4 ± 0.9126.3 ± 0.9129.5 ± 0.8
BU1183.9 ± 33.8151 ± 7.4141.8 ± 4.7140.2 ± 4.3142.1 ± 4.0139.8 ± 3.2138.9 ± 2.8140.9 ± 2.6143.5 ± 2.4
BU280.7 ± 10.4114.7 ± 4.7111.9 ± 2.6111.3 ± 2.3109.2 ± 2.1109.2 ± 1.9113 ± 1.6115.9 ± 1.5120 ± 1.4
BU391.9 ± 1.0136 ± 7.5137.6 ± 4.2135.8 ± 3.8139.4 ± 3.8137.1 ± 3.1137.9 ± 2.8143.3 ± 2.7146.7 ± 2.5
BU4130.4 ± 25.0124.4 ± 4.4125.3 ± 2.7122.8 ± 2.4122 ± 2.3117.7 ± 1.9117.7 ± 1.6121.9 ± 1.5123.3 ± 1.4
BU5 2.82.1 ± 0.22.1 ± 0.22.1 ± 0.22.1 ± 0.26 ± 2.16 ± 2.1
BU6136.8148.2 ± 53.0152.8 ± 26.2178.9 ± 25.8161.6 ± 25.2156.2 ± 19.5132.4 ± 7.9142.9 ± 7.8152.2 ± 7.1
BCII217.8 ± 23.7263.7 ± 5.0254.7 ± 3.3251.6 ± 3.0250.8 ± 2.8245.1 ± 2.4241.4 ± 2.1255.1 ± 2.0257.4 ± 1.9
BU7256.8 ± 30.0295.3 ± 7.0276.2 ± 4.3272.2 ± 3.8270.2 ± 3.6266.9 ± 3263.8 ± 2.6269.1 ± 2.4272 ± 2.3
BU8 344 ± 51.2321.4 ± 8.2309.8 ± 5.3309.1 ± 4.8307.6 ± 4.5306.4 ± 3.7307.5 ± 3.3315.7 ± 3.2321.7 ± 3.0
BU9128 ± 16.7125 ± 6.9120.2 ± 4.7118.7 ± 4.3119 ± 4.2119.3 ± 3.6120 ± 3.4120.3 ± 3.3121.1 ± 3.2
BU10 213.1 ± 12.6169.3 ± 20.0190 ± 17.7185.3 ± 17.5192 ± 13.6197.4 ± 12.3197.9 ± 12.1206.6 ± 12.1
BU11101.5192.5 ± 16.4181.3 ± 19.3180.6 ± 17.6175.3 ± 14.9161.6 ± 12.3164 ± 10.8166.1 ± 9.3166 ± 8.5
BU12 163.2152.9 ± 52.3152.9 ± 52.3148.4 ± 34.4139.2 ± 30.5132.5 ± 21.8134.7 ± 17.9135.2 ± 17.2
BU1381.7 ± 13.984.5 ± 11.991.2 ± 8.885.2 ± 8.193.3 ± 9.483.9 ± 6.979 ± 5.179.9 ± 4.977.7 ± 4.6
BU14 135.5 ± 16.0132.9 ± 9.1125.9 ± 7.3129.9 ± 6.3131.3 ± 5.5129.8 ± 4.7133.8 ± 4.4138 ± 4.1
BU15141 ± 15.9368.7 ± 28.7369.5 ± 22.1373.2 ± 18.7367.1 ± 14.5374 ± 12.7370.4 ± 11.6380.4 ± 10.0384 ± 9.8
BCIII41.1 ± 8.812.9 ± 1.513.9 ± 1.111.5 ± 0.89.9 ± 0.510.6 ± 0.410.8 ± 0.411.0 ± 0.412.5 ± 0.4
BU1610.15.7 ± 1.64.9 ± 0.93.9 ± 0.53.3 ± 0.33.8 ± 0.34 ± 0.33.9 ± 0.24.1 ± 0.2
BU1718.2 ± 2.411.3 ± 0.711.1 ± 0.68.1 ± 0.47.7 ± 0.38.3 ± 0.38.4 ± 0.38.7 ± 0.28.8 ± 0.2
BU1881.332.2 ± 6.935.3 ± 4.835.9 ± 4.135.6 ± 3.736.4 ± 2.937.3 ± 2.537.8 ± 2.340.4 ± 2.1
BU19 9.9 ± 1.711.2 ± 0.911.1 ± 0.810.4 ± 0.810.8 ± 0.711 ± 0.710.9 ± 0.610.9 ± 0.5
BCIV152.8 ± 34.7129.0 ± 11.6170.3 ± 7.8187.5 ± 10.3177.9 ± 7.4195.3 ± 6.6200.5 ± 5.7205.2 ± 4.8212.3 ± 4.4
BU2051.3 ± 3.3137.7 ± 86.5189.3 ± 30.6206 ± 29.9200.2 ± 18.7217.6 ± 16.4227.2 ± 13.7225.5 ± 10.8232.5 ± 9.6
BU2113.2113.1 ± 14.6126.4 ± 11.9124.5 ± 9.7118.6 ± 7.4121.8 ± 6.4124.2 ± 5.0122.7 ± 4.4121.5 ± 4.1
BU22191.4 ± 49.9186.7 ± 27.1220.2 ± 16.8207.9 ± 14.4204.7 ± 11.9196.3 ± 12.3199 ± 10.7209.4 ± 8.9208.4 ± 8.5
BU2355 ± 18.166.4 ± 7.570.4 ± 5.267.6 ± 4.961.9 ± 4.062.8 ± 3.462.5 ± 3.062.9 ± 2.763.7 ± 2.4
BCV 110.6 ± 26.9108.4 ± 18.2108.4 ± 18.2105.9 ± 16.2107.9 ± 14.7125 ± 12.7128.7 ± 10.4127.4 ± 10.1
BU24 110.6 ± 26.9108.4 ± 18.2108.4 ± 18.2105.9 ± 16.2107.9 ± 14.7125 ± 12.7128.7 ± 10.4127.4 ± 10.1
BCVI116.1 ± 13.1147.1 ± 2.5151.8 ± 1.4152.0 ± 1.3149.0 ± 1.2151.5 ± 1.0153.4 ± 0.9157.0 ± 0.8159.9 ± 0.8
BU2588.4 ± 8.6123.2 ± 8.6136.5 ± 6.2135.9 ± 6.4131.7 ± 5.8134 ± 4.8139.8 ± 4.5142.3 ± 4.3141.7 ± 4.1
BU26134.9 ± 19.1153.3 ± 2.8156.4 ± 1.7156.5 ± 1.5155.1 ± 1.4157.1 ± 1.1157.9 ± 1.0161.7 ± 0.9165.3 ± 0.9
BU27 175.9 ± 52.4147.7 ± 23.4147.6 ± 20.7147.6 ± 20.7146 ± 14.7148.9 ± 12.2165.1 ± 13.2173.7 ± 13.3
BU28 116.4 ± 68.3174.5 ± 31.3167.4 ± 25.7167.4 ± 25.7135.5 ± 16.7138.9 ± 14.2153.8 ± 12.7156.4 ± 11.4
BCVII77.5 ± 20.4120.6 ± 4.7121.8 ± 3.4118.4 ± 2.7115.5 ± 2.3117.6 ± 1.6116.7 ± 1.4119.4 ± 1.3121.2 ± 1.2
BU2977.5 ± 21.8120.7 ± 4.6121.8 ± 3.1118.4 ± 2.5115.6 ± 2.2117.6 ± 1.7116.8 ± 1.5119.5 ± 1.5121.4 ± 1.4
BU30 82.6 ± 36.7129.3 ± 27.1122.7 ± 23.9103.9 ± 17.7106.1 ± 16.6103.8 ± 15.5103.8 ± 15.599.7 ± 12.2
Table 5. Time evolution of calculated average primary energy use for DHW for the different building categories and building uses in the NR Dbase.
Consecutive Time Bands
BCUpto2011Upto2012Upto2013Upto2014Upto2015Upto2016Upto2017Upto2018Upto2019
BUEUIp,DHW ± Standard Error of the Mean (kWh/m2)
BCI62.4 ± 8.563.9 ± 2.146.8 ± 1.145.7 ± 1.044.3 ± 0.943.8 ± 0.741.9 ± 0.641.0 ± 0.540.5 ± 0.5
BU1105.2 ± 25.990.5 ± 6.973.3 ± 4.275.1 ± 3.673.3 ± 3.271.3 ± 2.568.8 ± 2.169 ± 1.970.2 ± 1.7
BU250.3 ± 3.750.1 ± 1.934.9 ± 1.132.4 ± 0.930.6 ± 0.828.9 ± 0.726.7 ± 0.625.4 ± 0.524.2 ± 0.5
BU3197.3 ± 8.985.6 ± 6.371.6 ± 3.769.2 ± 3.265.8 ± 2.961.5 ± 2.462.7 ± 2.064.2 ± 1.964 ± 1.7
BU460.3 ± 26.934.6 ± 2.126.3 ± 1.125.3 ± 0.925.6 ± 0.923.2 ± 0.722.7 ± 0.622.2 ± 0.522 ± 0.5
BU5 21.021.4 ± 5.521.4 ± 5.521.4 ± 5.521.4 ± 5.522.9 ± 2.822.9 ± 2.8
BU640.960.8 ± 18.145.9 ± 10.938.9 ± 9.238.7 ± 8.740.3 ± 9.069.9 ± 7.467.2 ± 6.663.4 ± 5.8
BCII245.6 ± 35.7119.2 ± 3.4113.0 ± 2.1111.0 ± 1.9105.5 ± 1.799.4 ± 1.496.2 ± 1.2102.8 ± 1.2101.2 ± 1.1
BU7217 ± 20.3185.9 ± 3.4175.4 ± 2.2173.5 ± 2171 ± 1.9168.3 ± 1.6166.7 ± 1.4166.3 ± 1.3165.8 ± 1.2
BU8 57.8 ± 3.452.3 ± 0.850.7 ± 0.650.4 ± 0.550 ± 0.549.8 ± 0.449.6 ± 0.449.7 ± 0.449.8 ± 0.3
BU956.7 ± 7.355.9 ± 1.453.9 ± 1.153.6 ± 1.053.7 ± 1.053.6 ± 0.853.4 ± 0.853.4 ± 0.853.5 ± 0.7
* BU10
* BU11
* BU12
* BU13
* BU14
BU15698.8 ± 5.8253.8 ± 34.4236.8 ± 23.8237.8 ± 19.0207.1 ± 14.4205.8 ± 12.0198.7 ± 10.6199.3 ± 8.4196 ± 7.9
BCIII
* BU16
* BU17
* BU18
* BU19
BCIV53.9 ± 10.241.2 ± 3.630.1( ± 1.629.0 ± 1.126.9 ± 0.927.5 ± 0.924.9 ± 0.726.4 ± 0.727.7 ± 0.6
BU207.927.5 ± 19.625.1 ± 6.529 ± 527.7 ± 3.327.6 ± 2.724.9 ± 2.127.2 ± 1.828.7 ± 1.8
BU2141.819.1 ± 3.317.2 ± 1.915.7 ± 1.416.0 ± 1.116.3 ± 0.913.8 ± 0.813.5 ± 0.713.6 ± 0.6
BU2263.9 ± 19.956.8 ± 11.344.1 ± 4.940.7 ± 4.538.9 ± 3.938.2 ± 3.839.6 ± 3.537.8 ± 2.937.6 ± 2.8
BU2358.5 ± 7.034.2 ± 3.427.5 ± 2.125.9 ± 1.723.8 ± 1.422.7 ± 1.221.6 ± 121.5 ± 120.6 ± 0.8
BCV
* BU24
BCVI1.0 ± 0.41.8 ± 0.41.6 ± 0.31.3 ± 0.31.5 ± 0.31.7 ± 0.21.7 ± 0.21.9 ± 0.2
* BU25
* BU26
BU27 120.7 ± 30.4223.4 ± 26.0231.2 ± 29.3231.2 ± 29.3245.1 ± 24.7238.7 ± 21.7261.2 ± 21.0268.2 ± 19.1
BU28 70.3 ± 17.067.4 ± 6.167.4 ± 5.067.4 ± 5.066.4 ± 3.867.9 ± 3.168.2 ± 2.366.4 ± 2.4
BCVII
* BU29
* BU30
* BUs that have no DHW in the calculations according to the national regulation.
Table 6. Time evolution of calculated average primary energy use for lighting for the different building categories and building uses in the NR Dbase.
Consecutive Time Bands
BCUpto2011Upto2012Upto2013Upto2014Upto2015Upto2016Upto2017Upto2018Upto2019
BUEUIp,L ± Standard Error of the Mean (kWh/m2)
BCI127.5 ± 15.3164.0 ± 3.5177.1 ± 2.3176.2 ± 2.0175.3 ± 1.8179.7 ± 1.6179.9 ± 1.3174.2 ± 1.2170.3 ± 1.1
BU1141 ± 29.0216.7 ± 11.4231.2 ± 7.5221.3 ± 6.6221 ± 5.9221.3 ± 4.8222.5 ± 4.4210 ± 4.0203.3 ± 3.6
BU2129 ± 9.6118.2 ± 4.7140.5 ± 2.5144.2 ± 2.2144.4 ± 2.1147.2 ± 1.9148.2 ± 1.5146.0 ± 1.4143.9 ± 1.3
BU3324.2 ± 214.9214.9 ± 8.2233.4 ± 6.0234.2 ± 5.1231.1 ± 4.8231.0 ± 4229.6 ± 3.4226.7 ± 3.1224.4 ± 3.0
BU4110.3 ± 23.9158.3 ± 5.5167.3 ± 3.2167.6 ± 2.9165.2 ± 2.8165.7 ± 2.2165.2 ± 1.9162.7 ± 1.7159.7 ± 1.6
BU5 132.0130.3 ± 0.6130.3 ± 0.6130.3 ± 0.6130.3 ± 0.6146.2 ± 9.2146.2 ± 9.2
BU685.6179.2 ± 24.4229.8 ± 35.4214.2 ± 29.2203.8 ± 26.5195.3 ± 18230.8 ± 10.7234.8 ± 9.5238.6 ± 8.3
BCII141.3 ± 11.8128.3 ± 2.7132.7 ± 2.0134.4 ± 1.8136.0 ± 1.7133.2 ± 1.5132.5 ± 1.3133.9 ± 1.2130.9 ± 1.2
BU7180.8 ± 24.3146.7 ± 4.6155.3 ± 3.3155.8 ± 3.1155.1 ± 2.9156.5 ± 2.6154.1 ± 2.3146.9 ± 2.1140.2 ± 2.0
BU8 130.1 ± 23.9163.3 ± 4.8174.2 ± 3.4175.5 ± 3.1174.9 ± 2.9175.5 ± 2.4176 ± 2.2175.4 ± 2.0174.9 ± 1.9
BU935.8 ± 11.749.8 ± 4.349.8 ± 2.848.4 ± 2.648.4 ± 2.547.4 ± 2.246.4 ± 245.9 ± 1.945.4 ± 1.9
BU10 49.8 ± 12.974.9 ± 21.991.6 ± 19.0101.5 ± 20.679.9 ± 14.872.4 ± 12.275.2 ± 10.974.3 ± 9.6
BU1184.656.4 ± 8.853.2 ± 5.158.7 ± 5.864.2 ± 5.366.0 ± 4.366.7 ± 470.2 ± 4.168.1 ± 3.8
BU12 121.085.8 ± 13.885.8 ± 13.880.8 ± 9.381.4 ± 7.981.7 ± 8.4107.6 ± 17.3105.1 ± 15.2
BU13123.8 ± 46.5121.3 ± 22.4126.6 ± 14.4127.0 ± 11.4119.0 ± 9116 ± 6.4115.5 ± 4.7113.8 ± 4.5114.4 ± 4.5
BU14 81.4 ± 6.482.8 ± 5.087.4 ± 4.586.5 ± 4.084.6 ± 3.386.9 ± 3.183.8 ± 2.783.1 ± 2.4
BU15155.7 ± 19.7168.1 ± 8.5165.4 ± 6.6174 ± 6.5183.4 ± 6.1182.4 ± 5.6183.9 ± 5.7185.3 ± 4.8182.6 ± 4.6
BCIII77.3 ± 9.162.5 ± 2.068.5 ± 2.466.8 ± 1.761.6 ± 1.162.1 ± 1.062.7 ± 1.062.4 ± 0.864.2 ± 0.8
BU1657.550.6 ± 3.044.7 ± 3.245.2 ± 2.049.8 ± 1.950.0 ± 1.449.6 ± 1.449.0 ± 1.349.6 ± 1.3
BU1755.2 ± 3.554.4 ± 1.357.0 ± 1.355.6 ± 1.054.5 ± 0.754.8 ± 0.655.1 ± 0.655.5 ± 0.655.6 ± 0.6
BU18116.0148.3 ± 8.2146.7 ± 12.9143.4 ± 11.2141.1 ± 10.2138.9 ± 8.2139.1 ± 7.0132.1 ± 6.2126.0 ± 5.0
BU19 82.1 ± 7.876.1 ± 375.9 ± 2.775.4 ± 2.575.6 ± 2.276.2 ± 1.977.0 ± 1.975.9 ± 1.8
BCIV137.1 ± 14.9132.0 ± 10.0167.8 ± 10.3162.3 ± 5.5162.9 ± 4.5186.1 ± 3.7195.6 ± 3.4196.7 ± 3.0197.0 ± 2.7
BU2072.2 ± 19.2109.0 ± 38.4164.9 ± 30.6163.9 ± 15.4173.3 ± 10.8196.1 ± 9.7209 ± 8.9205.7 ± 7.2205.4 ± 6.5
BU21122.9129.2 ± 10.6138.7 ± 8.1141.3 ± 6.6153.3 ± 5.7156.6 ± 5.4159.2 ± 4.2160.1 ± 3.9157.5 ± 3.6
BU22162.4 ± 19.6201.6 ± 17.9254.8 ± 18.0246.6 ± 14.9242.3 ± 12.7231.7 ± 10.9243.6 ± 10.6252.3 ± 9.2256.9 ± 9.5
BU2338.4 ± 10.556.9 ± 4.161.6 ± 2.962.9 ± 2.563.5 ± 2.064.2 ± 1.763.5 ± 1.663.9 ± 1.463.8 ± 1.3
BCV 215.8 ± 51.0206.2 ± 35.1206.2 ± 35.1223 ± 35.3222 ± 31.6279.5 ± 33.8280.6 ± 27278.5 ± 24
* BU24 215.8 ± 51.0206.2 ± 35.1206.2 ± 35.1223 ± 35.3222 ± 31.6279.5 ± 33.8280.6 ± 27278.5 ± 24
BCVI92.4 ± 15.4139.9 ± 2.0149.6 ± 1.1150.3 ± 0.9150.1 ± 0.9150.8 ± 0.7150.7 ± 0.6149.5 ± 0.6148.6 ± 0.5
BU2519.1 ± 16.3126.7 ± 11.5148.7 ± 6.5148.5 ± 5.4148.7 ± 4.9147.6 ± 4.1146.1 ± 3.3148.3 ± 3.2149.4 ± 3
BU26142.3 ± 14.2143.9 ± 1.8149.8 ± 1.1150.7 ± 1.0150.5 ± 0.9151.6 ± 0.7151.9 ± 0.6150.0 ± 0.6148.3 ± 0.5
BU27 106.2 ± 16.1148.3 ± 15.9155.6 ± 15.6155.6 ± 15.6165.1 ± 12.4173.9 ± 11.4166.8 ± 10.2164.1 ± 9.6
BU28 123.3 ± 17.1147.4 ± 11.4149.3 ± 9.5149.3 ± 9.5154.6 ± 7.8150.7 ± 6.0149.4 ± 6.4146.3 ± 5.7
BCVII105.5 ± 11.7128.7 ± 2.6134.4 ± 1.7135.4 ± 1.4134.8 ± 1.3137.5 ± 1.0137.2 ± 0.9135.1 ± 0.9132.8 ± 0.8
BU29105.5 ± 12.3128.8 ± 2.7134.8 ± 1.7135.8 ± 1.5135.3 ± 1.4137.9 ± 1.1137.6 ± 1135.4 ± 0.9133.2 ± 0.9
BU30 99.9 ± 4.980.9 ± 7.290.5 ± 11.481.4 ± 9.278.9 ± 8.181.4 ± 7.981.4 ± 7.981.4 ± 6.5
Table 7. Time evolution of calculated averageCO2 emissions intensity for the different building categories and building uses in the NR Dbase.
Consecutive Time Bands
BCUpto2011Upto2012Upto2013Upto2014Upto2015Upto2016Upto2017Upto2018Upto2019
BUCO2 ± Standard Error of the Mean (kg/m2)
BCI131.1 ± 1.1130.9 ± 0.1127.9127.3126.5129.6129.5127.9127.9
BU1181.9 ± 17.9186.4 ± 7.0183.9 ± 4.7179.3 ± 4.2178.8 ± 3.7177.5 ± 3.0178.1 ± 2.7173.1 ± 2.5172.9 ± 2.2
BU277.5 ± 4.888.5 ± 2.493.3 ± 1.494.2 ± 1.293.6 ± 1.194.4 ± 1.096.2 ± 0.896.3 ± 0.897.0 ± 0.7
BU3236.7 ± 50.7183.1 ± 5.3190.9 ± 3.6192.3 ± 3.4191.2 ± 3.2189.8 ± 2.8189.0 ± 2.4190.7 ± 2.3191.1 ± 2.1
BU495.3 ± 8.1101.0 ± 2.5104.4 ± 1.6104.1 ± 1.4103.2 ± 1.3102.0 ± 1.1102.4 ± 1.0103.5 ± 0.9103.3 ± 0.8
BU5 177.5123.7 ± 25.5123.7 ± 25.5123.7 ± 25.5123.7 ± 25.5128.5 ± 12.0128.5 ± 12.0
BU6175.9175.8 ± 27.7177.3 ± 16.8178.9 ± 15.0169.6 ± 15.2182.6 ± 17.1181.8 ± 8.0188.2 ± 7.4194.9 ± 7.1
BCII233.6 ± 2.4218.3 ± 0.1216.7 ± 0.1216.2213.7209.3206.8218.9220.2
BU7269.2 ± 29.4260.5 ± 3.9256.8 ± 2.6255.3 ± 2.4253.6 ± 2.3253.5 ± 2.0251.5 ± 1.7254.9 ± 1.7257.1 ± 1.6
BU8 266.9 ± 35.5260.5 ± 5.0261.8 ± 3.6261.8 ± 3.3260.8 ± 3.1261.2 ± 2.5261.8 ± 2.2270.3 ± 2.3277.6 ± 2.3
BU976.0 ± 8.6100.9 ± 3.4101.1 ± 2.4100.2 ± 2.2100.2 ± 2.1100.8 ± 1.8101.0 ± 1.7102.3 ± 1.7103.5 ± 1.7
* BU10 121.3 ± 10.0108.0 ± 7.8124.8 ± 10.8125.7 ± 10.3119.1 ± 7.5122.2 ± 6.8123.8 ± 6.2126.8 ± 5.8
* BU1169.6112.0 ± 8.6102.7 ± 8.0105.3 ± 7.6105.6 ± 6.3100.3 ± 5.4101.4 ± 4.6103.4 ± 4.1102.6 ± 3.8
* BU12 120.797.8 ± 23.697.8 ± 23.697.4 ± 16.292.4 ± 14.691.8 ± 10.2105.0 ± 12.4104.0 ± 11.5
* BU1386.4 ± 19.889.2 ± 10.291.6 ± 6.492.4 ± 5.593.4 ± 5.489.1 ± 4.386.5 ± 3.286.5 ± 3.185.5 ± 3.0
* BU14 95.2 ± 7.396.5 ± 4.595.7 ± 3.798 ± 3.398.9 ± 2.8100.2 ± 2.5103.1 ± 2.5106.9 ± 2.5
BU15297.8 ± 13.9309.5 ± 13.6302.4 ± 11.4312.4 ± 10.5303 ± 8.5307.3 ± 7.4305.5 ± 7.0319.6 ± 6.8318.6 ± 6.6
BCIII63.5 ± 1.952.1 ± 0.153.7 ± 0.154.8 ± 0.150.349.750.152.253.3
* BU1654.357.6 ± 8.248.3 ± 5.447.5 ± 3.745.7 ± 2.247.7 ± 2.347.0 ± 2.351.3 ± 2.350.5 ± 2.0
* BU1749.9 ± 6.649.3 ± 1.549.6 ± 1.451.1 ± 1.147.7 ± 0.846.6 ± 0.746.8 ± 0.749.2 ± 0.749.2 ± 0.7
* BU1887.481.8 ± 5.883.6 ± 7.381.3 ± 6.279.9 ± 5.782.3 ± 4.483.0 ± 3.882.7 ± 3.482.7 ± 2.8
* BU19 57.3 ± 4.950.4 ± 2.150.9 ± 2.051.3 ± 1.852.4 ± 1.751.9 ± 1.452.8 ± 1.453.6 ± 1.4
BCIV220.3 ± 10.1164.2 ± 1.5172.4 ± 0.5179.9 ± 0.4172.9 ± 0.3188.2 ± 0.2190.4 ± 0.2198.1 ± 0.1205.6 ± 0.1
BU2076.2 ± 6.3147.7 ± 71.6172.5 ± 22.0187.9 ± 19.2187.5 ± 12.5201.6 ± 10.9206.2 ± 8.9210.6 ± 7.6218.9 ± 6.6
BU2161.0143.2 ± 12.9143.8 ± 8.0142.9 ± 6.9143.2 ± 5.2142.6 ± 4.6138.5 ± 3.5140.8 ± 3.1141.3 ± 3.1
BU22275.1 ± 42.3249.1 ± 21.5244.7 ± 13.5234.1 ± 11.7226.7 ± 10.0215.4 ± 9.7224.0 ± 9.1234.1 ± 7.9235.4 ± 7.7
BU2366.5 ± 8.576.9 ± 4.279.8 ± 3.179.8 ± 2.777.7 ± 2.476.7 ± 2.175.3 ± 1.976.3 ± 1.875.9 ± 1.7
BCV 176.0 ± 32.7177.9 ± 23.3177.9 ± 23.3178.2 ± 20.5173.8 ± 18.9189.8 ± 14.2188.2 ± 11.6182.6 ± 11.2
* BU24 176.0 ± 32.7177.9 ± 23.3177.9 ± 23.3178.2 ± 20.5173.8 ± 18.9189.8 ± 14.2188.2 ± 11.6182.6 ± 11.2
BCVI90.1 ± 1.1133.6137.1136.8134.5137.6139.0143.4147.6
* BU2551.7 ± 3.2107.9 ± 5.9119.2 ± 4.0116.4 ± 3.6114.3 ± 3.3115.1 ± 2.8116.2 ± 2.4118.4 ± 2.4118.6 ± 2.3
* BU26116.3 ± 8.9140.3 ± 1.6141.8 ± 0.9141.9 ± 0.8141.1 ± 0.8144.1 ± 0.6145.8 ± 0.5150.8 ± 0.6155.5 ± 0.6
BU27 161.8 ± 36.6196.7 ± 13.9201.6 ± 13.2201.6 ± 13.2207.8 ± 11.6207.7 ± 9.4225.6 ± 11.4237.0 ± 11.9
BU28 130.4 ± 38.7187.7 ± 21.4185.5 ± 17.6185.5 ± 17.6183.6 ± 11.4182.2 ± 10.2194.5 ± 9.4195.7 ± 8.9
BCVII86.4 ± 11.4108.6 ± 2.4172.4 ± 0.5109.7 ± 1.4108.3 ± 1.2111.8 ± 1112.2 ± 0.9113.6 ± 0.9115.4 ± 0.8
* BU2986.4 ± 11.4108.6 ± 2.4110.8 ± 1.6109.8 ± 1.4108.4 ± 1.2111.9 ± 1112.3 ± 0.9113.7 ± 0.9115.5 ± 0.8
* BU30 106.4 ± 17.2104.8 ± 9.9104.7 ± 8.496.6 ± 6.794.2 ± 6.592.5 ± 6.392.5 ± 6.394.9 ± 7.1
* BUs that have no DHW in the calculations according to the national regulation.
Table 8. Results of the applied statistical tests and failure coding (F-codes) for the various energy use intensities and emissions for BU2–hotel (summer), across the eight pairs of time bands.
Pairs of Consecutive Time Bands *
BU2T1T2T3T4T5T6T7T8
EUIpt-test/p−1.22/0.22−0.35/0.73−0.10/0.920.74/0.46−0.23/0.82−0.76/0.450.20/0.84−0.33/0.74
M–W/p−1.91/0.06−0.94/0.35−0.11/0.91−0.98/0.33−0.51/0.61−1.00/0.32−0.30/0.76−0.25/0.80
Levene’s/p1.25/0.267.18/0.010.05/0.830.00/1.000.48/0.490.72/0.390.31/0.580.16/0.69
Conover/p−1.98/0.05−2.40/0.02−0.07/0.94−0.18/0.86−0.68/0.50−0.74/0.46−0.27/0.78−0.55/0.58
K–S/p1.44/0.031.01/0.260.23/1.000.64/0.810.46/0.980.82/0.520.31/1.000.26/1.00
F-codes011010000000000000000000
EUIp,Ht-test/p−3.14/0.002.14/0.030.46/0.64−0.12/0.900.08/0.94−0.82/0.41−0.08/0.94−1.28/0.20
M–W/p−2.41/0.02−1.55/0.12−0.62/0.54−0.55/0.58−0.12/0.9−1.25/0.21−0.54/0.59−1.44/0.15
Levene’s/p8.71/0.009.83/0.000.00/0.980.24/0.620.00/0.990.00/0.990.69/0.410.62/0.43
Conover/p−3.49/0.00−4.60/0.00−0.01/1.00−0.52/0.60−0.45/0.65−0.19/0.85−0.94/0.35−1.11/0.27
K–S/p1.40/0.041.10/0.180.79/0.550.59/0.870.27/1.000.95/0.330.62/0.840.88/0.42
F-codes111110000000000000000000
EUIp,Ct-test/p−2.76/0.010.54/0.590.18/0.860.66/0.510.01/1.00−1.56/0.12−1.33/0.18−1.96/0.05
M–W/p−3.61/0.00−0.08/0.94−0.16/0.88−0.59/0.55−0.21/0.84−1.52/0.13−1.43/0.15−2.01/0.04
Levene’s/p3.16/0.082.62/0.110.15/0.690.41/0.520.24/0.620.43/0.510.48/0.491.11/0.29
Conover/p−2.61/0.01−1.71/0.09−0.21/0.84−0.86/0.39−0.48/0.63−0.64/0.53−0.74/0.46−1.14/0.26
K–S/p2.49/0.000.98/0.290.27/1.000.59/0.880.32/1.000.69/0.730.82/0.520.94/0.34
F-codes111000000000000000000000
EUIp,DHWt-test/p0.03/0.987.18/0.001.67/0.091.47/0.141.52/0.132.24/0.031.67/0.091.56/0.12
M–W/p−0.13/0.89−7.04/0.00−1.48/0.14−1.39/0.16−1.57/0.12−2.07/0.04−2.02/0.04−1.78/0.07
Levene’s/p2.95/0.090.01/0.903.19/0.072.18/0.141.67/0.204.46/0.030.30/0.580.81/0.37
Conover/p−1.53/0.13−0.41/0.68−2.36/0.02−1.97/0.05−2.14/0.03−2.58/0.01−1.01/0.31−1.67/0.09
K–S/p0.81/0.523.89/0.000.99/0.280.85/0.470.79/0.551.10/0.180.96/0.310.76/0.61
F-codes000100010010010110100000
EUIp,Lt-test/p0.88/0.38−4.46/0.00−1.11/0.27−0.07/0.94−1.01/0.31−0.41/0.681.06/0.291.08/0.28
M–W/p−1.46/0.15−5.91/0.00−0.94/0.35−0.15/0.88−1.00/0.32−0.60/0.55−1.52/0.13−1.36/0.17
Levene’s/p3.42/0.073.17/0.080.17/0.680.11/0.740.23/0.631.25/0.260.51/0.470.08/0.77
Conover/p−2.98/0.00−1.53/0.13−1.10/0.27−0.35/0.73−0.49/0.62−0.86/0.39−0.82/0.41−0.10/0.92
K–S/p1.90/0.003.17/0.000.74/0.640.48/0.970.51/0.960.92/0.370.99/0.280.83/0.49
F-codes011101000000000000000000
CO2t-test/p−2.04/0.05−1.78/0.08−0.55/0.590.41/0.68−0.55/0.58−1.43/0.15−0.05/0.96−0.67/0.50
M–W/p−1.97/0.05−2.27/0.02−0.56/0.58−0.69/0.49−0.81/0.42−1.75/0.08−0.04/0.97−0.55/0.58
Levene’s/p4.97/0.033.77/0.050.00/1.000.00/0.990.24/0.630.18/0.670.43/0.510.36/0.55
Conover/p−2.86/0.00−1.93/0.05−0.23/0.82−0.19/0.85−0.44/0.66−0.22/0.82−0.32/0.75−0.77/0.44
K–S/p1.31/0.061.50/0.020.42/1.000.57/0.900.60/0.861.05/0.220.27/1.000.41/1.00
F-codes110101000000000000000000
* T1:upto2011-upto2012, T2:upto2012-upto2013, T3:upto2013-upto2014, T4:upto2014-upto2015, T5:upto2015-upto2016, T6:upto2016-upto2017, T7:upto2017-upto2018, T8:upto2018-upto2019
Table 9. Failures coding (F-codes) for primary energy uses and CO2 intensities, for the different building uses in the NR Dbase.
Pairs of Consecutive Time Bands
T3T4T5T6T7T8T3T4T5T6T7T8T3T4T5T6T7T8T3T4T5T6T7T8T3T4T5T6T7T8T3T4T5T6T7T8
EUIpEUIp,HEUIp,CEUIp,DHWEUIp,LCO2
BU1000000000000000000000000000000000000000000000000000000000000000000000000000000000000101000000000000000000000
BU2000000000000000000000000000000000000000000000000000100010010010110100000000000000000000000000000000000000000
BU3000000000000000000000000000000000000000000000000000000000000000000000000000000000000000000000000000000000000
BU4000000000000000000000000000000000000000000000000000000000000110000000000000000000000000000000000000000000000
BU5000000000000000000000000000000000000000000000000010000000000000000000000000000000000010000000000000000000000
BU6000000000000000000000000000100000000000000000010000000000000000110000000000000000000000000000000000000000000
BU7000000000000000000000000000000010000000000000000000000000010000000000000000000000000101101000000000000000000
BU8000000000000000000000000000000000000000000000000000000000010000010010010000000000000000000000000000000110110
BU9000000000000000000000000000000000000000000000000000000000000000000000000000000000000000000000000000000000000
BU10000000000000000000000000000000000000000000000000000000 000000010000000000000000000000000000
BU11000000000000000000000000000000000000000000000000000000 000000000000010000000000000000000000
BU12000000000000000000000000000000000000000000000000000000 000000000000000000000000000000000000
BU13000000000000000000000000000000000000000000000000000000 000000000000000000000000000000000000
BU14000000000000000000000000000000000000000000000000000000 000000000000000000000000000000000000
BU15000000000000000000000000000000000000000000000000000000000000000000000000000000000000000000000000000000000000
BU16000000000000000000000000000000000000000000000000000000 000000000000000000000000000000000000
BU17000100000000100000100000000000110000101010000000000000 000000000000000000000100000000100000
BU18000000000000000000000000000000000000000000000000000000 000000000000000000000000000000000000
BU19000000000000000000000000000000000000000000000000000000 000000000000000000000000000000000000
BU20000000000000000000000000000000000000000000000000000000000000000000000000000000000000000000000000000000000000
BU21000010010000000000000000000000000000000000010000000000000000010110000000000010010000000000000010010000000000
BU22000000000000000000000000000000000000000000000000000000000000000000000000000000000000000000000000000000000000
BU23000000000000000000000000000000000000000000000000000000000000000000000000000000000000000000000000000000000000
BU24000000000000000000000000000000000000000000000000000000 000000000000000000000000000000000000
BU25000000000000000000000000000000000000000000000000000000 000000000000000000000000000000000000
BU26000000110100111111000000110110111111000000000000110110 010000010010111111000000110000111111
BU27000000000000000000000000000000000000000000000000000000000000000000000000000000000000000000000000000000000000
BU28000000000000000000000000000000000000000000000000000000000000000000000000000000000000000000000000000000000000
BU29000000100000000000000000110000000010000000000000000000 000000010000101101000000100000000010
BU30000000000000000000000000000000000000000000000000000000 000000000000000000000000000000000000
T3:upto2013-upto2014, T4:upto2014-upto2015, T5:upto2015-upto2016, T6:upto2016-upto2017, T7:upto2017-upto2018, T8:upto2018-upto2019; Empty cells refer to BUs that have no DHW in the calculations according to the national regulation.
Table 10. Stabilization status for all building uses.
BUSpecific ParametersOverall
EUIpCO2EUIp,HEUIp,CEUIp,DHWEUIp,L
BU1SSSSSNSNS
BU2SSSNSNSSNS
BU3SSSSSSS
BU4SSSSNSSNS
BU5SSSASSASAS
BU6SSNSASNSSNS
BU7SSASSASNSNS
BU8SNSSSNSNSNS
BU9SSSSSSS
BU10SSSS ASAS
BU11SSSS ASAS
BU12SSSS SS
BU13SSSS SS
BU14SSSS SS
BU15SSSSSSS
BU16SSSS SS
BU17NSNSNSNS SNS
BU18SSSS SS
BU19SSSS SS
BU20SSSSSSS
BU21ASASSASNSASNS
BU22SSSSSSS
BU23SSSSSSS
BU24SSSS SS
BU25SSSS SS
BU26NSNSNSNS NSNS
BU27SSSSSSS
BU28SSSSSSS
BU29NSNSNSS NSNS
BU30SSSS SS
Empty cells refer to BUs that have no DHW in the calculations according to the national regulation.
Table 11. Failures coding (F-codes) for primary energy uses and CO2 intensities, for the different building categories in the NR Dbase.
Pairs of Consecutive Time Bands
BCT3T4T5T6T7T8T3T4T5T6T7T8T3T4T5T6T7T8T3T4T5T6T7T8T3T4T5T6T7T8T3T4T5T6T7T8
EUIpEUIp,HEUIp,CEUIp,DHWEUIp,LCO2
BCI000000000000000000010000000000001010000100110000000101011010000000000000
BCII000010001100000000001000000100001000001011001000000000000100000000001100
BCIII001000001000110100001100010000011111 011101000000001100001000
BCIV010100000000000100001010010100000101010001100000000111010000010110000100
BCVI001011001111001010011111010000001010000000010101000000000000001010001111
BCVII000010000000000110000010010001000000 000000000000000011000000
T3:upto2013-upto2014, T4:upto2014-upto2015, T5:upto2015-upto2016, T6:upto2016-upto2017, T7:upto2017-upto2018, T8:upto2018-upto2019; Empty cells refer to BUs that have no DHW in the calculations according to the national regulation; BCV was not included in the analysis, since it includes only the buildings of BU24.
Table 12. Stabilization status for all building categories.
BCEUIpCO2EUIp,HEUIp,CEUIp,DHWEUIp,LOverall
BCISSASNSNSNSNS
BCIINSNSNSNSNSASNS
BCIIINSNSNSNS NSNS
BCIVASNSNSNSNSNSNS
BCVINSNSNSNSNSSNS
BCVIINSNSNSAS SNS
Empty cells refer to BUs that have no DHW in the calculations according to the national regulation. BCV was not included in the analysis, since it includes only the buildings of BU24.

