Article

Effect of Cell Size on the Performance and Temperature Distribution of Molten Carbonate Fuel Cells

1
Department of Mechanical Design and Manufacturing Engineering, Seoul National University of Science and Technology, Seoul 01811, Korea
2
Department of Mechanical System Design and Engineering, Seoul National University of Science and Technology, Seoul 01811, Korea
*
Authors to whom correspondence should be addressed.
Energies 2020, 13(6), 1361; https://doi.org/10.3390/en13061361
Submission received: 17 February 2020 / Revised: 3 March 2020 / Accepted: 7 March 2020 / Published: 15 March 2020
(This article belongs to the Section D1: Advanced Energy Materials)

Abstract

:
Molten carbonate fuel cells (MCFCs) are high-operating-temperature fuel cells with high efficiency and fuel diversity. Electrochemical reactions in MCFCs are exothermic. As the size of the fuel cells increases, the amount of the heat from the fuel cells and the temperature of the fuel cells increase. In this work, we investigated the relationship between the fuel cell stack size and performance by applying computational fluid dynamics (CFD). Three flow types, namely co-flow, cross-flow, and counter-flow, were studied. We found that when the size of the fuel cells increased beyond a certain value, the size of the fuel cell no longer affected the cell performance. The maximum fuel cell temperature converged as the size of the fuel cell increased. The temperature and current density distribution with respect to the size showed a very similar distribution. The converged maximum temperature of the fuel cells depended on the gas flow condition. The maximum temperature of the fuel cell decreased as the amount of gas in the cathode size increased.

1. Introduction

The operating temperature of molten carbonate fuel cells (MCFCs) is 580 °C or more [1]. The MCFC has the advantage of using an inexpensive catalyst and internal reforming due to its high operating temperature. However, an MCFC has the disadvantage that the fuel cell reactions are exothermic, which reduces the lifetime of the stack [2]. A high cell temperature evaporates the liquid electrolytes [3]. A non-uniform electrochemical reaction in the fuel cell causes large temperature deviations. Large temperature differences in MCFCs induce thermal stress that accelerates fractures in the electrolyte matrix, compromising the long-term operation [4].
There has been considerable research into MCFC stacks. Yoshiba et al. [5] studied cell performance and temperature profiles in various flow geometries and types. They found that a stack with a co-flow has some performance advantages and produces a reduced maximum temperature. Koh et al. [6] investigated an internal-reforming-type 5-kW stack with various parameters, including fuel cell size, gas utilization, and operating temperatures. Kim et al. [7] developed simulation procedures for MCFCs using three-dimensional computational fluid dynamics (CFD) analysis. The current collector was assumed to be a porous medium consistent with Darcy’s law. Kim et al. [8] compared the effects of flow types on performance, current density, and temperature. In their work, counter-flow type MCFCs showed the best performance. Lee et al. [9] studied the temperature distribution and performance of the newly developed 100-cm2 cell frame. At this size, counter-flow type MCFCs produced more uniformly distributed temperatures and current densities without any hot spots. However, many previous studies have only analyzed one or two stack sizes. Consequently, it has been difficult to determine the relationship between temperature distribution, performance, and size in the design of large stacks.
In this study, we analyzed the flow, mass transfer, and electrochemistry to determine current-density and temperature distributions relative to the fuel cell size and flow characteristics. We studied co-flow, counter-flow, and cross-flow configurations in rectangular shaped fuel cells with lengths of 0.1 m, 0.5 m, 1 m, 1.5 m, and 2 m. We used CFD to determine the relationship between cell size and the temperature distribution.

2. Simulation Model

2.1. Reaction Models

MCFCs are composed of a cathode, an anode, and a matrix with electrolytes, such as K2CO3, Na2CO3, or Li2CO3. MCFCs use NiO as the cathode, γ-LiAlO2 as the matrix [9], and an alloy of Ni and Ni-5wt%Al as the anode. The structures of the electrodes and matrix used in previous studies are shown in Figure 1.
When fuel gases, such as H2, H2O, and CO2 are supplied to the anode, a reduction reaction occurs between the hydrogen and carbonate that emits electrons. The electrons return to carbonate ions through an oxidation reaction with the fuel gas at the cathode, producing electricity. Oxidation and reduction of carbonate ions are the basic reactions of MCFCs. Equation (1) describes the reactions in the anode and cathode:
Anode : H 2 + C O 3 2 H 2 O + C O 2 + 2 e , Cathode : 1 2 O 2 + C O 2 + 2 e C O 3 2 .
The voltage of the molten carbonate fuel cells (Vcell) was assumed to be constant throughout the cell. Here, the Nernst potential ENernst is given by Equation (2), where the first term on the right-hand side is standard potential (E0) from the change in the molar Gibbs free energy. The local current density is defined in Equation (3). Total resistance is defined as the sum of the internal resistance, anode resistance Ra, and cathode resistance Rc. Equation (4) shows the calculation for Rohm as the internal resistance including the contact resistance, Ra, and Rc as the resistance components due to polarization and diffusion. We used the results from the experimental literature [10,11]. Unlike SOFC(Solid Oxide Fuel Cell; SOFC) [12] and PEMFC(Polymer Electrolyte Membrane Fuel Cells; PEMFC) [13], MCFCs showed very complicated reduction and oxidation reactions, therefore it is difficult to apply reaction-based equations [11].
E O C V = Δ G 2 F + R T 2 F ln ( P H 2 a n o d e P O 2 C a t h o d e P H 2 O a n o d e P C O 2 C a t h o d e P C O 2 a n o d e ) ,
i x , y = E N e r n s t x , y V c e l l R i r r x , y = E N e r n s t x , y V c e l l R a x , y + R c x , y + R o h m x , y ,
R a = 2.27 × 10 9 exp ( 6435 T ) P H 2 0.42 P C O 2 0.17 P H 2 O 1.0 , R c = 7.505 × 10 10 exp ( 9289 T ) P O 2 0.43 P C O 2 0.09 , R o h m = 0.32 × 10 4 exp [ 4026 ( 1 T 1 923 ) ] .
The heat generated from the electrochemical reaction was determined from the sum of the enthalpy change of the reaction minus the electrical power reduced. The heat produced by the fuel cell reaction is as follows [14]:
Q E = i x , y ( Δ H E 2 F V c e l l ) ,
Δ H E = ( 240506 + 7.3835 T ) J m o l .
In addition, a fast acting water–gas shift (WGS) reaction occurs at the anode, as shown in Equation (7) below. The equilibrium constant of the WGS reaction [15] is presented in Equation (8), and the enthalpy change is expressed using Equation (9):
Anode   side : H 2 O + C O C O 2 + H 2 ,
K W G S = [ P H 2 ] [ P C O 2 ] [ P C O ] [ P H 2 O ] = 157.02 0.4447 T + 4.2777 × 10 4 T 2 1.3871 × 10 7 T 3   ,
H W G S = 43729 + 9.4657 T J m o l .

2.2. Flow Types

MCFCs are categorized according to the relative flow directions between the anode and the cathode gases [8]. A co-flow type presents the anode and cathode gas flows in the same direction. A counter-flow type presents opposing flow directions. A cross-flow type presents perpendicular flow directions. These flow types are shown in Figure 2.

2.3. Simulation Model

To confirm that the current collector plate is a porous medium with an equivalent pressure drop and heat transfer coefficient, we applied unit cell analysis to determine the heat transfer coefficient and permeability coefficients. The current collector plate of MCFCs is the repeated structures with an open sheared trapezoidal shape. The length and height of each trapezoidal shape are 4 mm and 2.4 mm, respectively. Using a full model of the current collector plate requires excessive computation due to the plate’s complex structure [16]. Consequently, we analyzed the current collector by assuming a porous media with an equivalent pressure drop and thermal conductivity. We modeled the gas flow in the porous media with Darcy’s law, presented in Equation (10) [17]. The detailed calculation result and the included homogenized properties are published in a previous paper [18]. The permeability (κ) of the current collector plate was 1.75 × 10⁻⁷ m2.
Δ P = μ k v
As the heat transfer is produced by conduction, we applied the linear heat conduction equation shown in Equation (11). Using the difference in temperature as a result of the analysis, the Keff for each direction was obtained and was used as an equivalent physical property. The heat transfer coefficient for each direction was calculated to be KeffX = 3.11 W/mK, KeffY = 1.42 W/mK, and KeffZ = 1.19 W/mK [18].
Δ Q = K e f f Δ T Δ L
Seven elements were used in the thickness direction, and a total of 80,640 hexahedral elements were used. In the analysis, we increased the number of elements by 30% and determined the number of elements whose analysis error in the next step decreased by 1%. The simulation model in this work is shown in Figure 3. The simulation used COMSOL Multiphysics v 5.4 with a conjugated heat flow model. We assumed a laminar inflow as the gas flow channel input boundary condition.
In the simulation of the fuel cell system, heat transfer is one of the most important problems. In the case of a stack, heat transfer occurs between adjacent cell surfaces. As the heat discharged from the adjacent cells and the heat discharged from the cells were the same, we calculated the heat transfer in this portion under an adiabatic condition. The interpretation in the next chapter validates this assumption.

2.4. Simulation Conditions

The temperature of the inlet gas was the same as the operating temperature of 580 °C, and the operating pressure was 1 atm. The reference gas utilization of O2 in the cathode side and H2 in the anode side was 0.4 at the current density of 1000 A/m2. This means that 40% of the gases were consumed during the electrochemical reaction at the average current density of 1000 A/m2. The gas composition of the anode side was H2:CO2:H2O = 0.72:0.18:0.1. The gas composition of the cathode side was Air:CO2 = 0.7:0.3 [6].
The thermal properties of the anode, the cathode, and AISI316L, which is the material of the cell frame and the current collector plate, are summarized in a previous study [9]. Thermal properties of the anode and cathode mixture gases were calculated simultaneously during simulation because the gas composition was changed due to electrochemical reactions. The specific heat, thermal conductivity, and viscosity were calculated using an ideal gas mixture rule [19].

3. Results and Discussions

3.1. Stacking Effects

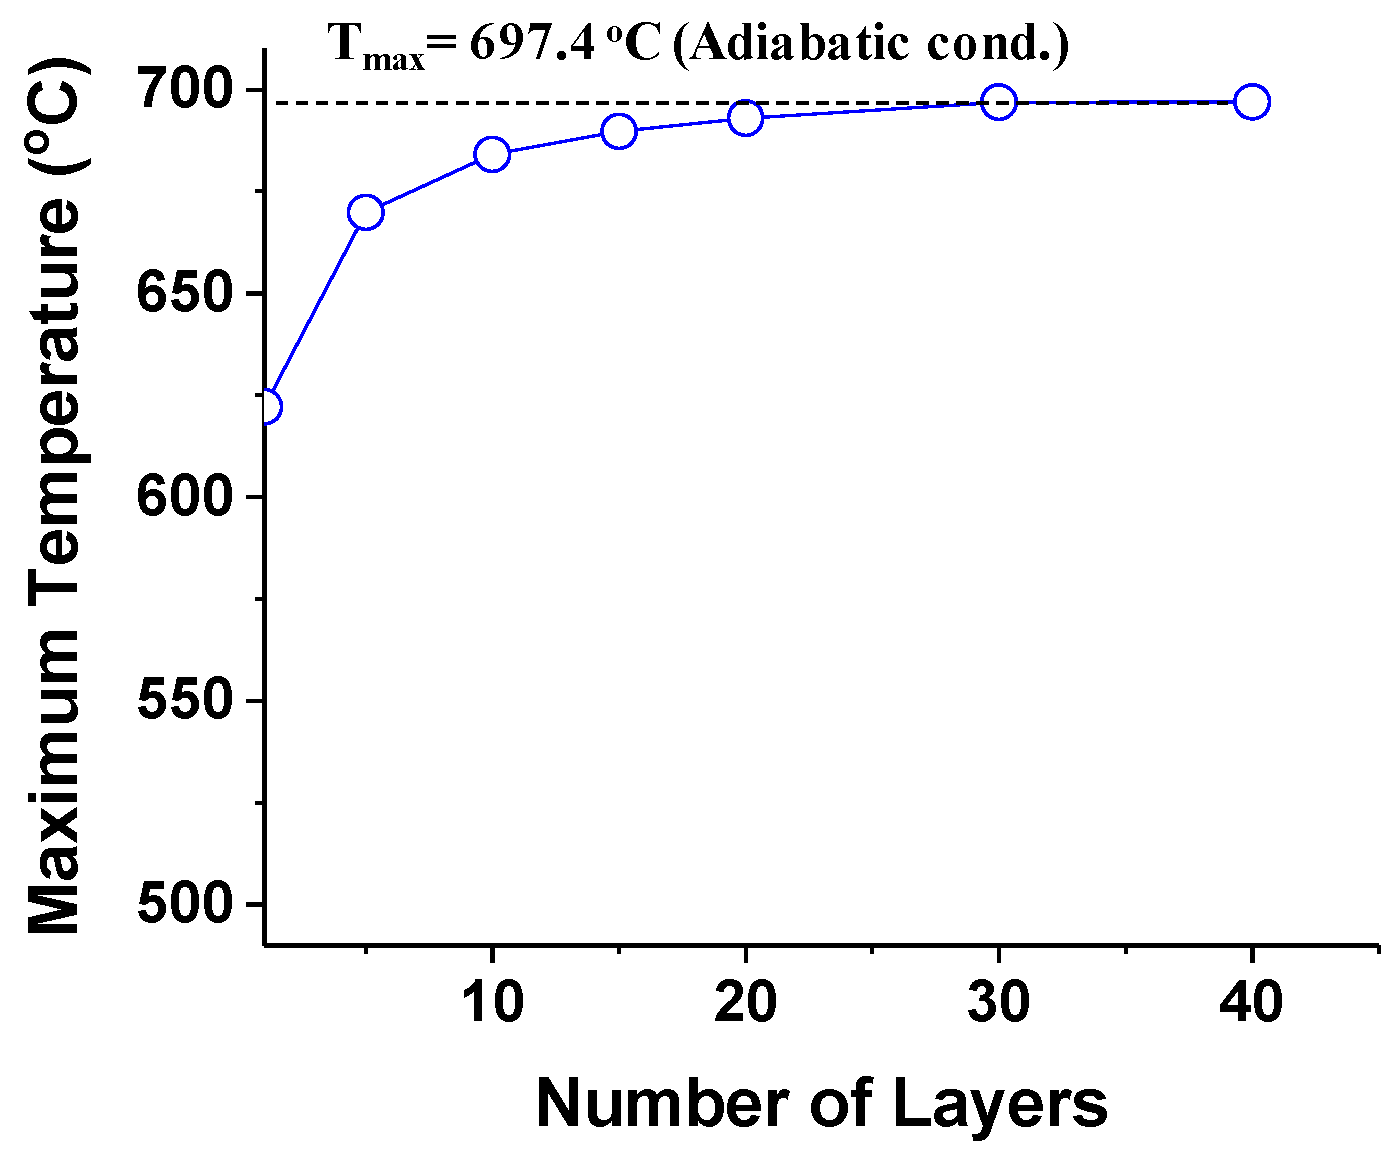
The stacking conditions of the fuel cell were analyzed. MCFCs are used to stack many unit cells together to produce hundreds of kW. In the simulation, the size of the fuel cell was 1 m × 1 m. We analyzed the heat transfer conditions between unit cells. For the upper and lower surfaces of the stack, the heat transfer condition was analyzed using the natural convection condition of 5 W/m2K. The operating conditions were an operating temperature of 580 °C and an average current density of 1000 A/m2. We compared the maximum cell temperature relative to the number of stacked unit cells. The results are shown in Figure 4.
With a single layer, the maximum cell temperature was 622.1 °C. The maximum cell temperature increased as the number of layers increased, as did the average temperature and the average current density. Beyond a certain number of layers, the cell temperature converged to a certain value.
The maximum temperature was compared with one cell with an adiabatic condition. The maximum temperature of the cell was 697.1 °C. The converging temperature condition was a case where heat insulation conditions were given to the upper and lower surfaces of the cell. One cell in the stack could be simulated under adiabatic conditions because the heat generated from the fuel cells and the heat generated by the cell were the same. Therefore, the upper faces of stacked cells can be simulated as adiabatic conditions. All of the following analyses were conducted with the same heat transfer boundary conditions.

3.2. Effects of Cell Size with Respect to the Flow Types

The molten carbonate fuel cells were classified into a co-flow type, a cross-flow type, and a counter-flow type according to the relative directions between the cathode gas and the anode gas. The analysis was carried out according to the length of the cell and the relative flow direction. We compared the temperature and current density distributions according to the cell length and flow types. The fuel cell in the simulation was square with the lengths of 0.1 m, 0.5 m, 1 m, 1.5 m, and 2 m being simulated. In the case of co-flow and counter-flow, only the normal direction of the gas flow direction affects the temperature distribution [20,21]. Therefore, even if the analysis is applied to the square shape, the effect on the size can be analyzed. The current density distribution and the temperature were compared with the normalized length. The figures presenting the current density and the temperature are drawn with the same normalized length scale.

3.2.1. Co-Flow Cell

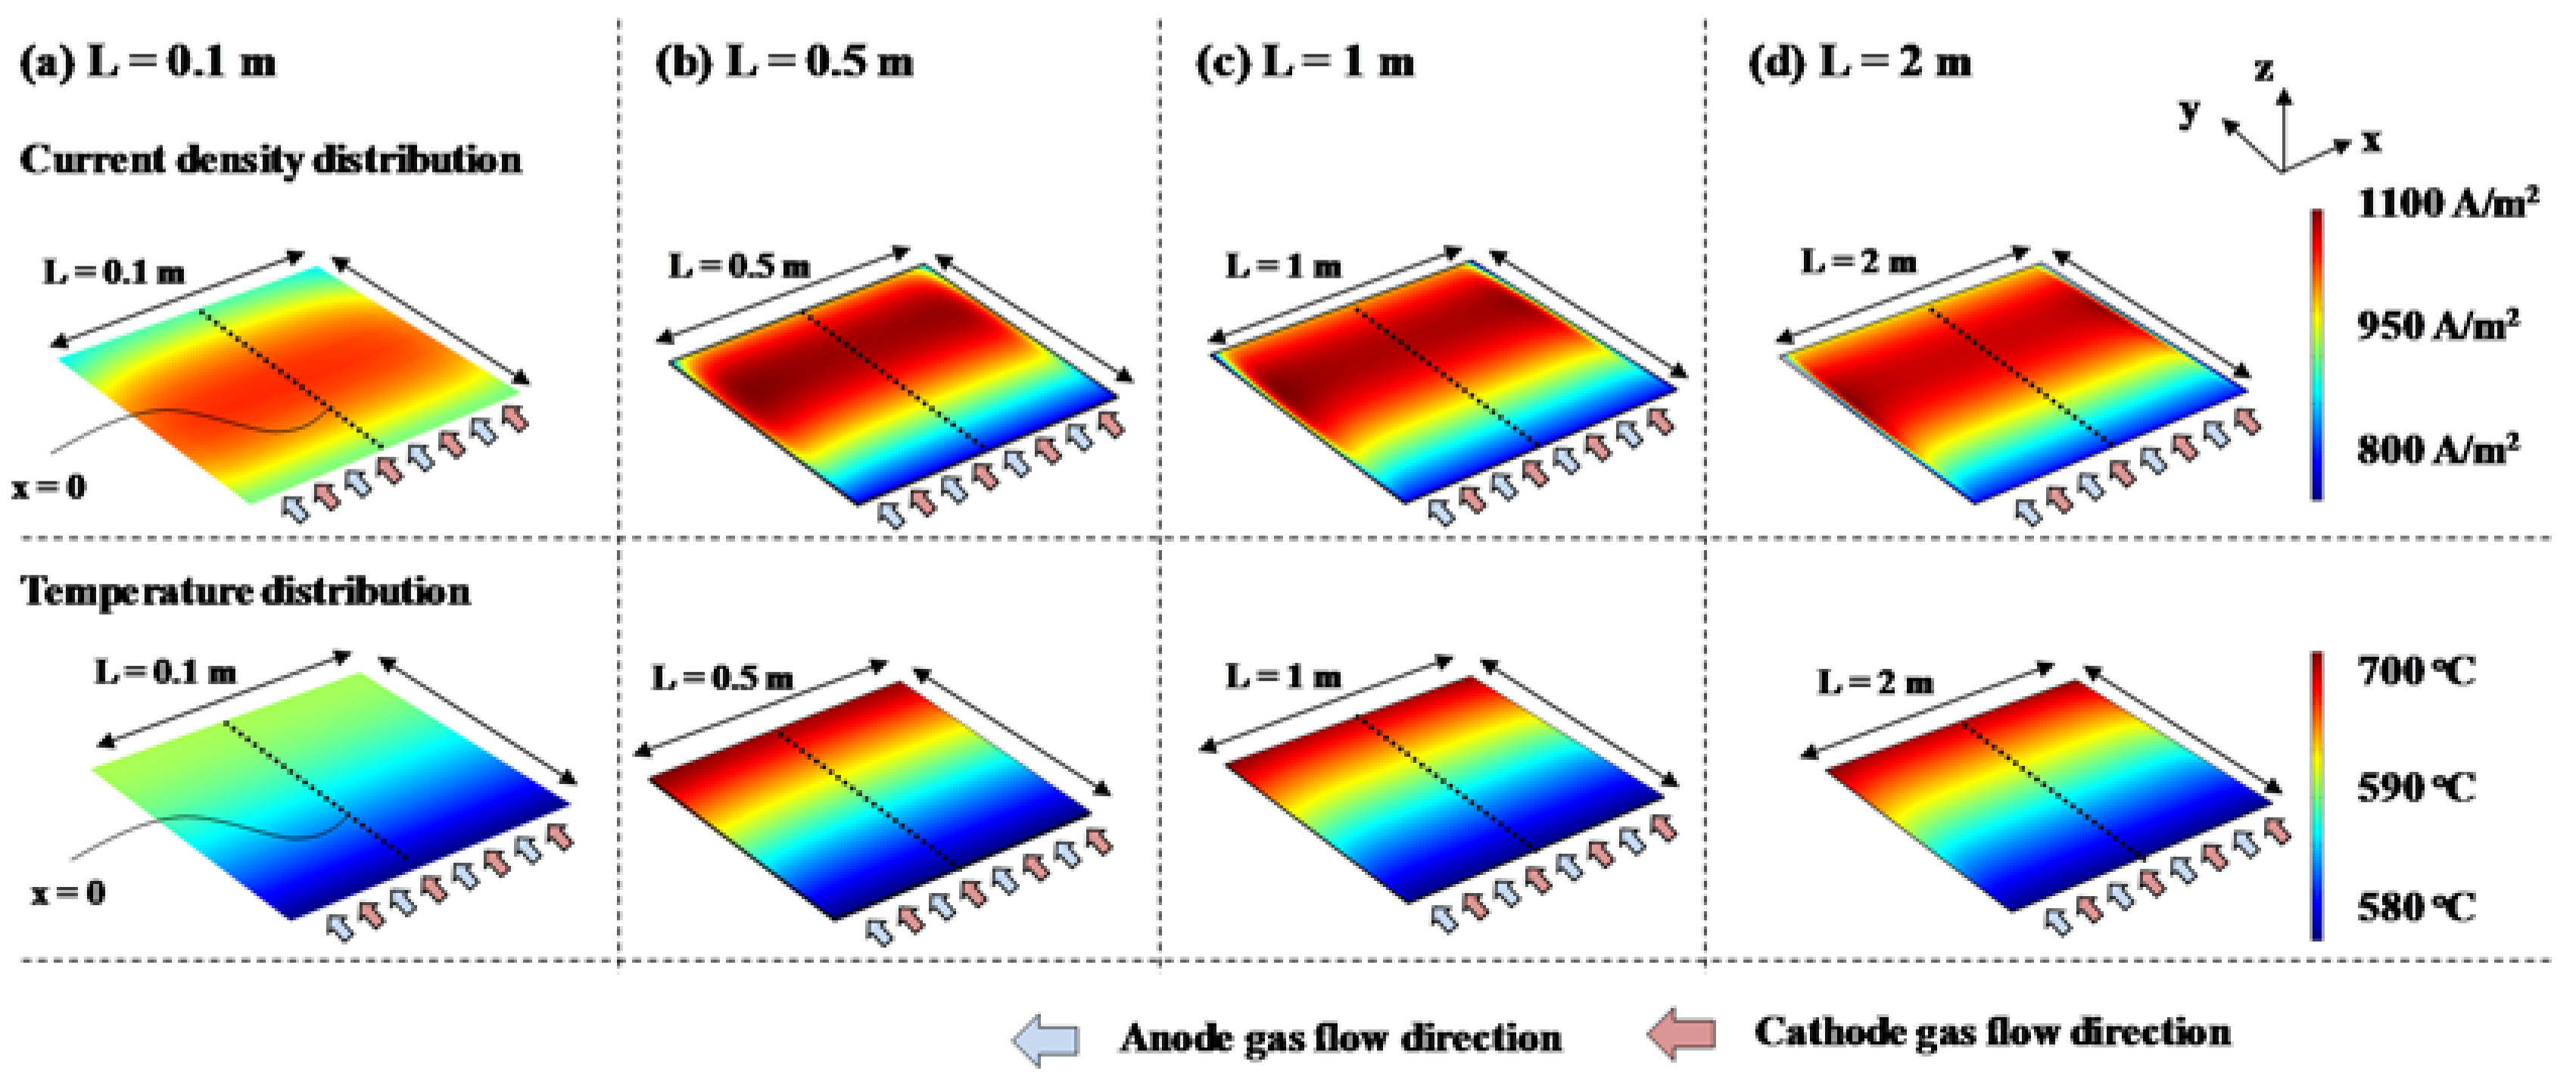
Our first analysis examined the effects of cell size on temperature and current density distributions in the co-flow type cell. Figure 5 shows the results. At a length (L) of 0.1 m, the maximum current density occurred near the cell center. However, when the cell length increased beyond 0.5 m, the maximum current density occurred near the anode gas outlet. The maximum temperature distribution occurred at the anode and cathode gas outlets. The generated heat did not concentrate at the cell center but rather moved along the gas flow direction. As a result, the maximum temperature and the current density occurred at the gas outlet. The minimum values were observed at the inlet.
Figure 6 presents the temperature and current density distributions along the y-direction at the center (x = 0.5 L). The y-direction refers to the anode and cathode flow direction. Figure 6a,b show that an L value of 0.1 m produced different results from other length values. At cell lengths of 0.5 m or more, the current density and temperature distributions were identical, proving that cell performance was independent of size when the length of the cell was 0.5 m or greater.

3.2.2. Counter-Flow Cell

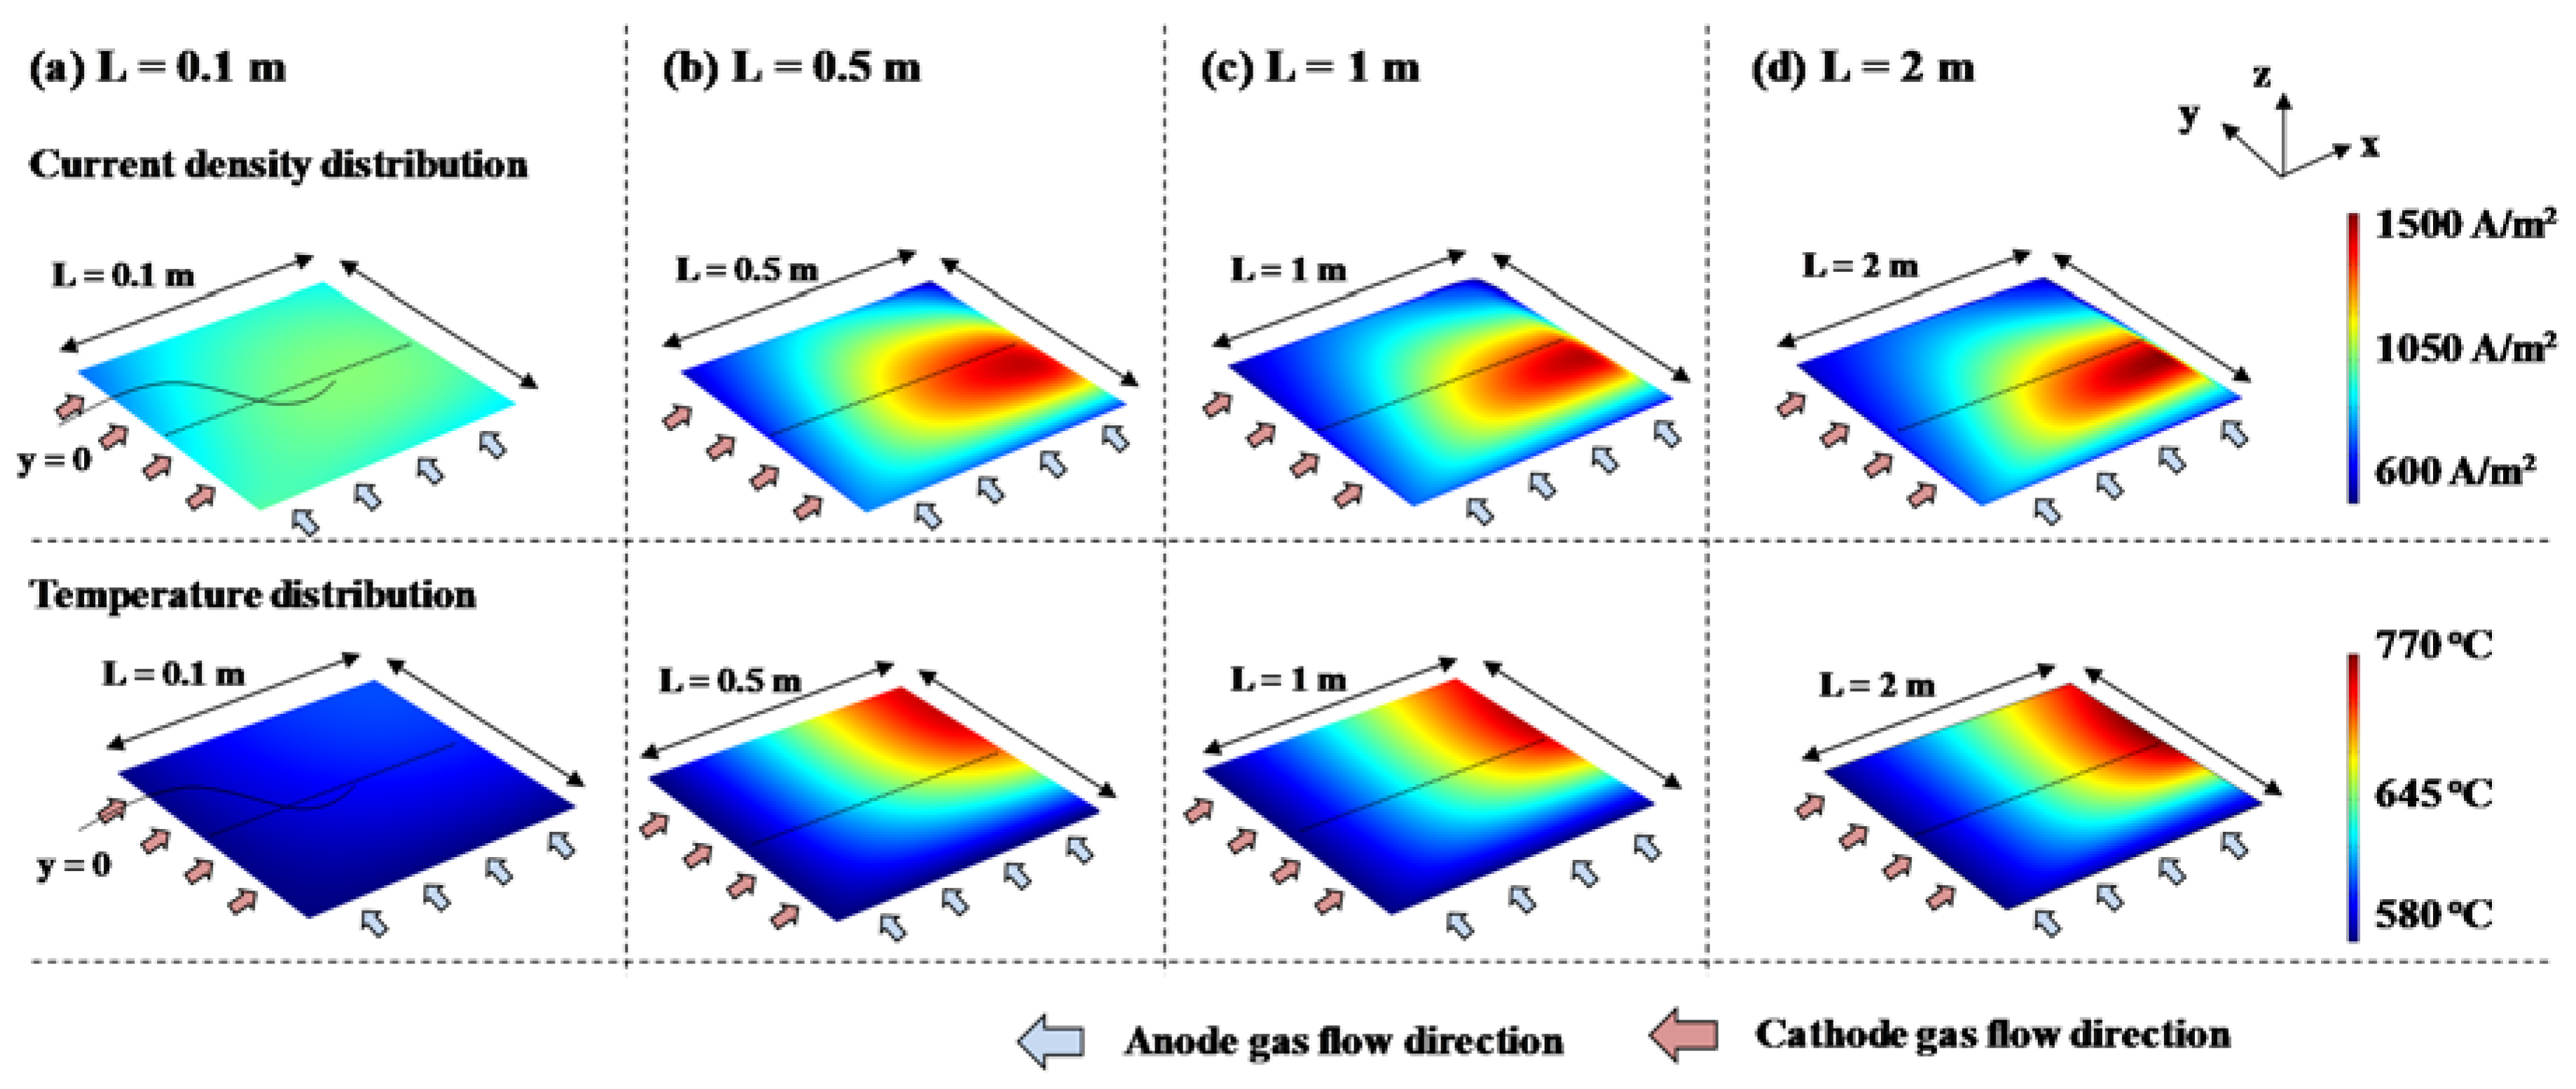
The temperature and current density distributions in the counter-flow cell type are shown in Figure 7. The maximum current density occurred toward the anode inlet and the cathode outlet. At the inlet of the anode gas (or the outlet of the cathode gas), the electrochemical reaction occurred the most. The maximum temperature occurred near the cathode outlet because the sensible heat of the cathode gas exceeded that of the anode gas. As a result, the heat flowed along the cathode gas flow direction. When the size of the cell was longer than 0.5 m, the point of maximum temperature moved in the cathode gas flow direction, as in the co-flow case. At cell sizes of 1 m or more, temperature and current density distributions were similar.
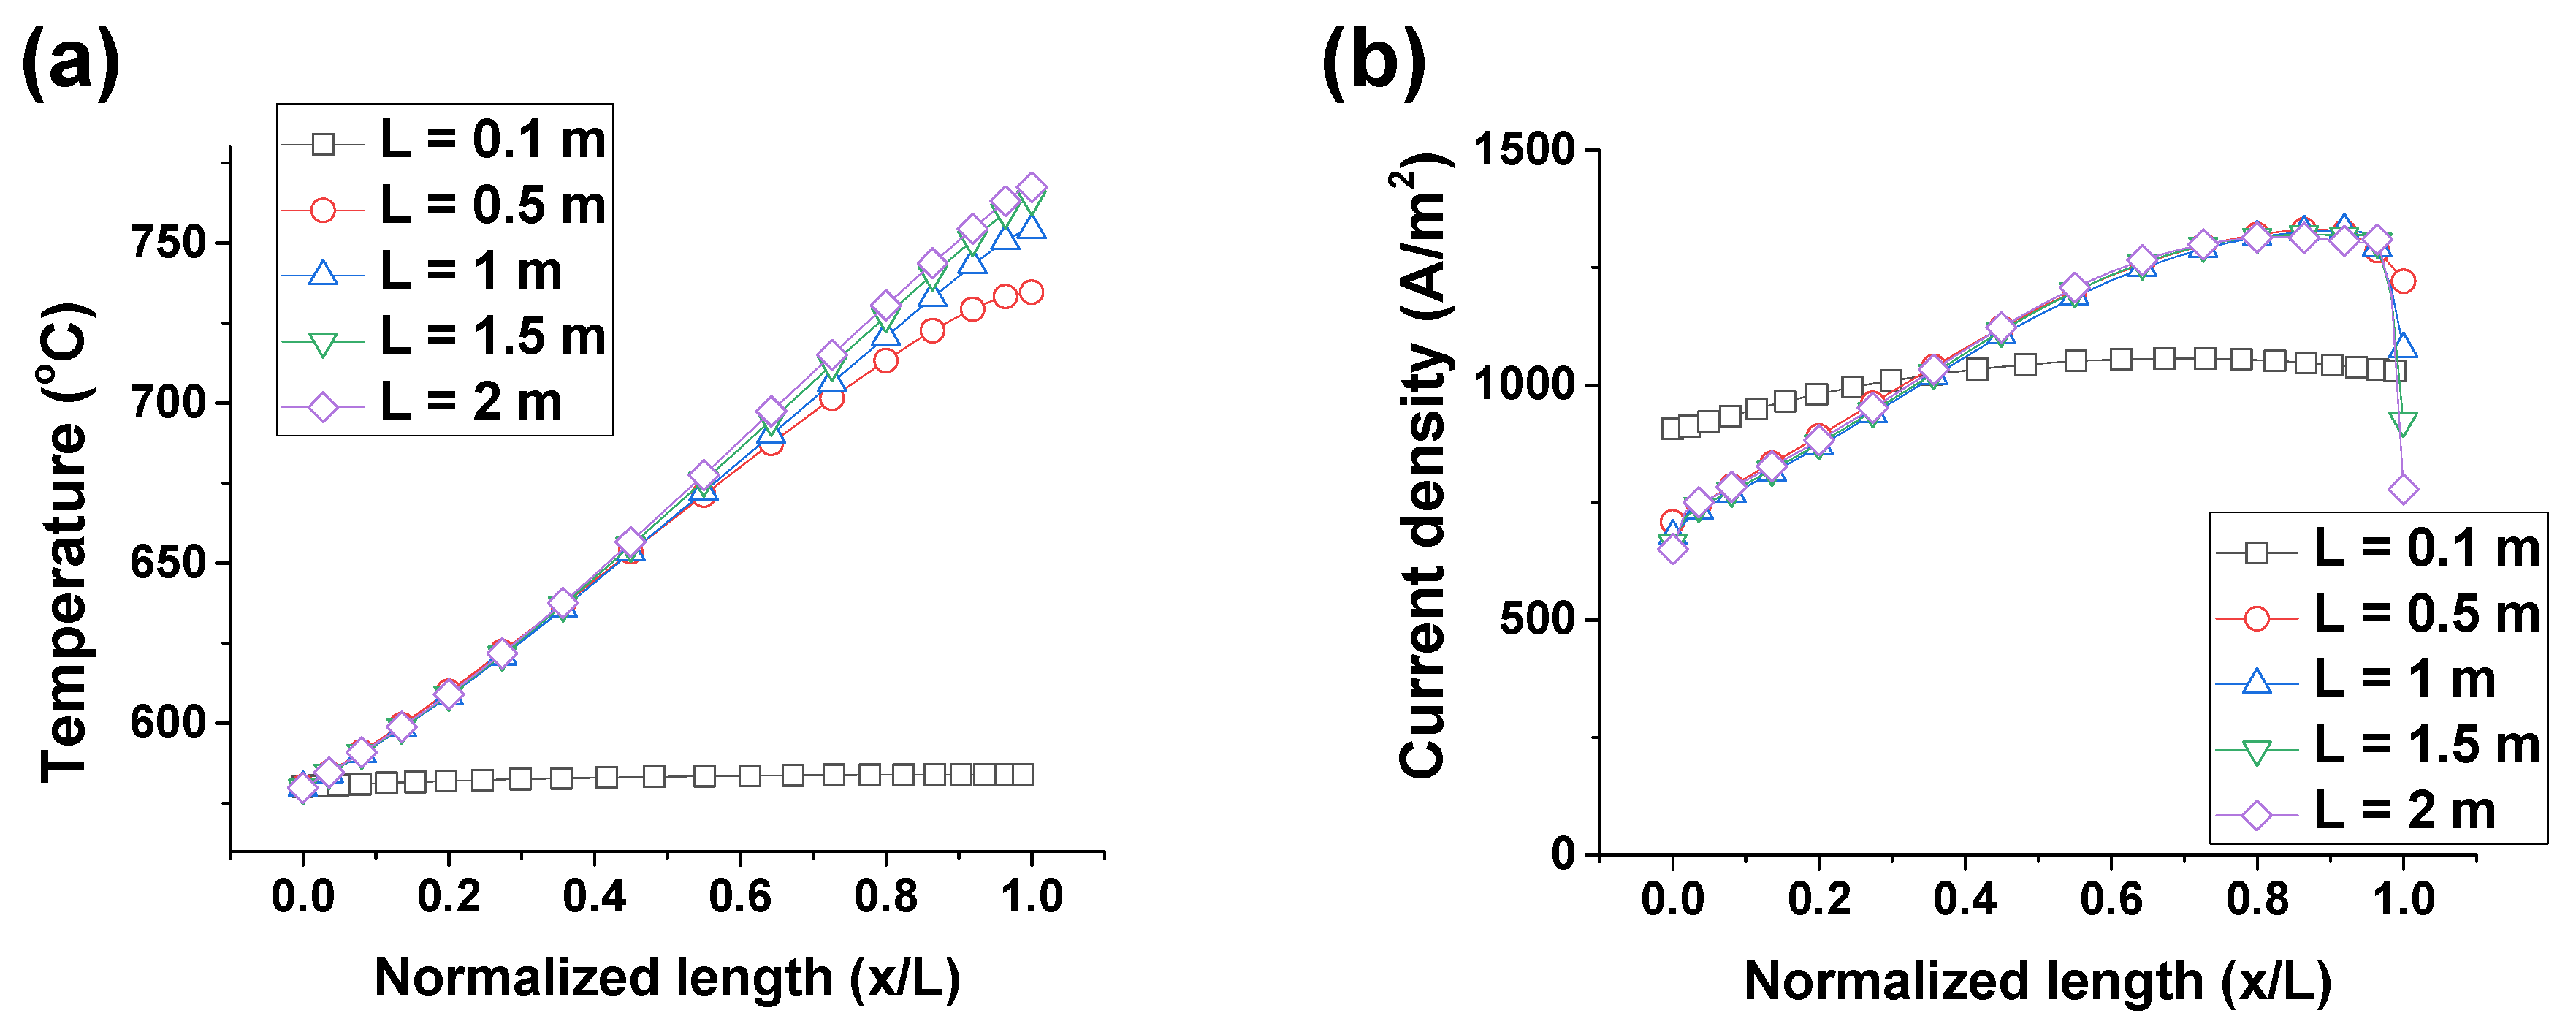
Figure 8 presents the temperature distribution and current density distribution. The normalized length (y/L) value of 0 refers to the inlet of the anode gas and the outlet of the cathode gas. As the length of the cell increased, the position of the maximum temperature and current density moved toward the cathode gas outlet. Furthermore, when the length of the cell was larger than 0.5 m, the concentrated current density and temperature were observed near the cathode gas outlet. The temperature and current density distributions were nearly identical at cell lengths of 1 m and greater.

3.2.3. Cross-Flow Cell

The simulation results of the cross-flow type fuel cells are presented in Figure 9, showing that the maximum temperature was concentrated toward the anode and cathode outlets. Because the cathode gas had a large sensible heat, the maximum temperature was more biased toward the cathode gas flow direction. The maximum current density occurred toward the anode gas inlet. When the cell size was 0.5 m or greater, the temperature distribution and the current density distribution showed similar results.
Figure 10 presents the normalized temperature and current density distributions for the cross-flow type. The temperature was measured along the cathode gas flow direction, where a normalized length (x/L) value of 0 refers to the cathode gas inlet while a value of 1 refers to the outlet. The current increased along the cathode gas flow direction but the current density decreased significantly at the cathode gas outlet. The temperature distribution increased along the cathode gas flow direction. At cell lengths larger than 0.5 m, the temperature and the current density were very similar.

3.3. Discussion

We compared MCFCs using co-flow, cross-flow, and counter-flow configurations. A square cell geometry and five different square dimension lengths (0.1 m, 0.5 m 1.0 m, 1.5 m, and 2.0 m) were examined. In all three flow types, the maximum cell temperature converged as the cell length increased. Figure 11 presents the maximum temperature of each flow type relative to the cell size.
As the cell size increased, the temperature difference relative to the flow type varied significantly. The cross-flow type showed the lowest maximum temperature at a cell length of 0.1 m. At a 0.5 m cell length, co-flow had the smallest temperature difference and counter-flow had the largest. In addition, co-flow and counter-flow showed no significant temperature deviation when the cell size increased to 1.0 m or greater. However, co-flow, counter-flow, and cross-flow showed temperature convergence above 1 m. The converged temperatures of co-flow, counter-flow, and cross-flow at 2 m were 673.8 °C, 836.9 °C, and 737.1 °C, respectively. The temperature difference between 1.5 m and 2 m of co-flow, counter-flow, and cross-flow were 0.4 °C, 0.8 °C, and 1.1 °C, respectively.
The reason why the maximum temperature became constant as the cell size increased was that MCFCs were in an equilibrium state relative to sizes beyond a certain size. With a small length, such as 0.1 m, the effect of the fixed temperature (gas inlet) had a large effect on the temperature distribution. As the length of the cell increased, the effect of the fixed temperature (gas inlet) decreased. Because the heat generation per area is proportional to the current density according to Equation (5), the same current density distribution results in the same temperature distribution.
Fuel cell performance can be expressed in terms of the current density as a function of voltage, most commonly shown as an I–V curve. A higher voltage at the same current density indicates a higher cell performance. Figure 12 presents I–V curves for each cell length for all three flow types. Figure 12a shows the co-flow data. In the case of 0.1 m, the I–V curve showed a low current density at the same cell voltage. However, when the size of the cell increased to more than 0.5 m, there was no big difference. In the cases of counter-flow and cross-flow, the size at which the maximum temperature was reached occurred in cells greater than 1 m. In the case of counter-flow and cross-flow, the cell sizes of 1 m and 2 m did not show a difference. This means that the cell showed similar performances. As the anode polarization resistance, cathode polarization resistance, and internal resistance of Equation (4) are related to the temperature, the performance was similar when the temperature distribution became similar.
Generally, as the fuel cell size increases, the maximum temperature increases [6]. However, the analysis results show that when the cell size increased above a certain size, the cell maximum temperature converged to a certain temperature, and the overall cell temperature and current density distributions also converged to similar values. These results can be used to design MCFCs with desired temperature and current density distributions.
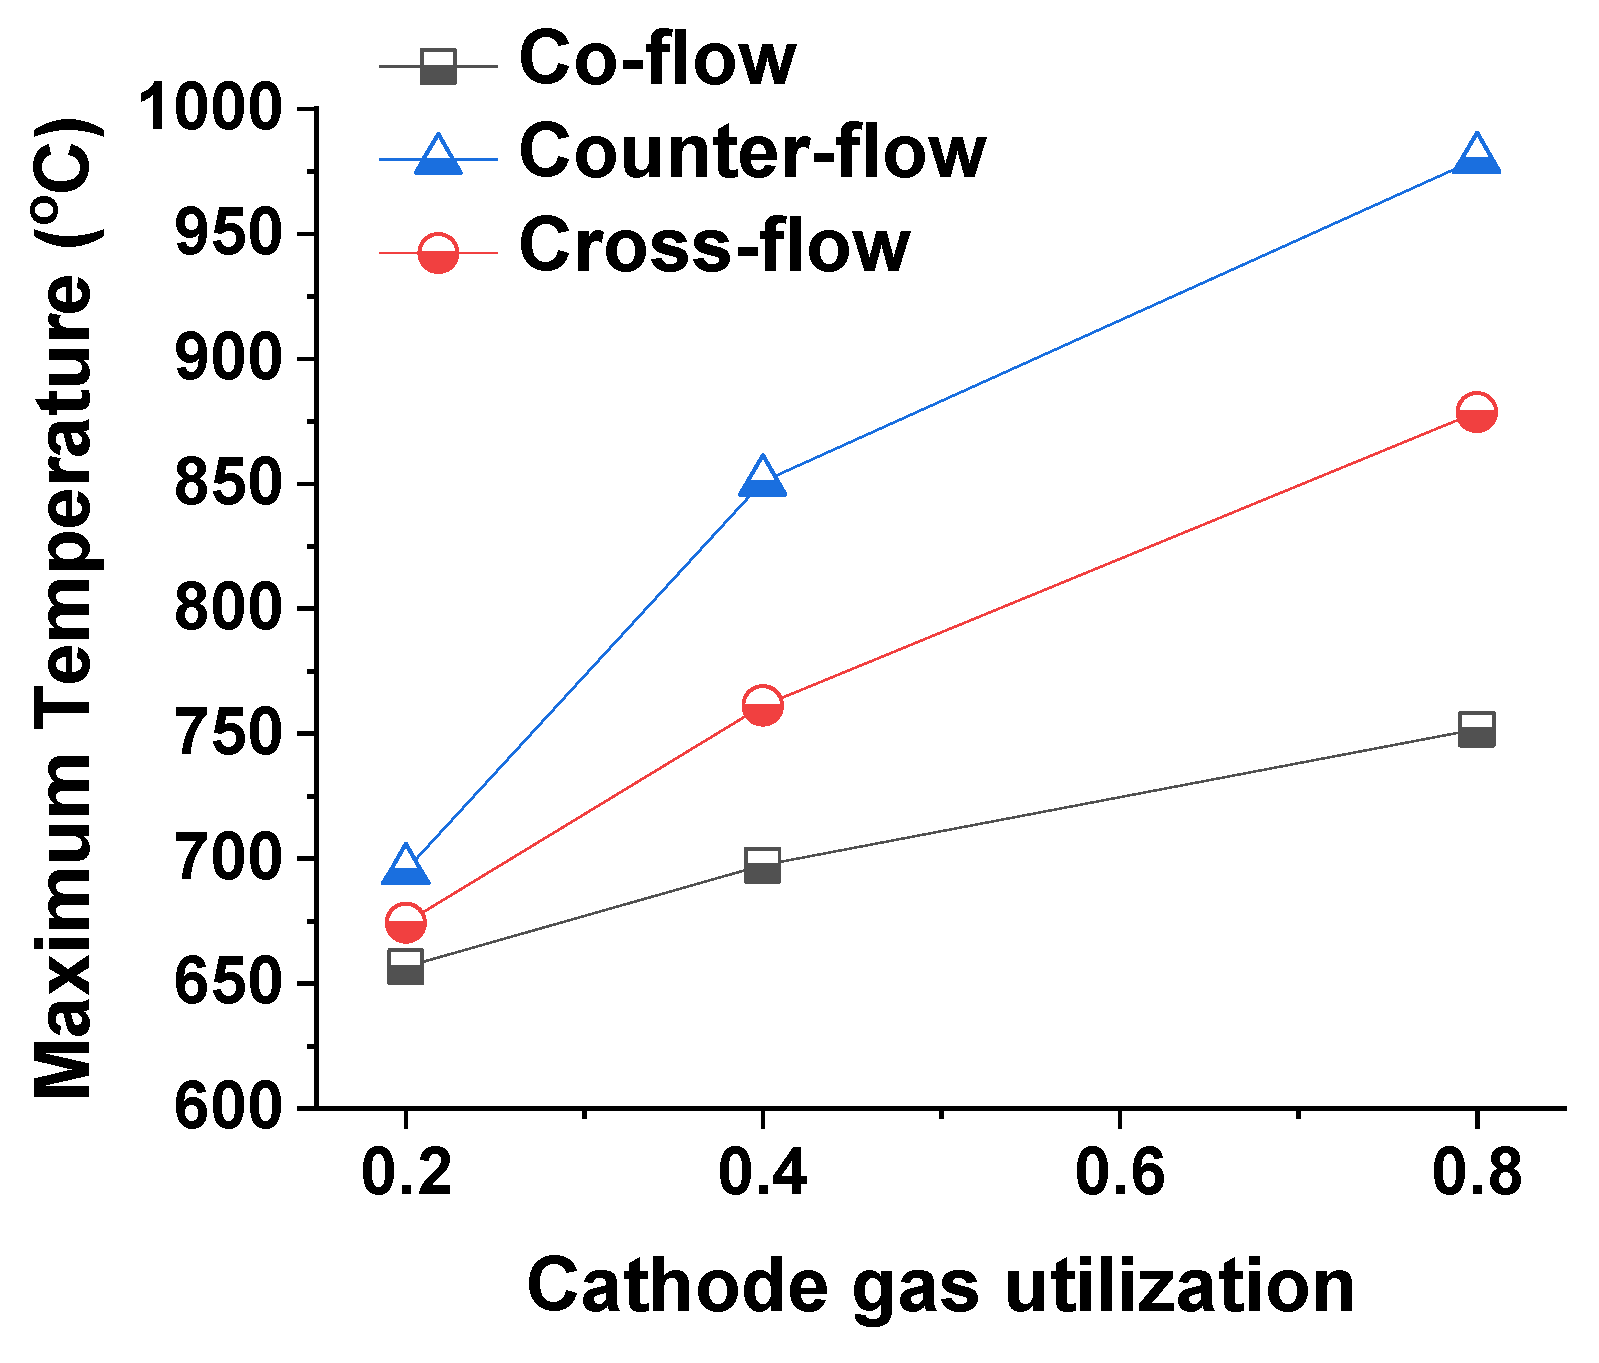
As the gas input of the cathode increased, the gas utilization decreased. At this time, the temperature of the cell decreased because the heat transfer through the cathode gas increased. Increasing the gas input of the cathode side lowered the maximum temperature of the cell and made the temperature of the cell more uniform. As presented in Figure 13, the maximum temperature in the counter-flow could be significantly lowered. At a cathode gas utilization of 0.8, the maximum cell temperature was over 950 °C. This temperature was beyond the operational range. However, with a gas utilization of 0.2, the cell peak temperature was 695.4 °C, which is a decrease in the peak temperature of over 250 °C. Increasing the gas amount of the cathode gas decreased the maximum temperature and made the cell and current density distribution more uniform. Therefore, even if the size of the cell increased, the temperature of the cell could be made more uniform by increasing the gas input at the cathode.

4. Conclusions

In this study, we analyzed the temperature distribution and current density distribution in terms of the gas flow direction and cell size in a molten carbonate fuel cell. Due to the difficulty in experiments with various sizes of the molten carbonate fuel cells, the analysis was performed using computational fluid analysis using the reaction analysis model. Co-flow, cross-flow, and counter-flow were analyzed. The cell size was analyzed using 0.1 m, 0.5 m, 1 m, 1.5 m, and 2 m square sides.
The simulation results showed that all three flows converged to a constant temperature as the cell size increased above a certain value. Co-flow and cross-flow converged to a constant temperature above 0.5 m, with co-flow showing the lowest convergence temperature. Counter-flow temperatures converged above a 1-m cell size at the highest temperature. At larger lengths, the temperature and current density distributions also converged. Increasing the cathode gas input reduced the maximum cell temperature, achieving the most important MCFC design goal.

Author Contributions

Conceptualization, formal analysis, investigation, and methodology: J.-H.Y.; writing—review and editing, supervision, project administration, and funding acquisition: C.-W.L. All authors have read and agreed to the published version of the manuscript.

Funding

This research was supported by the Renewable Energy R&D Program (no. 20163030031860) of the Korea Institute of Energy Technology Evaluation and Planning (KETEP).

Conflicts of Interest

The authors declare no conflict of interest.

Nomenclature

ENernst voltage (V)
ΔGRelated to the free energy change under standard state
FFaraday’s constant (96485 As mol1)
RUniversal gas constant (8.314 J mol1 K1)
PPressure (Pa)
VCell voltage (V)
RtotTotal cell resistance (Ωm2)
TTemperature (K)
iCurrent density (Am2)
KEquilibrium constant of the WGS reaction
kConductivity (Wm1K1)
hHeat transfer coefficient (Wm2K1)
qHeat generation due to the chemical reaction (Wm2)

References

  1. Dicks, A.L. Molten carbonate fuel cells. Curr. Opin. Solid State Mater. Sci. 2004, 8, 379–383. [Google Scholar] [CrossRef]
  2. Yuh, C.; Colpetzer, J.; Dickson, K.; Farooque, M.; Xu, G. Carbonate fuel cell materials. J. Mater. Eng. Perform. 2006, 15, 457–462. [Google Scholar] [CrossRef]
  3. Morita, H.; Komoda, M.; Mugikura, Y.; Izaki, Y.; Watanabe, T.; Masuda, Y.; Matsuyama, T. Performance analysis of molten carbonate fuel cell using a Li/Na electrolyte. J. Power Sources 2002, 112, 509–518. [Google Scholar] [CrossRef]
  4. Kim, Y.J.; Lee, M.C. Comparison of thermal performances of external and internal reforming molten carbonate fuel cells using numerical analyses. Int. J. Hydrog. Energy 2017, 42, 3510–3520. [Google Scholar] [CrossRef]
  5. Yoshiba, F.; Ono, N.; Izaki, Y.; Watanabe, T.; Abe, T. Numerical analyses of the internal conditions of a molten carbonate fuel cell stack: Comparison of stack performances for various gas flow types. J. Power Sources 1998, 71, 328–336. [Google Scholar] [CrossRef]
  6. Koh, J.-H.; Kang, B.S.; Lim, H.C. Effect of various stack parameters on temperature rise in molten carbonate fuel cell stack operation. J. Power Sources 2000, 91, 161–171. [Google Scholar] [CrossRef]
  7. Kim, H.; Bae, J.; Choi, D. An analysis for a molten carbonate fuel cell of complex geometry using three-dimensional transport equations with electrochemical reactions. Int. J. Hydrog. Energy 2013, 38, 4782–4791. [Google Scholar] [CrossRef]
  8. Kim, Y.J.; Chang, I.G.; Lee, T.W.; Chung, M.K. Effects of relative gas flow direction in the anode and cathode on the performance characteristics of a Molten Carbonate Fuel Cell. Fuel 2010, 89, 1019–1028. [Google Scholar] [CrossRef]
  9. Lee, C.-W.; Lee, M.; Lee, M.-J.; Chang, S.-C.; Yoon, S.-P.; Ham, H.C.; Han, J. Effect of the flow directions on a 100 cm2 MCFC single cell with internal flow channels. Int. J. Hydrog. Energy 2016, 41, 18747–18760. [Google Scholar] [CrossRef]
  10. Wolf, T.L.; Wilemski, G. Molten carbonate fuel cell performance model. J. Electrochem. Soc. 1983, 130, 48–55. [Google Scholar] [CrossRef]
  11. Yuh, C.; Selman, J. The Polarization of Molten Carbonate Fuel Cell Electrodes I. Analysis of Steady-State Polarization Data. J. Electrochem. Soc. 1991, 138, 3642–3648. [Google Scholar] [CrossRef]
  12. Park, J.M.; Kim, D.Y.; Baek, J.D.; Yoon, Y.-J.; Su, P.-C.; Lee, S.H. Numerical Study on Electrochemical Performance of Low-Temperature Micro-Solid Oxide Fuel Cells with Submicron Platinum Electrodes. Energies 2018, 11, 1204. [Google Scholar] [CrossRef] [Green Version]
  13. Kim, J.; Lee, S.M.; Srinivasan, S.; Chamberlin, C.E. Modeling of proton exchange membrane fuel cell performance with an empirical equation. J. Electrochem. Soc. 1995, 142, 2670–2674. [Google Scholar] [CrossRef]
  14. Liu, S.-F.; Chu, H.-S.; Yuan, P. Effect of inlet flow maldistribution on the thermal and electrical performance of a molten carbonate fuel cell unit. J. Power Sources 2006, 161, 1030–1040. [Google Scholar] [CrossRef]
  15. Kim, M.-H.; Park, H.-K.; Chung, G.-Y.; Lim, H.-C.; Nam, S.-W.; Lim, T.-H.; Hong, S.-A. Effects of water-gas shift reaction on simulated performance of a molten carbonate fuel cell. J. Power Sources 2002, 103, 245–252. [Google Scholar] [CrossRef]
  16. Hirata, H.; Nakagaki, T.; Hori, M. Effect of gas channel height on gas flow and gas diffusion in a molten carbonate fuel cell stack. J. Power Sources 1999, 83, 41–49. [Google Scholar] [CrossRef]
  17. Koh, J.-H.; Seo, H.-K.; Lee, C.G.; Yoo, Y.-S.; Lim, H.C. Pressure and flow distribution in internal gas manifolds of a fuel-cell stack. J. Power Sources 2003, 115, 54–65. [Google Scholar] [CrossRef]
  18. Kim, D.-W.; Kim, H.-Y.; Choi, J.-H.; Lee, C.-W. Study on the Effects of the Flow Characteristics and Size on the Peformance of Molten Carbonate Fuel Cells Using CFD. Trans. Korean Hydrog. New Energy Soc. 2019, 30, 147–154. [Google Scholar]
  19. Yang, F.; Zhu, X.-J.; Cao, G.-Y. Nonlinear fuzzy modeling of a MCFC stack by an identification method. J. Power Sources 2007, 166, 354–361. [Google Scholar] [CrossRef]
  20. Yoo, M.-J.; Kim, D.-P.; Chung, G.-Y.; Lim, H.-C. Studies on the Numerical Modeling of the Butterfly-type Unit Molten Carbonate Fuel Cell. J. Fuel Cell Sci. Technol. 2006, 3, 327–332. [Google Scholar] [CrossRef]
  21. Lee, C.W.; Yu, J.H.; Kim, H.W.; Ryu, B.H. Effect of the Size of Molten Carbonate Fuel Cells on the Temperature Distribution. Key Eng. Mater. 2018, 773, 118–122. [Google Scholar] [CrossRef]
Figure 1. Microstructures of a NiO cathode, a γ-LiAlO2 matrix, and a Ni + Ni-5wt% Al anode.
Energies 13 01361 g001
Figure 2. Flow types of molten carbonate fuel cells.
Energies 13 01361 g002
Figure 3. Simulation model of molten carbonate fuel cells (MCFCs).
Energies 13 01361 g003
Figure 4. Maximum cell temperature as a function of the number of stacked unit cells.
Energies 13 01361 g004
Figure 5. Current density and temperature distribution with respect to length (L) for the co-flow type MCFCs at the average current density value of 1000 A/m2.
Energies 13 01361 g005
Figure 6. (a) Normalized temperature and (b) current density distribution relative to the length for the co-flow type.
Energies 13 01361 g006
Figure 7. Current density and temperature distribution relative to the length for the counter-flow type.
Energies 13 01361 g007
Figure 8. (a) Normalized temperature and (b) current density distribution relative to the length for the counter-flow type.
Energies 13 01361 g008
Figure 9. Current density and temperature distribution relative to the length for the cross-flow type.
Energies 13 01361 g009
Figure 10. (a) Normalized temperature and (b) current density distribution relative to the length for the cross-flow type.
Energies 13 01361 g010
Figure 11. Maximum cell temperatures relative to the length for the co-flow, cross-flow, and counter-flow cell types.
Energies 13 01361 g011
Figure 12. I–V curves relative to the length for (a) co-flow, (b) cross-flow, and (c) counter-flow cells.
Energies 13 01361 g012
Figure 13. Maximum cell temperatures relative to the cathode gas utilization for each flow type.
Energies 13 01361 g013