Abstract
Although interest in and the importance of green building certification have increased, it is difficult to determine how much less energy the buildings actually consume after obtaining sustainability related certification, such as LEED in the USA, and G-SEED in Korea. Focusing on building energy evaluation, we compared and analyzed the energy evaluation items of LEED and G-SEED. In addition, from the Korean public data portal site, this study investigated the annual site energy consumption (electricity and gas) per floor area of non-residential buildings that obtained G-SEED certification in Korea. The energy consumption of non-certified general buildings was compared with the energy consumption of certified buildings. As a result of examining 84 samples of this study, non-residential buildings with G-SEED certification showed energy use intensity that was at least (35.5 to 48.9)% lower than that of uncertified buildings.
1. Introduction
Globally, there is increasing demand for mitigation of climate change issues. In Korea, as active construction and reconstruction of buildings is taking place due to the overcrowding of large cities and the development of new cities, the necessity of evaluating the environmental performance of buildings is increasing. Buildings account for 1/3 of national energy consumption, 40% of resource consumption, 50% of carbon dioxide emissions, and (20–50)% of waste emissions, and building materials, such as steel, water and sewage, and insulation materials, machinery, and landscaping contribute to further environmental impact. The ripple effect on the industry is large. In March 2012, the Korean Ministry of Land, Infrastructure, and Transport established the Green Building Division, and introduced the Green Building Creation Support Act, Building Energy Integrated Management System, Green Building Certification System, and Energy Efficiency Rating Certification System, to promote green building policies. In December 2014, a basic plan was established and implemented to promote the construction of green buildings step-by-step, and made it mandatory to obtain green building certification for buildings with a total floor area of more than 3000 m2 ordered by public institutions. The number of green building certified buildings in Korea, which started in January 2002, has been increasing rapidly year by year [1]. Although the interest in and importance of green building certification have increased, it has been difficult to determine how much less energy consumption is actually used in buildings after obtaining certification [2].
Therefore, the main goal of this study is to quantitatively identify the building energy savings of applying the green building certification of Korea. To achieve this goal, Korea’s green building certification energy items should be analyzed. Therefore, the energy items of LEED [3], which are widely applied around the world, were compared with G-SEED [4]. And this study investigated the annual energy consumption per floor area of non-residential buildings that obtained G-SEED certification in Korea. The energy consumption of non-certified general buildings was compared with the energy consumption of certified buildings. Specifically, the surveyed EUI (energy use intensity) of non-residential buildings was classified by building use, total floor area, energy consumption, certification grade, and renewable energy, and compared with those of general buildings. The use of buildings can be largely divided into residential and non-residential buildings.
In the case of non-residential buildings, the energy consumption per unit area is significantly higher than that of residential buildings. So, this study focused on the energy consumption of non-residential buildings. Also, gas and electricity usage provided by the government database were surveyed during the annual energy usage survey, while water, and district heating and cooling, were not considered.
2. Review of the Existing Literature and Standards
2.1. Analysis of the Existing Literature
In recent years, researchers have been able to perform benchmark studies by obtaining data on buildings’ actual energy usage from a few databases around the world. Won et al. [5] presented a comprehensive analysis of large-scale office buildings located in New York and Chicago, with respect to their energy use intensity (EUI). In New York City, the smallest EUI median was found in the buildings with 20 to 30 floors, and in Chicago, the buildings with 60 floors or more. This research concluded that a higher source-to-site ratio generally had lower overall EUI in both cities.
Kim et al. [6] suggested the necessity of systemizing building life cycle management by grasping the post-management status of multi-unit houses that received incentives through G-SEED and energy efficiency rating certification. In particular, the energy performance of green buildings with high ratings and incentives was identified. Nine out of twelve complexes received G-SEED, but only one of them showed significantly higher efficiency than average energy use. The analysis confirmed that the contents of G-SEED and energy efficiency rating certification were not properly managed in the actual use stage, and certified building was operated at the user’s convenience, because there was no obligation to disclose information on the energy efficiency rating system. Therefore, it was urgent to grasp the status of the post-management of energy consumption.
Lee [7] compared the energy consumption of G-SEED certified and non-acquired public libraries. When the same conditions were entered in the energy analysis program, the results showed that libraries with green building certification use more energy than do non-certified libraries. G-SEED has energy-related items, but this is because active items, such as HVAC, are not related to passive elements. The areas of facility evaluation for different uses of energy, such as libraries, hospitals, and research institutes, need to be further refined.
Jeong [8] conducted a survey on energy consumption and energy cost centering on large buildings (10 certified and 10 uncertified) that have high energy consumption among office buildings. The energy consumption of the target building was identified, and the appropriateness and effects of the green building certification evaluation factor were examined. According to the analysis of electric energy cost and water cost per unit area, eco-friendly certified buildings realize about 13% cost reduction compared to non-certified buildings, and the average annual energy cost per resident population is about 18%.
The research literature on the energy consumption of green building certified buildings is as follows. Scofield [9] indicated that LEED offices used, on average, 17% lower site energy than CBECS (Commercial Buildings Energy Consumption Survey) offices, but no less source energy. But reference [9] explained that large buildings dominate the energy consumption of a set of commercial buildings. Despite the fact that many of the smaller LEED buildings outperform their conventional counterparts, it matters little, because they do not contribute to the total energy nearly as much as a handful of larger buildings. In addition, Scofield’s subsequent study of 2011 [10] examined the energy consumption, greenhouse gas (GHG) emissions, and ENERGY STAR energy performance rating (EPR) data. Twenty-one of them are LEED-certified buildings, allowing their energy performance data to be directly compared with non-certified buildings. The study concluded that LEED-certified buildings did not generally reduce costs when compared to non-certified buildings in terms of energy consumption and greenhouse gas emissions. Some gold-certified LEED buildings performed 20 percent better than other commercial buildings in New York, while silver and certified buildings did not perform as well as regular buildings. Another Scofield et al.’s follow-up studies [11] analyzed the energy consumption for apartment houses. For all three building types, this study indicated that LEED-certified buildings use no less source energy than similar buildings that are not LEED-certified.
There has also been research on the methodology of comparing energy usage between certified and uncertified buildings. Choker et al. [12,13] introduced an assessment methodology that compares LEED buildings to a benchmark developed from similar non-LEED building counterparts, while also accounting for variables such as the main weather, building characteristic(s), and schedule(s).
There are many negative and positive studies on energy saving in green building certified buildings. A recent literature analysis analyzes and summarizes studies on this subject. Amiri et al. [2]’s search located 164 research papers that covered energy efficiency topics in LEED-certified buildings. Of these, Forty-four peer-reviewed papers were selected and analyzed. When comparing LEED-certified buildings with non-LEED-certified buildings, the reliability of the results is an issue, and factors such as the age and size of the building, its use, climate zone, and resident awareness should be considered. We also concluded that if only the energy consumption of the buildings that the building owner has allowed for comparison is considered, the results may vary, so the buildings to be compared had to be randomly selected. Ten out of the 44 papers reported that the energy efficiency of LEED-certified buildings was high, while eight papers concluded that the efficiency was poor. The remaining 26 papers indicated that the energy efficiency was neither good nor bad. Analysis by certified grades shows that while energy consumption is lower for buildings with higher grades, such as Gold or Platinum, energy consumption for low certified buildings is almost the same as for non-certified buildings. However, due to the lack of various energy data in various parts of the world, other than the United States, it is impossible to clarify the actual energy efficiency of LEED-certified buildings. The study also suggested that LEED’s standards for Energy and Atmosphere standards need to be revised, to improve the building’s actual energy performance.
The above existing studies have been performed based on various kinds of actual data (EUI). However, most studies based on actual EUI data were for LEED certified buildings. In addition, studies in Korea included 12 residential complexes or 1-2 G-SEED certified public buildings. In this study, we obtained more number (84) of EUI data for certified non-residential buildings than the previous study. In addition, this study will be the first paper to analyze the energy consumption of certified buildings using Korea’s building statistical information DB system. Therefore, through this study, we expect to be able to present quantitative results on energy efficiency of certified buildings in Korea, which were not carried out before.
2.2. Comparison of LEED and G-SEED
Korea’s G-SEED is divided into preliminary certification that is applied in the building design stage, and main certification that is applied in the use approval stage. To obtain incentives, the G-SEED is rated at or above the G-SEED green 2 grade, and at least second grade in the energy efficiency grade evaluation of the Korea energy agency, or Energy Performance Index (EPI) scores of 80 or higher. Unlike LEED, buildings with a total floor area of 3000 square meters or more ordered by public institutions are required by law to obtain G-SEED certification. The incentives allow construction project owners to benefit from the reduction of building standards (volume ratios, maximum floor heights, and landscaping area reductions), while the owners can benefit from reductions in employment and registration taxes, property taxes, and environmental burdens. No legal regulations mandate LEED certification in the United States, but incentives, such as rising rent income, premiums, and tax benefits, are known and recognized. While the latest version of LEED is v4.1, which was available from July 25, 2019, this study used v4.
Table 1 shows G-SEED and LEED standards. G-SEED standards are divided into apartments and non-residential buildings [3,4]. Both G-SEED and LEED are broken down into four grades, based on scores. Table 2 shows a comparison of the scores of the standard items [3,4,14]. The G-SEED item scores are largely divided into eight categories excluding essential items, and the total score is 115 points. The LEED consists of nine categories with a total score of 110. G-SEED and LEED both score the highest in energy and environmental pollution (atmospheric), accounting for (25.2 and 33.3)% of the total scores, respectively. In terms of the total scores, the innovative design (technical) item scores accounted for 16.5% of the total score for G-SEED, and 5.5% for the LEED. Table 3 shows the evaluation target for each G-SEED and LEED criterion [3,4,15]. While G-SEED classifies the evaluation targets according to the detailed use of the building, LEED classifies the targets by construction stage and size first, and the evaluation targets by detailed building use.

Table 1.
Certification level and G-SEED and LEED scores.
Table 2.
G-SEED and LEED Evaluation section scores.
Table 3.
Comparison of G-SEED and LEED Evaluation Targets.
Table 4 compares the energy evaluation items of G-SEED and LEED in detail among the various items of Table 2 [14,16]. The composition of energy evaluation items for G-SEED is similar to that of LEED. In the commissioning sector, LEED also includes content that is not closely related to energy, such as the Owner’s Project Requirements (OPR), or Basis of Design (BOD). Commissioning for water management or noise is only carried out under OPR, while HVAC, lighting, local water system, and renewable energy are mandatory commissioning items. However, G-SEED consists of all items that meet the Testing, Adjusting, Balancing (TAB) and commissioning standards. LEED can receive credits according to the training of operating personnel and tenants after providing the maintenance manual, but there is no corresponding item in G-SEED. In the energy performance category, the LEED energy performance can be judged by the amount of savings that the building has saved on energy costs. However, G-SEED uses the Energy Performance Index (EPI) review.
Table 4.
Comparison of LEED and G-SEED energy evaluation categories.
In many cases, it is difficult to identify energy savings based on EPI scores alone. In the global warming sector, LEED incorporates the equipment life cycle, ozone depletion index, and global warming index. In comparison, G-SEED is simple, but it considers not only refrigerants, but also insulation, and can be scored when using carbon dioxide reduction systems. In the sustainable energy source sector, LEED is divided into two sub-categories, with a total of 5 points, with 3 points and 2 points. On the other hand, G-SEED has only three points, but the G-SEED score is similar, because there are separate renewable energy items in the EPI and CO2 emission reduction. In the field of measurement, the previous version of LEED could achieve up to three points by implementing Volume 3 of the International Performance Measurement and Verification (IPMVP) for one year after entering the building, and resolving any problems found. If the user shares their usage data with a USGBC account, they could earn one point. In the v4 version, this is required, and an advanced energy metering system has been established to collect the hourly usage, energy consumption, and demand of buildings. In G-SEED, scores can be obtained depending on the use of energy meter. Two points are awarded for weighing air conditioning, heating, hot water, lighting, electrical outlets, air conditioning fan power, etc. In the latest version, LEED v4.1, two items of renewable energy are integrated into one of Renewable Energy. Also, to increase participation in demand response technologies and programs that make energy generation and distribution systems more efficient, increase grid reliability, and reduce greenhouse gas emissions, energy and atmospheric, grid harmonization replaced demand response.
Figure 1 is a graph based on the DB based on the green building certification status distributed from the G-SEED web site [17]. The high bar indicates the number of pre-certifications, while the low bar indicates the main certification case amount (number). The trend line in the graph represents the cumulative sum of the number of certifications. The number of certifications is increasing every year. In addition, as the rate increases, the slope of the trend line increases from year to year, starting with three cases in 2002 when the green building certification was introduced; and it shows an exponential increase in January 2019, with a total of 11,907 cases. Through this, it can be seen that both the interest in, and importance of, green building construction certification have increased in Korea. Figure 2 shows the percentage of the total status of certification grades for buildings that obtained this certification by 2019. Among 4,406 of main certification acquired cases, Green 1–4 grades are (6, 43, 13, and 38)%, respectively. Green 1, the most difficult to obtain certification, was the least, while green 2 and 4 accounted for more than 80%.
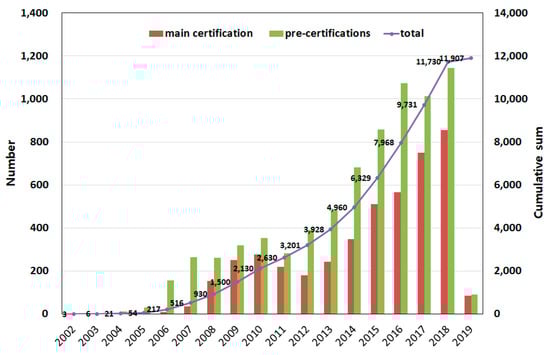
Figure 1.
Cumulative status of green building certification acquisition by year in Korea.
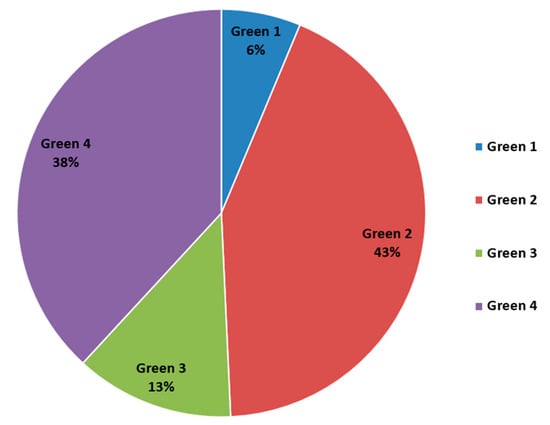
Figure 2.
Certification status by G-SEED grade.
2.3. Survey on Energy Consumption (EUI) per Building Floor Area
After investigating the address in the building database that had obtained green building certification, various codes, such as city and district codes and court codes, were secured. Figure 3 is a national public data portal site that provides information on electricity and gas energy usage for buildings through the Open API [18]. Figure 4 [19] is a sub-web page of Figure 3 showing the electricity and gas energy usage request variables page. If the building’s statutory building code is entered on the request variable input web page of Figure 3, the electricity or gas energy consumption value (in kWh) of the year and month is obtained. Figure 4 shows an example of the January 2015 gas consumption request for a building corresponding to information of input values (11680, 10300, 0012, and 0000) (city, east, town, district). Through this method, this study collected monthly electricity and gas energy usage data of green building certified buildings for three years in 2016, 2017 and 2018.
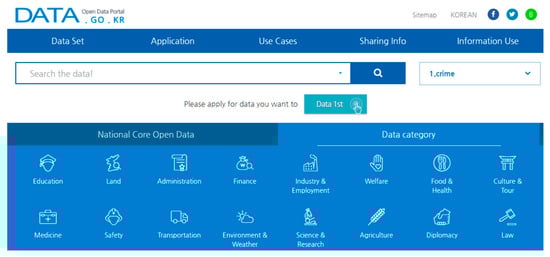
Figure 3.
Public data portal site (OPEN API).
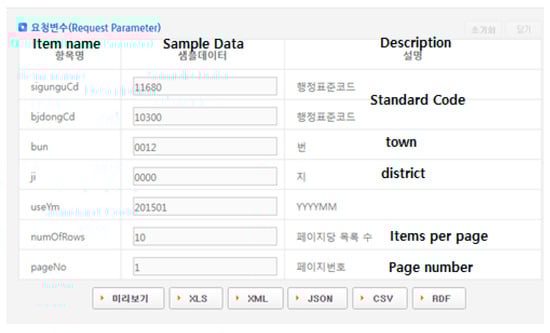
Figure 4.
Building energy usage request variable input webpage.
3. Comparison of Building Energy Consumption
3.1. Estimation of General Building Energy Consumption
In order to grasp the level of energy consumption of green building certified buildings, it is necessary to estimate the energy consumption of non-certified general buildings. To grasp the level of energy consumption of green building certified buildings, the average energy consumption by each building use in Korea was investigated. Table 5 presents the data that can be used to understand the energy consumption of typical Korean buildings. This table is used to calculate the installation capacity of renewable energy that is mandatory for new public buildings. The energy consumption of general buildings in Korea can be estimated. The data in this table is the average energy consumption data for each building used, as shown in the calculation criteria and method of the ratio of renewable energy supply obligation in Annex 2 of the Regulation on the Support of Renewable Energy Facilities [20]. For other data that can be used to grasp the energy consumption by use of Korean general buildings, Table 6 shows the energy consumption status by building use and energy source in 2012 [21]. The 2012 data surveyed through the integrated building energy management system, and energy consumption data in Table 6 is for the buildings in Seoul city, Korea. The data in the two tables (Table 5 and Table 6) are similar for the work, sales, and lodging facilities that occupy a large proportion of the buildings, which are considered to be suitable as comparative values of energy consumption for general non-residential buildings.
Table 5.
Average Energy use intensity (EUI) by building use in Korean regulations.
Table 6.
2012 Energy Consumption by Building Use and Energy Sources of Seoul, Korea.
3.2. Survey on the Energy Consumption of Green Building Certified Buildings
In this study, monthly gas and electricity energy consumption (kWh) for three years from 2016 to 2018 was investigated for non-residential buildings, whose EUI is considered to be higher than residential buildings, using the public open data system [18]. As of July 2019, 161 non-residential buildings have received green building main certification. Of these, in at least one year, 84 buildings were able to obtain complete monthly electricity and gas energy usage data for more than 12 months. Units of surveyed energy usage data need to be unified for comparison between buildings. Therefore, monthly electricity and gas energy was summed up annually, and divided by the total floor area, to calculate the annual average energy consumption (Site EUI: Energy Use Intensity (kWh/m2a)). The usage of buildings was classified into three categories: public, commercial, and religious facility.
Figure 5 is a graph showing the average building energy consumption by year of 84 buildings. The linear graph represents the average building energy consumption (EUI) per floor area of the certified building for the year, while the bar graph represents the number of sampled buildings for the certification year. In 2009, it reached a high value of 240 kWh/m2.a, decreased until 2013, but increased to 2015, and was lowest in 2017. The slope of the trend line indicates that the average energy consumption of certified buildings decreases as the certification year elapses, but the number of samples is small in a particular year, and the R2 value is 0.1146.
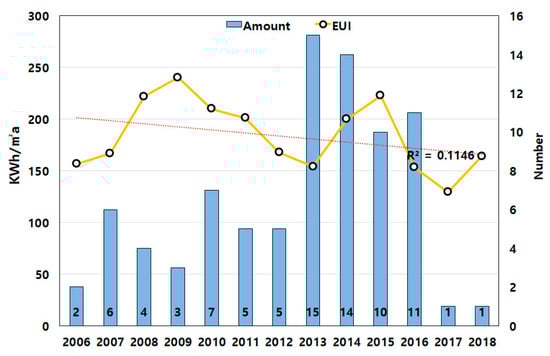
Figure 5.
Average EUI of 84 buildings by G-SEED certification year.
Figure 6 shows the average and number of energy usage by the total floor area. The bar graph shows the number of sample buildings by total floor area range, while the line graph shows the average EUI value of the corresponding total area buildings. The number of samples of buildings with a total floor area of less than 50,000 m2 was large. The energy consumption trend line seems to increase as the total floor area is gradually increased, but the correlation between the total floor area and the energy consumption is low, due to the low R2 value of 0.0164. In Figure 6, the average number of buildings in the area of (55,000–60,000) m2 is 2, while the average EUI value seems to be the largest singular value. Because the Korean parliament building, one of these two, consumes a lot of energy, the results in Figure 6 are somewhat different from those of the previous study [11], which found that certified buildings with large floor areas consume more energy. Since there are not many samples of large buildings, it will be necessary to obtain relevant data later.
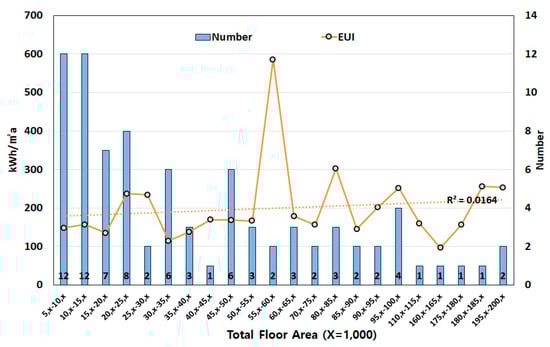
Figure 6.
EUI average and number of samples by total floor area.
Figure 7 shows the range in which the EUI of a certified building is most concentrated. The bars represent the number of buildings corresponding to the ranged average EUI. The highest number of buildings in the (150–200) kWh/m2a range was 24, followed by 20 buildings in the (100–150) kWh/m2a range; 82% of the total 84 buildings are concentrated in the range (50–250) kWh/m2a. From the above result, buildings that have obtained G-SEED certification in Korea are considered to have low energy consumption.
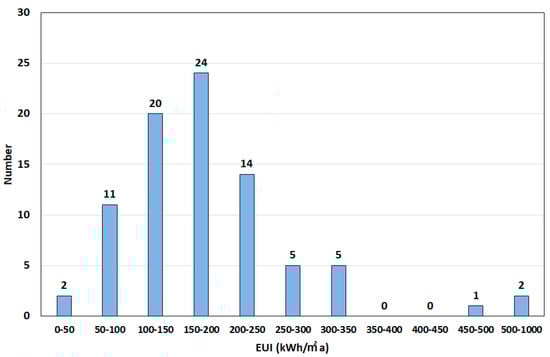
Figure 7.
Number of samples by EUI distribution.
Table 7 was prepared to determine the EUI according to the G-SEED certification grade and average total floor area. The higher the certification level, the higher the energy efficiency. Therefore, the energy consumption is considered below. However, the average EUI of the Green 1 class is 201.30 kWh/m2a, and the lower the grade, the lower the EUI. It is noteworthy that the average total floor area according to the G-SEED certification grade in Table 7 shows that the average total floor area is significantly higher for buildings with higher grades. This is reminiscent of the previous studies [6,12], which showed that energy rated buildings with higher LEED certification are more energy-efficient than general buildings. The phenomenon of ‘the higher the G-SEED certification level, the higher the average EUI’ may be related to the total floor area of the building. If Korea’s building energy database is activated in the future, it will be possible to clarify EUI according to the total floor area between certified buildings and general buildings using big data.
Table 7.
Average EUI and average total floor area by G-SEED certification class.
Table 8 was prepared to understand the effect of the installation of renewable energy on the EUI of G-SEED certified buildings. A total of 84 G-SEED certified non-residential buildings were surveyed through an Internet search and telephone inquiries for the application of photovoltaic, geothermal, and solar thermal energy, which are mainly applied to buildings. Buildings using renewable energy consumed 20.2% less energy than buildings to which renewable energy was not applied, and the energy consumption of buildings with both photovoltaic and geothermal energy was the lowest among renewable energy. Among the buildings to which renewable energy was applied, the energy consumption of the buildings to which photovoltaic, solar, and geothermal were applied is high. As mentioned above, Korea requires the mandatory installation of renewable energy in the case of public buildings of 1000 square meters or more that are newly built in the regulations on the support of renewable energy facilities [20]. In the early days of the enforcement of regulations (from 2004 to 2010), the public was interested in renewable energy, so many newly constructed public buildings applied photovoltaic, solar, and geothermal energy. Since a certain percentage of the total construction cost was calculated as the cost of installing renewable energy until the law was amended, photovoltaic, which is relatively easy to install, was mainly applied. Since this law was revised as a percentage (2011: over 10%, 2019: over 27%, after 2020: over 30%) of the energy consumption expected in the operation of buildings in 2011, the application of geothermal energy and photovoltaic, which can be installed at high capacity, has increased.
Table 8.
Average EUI of G-SEED Certified Buildings according to Renewable Energy Installation.
To compare EUI by building use, Table 9 compares the average EUI by use of G-SEED certified building and general building EUI. In the table, the EUI of a general building is a value referring to Table 5 and Table 6. In Table 9, the two percentage values in parentheses on the right end are relative comparison values for comparing the energy performance of G-SEED certified buildings to those of general buildings and equation of relative difference is {(general building EUI–certified building EUI)/general building EUI × 100}. With the exception of libraries (3 cases) and memorials (1 case), certified buildings for almost all uses showed lower values than the energy consumption of general buildings.
Table 9.
Comparison of average EUI of G-SEED certified buildings and general buildings by building use.
In Table 9, the most common uses were public administrative buildings (21) and office buildings (20) for commercial lease. These two uses in the office shows that the certified buildings for public administration work have up to 48.2% better energy performance than the uncertified buildings. In addition, certified commercial leasing office buildings also show up to 45.5% better energy performance than non-certified business buildings. The site EUI for certified public administrative and commercial leasing office buildings was (192.49 and 203.94) kWh/m2a, respectively. The New York City survey of 953 office buildings [9] in 2011 found that the EUI for LEED-certified and non-certified office buildings was 307.8 and 308.3 kWh/m2a. The site EUI may differ between New York and Korea buildings due to the difference in climate between New York and Korea, and the composition and certification criteria of the building. However, the results of EUI (308.3 kWh/m2a) of the general office building of New York and the EUI ((315.77–371.66) kWh/m2a) of Korean general office buildings are similar. As in the US energy benchmarking system, detailed comparisons need to be made in the future based on large samples of Korean building energy usage data. However, after surveying 84 samples of this study, the EUI of non-residential buildings with G-SEED certification is at least 35.5%, and up to 48.9%, lower than that of non-certified buildings.
4. Discussion and Conclusions
To quantitatively identify the building energy savings of applying the green building certification of Korea, this study compared Korean G-SEED and United States LEED energy certification criteria. In addition, annual monthly electricity and gas energy consumption data of G-SEED certified buildings in actual operation were collected and analyzed, and compared to non-certified general buildings. The results and discussions are summarized as follows.
The use of buildings targeted by G-SEED and LEED is similar, but LEED classifies objects first by construction stage and scale. In the case of G-SEED, it is required to obtain mandatory certification depending on the purpose and size of the building. In addition, the certification process and incentives are regulated by law. This is somewhat different from LEED conducted in the private sector. In terms of energy performance evaluation, it is easy to determine the amount of energy cost savings when evaluating LEED energy performance; but for G-SEED, it is difficult to identify the level of energy savings using the EPI (Energy Performance Index) review. It is necessary to apply a detailed process of energy simulation to G-SEED.
In order to grasp the level of energy consumption of green building certified buildings, it is necessary to estimate the energy consumption of non-certified general buildings. In this study, we applied the energy consumption data of general buildings proposed by Korean law and the energy consumption status data of each building use and energy source for Seoul city in 2012, which was investigated by the Ministry of Land, Infrastructure, and Transport of Korea through the integrated building energy management system. The annual and monthly gas and electric energy consumption (kWh) of 161 buildings with green building main certification were investigated using an open building data system operated by the Korean government. Among them, 84 buildings with complete data were selected for analysis. The change in site EUI according to the year of green building certification was low. The correlation between the total floor area of the certified building and the site EUI was also low. Of the 84 certified buildings, the site EUI of 57 buildings was less than 200 kWh/m2a, indicating that the energy efficiency performance of the G-SEED certified non-residential building was high.
In contrast to previous studies on LEED, the lower the G-SEED grade, the lower the EUI. In contrast, the average total floor area of high-grade buildings was high. In Korea, larger and more expensive buildings strive to achieve higher certification levels at the design stage. However, in actual operation, energy savings do not appear to be possible. Therefore, it is necessary to review the post-operation evaluation items after the completion of the building under G-SEED standards.
The installation of renewable energy has been shown to help improve the energy efficiency of G-SEED certified buildings. Buildings with renewable energy showed an average 20% lower site EUI than uninstalled buildings. In Korea, a law requiring mandatory application of renewable energy to new public buildings along with G-SEED certification seems to be contributing to the reduction of building energy.
G-SEED-certified public administrative and commercial leased office buildings showed up to (48.2 and 45.5)% higher energy performance than general offices, respectively. The site EUI of these two building use is 192.49 and 203.94 kWh/m2a, respectively, which is much lower than previous studies based on New York (307.8 and 308.3 kWh/m2a). Although there are many differences between New York and Korea in terms of climatic characteristics, it is noteworthy that the EUI values of non-certified office buildings, which are the basis of comparison, are similar between New York and Korea.
As a result of examining 84 samples of this study, non-residential buildings with G-SEED certification showed EUI that was at least (35.5 to 48.9)% lower than general buildings. From these results, it is considered that the energy saving effect of the building according to the implementation of G-SEED certification is quite high. However, social and economic factors that are not considered in this study, such as economic development, legal regulations, improved construction client and tenant demands, and environmental changes, may affect building energy efficiency.
If Korea’s building energy use database is fully activated in the future, such as the US energy benchmarking system, it will be possible to compare and analyze the precise energy usage level of green building certified buildings, and to improve and develop the standard.
Author Contributions
Conceptualization, S.N. and C.W.; methodology, S.N.; validation, S.N. and C.W.; formal analysis, S.N. and C.W.; investigation, S.N.; resources, S.N.; data curation, S.N. and C.W.; writing—original draft preparation, S.N. and C.W.; writing—review and editing, C.W.; visualization, S.N.; supervision, S.N.; project administration, S.N.; funding acquisition, S.N. All authors have read and agreed to the published version of the manuscript.
Funding
This work was supported by a National Research Foundation of Korea (NRF) grant, funded by the Korea government (MSIT) (No. NRF-2019R1A2C1006099).
Acknowledgments
This was supported by the Korea National University of Transportation in 2019.
Conflicts of Interest
The authors declare no conflict of interest.
References
- The Necessity of Green Construction—Housing Herald. Available online: http://www.housingherald.co.kr/news/articleView.html?idxno=36224 (accessed on 12 November 2019).
- Amiri, A.; Ottelin, J.; Sorvari, J. Are LEED-certified buildings energy-efficient in practice? Sustainability 2019, 11, 1672. [Google Scholar] [CrossRef]
- LEED Green Building Certification. Available online: https://new.usgbc.org/leed (accessed on 12 November 2019).
- Green Building Certification. Available online: https://www.gbc.re.kr/index.do (accessed on 12 November 2019).
- Won, C.Y.; No, S.T.; Alhadidi, Q. Factors affecting energy performance of large-scale office buildings: Analysis of benchmarking data from New York City and Chicago. Energies 2019, 12, 4783. [Google Scholar] [CrossRef]
- Kim, H.M.; Park, W.J. A study of the energy efficiency management in green standard for energy and environmental design (G-SEED)—Certified apartments in South Korea. Sustainability 2018, 10, 3402. [Google Scholar] [CrossRef]
- Lee, G.Y. A Study on the of Passive Design Elements and Energy Use on the Architectural Planning of the Public Libraries—Focusing on the Comparison between G-SEED certified and Non-certified library. Master’s Thesis, Seoul Nation University of Technology, Seoul, Korea, 2016. [Google Scholar]
- Jeong, J.H. A Study on the Comparison and Analysis of the Energy Consumption and Economics for Green Building Certification: Focusing on the office Building. Master’s Thesis, JoongAng University, Seoul, Korea, 2013. [Google Scholar]
- Scofield, J.H. Do LEED-certified buildings save energy? Not really. Energy Build. 2009, 41, 1386–1390. [Google Scholar] [CrossRef]
- Scofield, J.H. Efficacy of LEED-certification in reducing energy consumption and greenhouse gas emission for large New York City office buildings. Energy Build. 2013, 67, 517–524. [Google Scholar] [CrossRef]
- Scofield, J.H.; Doane, J. Energy performance of LEED-certified buildings from 2015 Chicago benchmarking data. Energy Build. 2018, 174, 402–413. [Google Scholar] [CrossRef]
- Chokor, A. Evaluating the Performance of Leadership in Energy and Environmental Design (LEED) Certified Facilities Using Data-Driven Predictive Models for Energy and Occupant Satisfaction with Indoor Environmental Quality (IEQ). Master’s Thesis, Arizona State University, Tempe, AZ, USA, 2015. [Google Scholar]
- Chokor, A.; El Asmar, M. A novel modeling approach to assess the electricity consumption of LEED-certified research buildings using big data predictive methods. Old and New Construction Technologies Converge in Historic San Juan. In Proceedings of the 2016 Construction Research Congress, American Society of Civil Engineers (ASCE), San Juan, Puerto Rico, 31 May–2 June 2016; Volume 105, pp. 1040–1049. [Google Scholar] [CrossRef]
- LEED V4. Energy and Atmosphere. Available online: https://www.usgbc.org/credits/new-construction/v4/energy-%26-atmosphere (accessed on 12 November 2019).
- Kim, J.K.; Goh, K.H.; Bang, M.S. A study on compatibility through comparison analysis between G-SEED and LEED—Focus on housing. J. Korean Inst. Cult. Archit. 2017, 57, 260–268. [Google Scholar]
- Lee, H.J.; Kim, J.T. A comparison of G-SEED with LEED for energy evaluation in an office building. In Proceedings of the Korea Institute of Ecological Architecture and Environment Conference 2013, Seoul, Korea, 21–22 November 2013; pp. 76–77. [Google Scholar]
- G-SEED Certification Status. Available online: https://www.gbc.re.kr/app/authStatus/list.do (accessed on 12 November 2019).
- Public Data Portal—OPEN API. Available online: https://www.data.go.kr (accessed on 12 November 2019).
- Construction Data Private Open System. Available online: http://open.eais.go.kr/ (accessed on 12 November 2019).
- Ministry of Trade, Industry and Energy. Regulation on the Support of Renewable Energy Facilities; Ministry of Trade, Industry and Energy: Sejong, Korea, 2019. [Google Scholar]
- Ministry of Land, Infrastructure and Transport. Basic Green Building Plan, 1st ed.; Ministry of Land, Infrastructure and Transport: Sejong, Korea, 2014. [Google Scholar]
© 2020 by the authors. Licensee MDPI, Basel, Switzerland. This article is an open access article distributed under the terms and conditions of the Creative Commons Attribution (CC BY) license (http://creativecommons.org/licenses/by/4.0/).