Abstract
Increasing energy prices make space heating more expensive every year in The Organisation for Economic Co-operation and Development (OECD) member countries. Thermochemical heat storage systems (THSS) can be used to reduce residential energy consumption for space heating and to control humidity. Utilizing compressed thermochemical pellets as heat storage materials is a way to increase volumetric energy storage capacity and to improve the performance of the THSS. In this work, expanded natural graphite (ENG), activated carbon (AC), strontium bromide, and magnesium sulphate were mixed in different mass ratios and compressed under applied pressures in a range of 0.77 to 5.2 kN⋅mm−2 to form composite pellets with a diameter of 12 and 25 mm, respectively, and a thickness from 1.5 to 25 mm. These pellets were characterized using thermogravimetric analysis and differential scanning calorimetry. Cyclic tests of hydration at 20 °C and dehydration at 85 °C were conducted to investigate changes in the surface morphology and the heat and mass transfer characteristics of the composite pellets. The permeability and thermal conductivity of the composite pellets were also measured. It was found that the structural stability of the pellets was enhanced by increasing the compression pressure. Utilizing AC and ENG in the composite mixture enhanced the porosity, thermal conductivity, and the permeability of the pellets.
1. Introduction
Global energy demand is in constant increase during the last decades [1]. Due to the climatic change and the rise in the use of air conditioning systems, there is a sharp increase in the energy demand on space heating and cooling [2]. As an example, space heating accounts for the 34% of the total New Zealand (NZ) household energy consumption and, on average, 3820 kWh energy is spent on domestic space heating annually [3]. Given that space heating alone corresponds to 15% of the total electricity usage [4], heating NZ houses is likely to be more expensive with increasing electricity costs. Residential electricity prices in NZ increased by 154% between 2006 and 2019 [5]. The same trend is evident in Europe as well, where over 60% of the utilized domestic energy is for heating purposes [6]. Solar energy can be utilized to cover the energy needs for space heating, as many studies have showcased in recent years [7,8,9]. However, a limiting factor to its further use is the difficulty in storing solar energy that is more available in summer/day times, to be used in winter/night times. Thermochemical energy storage systems (THSS) offer an efficient way to solve this problem. THSS have a higher energy storage capacity (0.5–3 GJ⋅m−3) compared to the energy storage capacity of traditional heat storage methods, such as sensible heat (0.2 GJ⋅m−3) and latent heat storage systems (0.3–0.5 GJ⋅m−3) [10,11]. THSS can be used in a smart grid system to manage peak power demands as well. Demand side management can be aided with the implementation of thermal storage systems by reducing the required number of alternative heat sources used in houses [12]. THSS are regarded as a promising heat storage technology with the capability of utilizing both sorption and chemical reactions to generate heat. However, THSS are still in the research and development phase due to the complexity of the reaction processes [13,14].
Apart from having a high heat energy storage density, thermochemical heat storage systems have the advantage of providing a control over indoor humidity levels [15]. This is especially important for households living in humid environments, such as Latin America, South East Asia, and Oceania [16]. According to the World Health Organization (WHO), living in a humid environment is not beneficial, as it may cause respiratory health problems, such as allergic rhinitis and asthma. Children, senior citizens, and people with existing skin problems are considered more vulnerable to diseases related with the damp environment [17].
Until recently, only a few studies have investigated the potential of salt composites for storing thermal energy. None of the attempts made towards commercializing domestic thermochemical heat storage system were successful, and this is mainly due to the lack of a cost-effective utilization of the storage materials [18]. According to Mauran et al. [19], the main limitations of the THSS are the slow rates of conductive heat transfer along with the slow moisture adsorption rate. The limited capability for improving the kinetics of water vapor sorption remains a key issue in using hydrophilic porous materials in thermochemical heat storage systems [20].
Nowadays, research in THSS materials is focused on the development of a composite heat storage media to address the requirements of high-energy storage density and fast heat and mass transfer [21,22,23]. Salt hydrates illustrate hydrothermal stability problems such as deliquescence and leakage from the reactor bed. Therefore, utilizing salt hydrates in their pure form is often considered challenging [18]. Hydrothermal stabilities can be enhanced by utilizing salt hydrates in a composite pellet form [18]. The importance of utilizing supportive carbon within the composite THSS materials has been underlined in previous studies [18,24]. The THSS material’s geometrical structure and physical properties, such as the porosity and the thermal conductivity, should be improved to maintain the heat and mass transfer rates over a long period of operation (> 10 years). Materials such as silica gels or silica-aluminophosphate (SAPO) are thought as promising supportive materials, and zeolite has attracted particular attention due to its high porosity [25]. However, activated carbon (AC) is favored over zeolite as a supportive THSS material due to its three times higher specific surface area (1700 m2⋅g−1 vs 600 m2⋅g−1) and five times higher thermal conductivity (0.07 kW⋅m−1⋅K−1 vs 0.15–0.5 kW⋅m−1⋅K−1) [26] at a similar cost of around 1 USD⋅kg−1 [27,28]. Additionally, the hydrophilic characteristics of zeolite cause the salts hydrates to dissolve in excess pore water and prevent its complete hydration in the discharging cycle. This is a major drawback for long-term heat storage [22,29]. In addition, preventing salt hydrate from deliquescence during the hydration cycles is another problem to address [21,22,23].
The reversible chemical equation of hydration and dehydration of a salt hydrate is expressed by the following equation:
where X represents the salt hydrate and ΔH represents the reaction enthalpy. During the dehydration process (energy charging process), the salt hydrate absorbs heat and becomes dehydrated. During the hydration process (energy discharging process), the stored heat is released for space and/or process heating. In this way, thermal energy can be stored without any major heat loss for a long period of time.
X⋅(a)H2O + (b)H2O = X⋅(a+b)H2O+ΔH
Various salt hydrates were investigated as low temperature thermochemical energy storage media by previous researchers. Hydrates of magnesium sulphate (MgSO4·7H2O) and strontium bromide hexahydrate (SrBr2·6H2O) were highlighted as promising heat storage materials by many authors [25,30,31] and were said to possess a reasonably high energy storage density and reaction enthalpy (Table 1 and Table 2). Marias et al. [32] investigated strontium bromide as a THS material in a laboratory small-scale reactor and performed hydration tests at 19 °C and dehydration tests at 60 °C. Ferchaud et al. [33,34] and Van Essen et al. [35,36] made thermogravimetric analysis (TGA) and differential scanning calorimetry (DSC) characterization for magnesium sulphate and identified it as a potential THS material.

Table 1.
Properties of MgSO4·7H2O and SrBr2·6H2O.

Table 2.
Properties of several dehydration steps of hydrates of magnesium sulphate [48] and strontium bromide [49].
Supportive materials with lower heat storage capacities will reduce the overall energy storage density; however, the compression of the composite mixture helps keep the volumetric energy storage density similar to pure salt hydrates, while improving structural integrity. Additionally, the utilization of composite materials may help tackle THSS long term energy storage challenges, including salt hydrate deliquescence and geometrical deformations of the salt. Py et al. [37] created a composite carbon-based supportive material utilizing activated carbon as a promising candidate for THS pellets. Expanded natural graphite (ENG) is also utilized as a solution to enhance the low thermal conductivity of activated carbon in a composite mixture in other applications [37]. ENG can increase the thermal conductivity of a composite with activated carbon up to 30 W⋅m−2, without requiring an additional binder to maintain structural integrity [37].
In this paper, we present our research results for AC–ENG (activated carbon-ENG) composite materials with enhanced thermal conductivity and porosity for increased heat conduction and vapor sorption kinetics. We have manufactured pure MgSO4⋅7H2O (MSH) and SrBr2⋅6H2O (SBH) pellets as well as composite pellets utilizing MSH and SBH as a THS material supported with AC and/or ENG. Different compression pressures were applied to composite mixtures prepared with different mixing ratio to make pellets. (DSC), (TGA), thermal conductivity, porosity, and permeability tests were carried out for characterizing the pellets. Although the individual potential of the MSH, SBH, AC, and ENG as THS materials has been investigated [30,31,32,33,34,35,36,37], to the best of our knowledge there are no examples of using an AC–ENG mixture as a supportive matrix in the THS pellets or an investigation into the effect of pressure.
2. Chemical Materials
In this study, MgSO4·7H2O (MSH, assay ≥ 99.5%, Sigma Aldrich™ BioUltra®), SrBr2·6H2O (SBH, assay 99%, Sigma Aldrich™), activated carbon (AC, 20–40 mesh particle size, granular, Sigma Aldrich™ Draco®) and expanded natural graphite (ENG, C24(HSO4)(H2SO4)2, + 50 mesh size flakes, Sigma Aldrich™) were selected to investigate their potentials as THSS supportive media.
MgSO4·7H2O (MSH) and SrBr2·6H2O (SBH) are not toxic, flammable, and explosive and show excellent reversibility in moisture uptake [15]. AC and ENG are also regarded as not toxic and dangerous materials [38,39]. The relevant properties of MgSO4·7H2O (MSH) and SrBr2·6H2O (SBH) are listed in Table 1. The melting temperatures of MgSO4 and SrBr2, which are not shown in Table 1, are 1124 °C [40] and 643 °C [41], respectively. The chemical reaction enthalpy and entropy of several dehydration steps of MgSO4·7H2O and SrBr2·6H2O are given in Table 2.
3. Development of Composite Materials
Figure 1 shows the main manufacturing process for making composite THSS pellets. Firstly, saturated salt hydrate solutions were prepared by mixing salt hydrates and distilled water with a 1:1 mass ratio, and the solution was then stirred at 25 °C and 300 rpm for 2 h. ENG was required to be expanded before utilization, and a 1:123 volumetric expansion ratio was achieved by heating the ENG from room temperature to 300 °C at a heating rate of 10 °C⋅min−1 using an oven. After reaching 300 °C, the ENG was kept in the oven for 180 min at 300 °C. Activated carbon was also heated at 120 °C for 90 min in a pre-heated oven to remove any possible water present in the material. The prepared salt hydrate solution was soaked into ENG and/or AC and then stirred at 25 °C and 300 rpm for 120 min. For removing the solvent of water, the mixture was kept in a 30 °C pre-heated oven for 48 h for water evaporation. Before the pellet preparation step, visual checks were made to ensure the homogeneity of the mixture. To prevent small lumps being generated during the solvent evaporation process, the mixture being dried was stirred with a spatula every 2 h during the solvent evaporation. The mixture was ground using a mortar and a pestle. The particle size was found to be between 297 microns and 1 mm, using sieves. The mixture was then compressed to produce pellets. The pellets were manufactured in this study at different mixing ratios with AC and/or ENG in order to investigate the individual suitability of each supportive material as a THS-supportive medium under a pressure range of 770 N⋅mm−2 ≤ Pcomp. ≤ 5.20 kN⋅mm−2 in order to analyze the effects of the compression pressure on the permeability, porosity, and the thermal conductivity of the pellets. Two hydraulic presses were used in this study. One hydraulic press with a 12 mm cylindrical dry pressing die set was used for providing a 770 N⋅mm−2 compression pressure and another hydraulic press with a 25 mm diameter dry pressing die set was utilized to compress pellets at a 1.3, 2.6, 3.9, and 5.2 kN⋅mm−2 compression pressure. Pure salt hydrate pellets were also manufactured at five different compression pressures, 0.77, 1.3, 2.6, 3.9, and 5.2 kN⋅mm−2.

Figure 1.
Manufacturing process for the thermochemical heat storage pellets.
Thermogravimetric analysis (TGA) and differential scanning calorimetry (DSC) analysis were carried out to characterize the salt hydrate pellets in order to understand their mass change and enthalpy of fusion during the dehydration cycle.
Pellets utilizing only AC (represented by C) or ENG (denoted by G) were prepared under a 0.77 kN⋅mm−2 compression pressure and are labeled as: MSH/C (1.6), (1.8), (2.1), (2.4), MSH/G (1.6), (1.8), (2.1), (2.4), SBH/C (1.6), (1.8), (2.1), (2.4), SBH/G (1.6), (1.8), (2.1), (2.4). The mass of AC or ENG in g is stated in parenthesis for 1 g of salt hydrate. For example, pellets having 2.4 g of AC and 1 g of SrBr2⋅6H2O are marked as SBH/C (2.4).
Pellets utilizing both AC and ENG, which are manufactured with a 12 mm diameter under a 0.77 kN⋅mm−2 compression pressure, are marked with 12 at the end of the sample name, such as MSH/G+C (0.4:1)-12 where there are 0.4 g ENG and 1 g AC for 4.2 g MSH, making a salt hydrate content of 75% w/w. All other pellets were 25 mm in diameter and were made at higher pressures than that stated above and a fixed salt hydrate content of 75% w/w. For these samples, mass ratios of the AC and ENG are also stated in parenthesis. For example, samples labeled as MSH/G+C (1:1) have equal masses of 1 g ENG and 1 g AC and an SrBr2⋅6H2O content of 75% (i.e., 6 g SBH). Figure 2 presents some examples of the pellets prepared under different compression pressures.

Figure 2.
(A) A total of 10 g in mass of pure SrBr2·6H2O, 25 mm in diameter, 8.5 mm in thickness, and a 5.2 kN⋅mm−2 compression pressure. (B) A total of 0.3 g in mass of pure SrBr2·6H2O, 12 mm in diameter, 1.68 mm in thickness, and a 0.77 kN⋅mm−2 compression pressure. (C) A total of 0.3 g in mass of pure MgSO4·7H2O (MSH), 12 mm in diameter, 2.45 mm in thickness, and a 0.77 kN⋅mm−2 compression pressure. (D) A total of 10 g in mass of pure MgSO4·7H2O, 25 mm in diameter, 12.5 mm in thickness, and a 5.2 kN⋅mm−2 compression pressure. (E) MSH/G+C (1:1) composite pellet 10 g in mass, 25 mm in diameter, 9.8 mm in thickness, and a 5.2 kN⋅mm−2 compression pressure.
4. Characterization of Composite Pellets
The physical/thermal performance of the manufactured composite pellets was experimentally investigated using a variety of methods. The composite pellets underwent 10 complete cycles of hydration and dehydration and their mass changes were recorded over the cyclic tests in order to estimate the time required for complete hydration and dehydration reactions.
Thermogravimetric analysis (TGA) and differential scanning calorimetry (DSC) tests were conducted to observe water molecule removal (dehydration) from the chemical materials. The TGA got the mass change of the samples with increasing temperature, and the DSC analysis obtained the endothermic and exothermic reaction enthalpy of the samples during dehydration and rehydration reactions, respectively. Nitrogen gas was utilized in the DSC analysis as a purge gas in order to eliminate possible localized hot spots that could cause misleading results [50]. Two different DSC measurement techniques, “ramp” and “isothermal”, were used. Using the ramping technique, the samples were heated from 0 °C to 300 °C at a temperature increasing rate of 3 °C⋅min−1 and a constant nitrogen flow rate of 20 ml⋅min−1. For the isothermal technique, a temperature increasing rate of 3 °C⋅min−1 heating and 20 ml⋅min−1 N2 flow heating rates were used and sample was held isothermal at 80 °C for 420 min. A TA Instruments™ Q50 thermal analyzer (±0.01% precision [51]) and a TA Instruments™ Q2000 differential scanning calorimeter (±0.05% precision [52]) were utilized for the TGA and DSC tests, respectively.
To measure the permeability of the composite pellets, we built a permeability test workbench, as shown in Figure 3. Nitrogen gas was used as the fluid passing through the samples at several flow rates between 1 and 6 ml⋅min−1 and the pressure drop of the nitrogen gas was measured to estimate the permeability of the samples, using Darcy’s law as follows [53,54]:
where Φ is the N2 flow rate (m3⋅s−1) at the inlet of the permeability test workbench; k is permeability coefficient (m2); ∆P is the pressure difference (Pa) between the gas inlet to the gas outlet; μ is the viscosity (Pa⋅s) of nitrogen gas at room temperature, Λ is the thickness (m) of the sample material from the gas inlet to the gas outlet, and α is the cross-section area of the flow region (m2).
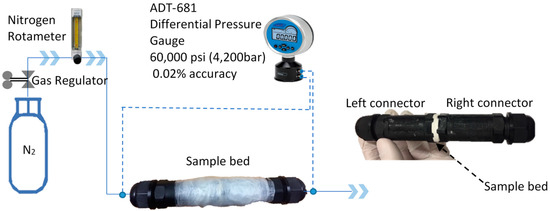
Figure 3.
Workbench for permeability tests.
In the permeability test workbench, a rotameter (±5% accuracy) was utilized to adjust the flow rate of nitrogen gas. As shown in Figure 3, a testing sample bed with a thickness of around 5 mm was connected with two identical IP68 connectors with an inner diameter of 25 mm and a length of 90 mm, and a differential pressure gauge with ±0.02% accuracy was installed to the system to measure the pressure difference between the inlet of the gas at the left connector and the outlet of the gas at the right connector. Because of the relatively large diameter and the short length of the two connectors, the pressure drops of the nitrogen gas passing through the two connectors were thus ignored. The connection sections between the sample bed and the two connectors were sealed using a high vacuum leak sealant. To further eliminate gas leakage, the whole system of the sample bed and the two connectors was wrapped using many layers of shrink wrap films, which were sealed using a heat gun. The permeability of three samples was measured for each composite with the same chemical composition and the same applied pressure. Three tests were conducted for each sample at a specified flow rate of the nitrogen gas. Six different flow rates between 1 and 6 ml⋅min−1 of the nitrogen gas were used for each sample. Thus, for one composite, in total, 54 measures were conducted to get a fitted value of the permeability of the composite pellets.
The porosity of the composite pellets was determined using the liquid displacement method [55]. Ethanol was used as a displacement fluid instead of the standard fluid of water, since pure ethanol does not dissolve the salt hydrates in the composite pallets and it does not chemically react with the other ingredients in the pellets. Using the liquid displacement method, a sample of a known mass (ms in g) was placed in a graduated cylinder filled with liquid ethanol of a known volume (V1e in ml) and a known mass for 5 min. Then, the total volume (Ve+s in ml) of the ethanol and sample was recorded. After this step, the sample was removed from the graduated cylinder and the volume (V3e in ml) and the mass (in g) of the remaining ethanol were recorded. The process was repeated seven times for each sample and the porosities of three manufactured samples with the same chemical compositions and the same applied compression pressures were measured to verify the results. The porosity and the density of the samples were calculated according to the following equations:
In order to get a higher precision of measurements, V1e and V3e were calculated from the recorded masses of the ethanol using the known density of ethanol, rather than the measured volume, which could be less accurate due to the possible parallax error that is likely to occur during the volume reading from the graduated cylinder [56].
To measure the thermal conductivity of the manufactured pellets, the transient plane source method (TPS) or the Gustafsson method was used [57,58,59]. This method has been widely used in the literature to measure both the thermal diffusivity and conductivity of solid materials with a thermal conductivity between 0.005 and 300–500 W⋅m−1⋅K−1 [57,58,60]. In the literature [61], thermochemical heat storage pellets mixed with ENG or AC were expected to have a low thermal conductivity in the range of 0.5 to 2.61 W⋅m−1⋅K−1, within the range of the TPS method. The transient plane source thermal conductivity meter (Xian Yima Optoelec™ DZDR-S) we used for the thermal conductivity measurements has an absolute accuracy of ±3% and a repeatability error less than 3%. The device has been calibrated using high density polyethylene pellets with the known thermal conductivity of 0.49 W⋅m−1⋅K−1. Then, other testing materials with known thermal conductivities, such as steel (W18Cr4V), stainless steel (SS 316), and aluminum alloy (6063), were tested to confirm the accuracy of the machine. The detailed operation of this transient plane source thermal conductivity meter can be found from reference [57].
5. Results and Discussions
5.1. Hydration and Dehydration Test Results
The manufactured pellets were dehydrated at 85 °C, 5% RH, 18 g H2O/kg air at 101 kPa and then hydrated at 20 °C, 90% RH, 13 g H2O/kg air at 101 kPa for the cyclic test individually. TGA and DSC tests were carried out at the end of each hydration cycle along with thermal conductivity, permeability, and porosity measurements. All the temperature and relative humidity values given in this section have ±0.5 °C and ±1.8% RH accuracy.
Figure 4 illustrates the MSH and SBH pellets after the first dehydration test, and Figure 5 demonstrates the MSH pellets after the 4th dehydration test.
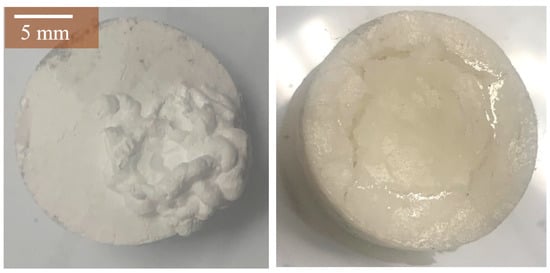
Figure 4.
MSH pellet on the left and SrBr2⋅6H2O (SBH) pellets on the right after first dehydration test at 85 °C, 5% RH. Both pellets were manufactured under a 5.2 kN⋅mm−2 compression pressure.
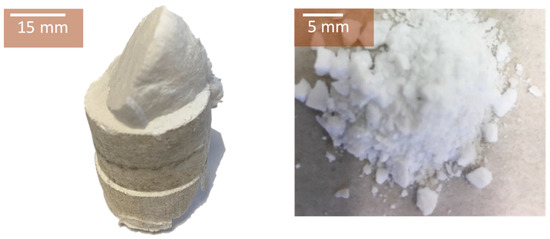
Figure 5.
The structure of MSH pellets after four hydration/dehydration cyclic tests. Left: 25 mm diameter prepared under a compression pressure of 5.2 kN⋅mm−2; Right: 12 mm diameter prepared under a compression pressure of 0.77 kN⋅mm−2.
The experimental results of the dehydration and hydration cycles show that even after just one hydration and dehydration cycle, pellets of pure MSH and SBH lost structural integrity. Specifically, the pellets prepared under 0.77 kN⋅mm−2 lost their entire structure after the 4th cycle, as shown in Figure 5. This demonstrates that pellets made of pure salt hydrates are not suitable to be utilized in THSS as they illustrate a significant change in their geometry. The pellets did not show any further geometrical change in the cyclic tests after the 4th dehydration tests.
Figure 6 and Figure 7, respectively, present the images of the composite pellets made of mixtures of SBH with AC and MSH with ENG before and after the cyclic test.
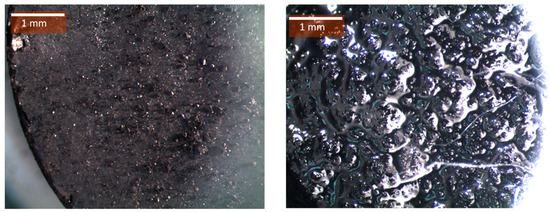
Figure 6.
SBH/C (2.4) pellets before (left) and after (right) one complete dehydration (85 °C, 5% RH) and hydration (20 °C, 90% RH) cycle. The pellets were prepared under a compression pressure of 0.77 kN⋅mm−2.

Figure 7.
MSH/G (2.4) pellets before (left) and after (right) one complete dehydration (85 °C, 5% RH) and hydration (20 °C, 90% RH) cycle. The pellets were prepared under a compression pressure of 0.77 kN⋅mm−2.
It was found that none of these first composite pellets were able to maintain their initial geometric structure after the dehydration test. The pellet samples that were supported using AC showed big cracks on their surface during the dehydration period, which were later filled with salt hydrates that became deliquescent during the hydration period (Figure 6). Figure 7 shows that ENG alone is not a sufficient to be supportive medium. As shown in Figure 7, MSH leaked out from the pellet sample.
Utilizing both AC and ENG in the pellet helped maintain the shape of the pellets sample for a longer time of two hydration and dehydration cycles. Figure 8 presents the pellets manufactured under a compression pressure of 0.77 kN⋅mm−2 with different AC–ENG ratios.
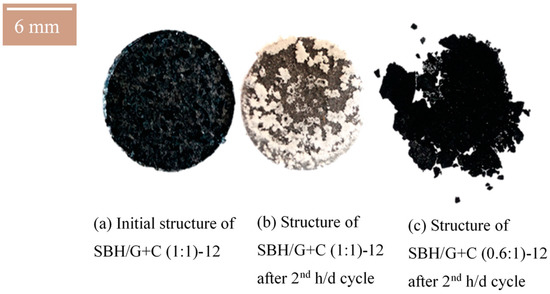
Figure 8.
Twelve-millimeter diameter pellets. SBH/G+C (1:1)-12 before (left) and after (middle) 2nd hydration/dehydration cyclic test. SBH/G+C (0.6:1)-12 pellet after 2nd hydration/dehydration test (right).
Figure 8 shows that SBH leaked out of the pellets of SBH/G+C (1:1) after the 2nd hydration/dehydration cycle. However, the salt hydrate leaking was different from that shown in Figure 7, where only ENG was used as a supportive medium. As shown in Figure 8b, SBH formed small lumpy formations at the outside surface of the pellet sample. In addition, Figure 8c shows that SBH leaking did not occur when the ENG ratio was 60% of the AC mass ratio. However, the overall geometrical integrity was not preserved with the 12 mm pellets prepared under a 0.77 kN⋅mm−2 compression pressure (Figure 8c). It is observed that increasing the ENG ratio in the composite helped the pellets to maintain their geometrical shape, however, it caused salt hydrate leakage from the pellets prepared under the 0.77 kN⋅mm−2 compression pressure. The pellets did not show any further geometrical change after the first two cycles.
Due to the somewhat promising results obtained from the pellets compressed at the 0.77 kN⋅mm−2 compression pressure, new composite samples were made of MSH and SBH with both ENG and AC being supportive media using different mixing ratios. These pellets were manufactured under higher compression pressures of 1.3, 2.6, 3.9, 5.2 kN⋅mm−2. Figure 9 and Figure 10 show the structure images of MSH/G+C (1:1) and SBH/G+C (1:1) pellets prepared under several different compressing pressures. Figure 11 shows the structure images of MSH/G+C pellet samples prepared with different mixing rates and at a constant 5.2 kN⋅mm−2 compressing pressure.
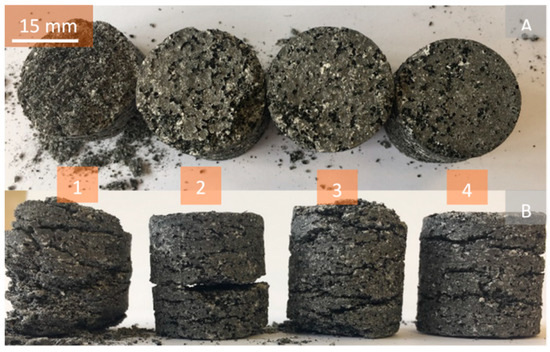
Figure 9.
MSH/G+C (1:1) pellets after the 10th cyclic test shown as No.1, No.2, No.3, No.4 pellets with compression pressures of 1.3, 2.6, 3.9, 5.2 kN⋅mm-2, respectively. (A) shows the top view, and (B) shows the side view of the pellets.
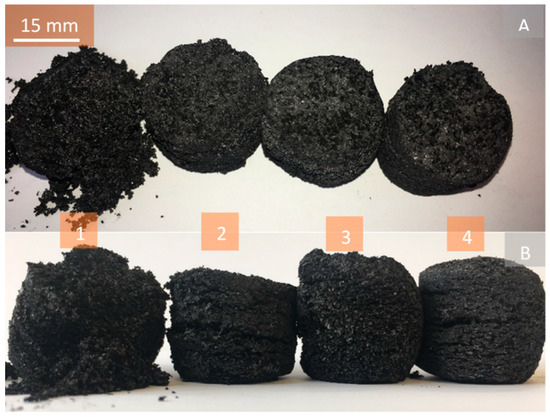
Figure 10.
SBH/G+C (1:1) pellets, after 10 complete cyclic tests, as No.1, No.2, No.3, No.4 pellets with the compression pressures of 1.3, 2.6, 3.9, 5.2 kN⋅mm−2, respectively. (A) shows the top view, and (B) shows the side view of the pellets.
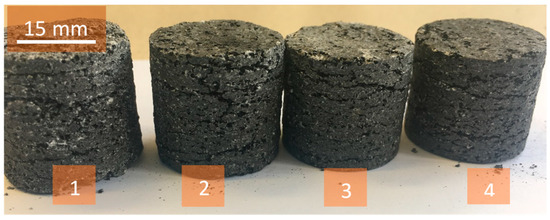
Figure 11.
MSH/G+C pellet samples, No.1: MSH/G+C (0.4:1); No.2: MSH/G+C (0.6:1); No.3: MSH/G+C (0.8:1); No.4: MSH/G+C (1:1). All pellets were manufactured at a 5.2 kN⋅mm−2 compression pressure.
As shown in Figure 9, increasing the compression pressure from 1.3 to 5.2 kN⋅mm−2 enhanced the long-term structure stability of the composite pellets. In particular, the composite pellets made of MSH/G+C (1:1) at the highest value (5.2 kN⋅mm−2) of the compression pressures investigated in this study showed the most stable structure (Figure 9, No. 4) after 10 hydration and dehydration cycles. Figure 10 shows that increasing the ENG mass ratio in the pellets also enhanced their structure over the hydration and dehydration cyclic tests. Pellets made of SrBr2·6H2O were structurally less stable (Figure 10) during the 1st hydration operation and they became wet due to deliquescence and got darker. The reason for this color change was because of the increasing absorption of the light by the surface of the pellets that got wetter [62]. MSH pellets were more stable, with MSH/G+C (1:1) composition showing good potential to be used in thermochemical reactors.
The profiles of relative mass change and relative density change with time for several selected pellet samples, SBH/G+C (0.4:1)-12, SBH/G+C (1:1)-12, MSH/G+C (0.4:1)-12, MSH/G+C (1:1)-12, are presented in Figure 12, and the others, SBH/G+C (0.4:1), SBH/G+C (1:1), MSH/G+C (0.4:1) and MSH/G+C (1:1), are presented in Figure 13, where the first Y axis on the left and the second Y axis on the right present the mass change (%) and density change of the pellets throughout the cyclic tests.
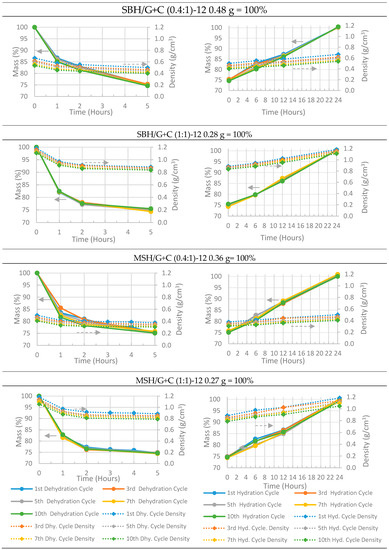
Figure 12.
Hydration and dehydration charts of pellets prepared under a 0.77 kN⋅mm−2 compression ratio. Each pellet has a 75% salt hydrate mass ratio. Left column: dehydration charts; right column: hydration charts. All the mass measurements have an accuracy of ±0.001 g (< 0.5%).
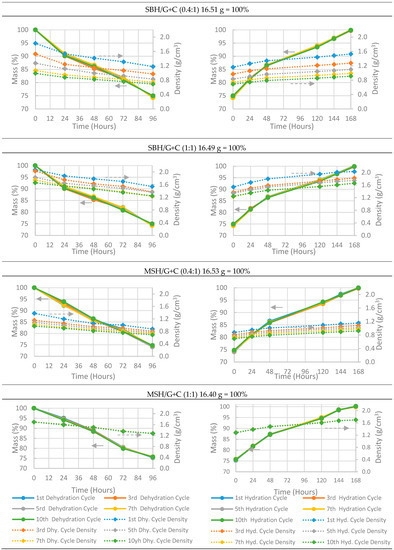
Figure 13.
Hydration and dehydration charts of pellets with prepared under a 5.2 kN⋅mm−2 compression ratio. Each pellet has a 75% salt hydrate mass ratio. Left column: dehydration charts; right column: hydration charts. All the mass measurements have an accuracy of ±0.001 g (< 0.5%).
As stated above, the composite pellets were dehydrated at a temperature of 85 °C and a relative humidity of 5% RH (18 g H2O/kg air) and were hydrated at 20 °C and 90% RH (13 g H2O/kg air) through the 10 dehydration and hydration cycles. At the beginning of the first dehydration operation, the mass of the composite sample was considered at 100%, and the corresponding measured weight of the pellets are given in the title of each sub-figure. For example, in Figure 13, pellet SBH/G+C (0.4:1) had the initial mass of 16.4 g before the dehydration test and the bulk volume of the pellet was calculated from the measured height and diameter. The apparent density of the pellet was calculated from the bulk volume and the mass of the pellet. During the dehydration cycle, the pellet lost around 25% of its initial weight and the changes at its bulk volume were recorded. Then, the process was repeated for the next hydration and dehydration tests. As the bulk volume of the pellet increased due to pellet’s irreversible expansion, the apparent density of the pallet decreased, causing the density chart of SBH/G+C (0.4:1) to approach to the x axis after each cycle. The density change at the same measurement time between the cycles (i.e., first cycle vs 10th cycle) is directly because of the pellet’s geometrical change.
Although all of the pellets manufactured under the compression pressure of 0.77 kN⋅mm−2 crumbled after only two cycles, it can be seen from Figure 12 that losing their geometrical form did not affect their hydration and dehydration characteristics and the pellets were able to complete their full hydration and dehydration cycle. It took 5 h to dehydrate and 24 h to rehydrate the pellets prepared at a 0.77 kN⋅mm−2 compression pressure. However, the pellets manufactured with higher compression pressures (e.g., 5.2 kN⋅mm−2) needed 96 h to dehydrate and 168 h to rehydrate. None the less, four days of charging (dehydrating) time is still fast enough for seasonal heat storage, where THSS materials can be dehydrated during the entire 3 months of the summer time. This fall in the dehydration and hydration rates as compared to those of the pellets manufactured under lower pressures was due to increasing the density and decreasing the porosity of the pellet samples under high compression pressures. In Figure 13 (dashed lines) variation in the density throughout the cyclic tests was observed; the variation was, again, because of the severe geometrical deformation that occurred during the cyclic tests. It was also notable that none of the MSH/G+C (1:1) pellets showed any shift in their density charts (Figure 13 bottom charts) since the geometry of the pellets was well maintained throughout the 10 cyclic tests.
5.2. Thermogravimetric Analysis (TGA) and Differential Scanning Calorimetry (DSC) Test Results
Initially, pure SrBr2⋅6H2O and MgSO4⋅7H2O salt hydrates were tested for their heat storage capacity. The dehydration steps of the salt hydrates were analyzed using the TGA and DSC techniques and the results were compared with the results published in the literature [63,64,65,66,67]. In this study, a thermogravimetric analysis system and a differential scanning calorimetry system were used.
Pure SrBr2⋅6H2O and MgSO4⋅7H2O salt hydrates were initially tested for their heat storage capacity. In the TGA test, a sample of 93 mg MgSO47H2O (37.73 × 10⁻⁵ mole) was heated from 20 to 300 °C at a heating rate of 3 °C⋅min−1. In the DSC test, an MSH sample of ca. 23 mg was heated from 0 to 300 °C at a 3 °C⋅min−1 heating rate and a 20 ml⋅min−1 nitrogen flow rate. A 50 mg standard aluminum pan was utilized as a reference pan and a sample pan.
According to the chemical formulas of strontium bromide hexahydrate (SrBr2⋅6H2O) and magnesium sulphate heptahydrate (MgSO4⋅7H2O), each of the SrBr2 and MgSO4 molecules has six and seven water molecules, respectively. However, the fractional loss of the water molecules during the tests suggests that the initial salt might not have been completely hydrated at the start.
Figure 14 presents the TGA plot (blue dashed line) and the DSC plot (green solid line) for pure MgSO47H2O. The TGA plot presents the mass change of the MgSO47H2O powder sample (<595 micron) as a function of temperature showing the dehydration level of the salt hydrate based on the mass change and the DSC plot illustrates the changes in the heat flow (W⋅g−1) received by the MgSO47H2O sample as a function of temperature. The enthalpy in J⋅g−1 of the dehydration reaction can be obtained from the area under the red line placed in between the peak points [68]. In order to analyze the full dehydration characteristics, the samples were heated much higher than the targeted operational temperature (< 100 °C). All DSC charts presented in this manuscript are plotted with “exo up” setting, which means that negative peaks illustrate an endothermic process. The black lines in the DSC charts show the onset point for the endothermic reaction [69].
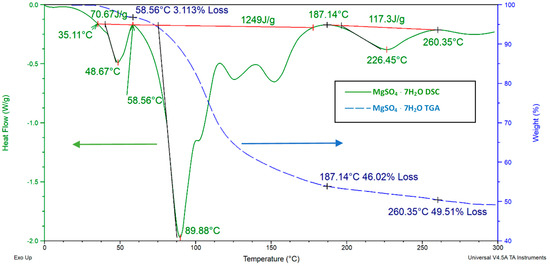
Figure 14.
MgSO47H2O thermogravimetric analysis (TGA) and differential scanning calorimetry (DSC) analysis. For DSC, a 3 °C⋅min−1 heating rate from 0 to 300 °C with a 20 mL⋅min−1 N2 flow rate were used. For the TGA test, the utilized method was a 3 °C heating rate from 20 to 300 °C. The total endothermic reaction enthalpy was 1775 J⋅g−1 from 0 to 300 °C.
The sample showed multistep decomposition at three points: at 48, 89, and 226 °C (Figure 14 DSC chart). Small fluctuations that occurred at around 115 and 150 °C were not considered as peak points as they were not close to the baseline of the DSC chart.
Equations (5)–(7) were written according to the decomposition steps; stoichiometric coefficients were given in fractions because they represent the mean values, some of the MSH molecules in the test might be dehydrated faster or some of the MSH molecules might be dehydrated slower. After around 280 °C, MSH became fully dehydrated and lost 51% of its initial mass, which corresponds to a 7.3% mass loss per one molecule of water. The integration of a line between the peaks (red line) in the DSC chart (Figure 14) was made to calculate the enthalpy of fusion at each dehydration step. The corresponding reaction temperatures (peak temperatures) on the TGA chart were used to denote the subtracted amount of water molecules from the hydrated salt. The obtained dehydration equations are given below.
All of the heat of fusion enthalpies obtained from the DSC tests were calculated based on the initial mass of the salt hydrate due to the lack of the possibility of measuring the mass change of the sample during the DSC tests. The equations above show that the first dehydration occurs at 48 °C and that most of the water molecules have been lost at 89 °C. These results are consistent with those from other studies. Van Essen et al. [36] found a similar low temperature dehydration (<50 °C) for MgSO4⋅7H2O by using a lower heating rate (1 K min−1) than the heating rate (3 K min−1) in the present study. The reason for this low temperature dehydration is because of the molecular structure of MgSO47H2O. The 7th molecule of water is only loosely attached to each MgSO4 molecule by weak coulombic force, making it easily removable from the crystalline structure of MSH [70].
In order to investigate the potential of the salt hydrates in low temperature operations, the isothermal DSC tests (Figure 15) of the MSH sample were conducted at 80 °C, as this represents a typical dehydration process in a THSS. For DSC, 3 °C⋅min−1 heating and 20 ml⋅min−1 N2 flow heating rates were used, and the sample was held isothermal at 80 °C for 420 min. For the TGA test, the sample was heated at a 3 °C⋅min−1 heating rate from room temperature and held isothermal at 80 °C for 420 min. In Figure 15, the left axis and the right axis show the heat flow and weight change of the MSH as a function of time during dehydration.
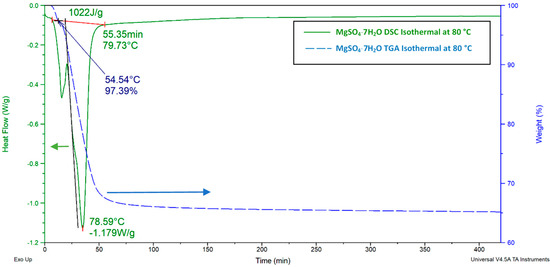
Figure 15.
MgSO47H2O isothermal TGA and DSC charts. For DSC, 3 °C⋅min−1 heating and 20 ml⋅min−1 N2 flow heating rates were used, and the sample was held isothermal at 80 °C for 420 min. For the TGA test, the sample was heated at a 3 °C⋅min−1 heating rate from room temperature and was held isothermal at 80 °C for 420 min.
For MgSO47H2O, the TGA chart in Figure 15 presents a 2.6% weight loss at 54 °C, which occurred before the sample reached the 80 °C isothermal temperature. Given the fact that the initial temperature was 16 °C for the TGA test and the sample was heated at a 3 °C⋅min−1 heating rate, it only took 13 min. to lose 0.4 water molecules. It is also notable from the TGA chart (Figure 15) that MSH completed its dehydration process in 60 min, losing 32.89% of its initial weight (93 mg), corresponding to a total of 4.5 molecules of water per MgSO4 molecule (Equation (8)). After reaching 80 °C, the sample only lost another 2% of its initial mass after 420 min, which means the two last molecules of water are not removed at this temperature.
The above equation can be used for the design of a THHS using MSH as a heat storage medium at a low charging temperature, such as 80 °C. The expected heat storage capacity and the dehydrated/hydrated mass of THSS reactor can be calculated with the help of this equation.
For SrBr26H2O, there is not much thermal characterization data available in the literature. However, six moles of water are expected to make up 30.4% of the total SBH mass [71]. The TGA results are shown in Figure 16, where the sample was being heated from 20 to 300 °C at a 3 °C⋅min−1 heating rate. For DSC tests, the sample was heated at a similar 3 °C⋅min−1 heating rate from 0 to 300 °C.
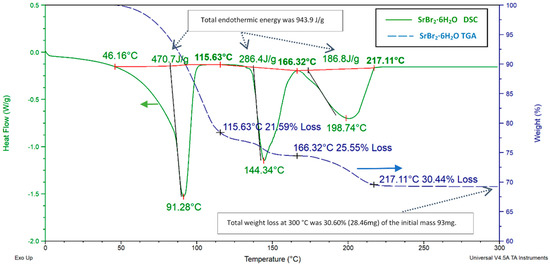
Figure 16.
SrBr26H2O TGA and DSC charts. For DSC, a 3 °C⋅min−1 heating rate from 0 to 300 °C and a 20 ml⋅min−1 N2 flow rate were acquired. For the TGA test, the acquired method was a 3 °C heating rate from 20 to 300 °C without any gas flow.
The total mass decrease of 30.6% was observed upon ramping to 300 °C, with 30.4% of that loss occurring before 217 °C. SBH showed multistep decomposition in three steps: at 91, 144, and 198 °C. However, unlike MgSO47H2O, there was not any dehydration occurring at temperatures lower than 50 °C. SrBr26H2O needed 943.9 J⋅g−1 of energy during the complete dehydration process, and the individual chemical equilibrium equations are given in Equations (9)–(11).
Isothermal DSC and TGA analyses were also made for SBH (Figure 17), with the sample heated from 16 to 80 °C and held isothermal for 420 min at 80 °C.
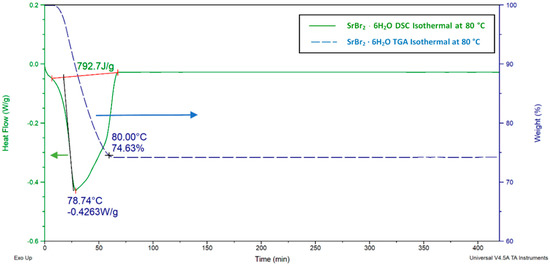
Figure 17.
SrBr26H2O isothermal TGA and DSC charts. For DSC, a 3 °C⋅min−1 heating rate and a 20 ml⋅min−1 N2 flow rate were adopted, and the sample was held isothermal at 80 °C for 420 min. For, the TGA test, the sample was heated at a 3 °C⋅min−1 heating rate and stayed isothermal at 80 °C for 420 min.
After 60 min, the sample’s mass dropped to 74.6% of its initial weight, indicating a loss of five molecules of water, as shown in Equation (12). These results were in good agreement with values available in the literature [72,73].
The above equation can be used for the design of a THHS using SBH as a heat storage medium at a low charging temperature, such as 80 °C. The expected heat storage capacity and the dehydrated/hydrated mass of the THSS reactor can be calculated with the help of this equation.
The isothermal thermal analysis of MSH shows a very slow dehydration after the moment that the sample reached its isothermal temperature, 80 °C (Figure 15). This slow dehydration process continued for 420 min until the end of the experiment. On the other hand, SBH did not show any further sign of water loss after 80 °C in both TGA and DSC analysis.
A summary of the total heat of fusion that occurred throughout the dehydration processes is given in Figure 18.
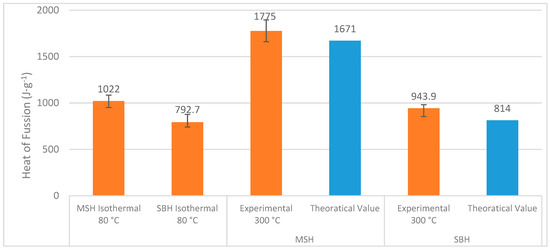
Figure 18.
MSH’s and SBH’s heat of fusion obtained from different DSC techniques. Theoretical values were taken from the references given in Table 1, where the heat of fusion of the dehydrations accounts for 7 and 5 moles of water release from MSH and SBH, respectively. The experimental results show that the heat of fusion value corresponds to near complete dehydration of SBH and MSH at 300 °C. Each test was repeated three times.
It should be noted that the isothermal DSC values only reflects 4.5 and 5 molecules of water release from MgSO47H2O and SrBr26H2O, respectively. The theoretical values, taken from Table 1, account for 7 and 5 moles of water release from MgSO47H2O and SrBr26H2O, respectively. On the other hand, the experimental values obtained from the “ramp” DSC tests show almost absolute dehydration for both MgSO47H2O and SrBr26H2O as in Equations (7) and (11). The results obtained are important for designs of the practical THHS systems, because the THSS are operated at limited temperatures.
TGA and DSC tests of the composite pellets were also made. For the DSC tests of the MSH/G+C pellets given in Figure 19, ca. 20 mg samples were taken from manufactured pellets (prepared under a 5.2 kN⋅mm−2 compression pressure) before and after the cyclic tests and then heated from 0 up to 250 °C at a 3 °C⋅min−1 heating rate and a 20 ml⋅min−1 nitrogen flow rate. For the TGA tests, ca. 90 mg samples were taken from pellets and were heated from 20 to 250 °C at a 3 °C⋅min−1 heating rate. The testing procedure was the same for all of the mentioned pellets in this section.
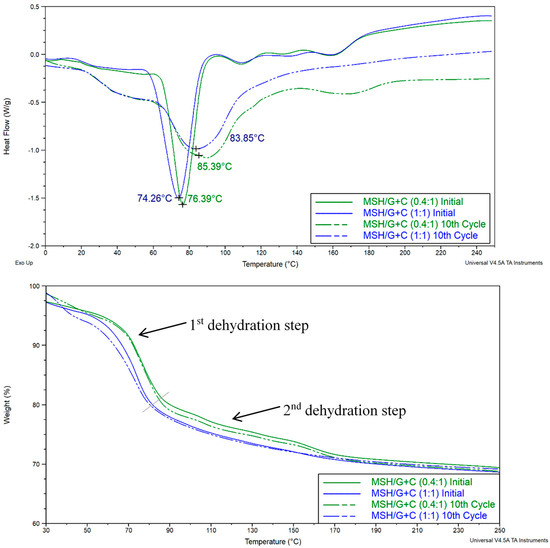
Figure 19.
DSC (top) and TGA (bottom) charts of the MSH/G+C pellets prepared under 5.2 kN/mm−2.
The above Figure presents initial results in comparison to the results obtained after the 10th cyclic test. The dehydration steps were determined based on the changes of the mass decrease rates (slope) on the TGA charts.
MSH/G+C (0.4:1) and MSH/G+C (1:1) showed changes in their DSC and TGA characteristics over the pure salt (Figure 14). The low temperature water loss transition (first dehydration in Figure 14) disappeared, as did the higher temperature peak at ca. 90 °C. They were replaced by a single peak at around 75 °C. This suggests that the MSH is not in a crystalline state but is bound to the carbon, perhaps in an amorphous state. However, by the 10th cycle, the DSC plots more closely resemble the pure salt, suggesting some molecular reorganization (i.e., returning to its crystalline state) in the composite over this time.
Figure 20 presents the DSC and TGA tests of SBH/G+C pellets prepared under a 5.2 kN⋅mm−2 compression pressure. Samples were taken from the pellets before and after the cyclic tests. The same TGA and DSC methods were utilized as before.
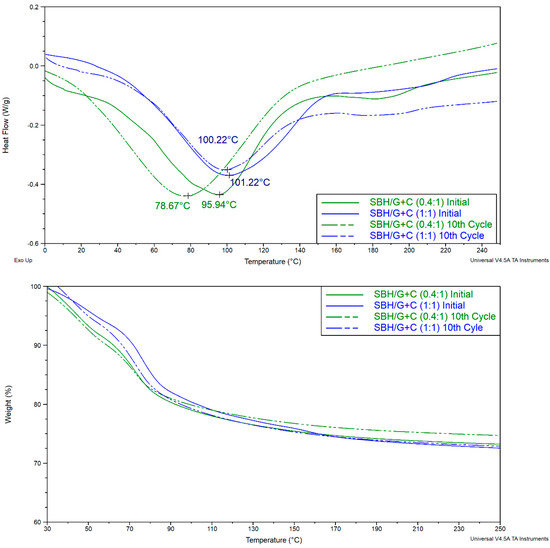
Figure 20.
DSC (top) and TGA (bottom) charts of SBH/G+C pellets prepared under 5.2 kN⋅mm−2 in a 25mm diameter.
After the h/d cyclic tests, SBH/G+C (0.4:1) showed the most deformed geometry and almost totally crumbled (Figure 10, No. 1). The same pellets also showed the greatest reaction temperature change from 95 to 78 °C. SBH/G+C (1:1) showed similar reaction temperature values at around 100 °C before and after the h/d cyclic tests. Its pellets also preserved their geometrical structure throughout the cyclic tests unlike SBH/G+C (0.4:1). When the saturated solution is prepared with SBH, a crystal lattice no longer exists and after soaking carbon with the saturated solution, SBH (aq) molecules can bond with the carbon. Changes in the lattice structure may be the reason for the changes observed in the peak temperatures in the DSC tests. Previously, SBH in the crystalline lattice showed three peaks, at 91, 144, and 198 °C.
Figure 21 summarizes the heat of fusion values obtained from the DSC analysis of the above-mentioned heat storage pellets. The MSH/G+C samples showed a heat of fusion of around 1300 J⋅g−1 regardless of the number of the hydration/dehydration cyclic test performed. The difference was around 300 J⋅g−1 with the theoretical enthalpy of the fusion of MgSO47H2O. The MSH/G+C samples have also shown a consistent heat of fusion throughout the hydration/dehydration cyclic tests.
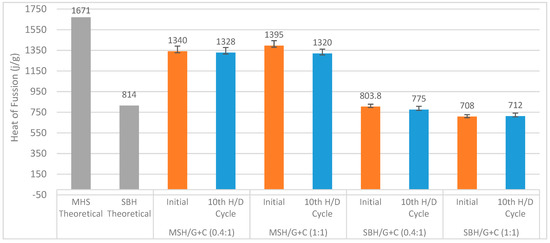
Figure 21.
Heat of fusion of MSH/G+C (0.4:1) (1:1) and MSH/G+C (0.4:1) (1:1) pellets in comparison with the theoretical enthalpy of the fusion of the MSH and SBH from Table 1. The theoretical values show the heat of fusion values of the transitions for 7 and 5 moles of water release from MSH and SBH, respectively. Experimental values show the heat of fusion values corresponding to the near complete dehydration of the composite pellets.
5.3. Permeability Test Results
Good permeability of the pellets is important to allow for a better reacting gas and the energy storage. The permeability of the pellets, manufactured with and without the supportive materials of AC and ENG, was compared in Figure 22. The permeability of the dehydrated composite (salt hydrate, ENG, and AC) pellets is also given in the charts below. The dehydrated pellets that were produced using only MSH and SBH could not be measured due to the geometrical change that occurred after a dehydration cycle. In the charts below, the Y axis presents the applied apparent nitrogen flow rate, and the X axis presents the permeability of the pellets manufactured at different compression pressures.
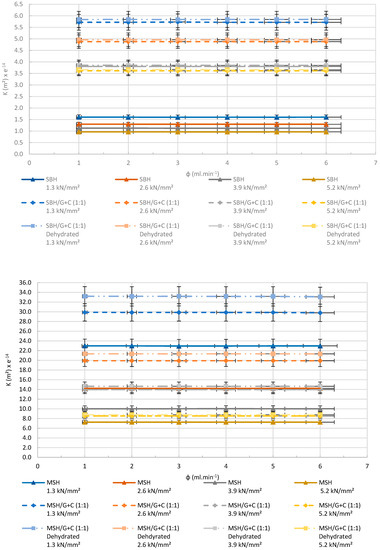
Figure 22.
Experimental results of the permeability tests made for SBH (top) and MSH (bottom) pellets compressed in different pressures. R2 > 0.99.
Figure 22 presents a clear increase in the permeability of SrBr2·6H2O and MgSO4·7H2O composite pellets after being mixed with AC and ENG. However, increasing the compression pressure resulted in a decrease in the permeability of the pellets. This decrease was expected due to the reduction in the space between the molecules in the pellet. For the SBH pellets, permeability was enhanced more than 3.5 times after the utilization of AC and ENG. The MSH pellets gave a more modest increase with a 1.3 times increase after adding AC and ENG to the mixture. All samples showed a slight increase in their permeability after the first dehydration cycle. This was also expected because water molecules leaving the pellet create more pores behind, where N2 can pass through.
Figure 23, Figure 24, Figure 25, Figure 26, Figure 27 and Figure 28 illustrate the pressure difference between the inlet and outlet of the sample bed with the increasing apparent nitrogen flow rate.
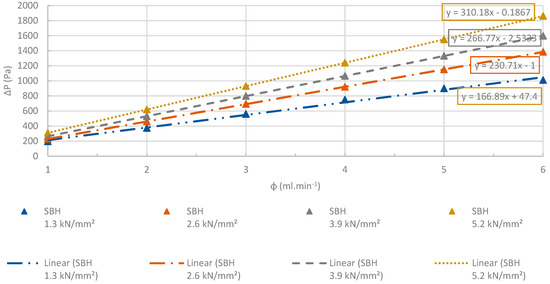
Figure 23.
Changes at differential pressures of the SBH pellets with increasing flow rates. R2 > 0.99. The accuracy of the pressure measurements was less than 0.1%.
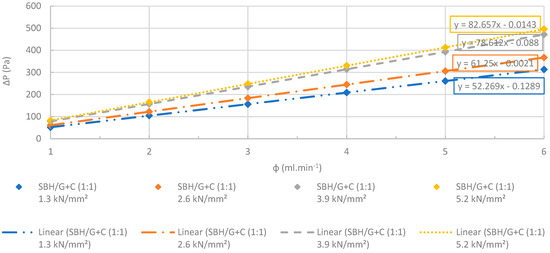
Figure 24.
Changes at differential pressures of the SBH/G+C (1:1) pellets with increasing flow rates. R2 > 0.99. The accuracy of the pressure measurements was less than 0.1%.
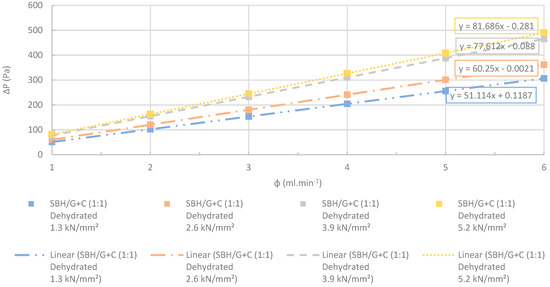
Figure 25.
Changes at differential pressures with increasing flow rates. The SBH/G+C (1:1) pellets manufactured at several different compression pressures were dehydrated completely before the test. R2 > 0.99. The accuracy of the pressure measurements was less than 0.1%.
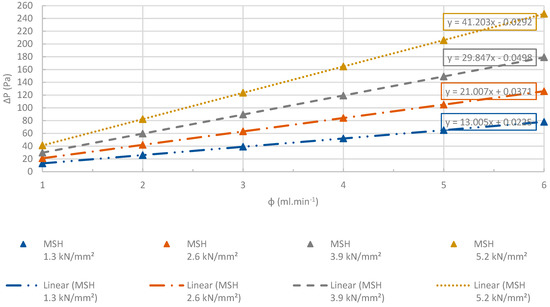
Figure 26.
Changes at differential pressures of the MSH pellets with increasing flow rates. R2 > 0.99. The accuracy of the pressure measurements was less than 0.1%.
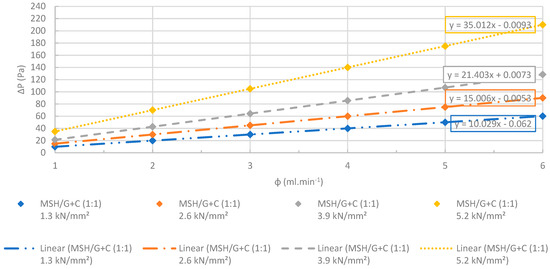
Figure 27.
Changes at differential pressures of MSH/G+C (1:1) pellets with increasing flow rates. R2 > 0.99. The accuracy of the pressure measurements was less than 0.1%.
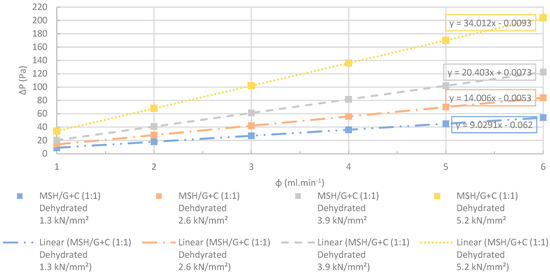
Figure 28.
Changes at differential pressures with increasing flow rates. The MSH/G+C (1:1) pellets manufactured at several different compression pressures were dehydrated completely before the test. R2 > 0.99. The accuracy of the pressure measurements was less than 0.1%.
Figure 23, Figure 24, Figure 25, Figure 26, Figure 27 and Figure 28 show the linear change at the differential pressure with the increasing flow rate. These results are confirming the results illustrated in Figure 22, where the permeability of the pellets was independent from the apparent nitrogen flow rates. Permeability differed less than 6% between the various flow rates. The results given for each flow rate are the average value obtained from the three repeated permeability measurements. The difference between the repeated experiments and the mean value was only ±4%. The flow rates were selected between 1 and 6 ml⋅min−1 in order to have low Reynolds number (< 1) to use Darcy’s law for the permeability tests [74].
5.4. Porosity Test Results
Figure 29 presents the porosity of the pellets manufactured with or without AC and ENG. MSH, SBH, SBH/G+C(1:1), and MSH/G+C(1:1) composite pellets prepared under different compression pressures were compared, and changes in the porosity of the pellets with the increasing compression pressures are also illustrated in the chart given below. The porosity tests were made for both hydrated and dehydrated forms of the composite pellets. Due to the geometrical change after the dehydration tests, dehydrated SBH and MSH pellets could not be used for the porosity tests.
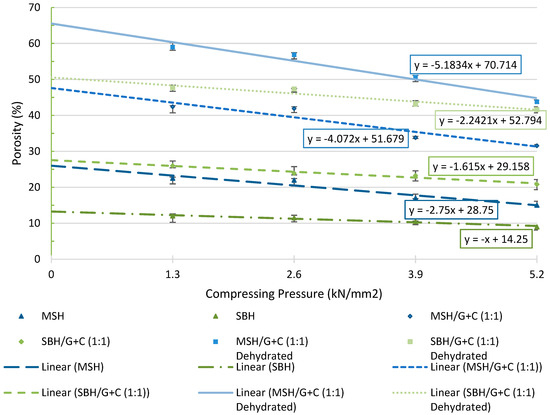
Figure 29.
Porosity test results for pellets manufactured at the different compression pressures.
Each data point in Figure 29 is an average value obtained from seven identical tests, where the relative difference between the tests was less than 5%. The porosity of the MSH/G+C (1:1) pellets increased by around 20% after adding AC and ENG to the mixture. Similarly, there was around a 13% increase in the porosity of the SBH/G+C (1:1) when compared with the SBH pellet. It is also notable that the dehydration process further increased the porosity of all the manufactured pellets, similar to the increase observed at the permeability of the pellets, as mentioned before.
5.5. Thermal Conductivity Test Results
Good thermal conductivity is needed in order to prevent hot spots and to efficiently transport heat out of the structures. Figure 30 presents the thermal conductivity test results of the pellets manufactured at several different compression pressures. The Y axis presents the thermal conductivity of the pellets while the X axis presents the compression pressures.
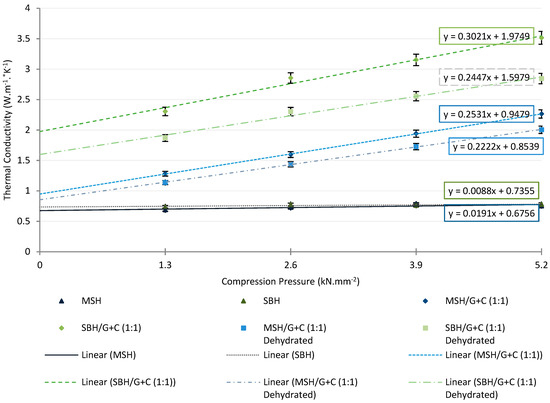
Figure 30.
Thermal conductivity test results for the pellets manufactured at the different compressing pressures. The samples that were dried completely before the tests are marked with dehydrated at the end of their name.
With the use of AC and ENG, SBH/G+C (1:1) pellets exhibited the most noticeable increase in their thermal conductivity at all compression pressures. The enhancement in the thermal conductivity after utilizing the ENG and AC in the composite mixture was in all cases greater than 200% for the strontium bromide pellets (SBH, SBH/G+C (1:1)). MSH/G+C (1:1) pellets manufactured under the same compression pressures showed less enhancement, at half the thermal conductivity increase of the SBH/G+C (1:1) pellets. For both MSH/G+C (1:1) and SBH/G+C (1:1), the highest enhancement occurred at a 5.2 kN⋅mm−2 compression pressure, with their thermal conductivities increasing by 200% and 350%, respectively. This can be attributed to the reduction in the pellet’s porosity and a greater surface contact between the conductive carbon phases. Similarly, after the dehydration cycle, the porosity of the sample was increased, causing a decrease in the thermal conductivity.
The high thermal conductivity of the pellets could help distributing heat faster from outside of the pellet to the inside during the dehydration cycle. This would help the pellet to have higher heat transfer rates. However, conducting heat alone is not sufficient for completing the dehydration reaction. Pellets should also be porous and permeable enough to allow mass exchange between the chemical molecules and the working fluid (air). However, very high porosity means greater void space in the pellet, reducing the volumetric heat storage capacity and the thermal conductivity. Ideally, for the reactor scale operations, pellets should be densely packed (compressed under high compression pressure) to maximize the volumetric storage capacity with the reasonable porosity to allow heat and mass transfer.
6. Conclusions
To evaluate the heat storage potential of the thermochemical materials, mass changes during the hydration and dehydration cycles and the enthalpy of the fusion of the selected pellets were investigated. Comparisons were made to understand the effect of using ENG and AC as supportive media in THSS. Table 3 presents the changes in the permeability, porosity, and thermal conductivity of the composite pellets compared to the pellets manufactured without any AC or ENG. Both the permeability and thermal conductivity results obtained during the experiments were similar to the literature values where different salt hydrates were utilized [75]. However, these are the first results prepared with a mixed AC–ENG host matrix, compressed at different compression pressures, to illustrate the changes in their material properties, such as thermal conductivity, permeability, and porosity.

Table 3.
Comparison of changes in the measured parameters of the pellets.
There was no clear relationship between the porosity and permeability of the various composites. This could be because of differences in the distribution and size of the pores. Although compressing SBH and MSH theoretically increases the volumetric energy storage capacity, the pellets of SBH and MSH did not show long-term suitability for THSS due to the major changes that occurred in their geometry after the cyclic tests. The MSH/G+C (1:1) pellets performed favorably in all the tests apart from thermal conductivity, where the SBH/G+C (1:1) pellets showed greater enhancement. However due to the price advantage and the stability of the pellets in hydration and dehydration cycles, MSH/G+C (1:1) is a strong candidate as a long-term heat storage material. It shows a lack of deliquescence and good structural stability that the other samples lacked. In particular, the mixture of ENG and AC gives structural resilience and protection against deliquescence, which each individual component alone lacks.
The MSH/G+C (1:1) pellets took 96 h for charging (dehydration) at 85 °C and exhibited a 1395 J⋅g−1 heat of fusion, which corresponds to a loss of around five water molecules per molecule of magnesium sulfate. Discharging (hydrating) at 20 °C lasted 168 h with an 8.3 J⋅g−1⋅h−1 (heat of fusion obtained from the dehydration divided by the duration of the hydration) exothermic heat flow rate. The bulk density of the fully hydrated MSH/G+C (1:1) pellets was around 2.2 g.cm−3, corresponding to around 3 GJ.m−3 of heat energy storage.
Author Contributions
Data curation, S.C.A.; Investigation, S.C.A.; Supervision, Z.S. and S.C.M.; Writing—original draft, S.C.A.; Writing—review & editing, Z.S., S.C.M. and G.M. All authors have read and agreed to the published version of the manuscript.
Funding
This research received no external funding.
Acknowledgments
As the first author, I would like to acknowledge the financial support of the University of Otago, Division of Science.
Conflicts of Interest
The authors declare that there is no conflict of interest in this manuscript.
Nomenclature
| The following abbreviations are used in this paper | |
| AC: | Activated carbon |
| Aq: | Aqueous |
| DSC: | Differential scanning calorimetry |
| ENG: | Expanded natural graphite |
| h/d: | Hydration and dehydration |
| MSH: | Magnesium sulphate heptahydrate (MgSO4⋅7H2O) |
| OECD: | Organization for economic co-operation and development |
| RH: | Relative humidity |
| SAPO: | Silica-aluminophosphate |
| SBH: | Strontium bromide hexahydrate (SrBr2⋅6H2O) Thermogravimetric analysis |
| TGA: | Thermogravimetric analysis |
| THS: | Thermochemical heat storage |
| THSS: | Thermochemical heat storage systems |
| The following Latin variables are used: | |
| H: | Enthalpy (kJ⋅mol−1) |
| ∆P: | Pressure difference (Pa) |
| S: | Entropy (J⋅mol−1⋅K−1) |
| k: | Permeability coefficient (m2) |
| Pcomp: | Compression pressure (N⋅mm−2) |
| V: | Volume (ml) |
| m: | Mass (g) |
| The following Greek variables are used: | |
| α: | The cross-section area of the flow region (m2) |
| Λ: | Thickness (m) |
| μ: | Viscosity (Pa⋅s) |
| Φ: | Flow rate (m3⋅s−1) |
References
- International Energy Agency. World Energy Outlook 2019; IEA: Paris, France, 2019. [Google Scholar]
- Gi, K.; Sano, F.; Hayashi, A.; Tomoda, T.; Akimoto, K. A global analysis of residential heating and cooling service demand and cost-effective energy consumption under different climate change scenarios up to 2050. Mitig. Adapt. Strateg. Glob. Chang. 2016, 23, 51–79. [Google Scholar] [CrossRef]
- Isaacs, N.; Saville-Smith, K.; Camilleri, M.; Burrough, L. Energy in New Zealand Houses: Comfort, Physics and Consumption; Branz: Porirua City, New Zealand, 2010. [Google Scholar]
- Electricity Authority. Electricity in New Zealand. 2018. Available online: https://www.ea.govt.nz/about-us/media-and-publications/electricity-new-zealand/ (accessed on 18 December 2019).
- Ministry of Business, Innovation and Employment. Sales-Based Electricity Costs 2019. Available online: https://www.mbie.govt.nz/assets/QRSS_June_2019.pdf (accessed on 18 December 2019).
- Eurostat. Energy Consumption in Households. Available online: https://ec.europa.eu/eurostat/statistics-explained/index.php/Energy_consumption_in_households (accessed on 18 December 2019).
- Harkouss, F.; Fardoun, F.; Biwole, P.H. Optimal design of renewable energy solution sets for net zero energy buildings. Energy 2019, 179, 1155–1175. [Google Scholar] [CrossRef]
- Martinopoulos, G. Life Cycle Assessment of solar energy conversion systems in energetic retrofitted buildings. J. Build. Eng. 2018, 20, 256–263. [Google Scholar] [CrossRef]
- Martinopoulos, G.; Tsalikis, G. Diffusion and adoption of solar energy conversion systems—The case of Greece. Energy 2018, 144, 800–807. [Google Scholar] [CrossRef]
- De, S.; Bandyopadhyay, S.; Assadi, M.; Mukherjee, D. Green Energy and Technology; Springer: Singapore, 2018; Volume 1. [Google Scholar]
- Diaz, P.M. Analysis and Comparison of different types of Thermal Energy Storage Systems: A Review. J. Adv. Mech. Eng. Sci. 2016, 2, 33–46. [Google Scholar] [CrossRef]
- Finck, C.; Li, R.; Kramer, R.; Zeiler, W. Quantifying demand flexibility of power-to-heat and thermal energy storage in the control of building heating systems. Appl. Energy 2018, 209, 409–425. [Google Scholar] [CrossRef]
- Pardo, P.; Deydier, A.; Anxionnaz-Minvielle, Z.; Rougé, S.; Cabassud, M.; Cognet, P. A review on high temperature thermochemical heat energy storage. Renew. Sustain. Energy Rev. 2014, 32, 591–610. [Google Scholar] [CrossRef]
- Garg, H.P.; Mullick, S.C.; Bhargava, V.K. Solar Thermal Energy Storage; D. Reidel Publishing Company: Dordrecht, The Netherlands, 1985. [Google Scholar]
- N’Tsoukpoe, K.E.; Schmidt, T.; Rammelberg, H.U.; Watts, B.A.; Ruck, W.K.L. A systematic multi-step screening of numerous salt hydrates for low temperature thermochemical energy storage. Appl. Energy 2014, 124, 1–16. [Google Scholar] [CrossRef]
- Oliver, J.E. Encyclopedia of World Climatology; Springer: Dordrecht, The Netherlands; Imprint Springer: New York, NY, USA, 2005. [Google Scholar]
- WHO Regional Office for Europe. Damp and Mould; Health Risks, Prevention and Remedial Actions; World Health Organization: Copenhagen, Denmark, 2009. [Google Scholar]
- Scapino, L.; Zondag, H.A.; Van Bael, J.; Diriken, J.; Rindt, C.C.M. Sorption heat storage for long-term low-temperature applications: A review on the advancements at material and prototype scale. Appl. Energy 2017, 190, 920–948. [Google Scholar] [CrossRef]
- Mauran, S.; Lahmidi, H.; Goetz, V. Solar heating and cooling by a thermochemical process First experiments of a prototype storing 60 kWh by a solid/gas reaction. Sol. Energy 2008, 82, 623–636. [Google Scholar] [CrossRef]
- Jabbari-Hichri, A.; Bennici, S.; Auroux, A. CaCl2-containing composites as thermochemical heat storage materials. Sol. Energy Mater. Sol. Cells 2017, 172, 177–185. [Google Scholar] [CrossRef]
- Xie, N.; Huang, Z.; Luo, Z.; Gao, X.; Fang, Y.; Zhang, Z. Inorganic Salt Hydrate for Thermal Energy Storage. Appl. Sci. 2017, 7, 1317. [Google Scholar] [CrossRef]
- Jarimi, H.; Aydin, D.; Yanan, Z.; Ozankaya, G.; Chen, X.; Riffat, S. Review on the recent progress of thermochemical materials and processes for solar thermal energy storage and industrial waste heat recovery. Int. J. Low Carbon Technol. 2018, 14, 44–69. [Google Scholar] [CrossRef]
- Donkersa, P.A.J.; Sögütoglu, L.C.; Huinink, H.P.; Fischer, H.R.; Adan, O.C.G. A review of salt hydrates for seasonal heat storage in domestic applications. Appl. Energy 2017, 199, 45–68. [Google Scholar] [CrossRef]
- Korhammer, K.; Druske, M.; Fopah-Lele, A.; Rammelberg, H.; Wegscheider, N.; Opel, O.; Osterland, T.; Ruck, W. Sorption and thermal characterization of composite materials based on chlorides for thermal energy storage. Appl. Energy 2016, 162, 1462–1477. [Google Scholar] [CrossRef]
- Hongois, S.; Kuznik, F.; Stevens, P.; Roux, J. Development and characterisation of a new MgSO4-zeolite composite for long-term thermal energy storage. Sol. Energy Mater. Sol. Cells 2011, 95, 1831–1837. [Google Scholar] [CrossRef]
- Aydin, D.; Casey, S.P.; Riffat, S. The latest advancements on thermochemical heat storage systems. Renew. Sustain. Energy Rev. 2015, 41, 356–367. [Google Scholar] [CrossRef]
- Alibaba. 4 Mesh to 16 Mesh High-Quality Coconut Shell Granular Activated Carbon. Available online: https://www.alibaba.com/product-detail/Expandable-graphite-with-factory-price_60769107419.html?spm=a2700.7724857.normalList.24.4ee527c3crqXrd&s=p (accessed on 18 December 2019).
- Alibaba. Factory Supply Natural Green Zeolite Mine Zeolite Stone Granular. Available online: https://www.alibaba.com/product-detail/Factory-Supply-Natural-Green-Zeolite-Mine_60770120279.html?spm=a2700.7724838.2017115.1.300b4db4xyKQGt (accessed on 18 December 2019).
- Henninger, S.K.; Jeremias, F.; Kummer, H.; Schossig, P.; Henning, H.M. Novel sorption materials for solar heating and cooling. Energy Procedia 2012, 30, 279–288. [Google Scholar] [CrossRef]
- Lahmidi, H.; Mauran, S.; Goetz, V. Definition, test and simulation of a thermochemical storage process adapted to solar thermal systems. Sol. Energy 2006, 80, 883–893. [Google Scholar] [CrossRef]
- Tanguy, G.; Papillon, P.; Paulus, C. Seasonal storage coupled to solar combisystem: Dynamic simulations for process dimensioning. In Proceedings of the EuroSun 2010, Graz, Austria, 28 September–1 October 2010. [Google Scholar]
- Marias, F.; Neveu, P.; Tanguy, G.; Papillon, P. Thermodynamic analysis and experimental study of solid/gas reactor operating in open mode. Energy 2014, 66, 757–765. [Google Scholar] [CrossRef]
- Ferchaud, C.J.; Zondag, H.A.; Veldhuis, J.B.; de Boer, R. Study of the reversible water vapour sorption process of MgSO4·7H2O and MgCl2·6H2O under the conditions of seasonal solar heat storage. In Proceedings of the 6th European Thermal Sciences Conference, Poitiers, France, 4–7 September 2012. [Google Scholar]
- Ferchaud, C.J.; Zondag, H.A.; de Boer, R.; Rindt, C.C.M. Characterization of the sorption process in thermochemical materials for seasonal solar heat storage application. In Proceedings of the 12th International Conference on Energy Storage (Innostock 2012), Lleida, Spain, 16–18 May 2012; pp. 1–10. [Google Scholar]
- Van Essen, V.M.; Zondag, H.A.; Gores, J.C.; Bleijendaal, L.P.J.; Bakker, M.; Schuitema, R.; Van Helden, W.G.J.; He, Z.; Rindt, C.C.M. Characterization of MgSO4 Hydrate for Thermochemical Seasonal Heat Storage. J. Sol. Energy Eng. 2009, 131, 7. [Google Scholar] [CrossRef]
- Van Essen, V.; Zondag, H.A.; Schuitema, R.; Van Helden, W. Materials for thermochemical storage: Characterization of magnesium sulfate. In Proceedings of the EuroSun 2008, Lisbon, Portugal, 7–10 October 2008. [Google Scholar]
- Py, X.; Daguerre, E.; Menard, D. Composites of expanded natural graphite and in situ prepared activated carbons. Carbon 2002, 40, 1255–1265. [Google Scholar] [CrossRef]
- IXOM. Safety Data Sheet, Activated Carbon; Global Safety Management, Inc.: Tampa, FL, USA, 2019. [Google Scholar]
- IXOM. Safety Data Sheet, Expandable Graphite; Division Of Rockleigh Industries Inc.: Rockleigh, NJ, USA, 2015. [Google Scholar]
- American Elements. Magnesium Sulfate Hexahydrate. Available online: https://www.americanelements.com/magnesium-sulfate-7487-88-9 (accessed on 18 December 2019).
- American Elements. Strontium Bromide. Available online: https://www.americanelements.com/strontium-bromide-10476-81-0 (accessed on 18 December 2019).
- Trausel, F.; de Jong, A.; Cuypers, R. A review on the properties of salt hydrates for thermochemical storage. In Proceedings of the SHC 2013 International Conference on Solar Heating and Cooling for Buildings and Industry, Delft, The Netherlands, 25 September 2013; pp. 447–452. [Google Scholar]
- Guion, J.; Sauzade, J.D.; Laügt, M. Critical examination and experimental determination of melting enthalpies and entropies of salt hydrates. Thermochim. Acta 1983, 67, 167–179. [Google Scholar] [CrossRef]
- Alibaba. Magnesium Sulphate Heptahydrate 99%; Alibaba group: Hangzhou, China, 2019. [Google Scholar]
- Michel, B.; Mazet, N.; Mauran, S.; Stitou, D.; Xu, J. Thermochemical process for seasonal storage of solar energy: Characterization and modeling of a high density reactive bed. Energy 2012, 47, 553–563. [Google Scholar] [CrossRef]
- Perry, D.L. Handbook of Inorganic Compounds, 2nd ed.; CRC Press, Taylor & Francis: Boca Raton, FL, USA, 2011. [Google Scholar]
- Alibaba. Strontium Bromide Hexahydrate 99%; Alibaba group: Hangzhou, China, 2019. [Google Scholar]
- Visscher, K.; Veldhuis, J.B.J.; Oonk, H.A.J.; van Ekeren, P.J.; Blok, J.G. Compacte Chemische Seizoensopslag Van Zonnewarmte Eindrapportage; ECN-C-04-074; ECN: Patten, The Netherlands, 2004. [Google Scholar]
- Fopah Lele, A. A Thermochemical Heat Storage System for Households. Ph.D. Thesis, Universität Lüneburg, Lüneburg, Germany, 2016. [Google Scholar]
- Ta Instruments. Thermal Application Note, Purge Gas Recommendations for Use in Modulated DSC. Available online: http://www.tainstruments.com/pdf/literature/TN44.pdf (accessed on 7 January 2020).
- Ta Instruments. Thermal Analysis 2014. Available online: http://www.tainstruments.com/wp-content/uploads/BROCH-TGASDT-2014-EN.pdf (accessed on 18 December 2019).
- Ta Instruments. Thermal Analysis 2011. Available online: http://www.tainstruments.com/pdf/2011_Thermal.pdf (accessed on 18 December 2019).
- Selley, R.C. Applied Sedimentology; Academic Press: London, UK, 2000. [Google Scholar]
- Masoodi, R.; Pillai, K.P.; Grahl, N.; Tan, H. Numerical simulation of LCM mold-filling during the manufacture of natural fiber composites. J. Reinf. Plast. Compos. 2012, 31, 363–378. [Google Scholar] [CrossRef]
- Sionkowska, A.; Kozlowska, J. Properties and modification of porous 3-D collagen/hydroxyapatite composites. Int. J. Biol. Macromol. 2013, 52, 250–259. [Google Scholar] [CrossRef]
- Squires, G.L. Practical Physics; Cambridge University Press: Cambridge, UK, 2001. [Google Scholar]
- Al-Ajlan, S.A. Measurements of thermal properties of insulation materials by using transient plane source technique. Appl. Therm. Eng. 2006, 26, 2184–2191. [Google Scholar] [CrossRef]
- Krupa, P.; Malinaric, S. Using the Transient Plane Source Method for Measuring Thermal Parameters of Electroceramics. Int. J. Mechan. Mechatron. Eng. 2014, 8, 735–740. [Google Scholar]
- Gustafsson, S.E. Transient plane source techniques for thermal conductivity and thermal diffusivity measurements of solid materials. Rev. Sci. Instrum. 1991, 62, 797–804. [Google Scholar] [CrossRef]
- He, Y. Rapid thermal conductivity measurement with a hot disk sensor Part 1. Theoretical considerations. Thermochim. Acta 2005, 436, 122–129. [Google Scholar] [CrossRef]
- Jin, Z.; Tian, B.; Wang, L.; Wang, R. Comparison on Thermal Conductivity and Permeability of Granular and Consolidated Activated Carbon for Refrigeration. Chin. J. Chem. Eng. 2013, 21, 676–682. [Google Scholar] [CrossRef]
- Lekner, J.; Dorf, M.C. Why some things are darker when wet. Appl. Opt. 1988, 27, 1278–1280. [Google Scholar] [CrossRef] [PubMed]
- Emons, H.H.; Ziegenbalg, G.; Naumann, R.; Paulik, F. Thermal decomposition of the magnesium sulfate hydrates under quasi-isothermal and quasi-isobaric conditions. J. Therm. Anal. 1990, 36, 1265–1279. [Google Scholar] [CrossRef]
- Ruiz-Agudo, E.; Martin-Ramos, J.D.; Rodriguez-Navarro, C. Mechanism and kinetics of dehydration of epsomite crystals formed in the presence of organic additives. J. Phys. Chem. B. 2007, 111, 41–52. [Google Scholar] [CrossRef] [PubMed]
- Hamad, S.E.D. An experimental study of salt hydrate MgSO4·7H2O. Therm. Acta 1975, 13, 409–418. [Google Scholar] [CrossRef]
- Phadnis, A.B.; Deshpande, V.V. On the dehydration of MgSO4·7H2O. Therm. Acta 1981, 43, 249–250. [Google Scholar] [CrossRef]
- Paulik, J.; Paulik, F.; Arnold, M. Dehydration of magnesium sulfate heptahydrate investigated by quasi isothermal-quasi isobaric TG. Therm. Acta 1981, 50, 105–110. [Google Scholar] [CrossRef]
- Berlin, H.-U.Z. Investigation of Polymers with Differential Scanning Calorimetry. Available online: https://polymerscience.physik.hu-berlin.de/docs/manuals/DSC.pdf (accessed on 3 January 2020).
- Höhne, G.; Wolfgang, F.; Hemminger, H.-J. Differential Scanning Calorimetry; Springer: Berlin, Germany, 2003. [Google Scholar]
- Iype, E.; Ozen, C.; Nedea, S.V.; Rindt, C.C.M.; Zondag, H.A. Quantum Chemical Analysis of the Structures of MgSO4 Hydrates. In Proceedings of the 12th International Conference on Energy Storage, Düsseldorf, Germany, 13–15 March 2018. [Google Scholar]
- Harris, J.D.; Rusch, A.W. Identifying Hydrated Salts Using Simultaneous Thermogravimetric Analysis and Differential Scanning Calorimetry. J. Chem. Educ. 2012, 2, 235–238. [Google Scholar] [CrossRef]
- Ding, Y.; Riffat, S.B. Thermochemical energy storage technologies for building applications: A state-of-the-art review. Int. J. Low-Carbon Technol. 2012, 8, 106–116. [Google Scholar] [CrossRef]
- Abedin, A.H.; Rosen, M.A. Closed and open thermochemical energy storage: Energy- and exergy-based comparisons. Energy 2012, 41, 83–92. [Google Scholar] [CrossRef]
- Wang, L.; Li, Y.; Zhao, G.; Chen, N.; Xu, Y. Experimental Investigation of Flow Characteristics in Porous Media at Low Reynolds Numbers (Re→0) under Different Constant Hydraulic Heads. Water 2019, 11, 2317. [Google Scholar] [CrossRef]
- Tian, B.; Jin, Z.Q.; Wang, L.W.; Wang, R.Z. Permeability and thermal conductivity of compact chemical and physical adsorbents with expanded natural graphite as host matrix. Int. J. Heat Mass Trans. 2012, 55, 4453–4459. [Google Scholar] [CrossRef]
© 2020 by the authors. Licensee MDPI, Basel, Switzerland. This article is an open access article distributed under the terms and conditions of the Creative Commons Attribution (CC BY) license (http://creativecommons.org/licenses/by/4.0/).