Article

Optimal Battery Storage Participation in European Energy and Reserves Markets

by
Kristina Pandžić
1,†,
Ivan Pavić
2,†,
Ivan Andročec
3,† and
Hrvoje Pandžić
2,*,†
1
Croatian TSO (Hrvatski Operator Prijenosnog Sustava d.o.o.—HOPS), Zagreb 10000, Croatia
2
Department of Energy and Power Systems, Faculty of Electrical Engineering and Computing, University of Zagreb, Zagreb 10000, Croatia
3
Hrvatska Elektroprivreda d.d., Zagreb 10000, Croatia
*
Author to whom correspondence should be addressed.
These authors contributed equally to this work.
Energies 2020, 13(24), 6629; https://doi.org/10.3390/en13246629
Submission received: 19 October 2020 / Revised: 29 November 2020 / Accepted: 1 December 2020 / Published: 15 December 2020
(This article belongs to the Special Issue Integration of Electric Vehicles and Battery Storage Systems)

Abstract

:
Battery energy storage is becoming an important asset in modern power systems. Considering the market prices and battery storage characteristics, reserve provision is a tempting play fields for such assets. This paper aims at filling the gap by developing a mathematically rigorous model and applying it to the existing and future electricity market design in Europe. The paper presents a bilevel model for optimal battery storage participation in day-ahead energy market as a price taker, and reserve capacity and activation market as a price maker. It uses an accurate battery charging model to reliably represent the behavior of real-life lithium-ion battery storage. The proposed bilevel model is converted into a mixed-integer linear program by using the Karush–Kuhn–Tucker optimality conditions. The case study uses real-life data on reserve capacity and activation costs and quantities in German markets. The reserves activation quantities and activation prices are modeled by a set of credible scenarios in the lower-level problem. Finally, a sensitivity analysis is conducted to comprehend to what extent do battery storage bidding prices affect its overall profit.

1. Introduction

The European power sector is characterized by an ongoing liberalization and integration of national markets into one common marketplace. After the successful introduction of national electricity exchanges, followed by their coupling, the focus switched to the provision of ancillary services. The frequency reserves, as fairly location-independent services, were first in line to be governed by the market laws. Most of the European systems already have well-organized reserve markets, but their harmonization, which is the foundation for the integrated European reserve markets, is yet to be initiated. Reserve markets will use the same cross-border interconnection capacities as the energy market, and therefore these two markets must be co-optimized. The most recent European Union energy package incorporates detailed rules on how the reserve markets are to be organized, co-optimized and coupled, forming a cornerstone for all future reserve market research [1].
The reserve markets, depending on the type of reserve and different countries’ regulations, are organized as either single-stage capacity-only markets or two-stage capacity and activation markets. The former type includes only capacity auction where the reserve providers’ bids consist of capacity volume (in MW) and price (€/MW). Using a merit order list (MOL), the the transmission system operator (TSO) accepts the cheapest bids until the required capacity is reached. A reserve provider must take into account the potential activated energy cost within its capacity bid as it is usually not separately remunerated (it could also be remunerated based on a regulated price). Such capacity is activated based on uniform price or some other rule. Usually, the frequency containment reserve (FCR) and sometimes automatic frequency restoration reserve (aFRR) are modeled this way. The latter type, along with the capacity procurement, includes the activated energy auction as well. A reserve provider’s bid consist of energy volume (in MWh) and price (in €/MW). Using the MOL, energy offers are activated when needed. Such pricing activates the cheapest units first and therefore yields lower overall cost. Usually, manual restoration and replacement reserves and often automatic restoration reserves are modeled this way.
Both stages can be modeled in either a pay-as-bid or marginal pricing manner. In the current German secondary reserve market, both the capacity and the activated energy are priced as pay-as-bid [2,3]. However, the PICASSO project published a report with a conclusion that the pricing of aFRR activated energy in a future European-wide aFRR activation platform will be guided by the marginal pricing rule [4], which is adopted in this paper as well.
The capacity of the installed battery storage worldwide was around 10 GWh in 2017 [5]. In Germany alone, as one of the leaders in battery installations, in 2018 the capacity of home storage systems was around 930 MWh and large storage systems around 550 MWh [5]. The capacity of industrial storage systems is hard to estimate due to a lack of information. It is estimated that by the end of 2030 the battery capacity would rise to 181–421 GWh worldwide [5]. Most of the large storage systems operate in FCR markets. The FCR markets, in developed countries such as Germany and UK, are coming close to saturation, but new revenue streams are unlocking such as grid deferral and aFRR markets [6].
Coupling of national reserve markets and their co-optimization with energy markets creates new possibilities for battery storage as they could sell their services cross-border and position themselves in multiple markets. The battery storage as a fully flexible resource must be able to simultaneously bid in both the energy and reserve markets and must maintain its state-of-energy (SOE) within the allowed, i.e., feasible, range. Energy markets include a large number of different units, both capacity- and technology-wise, and its size is considerably larger then one battery storage. For example, the French power system had the minimum demand of 30.4 GW in 2018 during the summer and the peak demand of 96.6 GW during the winter [7]. Battery storage impact on such large market is negligible and therefore it can be seen as a price taker. However, reserve markets are smaller in size. For example, the German aFRR market has total demand of above 2 GW, while German FCR market is somewhat higher than 0.5 GW [8]. The battery storage trading on those markets should be modeled as price maker as its behavior could affect the prices.
In this paper, a novel battery storage scheduling algorithm for joint participation on energy and reserve market is designed and validated on a realistic test case. The battery storage acts as a price taker in the day-ahead energy market and as a price maker in the reserves market. Such algorithms are deemed to be the backbone for future battery scheduling in the large coupled and co-optimized energy and reserve markets in Europe. The focus of the paper is on aFRR markets as they are becoming a new source of revenue for the battery storage systems. However, the developed algorithm can easily be adjusted for other types of reserves.

2. Literature Review and Contributions

Depending on its capacity with respect to the total system load, energy storage can be considered too small to affect market prices, i.e., price taker, or to have a sufficient capacity to alter the market outcomes, thus becoming a price maker. Some early studies model the energy storage as a price taker, which means the prices in the models are known upfront [9,10].
Arbitrage alone might not be sufficient to justify the investment cost of energy storage. The authors in [11] prove that large-scale energy storage will dampen the price difference between on- and off-peak hours when performing arbitrage. It hereby reduces the profit it can make in the energy market, suggesting that energy storage should be used for ancillary services as well.
In [12], the authors model a profit-seeking price-taker energy storage that participates in energy and reserve day-ahead market and energy hour-ahead market. Stochastic unit commitment is used to derive scenarios for the cost of power and reserve in the hour-ahead market, as well as the actual reserve activation quantities. The uncertain parameters arise from the wind power plant output uncertainty. An optimal energy storage bidding model considering day-ahead energy, spinning reserve and regulation markets is presented in [13]. The price-taker energy storage considers uncertainties of predicted market prices and energy deployment in spinning reserve and regulation markets. The optimal bidding schedule is secured against realization of uncertainties using robust optimization framework.
Optimal bidding strategies are studied for battery energy storage systems in the reserve market with battery aging constraints in [14,15]. On the other hand, [16] combines power from unpredictable wind and photovoltaic sources with energy storage in the day-ahead electricity market using a stochastic two-stage programming environment, where the first stage is the day-ahead market, while the second stage simulates the balancing market using multiple scenario sets with historical data. An interested reader may find a comprehensive overview of operating models of energy storage is available in [17].
The Alberta Electric System Operator (AESO) compared sequential clearing of the energy and reserve market with their co-optimization and concluded that co-optimization was more cost-efficient then sequential clearing [18]. Authors in [19] propose a model that co-optimizes energy and reserve market for a combined cycle plant using a mixed-integer linear program (MILP). Paper [20] proposes a nonlinear model for co-optimization of energy and reserves in competitive electricity markets including nonlinear constraints such as power flow losses, unreliability and generation repair time. The authors in [21] clarify two approaches used in the literature to formulate the reserve requirements. The first one is by pre-defining the necessary reserve requirements using ad-hoc rules, such as the 3 + 5% rule [22], and setting the reserve requirements as parameters in the optimization problem. The second approach incorporates the power balance and transmission constraints both at the day-ahead and the balancing stage. These approaches are studied and evaluated in the MISO (Midwestern Independent System Operator) system in [23]. Another model that proposes an optimal dispatch of the energy and reserve capacity, but considering uncertain demand, is presented in [24]. The effects of co-optimized and individual clearing of the energy and reserve markets are investigated.
Despite a large body of literature focused on either theoretical or US-market based participation of energy storage, there are very few papers that replicate the operation of European markets and integrate them in a rigorous and scientific framework. One of the pivotal papers in modeling battery storage providing primary frequency response in the European setting is [25]. The presented optimization problem and the case study is focused and based on data for the German market. German energy and reserves market was also targeted in [26], where the pay-as-bid feature as well as longer time steps for providing reserve (4–12 h) was adopted. German aFRR market was the main topic in papers [27,28]. The former paper tackles the aFRR activation duration and price forecasting while the latter one deals with the bidding process in the German energy and aFRR reserve markets. The model in the paper [28] creates bids for storage to participate in the aFRR market based on price and activation forecasts meaning that it does not observe energy storage as a price forming factor but as a price taker.
With respect to the examined literature, this paper aims at filling the gap by combining a mathematically rigorous mathematical model with application to the existing and future electricity markets currently designed in Europe. Contribution of the paper is threefold. First, we develop a bilevel model for optimal battery storage participation in day-ahead energy market as a price taker, and reserve capacity and activation market as a price maker. Conceptually, this paper is an alternative to the approach of price maker algorithms for the German aFRR presented in [27,28]. As opposed to the majority of the literature that uses a generic energy storage model, we use an accurate battery charging model to reliably represent the behavior of actual battery storage. The proposed bilevel model is converted into a mixed-integer linear program by using the Karush–Kuhn–Tucker (KKT) optimality conditions. Second, we use real-life data on reserve capacity and activation costs and quantities to bring relevant conclusions. The reserves activation quantities and, consequently, the activation price is modeled by a set of credible scenarios. Thirdly, we provide a sensitivity analysis to comprehend to what extent do battery storage bidding prices affect its overall profit.
In the following chapter we first define the indices, parameters and variables used in the model and then present the model itself. The KKT optimality conditions and linearization technique are also presented. In Section 4 we present a case study based on the German market. This section also includes a sensitivity analysis for different sets of battery storage bidding prices. Finally, the relevant conclusions are drawn in the final section.

3. Mathematical Formulation

3.1. Nomenclature

Sets:
I Set of generation units, indexed by i.
J Set of battery charging curve linear parts, indexed by j.
S Set of reserve activation scenarios, indexed by s.
T Set of time periods, indexed by t.
Parameters:
C i a  Generator i down reserve activation price (€/MWh).
C i a  Generator i up reserve activation price (€/MWh).
C b , a  Battery storage down reserve activation price (€/MWh).
C b , a  Battery storage up reserve activation price (€/MWh).
C b , cap  Battery storage down reserve capacity price (€/MW).
C b , cap  Battery storage up reserve capacity price (€/MW).
C i cap  Generator i down reserve capacity price (€/MW).
C i cap  Generator i up reserve capacity price (€/MW).
G t , i  Generator i maximum down reserve capacity (MW).
G t , i  Generator i maximum up reserve capacity (MW).
F j  Maximum amount of energy that can be charged at specific state-of-energy breakpoint R j as a portion of S O E .
P Battery storage maximum charging and discharging power (MW).
R j  Capacity of each state-of-energy segment j as a portion of the maximum state-of-energy S O E .
R t cap  Required down reserve capacity (MW).
R t cap  Required up reserve capacity (MW).
R t , s a  Activated down reserve energy (MWh).
R t , s a  Activated up reserve energy (MWh).
η ch  Battery storage charging efficiency.
η dis  Battery storage discharging efficiency.
λ t da  Day-ahead market price (€/MW).
Variables:
g t , i , s a  Generator i activated down energy (MWh).
g t , i , s a  Generator i activated up energy (MWh).
g t , i cap  Generator i down capacity reserved quantity (MW).
g t , i cap  Generator i up capacity reserved quantity (MW).
q ¯ t  Battery storage down reserve capacity bid (MW).
q ¯ t  Battery storage up reserve capacity bid (MW).
q t , s a  Battery storage activated down reserve quantity in scenario s (MWh).
q t , s a  Battery storage activated up reserve quantity in scenario s (MWh).
q t cap  Battery storage down reserved capacity (MW).
q t cap  Battery storage up reserved capacity (MW).
q t ch  Battery storage charging quantity (MW).
q t dis  Battery storage discharging quantity (MW).
s o e t , s  Battery storage state-of-energy (MWh).
λ t , s a  Down reserve activation clearing price in scenario s (€/MWh).
λ t , s a  Up reserve activation clearing price in scenario s (€/MWh).
λ t cap  Down reserve capacity clearing price (€/MW).
λ t cap  Up reserve capacity clearing price (€/MW).

3.2. Initial Problem Formulation

The proposed battery storage optimal bidding problem is formulated as follows:
Maximize Ξ UL t T λ t da ( q t dis q t ch ) + λ t cap · q t cap + λ t cap · q t cap + λ t , s a · q t , s a + λ t , s a · q t , s a
subject to:
0 q t ch Δ s o e t Δ t · η ch , t
0 q t dis P · η dis , t
q t ch q t dis + q ¯ t Δ s o e t , s Δ t · η ch , t , s
q t ch + q t dis + q ¯ t P · η dis , t
s o e t , s = s o e t 1 , s + Δ t · q t ch · η ch + q t , s a · η ch Δ t · q t dis / η dis q t , s a / η dis , t , s
0 s o e t , s Δ t · q ¯ t , t , s
s o e t , s + Δ t · q ¯ t S O E , t , s
s o e t , s = j = 1 J 1 s o e t , j , s , t
0 s o e t , j , s ( R j + 1 R j ) · S O E , t , j , s
Δ s o e t , s = F 1 · S O E + j = 1 J 1 F j + 1 F j R j + 1 R j · s o e t 1 , j , s , t , s
where Ξ U L = { q t ch , q t dis , q t cap , q t cap , q t , s a , q t , s a , s o e t , s , s o e t , j , s , Δ s o e t , s }.
Battery storage in objective function (1) draws benefits from three streams. The first part is the day-ahead market, where it performs energy arbitrage as a price taker. The battery storage can be either discharged, q t dis , or charged, q t ch , at the day-ahead market price λ t da . The second part is the capacity reservation market. Since this market is much smaller than the day-ahead market, battery storage is modeled as a price maker, i.e., the up and down capacity reservation prices λ t cap and λ t cap are dual variables whose values are decided in the lower-level problem considering the battery’s bids. The final part of the objective function (1) displays the benefits of both the up and down reserve activation q t , s a and q t , s a at prices λ t , s a and λ t , s a , respectively.
Constraints (2) and (3) limit the day-ahead charging and discharging power. The fact that the battery charging ability reduces with high state-of-energy values is considered by limiting the battery charging power in (2) by the maximum amount of energy the battery can charge in a single time-step, Δ s o e t , s , divided by the length of the time-step to convert energy to power. On the other hand, the discharging battery ability in (3) is constant regardless of the state-of-energy. Constraints (4) and (5) impose charging and discharging limits to down and up reserve bids so the charging and discharging battery capacity is not exceeded. Down reserve in (4) can be provided by increasing the charging power from the day-ahead stage (in this case q t ch is positive and q t dis is zero) or by reducing or fully stopping the discharging power from the day-ahead stage and possibly starting to charge instead (in this case q t ch is zero and q t dis is positive). Similarly, up reserve in (5) can be provided by reducing the day-ahead charging power and/or increasing the day-ahead discharging power. Equation (6) calculates the state-of-energy per each reserve activation scenario. Since q t ch and q t dis are power quantities, they are multiplied by an appropriate time step duration Δ t . Since the day-ahead market is on an hourly basis, q t ch and q t dis are multiplied by 1. The reserve activation quantities q t , s a and q t , s a are energy quantities, the same as the state-of-energy s o e t , s . Constraints (7) and (8) provide the lower and upper bounds on the battery state-of-energy considering the reserve activations per scenario and the bid reserve quantities. This ensures that regardless of the reserve activation scenarios the state-of-energy will remain within the given bounds. Constraints (9)–(11) calculate the amount of energy the battery can charge in a time-step, Δ s o e t , s . To describe the nonlinear battery charging curve, a piecewise approximation given in Figure 1 is used. This curve shows the amount of energy a lithium-ion battery can withdraw from the grid depending on its current state-of-energy. The given picewise linear approximation divides the state-of-energy in multiple segments, s o e t , j , s , constituting the actual battery state-of-energy s o e t , s . These segments are used in (11) to calculate the amount of energy the battery can charge in time period t. Further details on this procedure are available in [29].
The battery scheduling problem (1) is subject to the following lower-level problem (corresponding dual variables related to each constraint are listed after a colon):
Minimize Ξ LL t T i I C i cap · g t , i cap + C b , cap · q t cap + i I C i cap · g t , i cap + C b , cap · q t cap + t T s S π s · i I C i a · g t , i , s a + C b , a · q t , s a + i I C i a · g t , i , s a + C b , a · q t , s a
subject to:
i I g t , i cap + q t cap R t cap , t : λ t cap
i I g t , i , s a q t , s a + R t , s a = 0 , t , s : λ t , s a
g t , i cap G t , i , t , i : ψ t , i
g t , i , s a g t , i cap · Δ t , t , i , s : κ t , i , s
q t cap q ¯ t , t : ζ t
q t , s a q t cap · Δ t , t , s : ν t , s
g t , i , s a , g t , i , s a 0 , t , i , s : α t , i , s , α t , i , s
q t , s a , q t , s a 0 , t , s : β t , s , β t , s
g t , i cap , g t , i cap 0 , t , i : γ t , i , γ t , i
q t cap , q t cap 0 , t : δ t , δ t
where Ξ L L = { g t , i cap , g t , i cap , g t , i , s a , g t , i , s a , q t cap , q t cap , q t , s a , q t , s a }.
The lower-level problem objective function (12) is the maximization of the social welfare, which includes minimizing the cost of both generators’ and the battery’s up and down capacity reservation as well as its activation per scenario. Constraints (13) and (14) impose the up and down required reserve capacity volumes, while Equations (15) and (16) decide on the contribution of each asset (generators and the battery storage) to up and down reserve activation per scenario. Up and down generators’ cleared reserve capacities are restricted by their offered capacities in (17) and (18), while the generators’ activated quantities are limited by their reserved capacities in (19) and (20). The same is achieved for the battery with constraints (21)–(24). Finally, nonnegativity of the lower-level variables is imposed in (25)–(28). The dual variables listed after a colon in constraints (13)–(28) indicate if those constraints are binding or not. Dual variables of constraints (13)–(16) take values of marginal cost for up capacity reservation, down capacity reservation, up capacity activation and down capacity activation, respectively, and are used in the upper-level problem to determine the profitability of the battery storage operation. The remaining dual variables defined for constraints (17)–(28) indicate how much this constraint worsen the objective function. If the value of a dual variable is zero, this constraint does not affect the objective function value, i.e., it is not binding.
Problem (1)–(2) is a bilevel problem and cannot be solved directly. Thus, the lower-level problem needs to be replaced by its equivalent constraints. We use Karush–Kuhn–Tucker optimality conditions to convert the initial bilevel problem into a mixed-integer linear program (MILP). An interested reader may find details on this mathematical technique in [30].

3.3. KKT Conditions of the Lower-Level Problem

The dual objective function:
Maximize t T q ¯ t · ζ t t T q ¯ t · ζ t + t T R t cap · λ t cap + t T R t cap · λ t cap + t T s S R t , s a · λ t , s a + t T s S R t , s a · λ t , s a t T i I G t , i · ψ t , i t T i I G t , i · ψ t , i
Dual constraints and stationarity conditions:
s S κ t , i , s + C i cap λ t cap γ t , i + ψ t , i = 0 , t , i
π s · C i a λ t , s a α t , i , s + κ t , i , s = 0 , t , i , s
s S ν t , s δ t + ζ t λ t cap + C b , cap = 0 , t
β t , s λ t , s a + ν t , s + π s · C b , a = 0 , t , s
Complementarity slackness:
( i I g t , i cap q t cap + R t cap ) λ t cap , t
( g t , i cap G t , i ) ψ t , i , t , i
( g t , i cap · Δ t + g t , i , s a ) κ t , i , s , t , i , s
( q t cap q ¯ t ) ζ t , t
( q t cap · Δ t + q t , s a ) ν t , s , t , s
g t , i , s a α t , i , s , t , i , s
q t , s a β t , s , t , s
g t , i cap γ t , i , t , i
q t cap δ t , t
q t cap δ t , t
where all dual variables are nonnegative, but λ t , s a and λ t , s a , which are unrestricted.
The equivalent mixed-integer nonlinear program is (1), (30)–(55). The nonlinearity comes from multiplications of the upper-level variables (cleared battery-related quantities) and lower-level dual variables representing up and down reserve capacity reservation and activation. These are linearized using some of the KKT conditions and the strong duality equation as follows. First, the term λ t cap · q t cap is rewritten using KKT condition (34):
λ t cap · q t cap = s S ν t , s · q t cap δ t · q t cap + ζ t · q t cap + C b , cap · q t cap
Considering (46) and (54), Equation (56) is equal to:
λ t cap · q t cap = s S ν t , s · q t , s a + ζ t · q t cap + C b , cap · q t cap
In a similar way, using (35), (47) and (55), we obtain the following equivalence:
λ t cap · q t cap = s S ν t , s · q t , s a + ζ t · q t cap + C b , cap · q t cap
The term related to up reserve activation can be rewritten using (36):
λ t , s a · q t , s a = β t , s · q t , s a + ν t , s · q t , s a + π s · C b , a · q t , s a
where β t , s · q t , s a = 0 follows directly from (50). In a similar fashion, using (37) and (51) we obtain:
λ t , s a · q t , s a = ν t , s · q t , s a + π s · C b , a · q t , s a
Finally, combining the obtained equalities (57)–(60) with the strong duality equality (The strong duality theorem states that, under certain conditions which are satisfied for linear optimization problems such as the one at hand, optimal solutions to the primal and the associated dual problem yield the same objective value [30].) (12) = (29), we obtain the following linear objective function of the upper-level problem:
Maximize Ξ UL t T λ t da ( q t dis q t ch ) + C b , cap · q t cap + C b , cap · q t cap + s S π s · C b , a · q t , s a + π s · C b , a · q t , s a i I C i cap · g t , i cap + C b , cap · q t cap + i I C i cap · g t , i cap + C b , cap · q t cap s S π s · i I C i a · g t , i , s a + C b , a · q t , s a + i I C i a · g t , i , s a + C b , a · q t , s a + R t cap · λ t cap + R t cap · λ t cap + s S R t , s a · λ t , s a + s S R t , s a · λ t , s a i I G t , i · ψ t , i i I G t , i · ψ t , i
The final MILP formulation is (61) subject to constraints (2)–(11), (13)–(28), (30)–(55), where the orthogonal constraints (38)–(55) are easily linearized using the big M method.

4. Case Study

4.1. Input Data

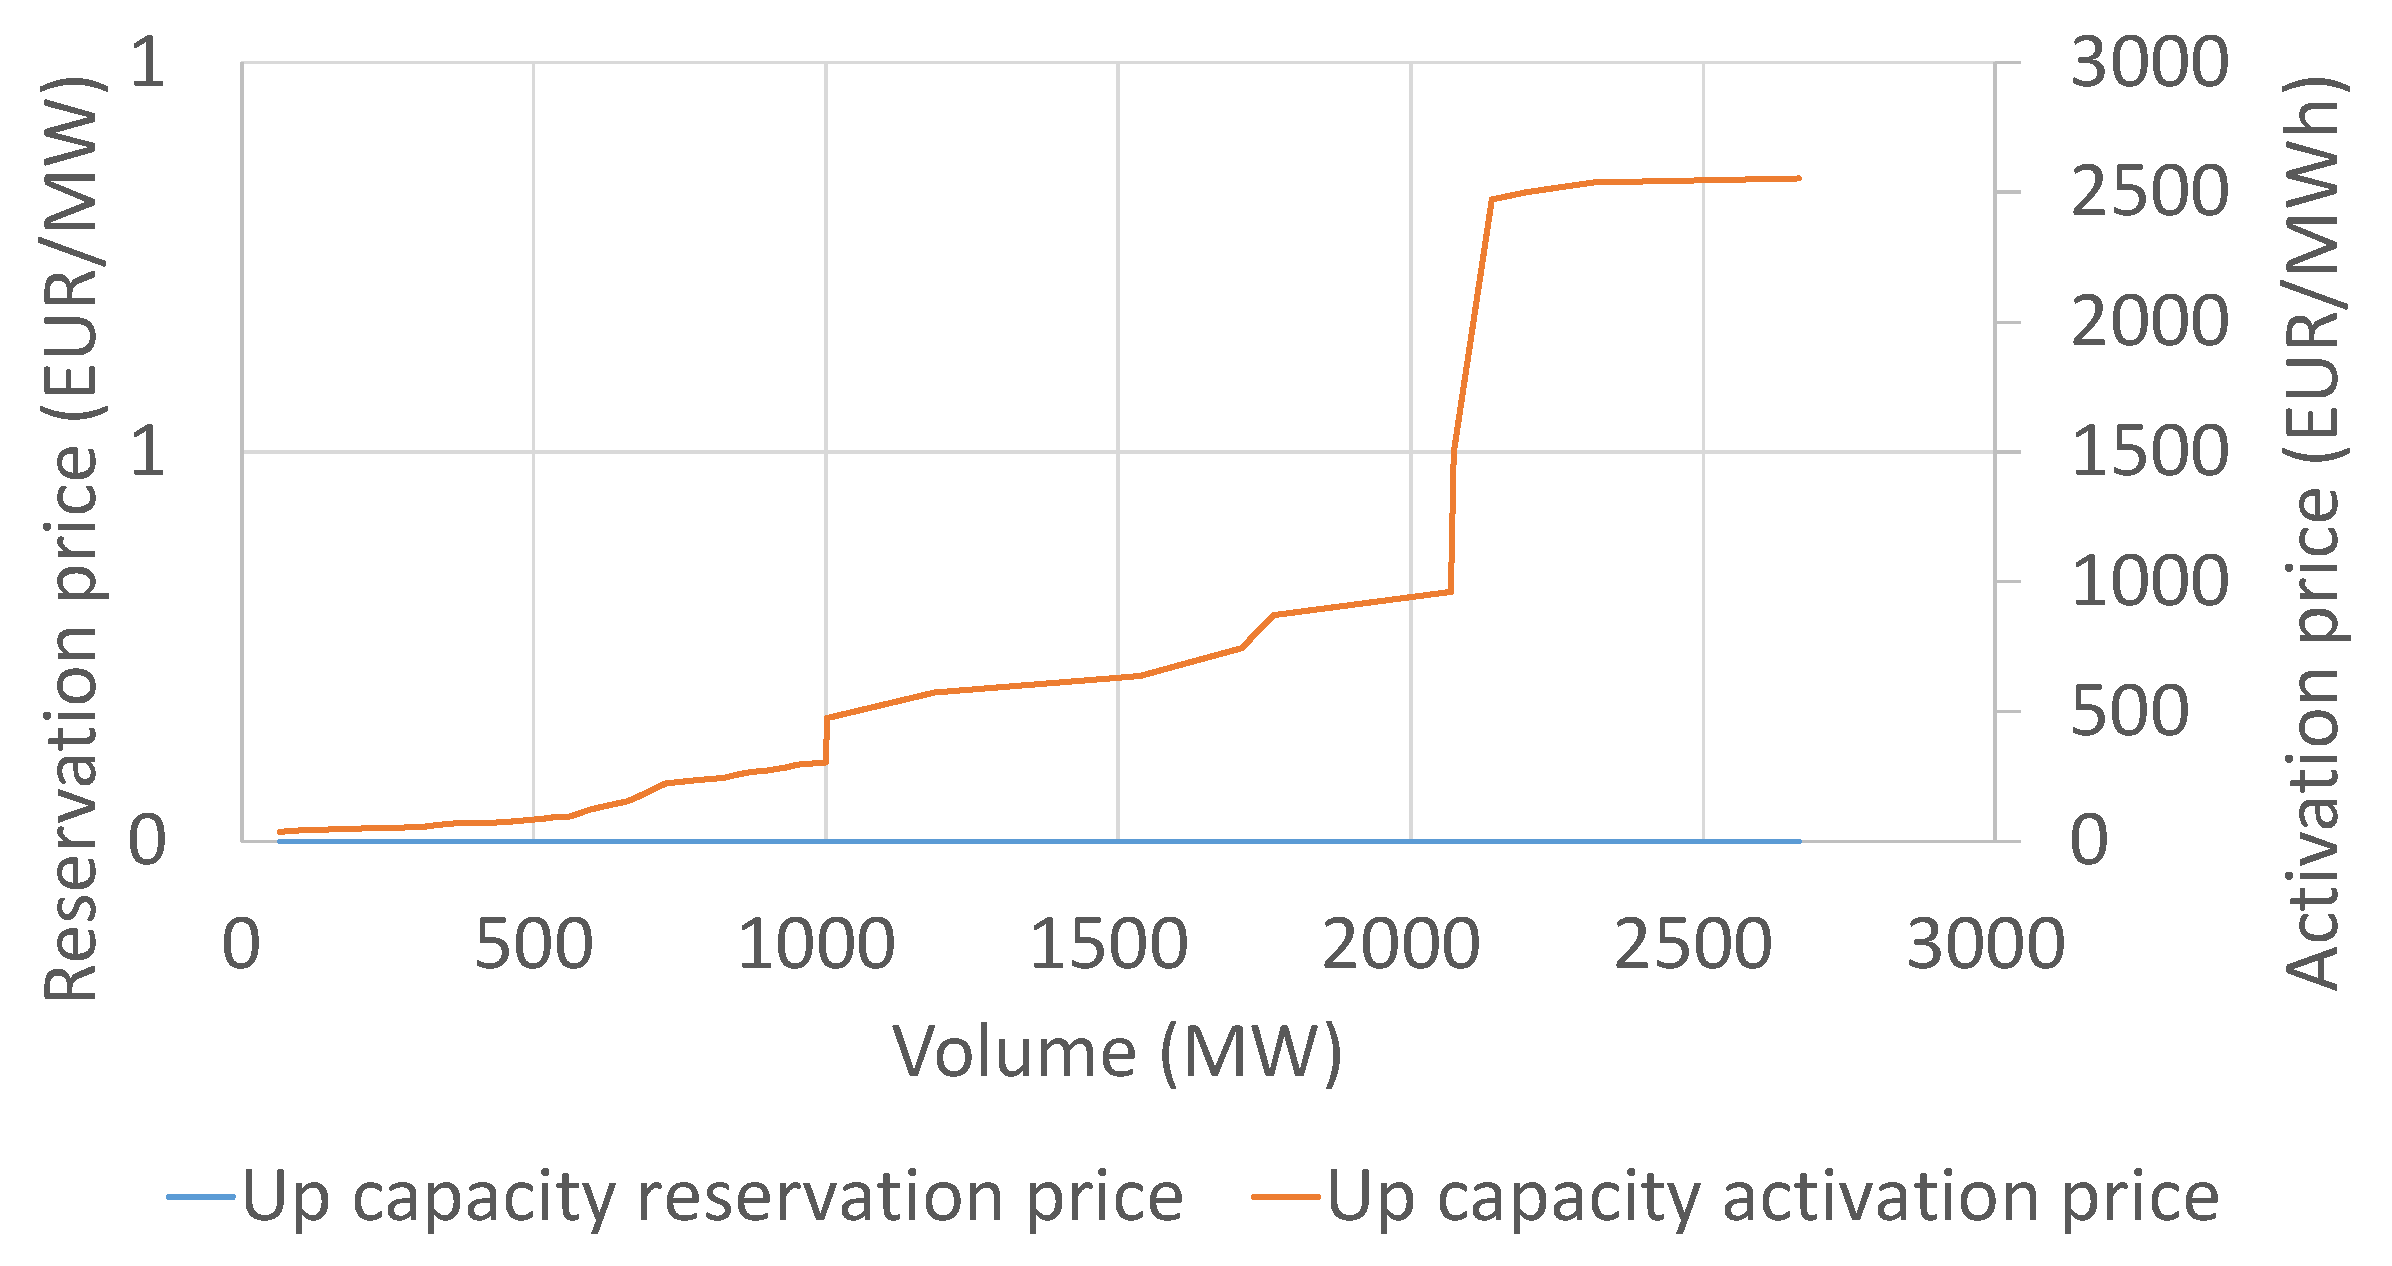
The proposed model is tested on real data streaming from 1 May 2020. The day-ahead market prices, shown in Table 1 were taken from the German electricity exchange—EPEX, while the capacity and energy bids were gathered from an online German platform for balancing reserves auctions—Regelleistung.net. The former dataset is a series of 24 day-ahead prices, while the latter dataset for automatic frequency restoration reserve (for up and down reserve separately) consists of six 4-h periods, each of them including the following: total aFRR up/down volume and series of volume–price pairs (capacity price–capacity volume–energy price). The first stage in the auction is arranging the capacity price–capacity volume pairs in an ascending order by price, where all bids up to the total required volume (shown in Table 2) are accepted. Energy prices are used in the second stage in real-time when the TSO activates the accepted reserve providers. It arranges energy price–capacity volume pairs in an ascending order by price and all the bids up to total required energy are activated. For each 4-h period there are up to several hundred bids and many of them are identical both in terms of capacity and energy prices. To ease the computational efforts, we clustered similar ones and obtained between 30 and 90 total bids per timestep. Figure 2 shows the up reserve bids of the generators in the system. All the generators bid up a capacity reservation at zero €/MW (flat blue line), while the up reservation activation bids range from 36 to 2550 €/MWh (orange curve shows the activation bids sorted in ascending order). Figure 3 shows the down reserve bids of the generators in the system. As opposed to the up reserve, the down reserve capacity price is zero only for app. 500 €/MW, while the price of reservation of the remaining down reserve volume increases up to 8.6 €/MW (monotonically increasing blue curve). The corresponding activation prices are indicated with the orange curve. To minimize the operating cost (12), the system operator will activate the cheapest down reserve, i.e., the lowest values of the orange curve.
The data used to test and validate our model is taken from the German auction (www.regelleistung.net) and power system websites (www.smard.de) to accurately define one arbitrary chosen day. For the bids, real data for this specific day accounted for, on average, 283 and 333 bids over all bidding periods for the up and down reserve, respectively. In total in one day, there were 3697 bids for both up and down reserve during all bidding periods. A large number of those bids had the same values for both capacity and energy price or had the same number for one of those features and very similar for the other. To relieve the computational burden, but preserve the same level of accuracy, we aggregated those similar bids (in both features) and obtained on average 64 and 72 bids over all biding periods for the up and down reserve, respectively. This is in total 818 bids in one day for both up and down reserve during all bidding periods. This is still a very high number of bids even though the number of modeled bids was decreased by 88%. However, the accuracy of the case study remained untouched. When it comes to scenarios of activated aFRR, we used 10 scenarios as it is a sufficient number to validate the stochastic nature of the activation. Further increase in the number of scenarios would reduce computational efficiency for very low gains in the captured uncertainty.
Energy prices are used in the second stage in real-time when the TSO activates the accepted reserve providers. It arranges energy price–capacity volume pairs in an ascending order by price and all the bids up to total required energy are activated.
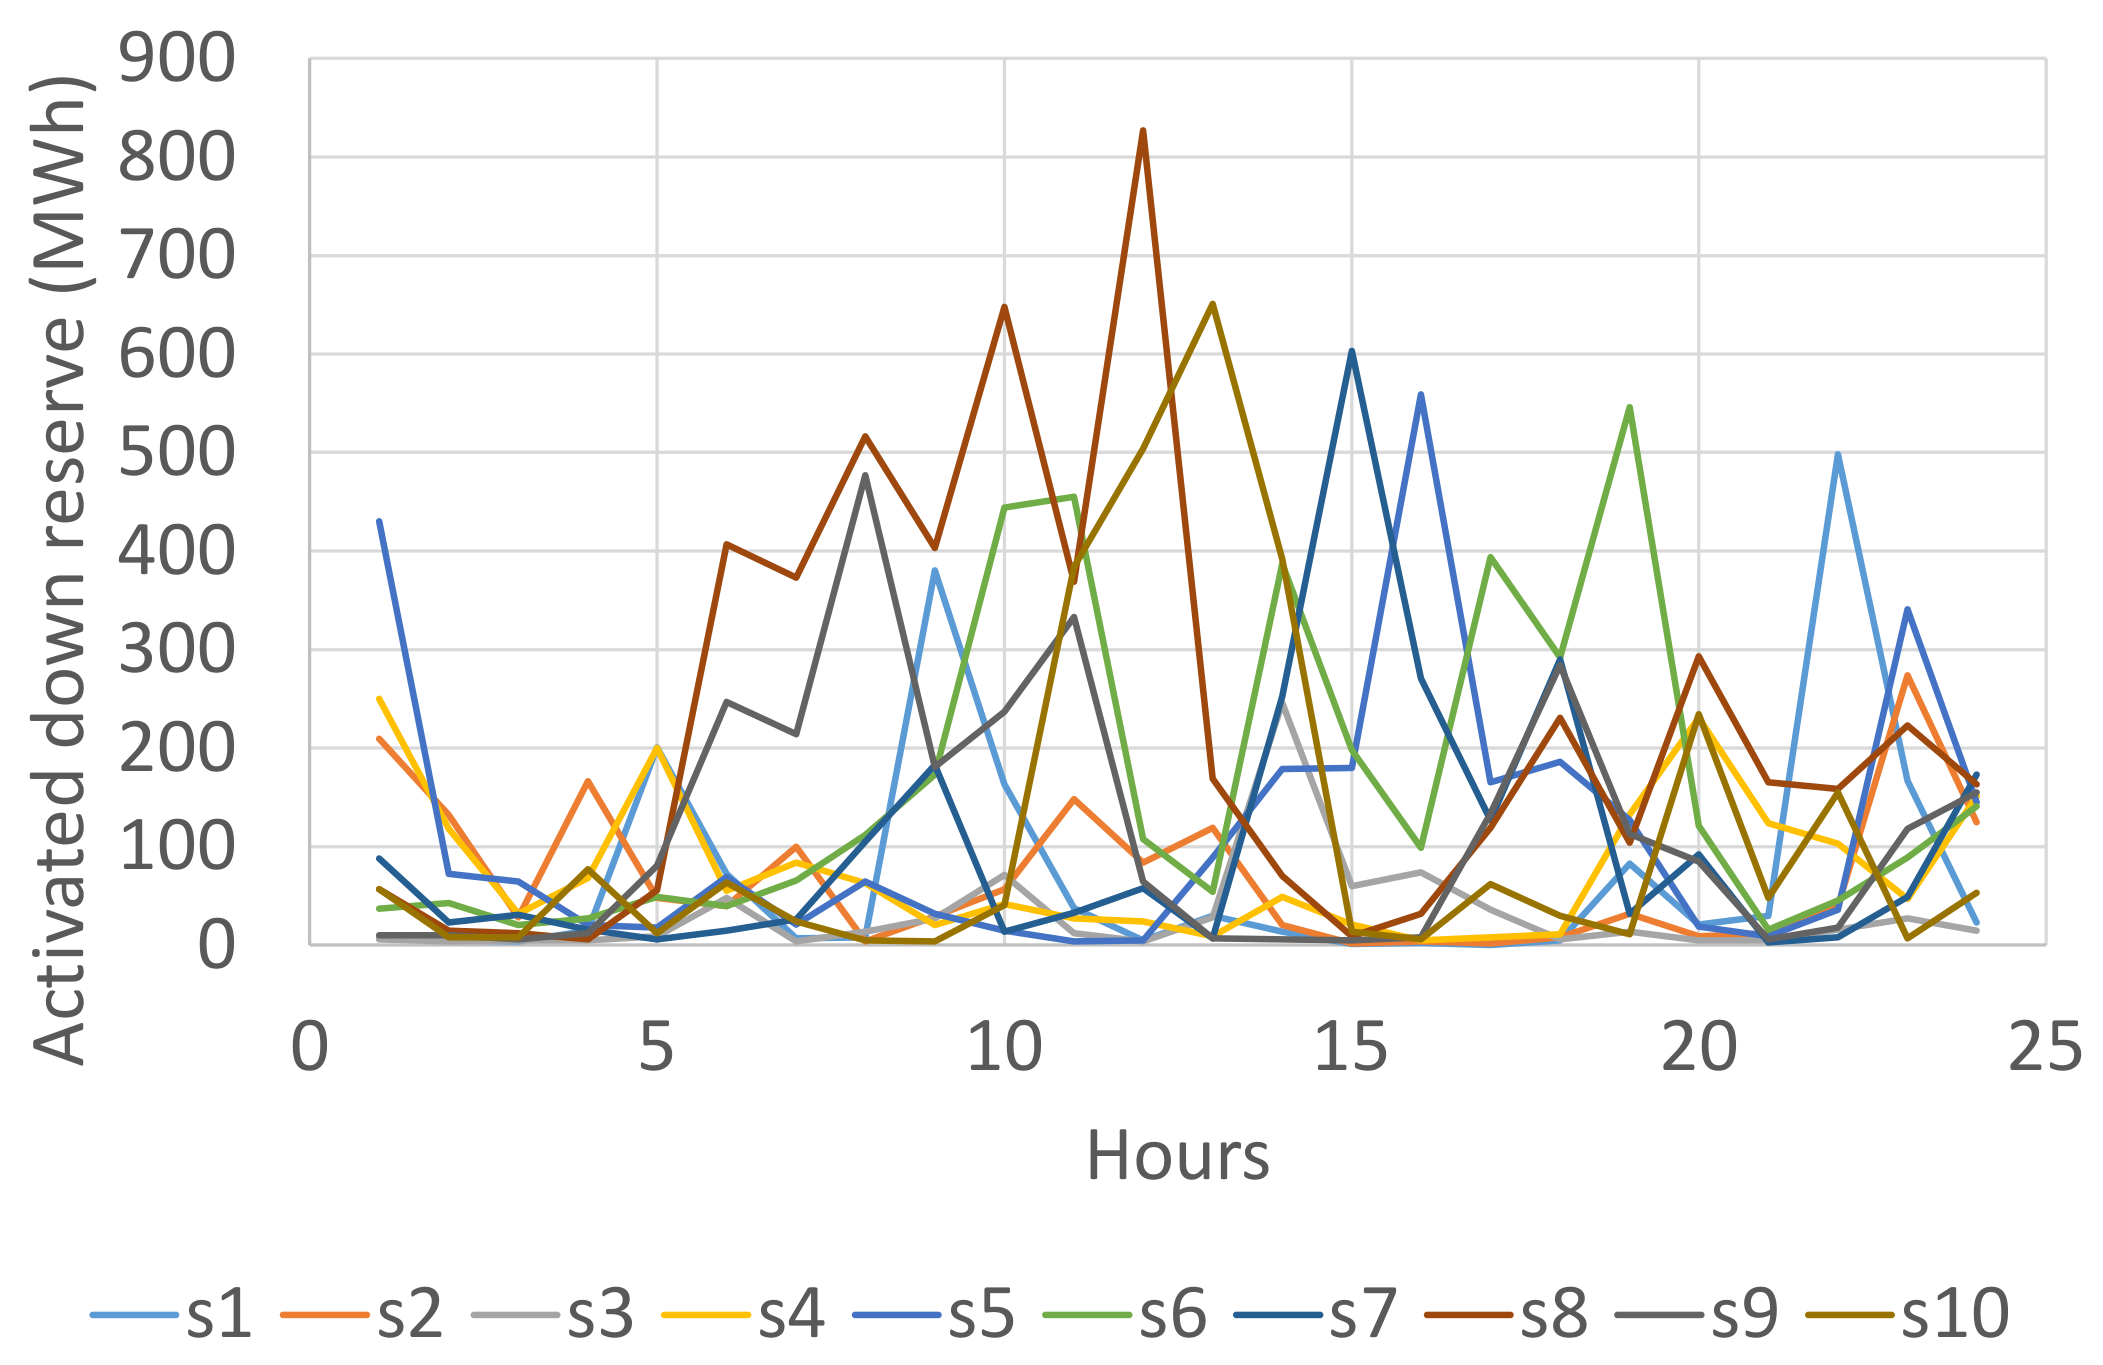
A strategic battery storage (energy capacity 50 MWh; power capacity 50 MW; charging efficiency 1; discharging efficiency 0.82) is then added to the mentioned merit order lists. The system operator in the second stage of the reserve allocation process takes the energy bids, arranges them by price (ascending for up reserve, and descending for down reserve) and activates them one by one until satisfying the balancing energy request at a specific moment. The request for the total activated energy is modeled as an uncertain parameter through scenarios. In the case study, we used the quarter-hour activated aFRR balancing energies taken from the German electricity data transparency platform www.smard.de. The quarter-hours were summarized to an hourly resolution to match the hourly resolution of our model. Note that the same data was also used in papers [27,28]. The data for ten days streaming form May 1 to 10 May 2020 were taken as ten scenarios in our case study. The up and down reserve activation data are shown in Figure 4 and Figure 5. To elaborate, each historical day (with all its hourly values) is shown as one scenario with a probability of 10%. The figures indicate a quite low activated volume, rarely surpassing 400 MWh, as compared to the reserved quantities from Table 2. Those scenarios affect our model results twofold: through the amount of activated reserve and through the price cleared for the activated reserve. In the case of batteries, the amount of activated reserve is relevant for securing a feasible state-of-energy evolution through time. It means that the state-of-energy boundaries will be satisfied regardless of which scenarios are actually realized. The price of activated reserves affects the profitability of reserve provision. The price maker models can be created in a way that their forecasted price is dependent on the activation scenarios as well, but they can not take into account the effect of the battery on the aFRR activated energy price formation.
In the results of the case study, presented in the following subsection, we first analyze the results of the battery storage placing all four of its bids, i.e., up reserve capacity, down reserve capacity, up reserve activation and down reserve activation, at zero price. Note that, due to the marginal pricing, the battery storage will receive the marginal price that can only be better or equal to the one it bid price. After this analysis, we provide a sensitivity analysis with different values that the battery storage bids for the up reserve capacity, down reserve capacity, up reserve activation and down reserve activation.

4.2. Results

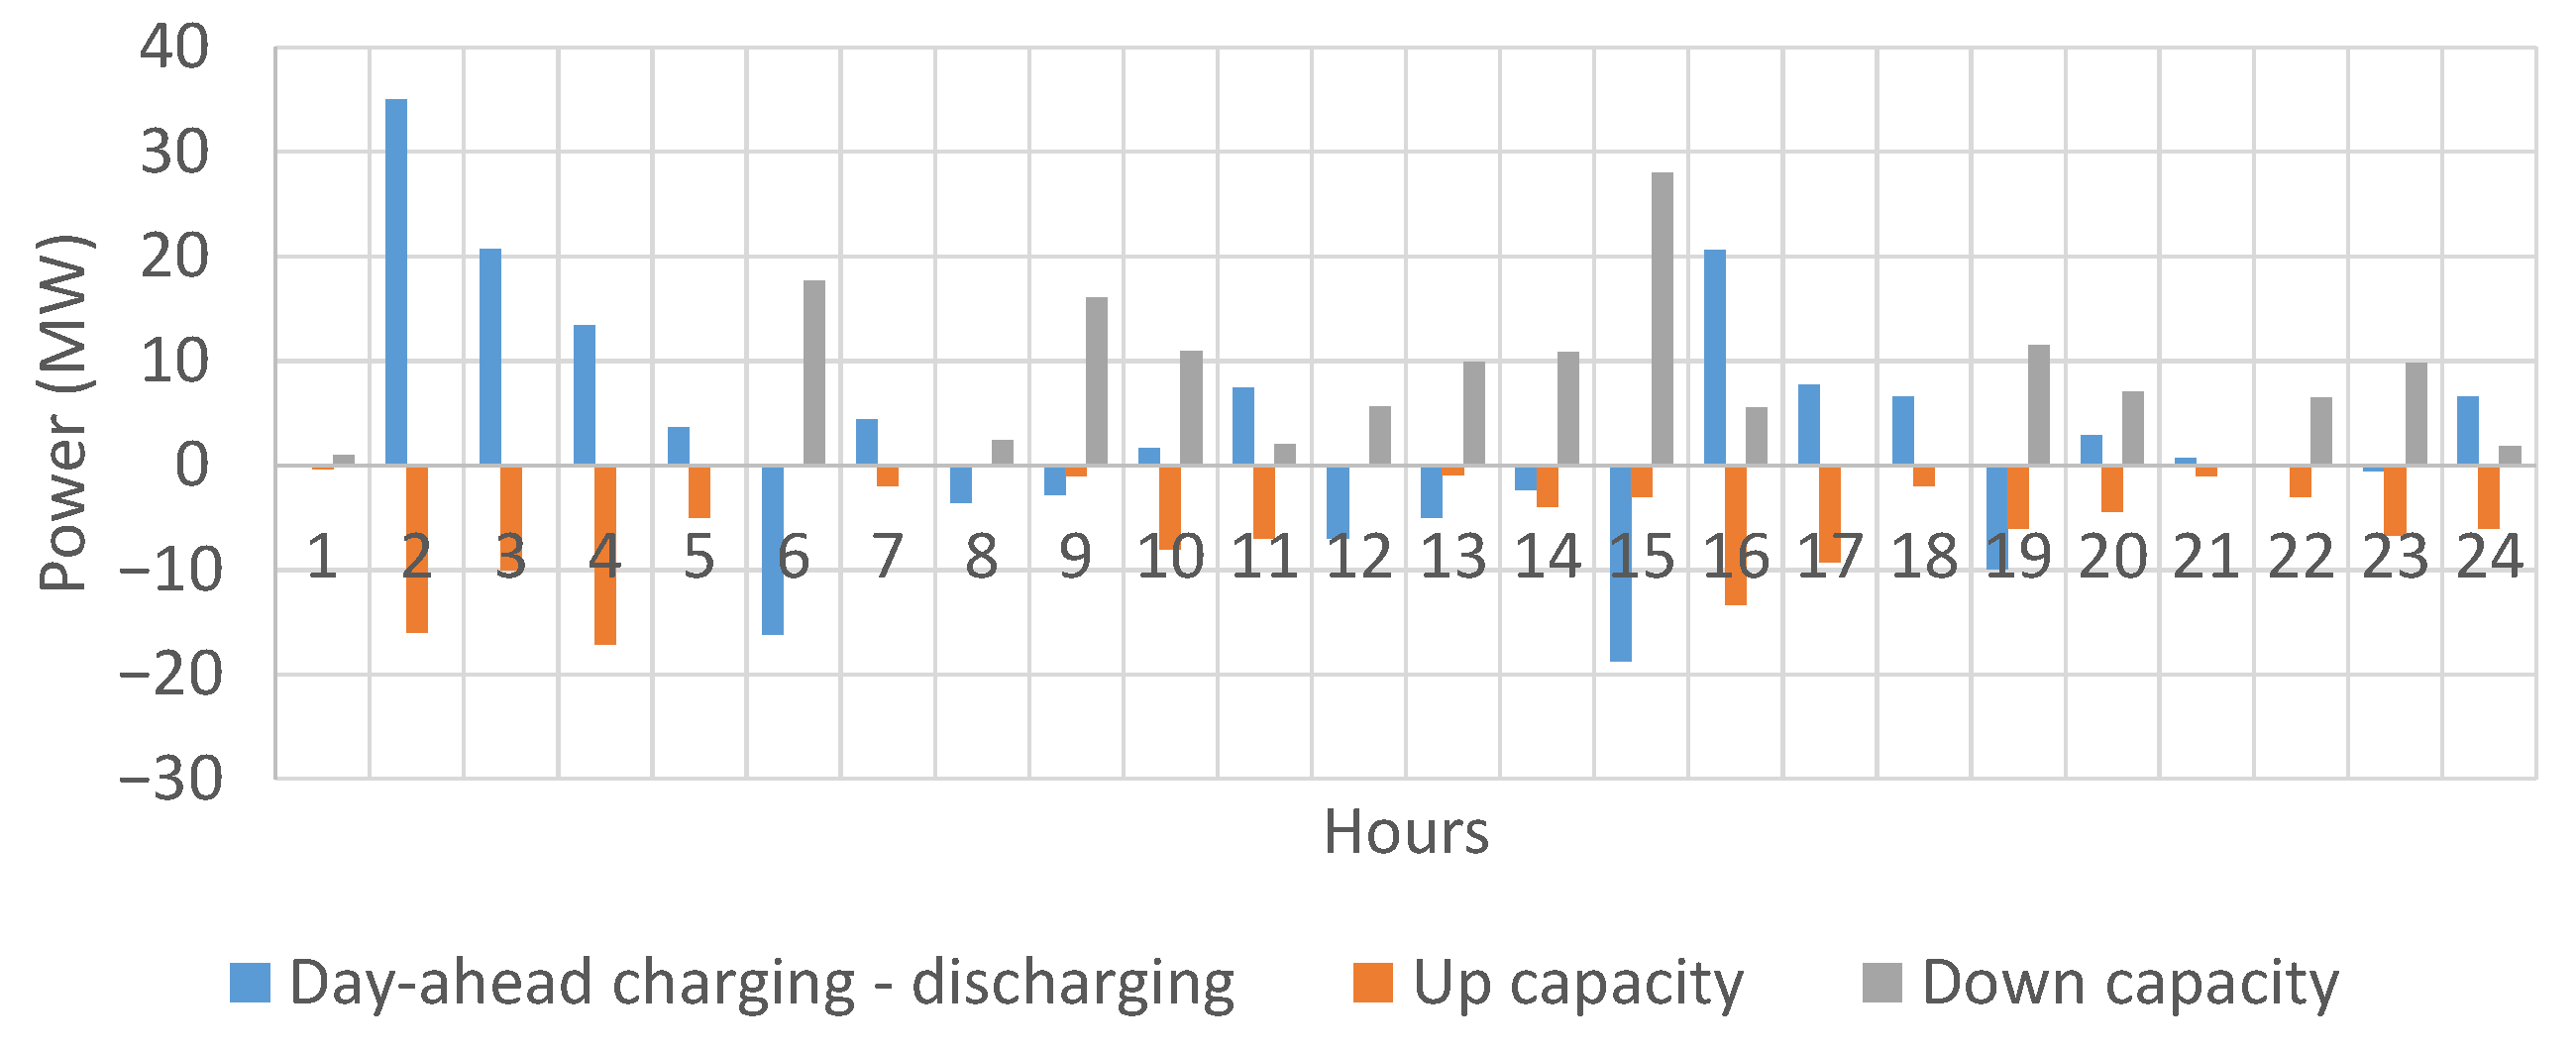
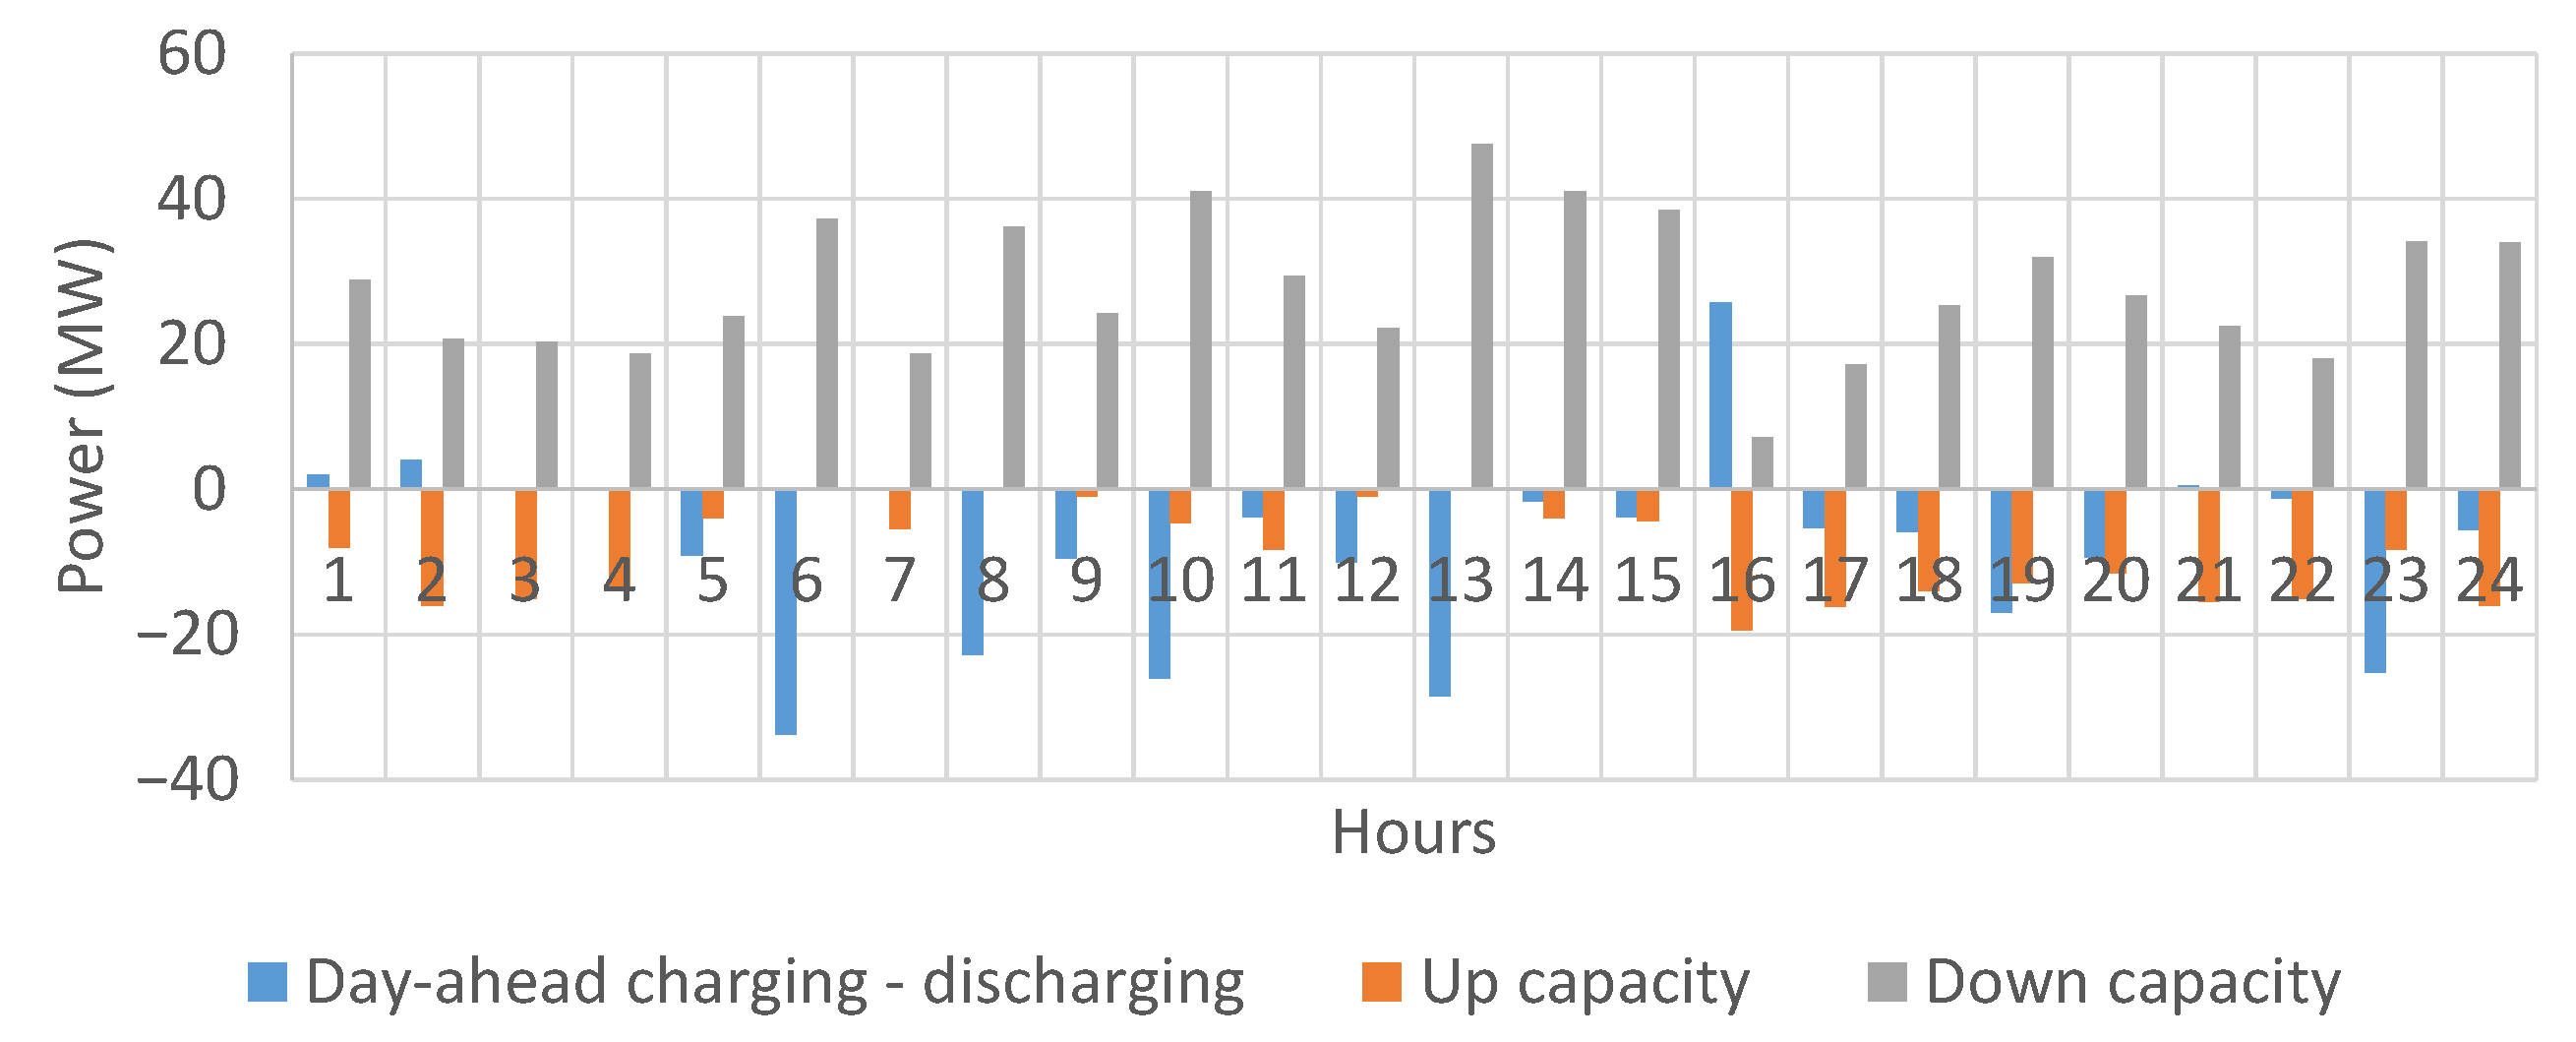
The maximum profit battery storage can achieve using the given input data is €22,171.61. While the revenue from providing down reserve capacity is quite high, €6724.47, the revenue from providing up reserve capacity is much lower, €21.03. On the other hand, the activation revenues are similar, €8506.66 for up reserve and €7291.02 for down reserve. The revenue in the day-ahead market is negative €371.57, as the battery storage primarily uses it to charge the energy later used for reserve activation. Figure 6 shows the battery storage day-ahead schedule along with the cleared up and down reserve capacities. Positive values represent the battery charging process, while negative ones the battery discharging process. In the day-ahead market, the battery storage generally charges during the night hours. It occasionally discharges (during hours 6, 8, 9, 12–15 and 19), but never over 18 MW. Provision of up reserve capacity (when activated, the battery discharges), never breaks 18 MW neither. It is significantly lower in volume than the down reserve capacity provision, which reaches 28 MW in hour 15. In some hours, e.g., 15, the system operator reserved both up and down reserve capacity from the battery. The activated amounts will differ based on the reserve activation scenario. For a more detailed explanation of the energy storage reserve activation please consult section 2.2 in [31].
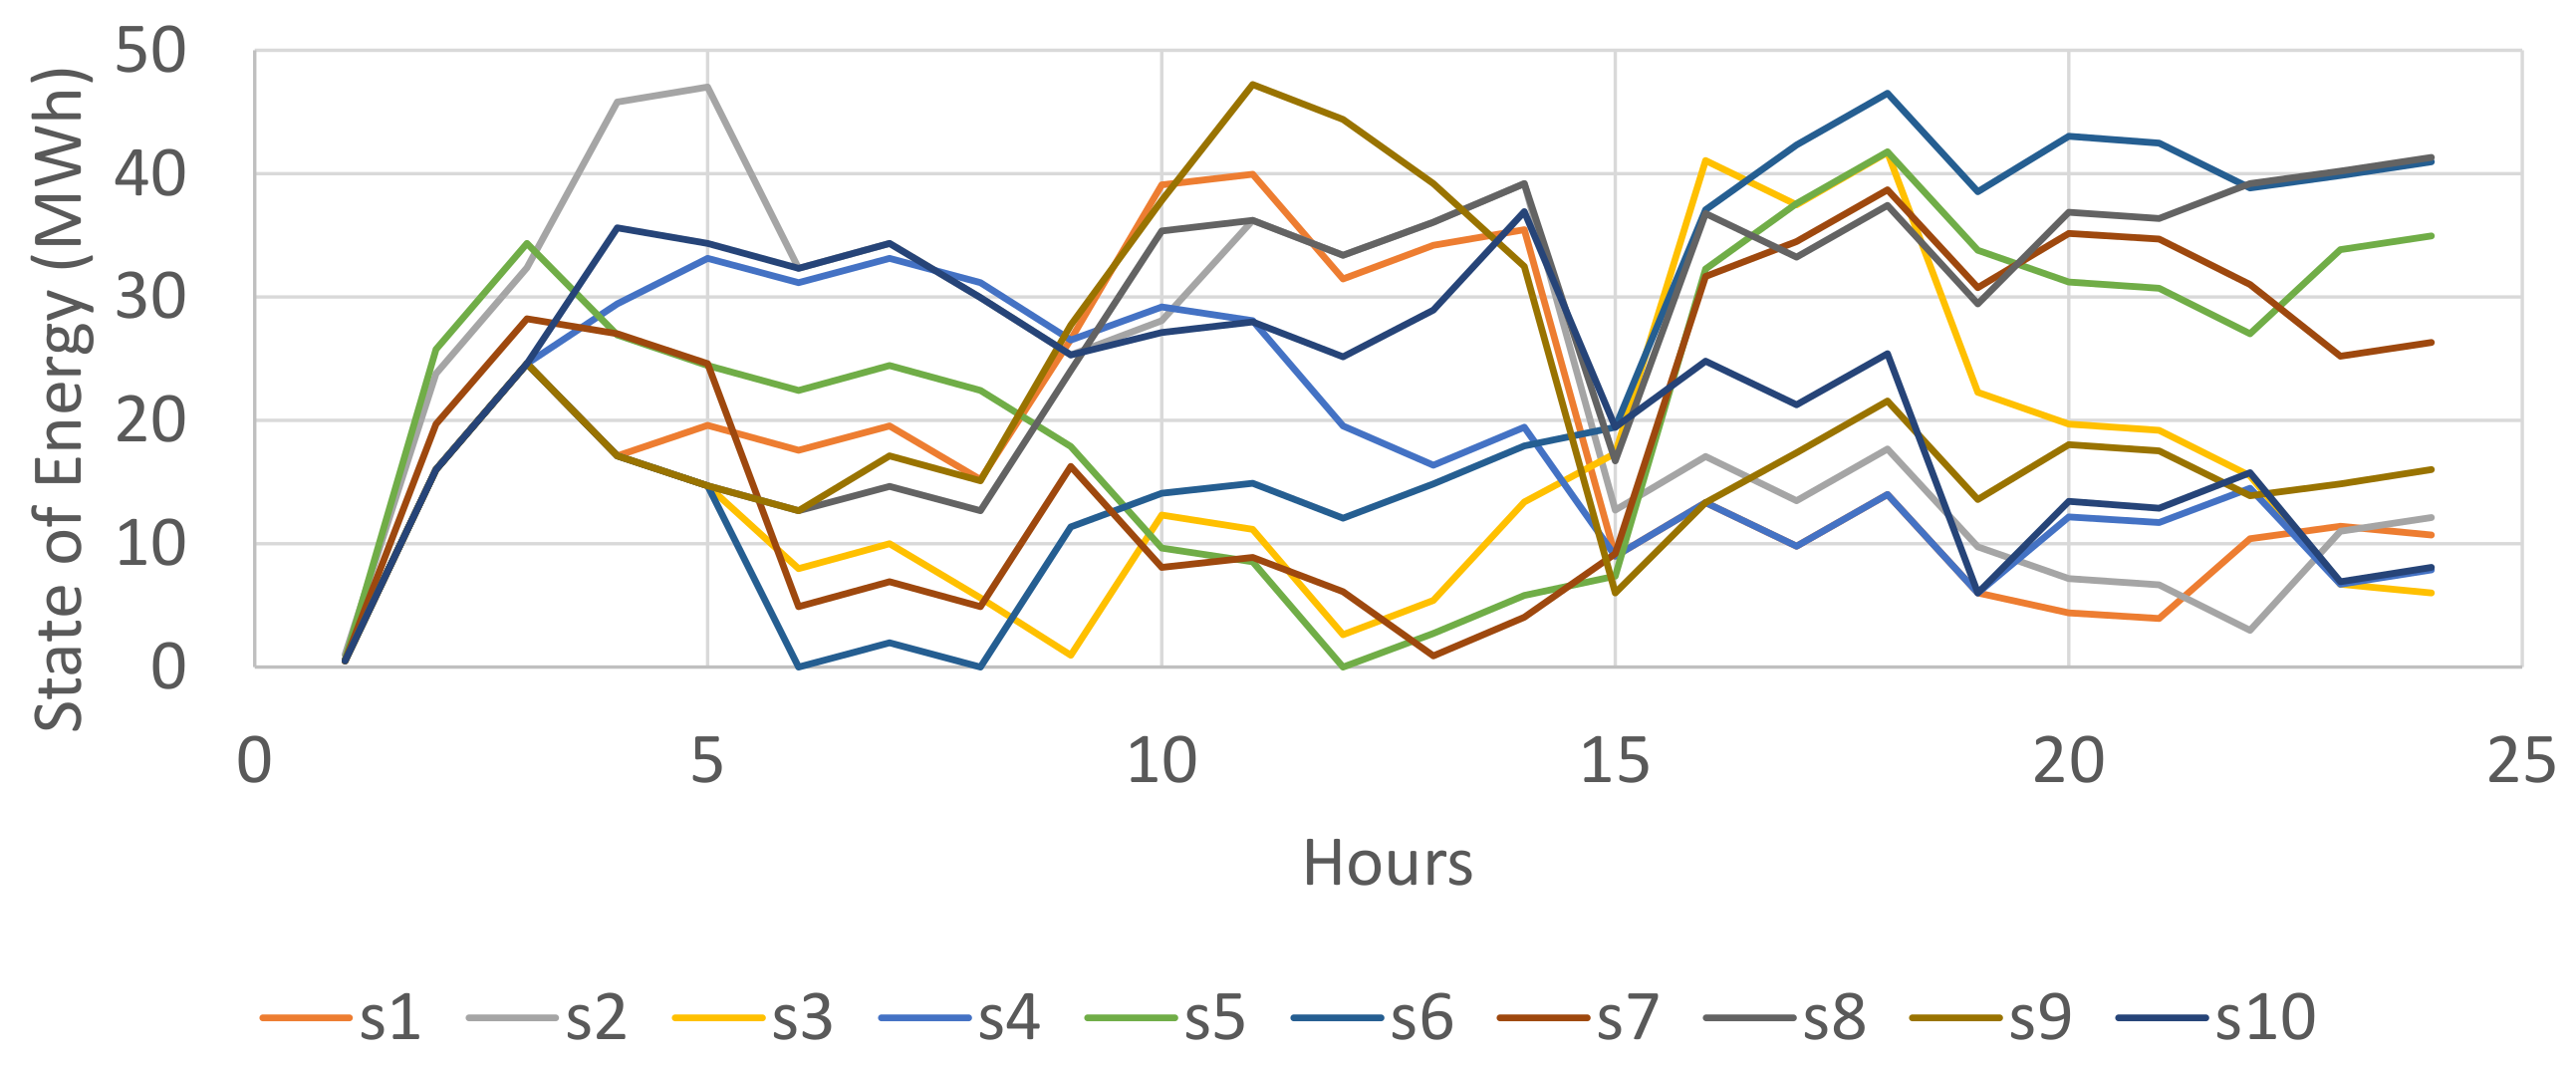
Figure 7 shows the propagation of the battery storage state-of-energy throughout the day for each scenario. Although the day-ahead schedule is the same, the activation direction (up or down) and the amount of activated reserve differs. For instance, in the 15-th hour, the battery storage reserves both up (3 MW) and down (28 MW) capacity. In scenario 3 we have 28 MW activated in the down direction and 1 MW in the up direction, while scenario 7 does not activate any up reserve, but activates 28 MW of down reserve. Since the modeled reserve is aFRR (15-minutes duration), a scenario can have activated both up and down reserve in the same hour (detailed visualization is available in Figure 8 and Figure 9). In all scenarios, the battery storage is quite depleted in hour 15 and charges at 20.6 MW in the day-ahead market in hour 16. In the same hour, five out of ten scenarios provide 5.5 MW of down reserve (compare to Figure 6), enabling the battery storage to further charge in those scenarios (this is seen in Figure 7 as the ensemble of five scenarios with higher values of state-of-energy in hour 16). On the other hand, in the remaining five scenarios the battery activates 13.3 MW of up reserve, which reduces the charging effect from the day-ahead market, and consequently the battery receives less overall charge in those scenarios (this is seen in Figure 7 as the ensemble of five scenarios with lower values of state-of-energy in hour 16). Figure 7 is also useful to illustrate that the ending state-of-energy is highly dependent on the reserve activation scenario and ranges from 6 MWh for scenario 3 to 41.3 MWh for scenario 8.
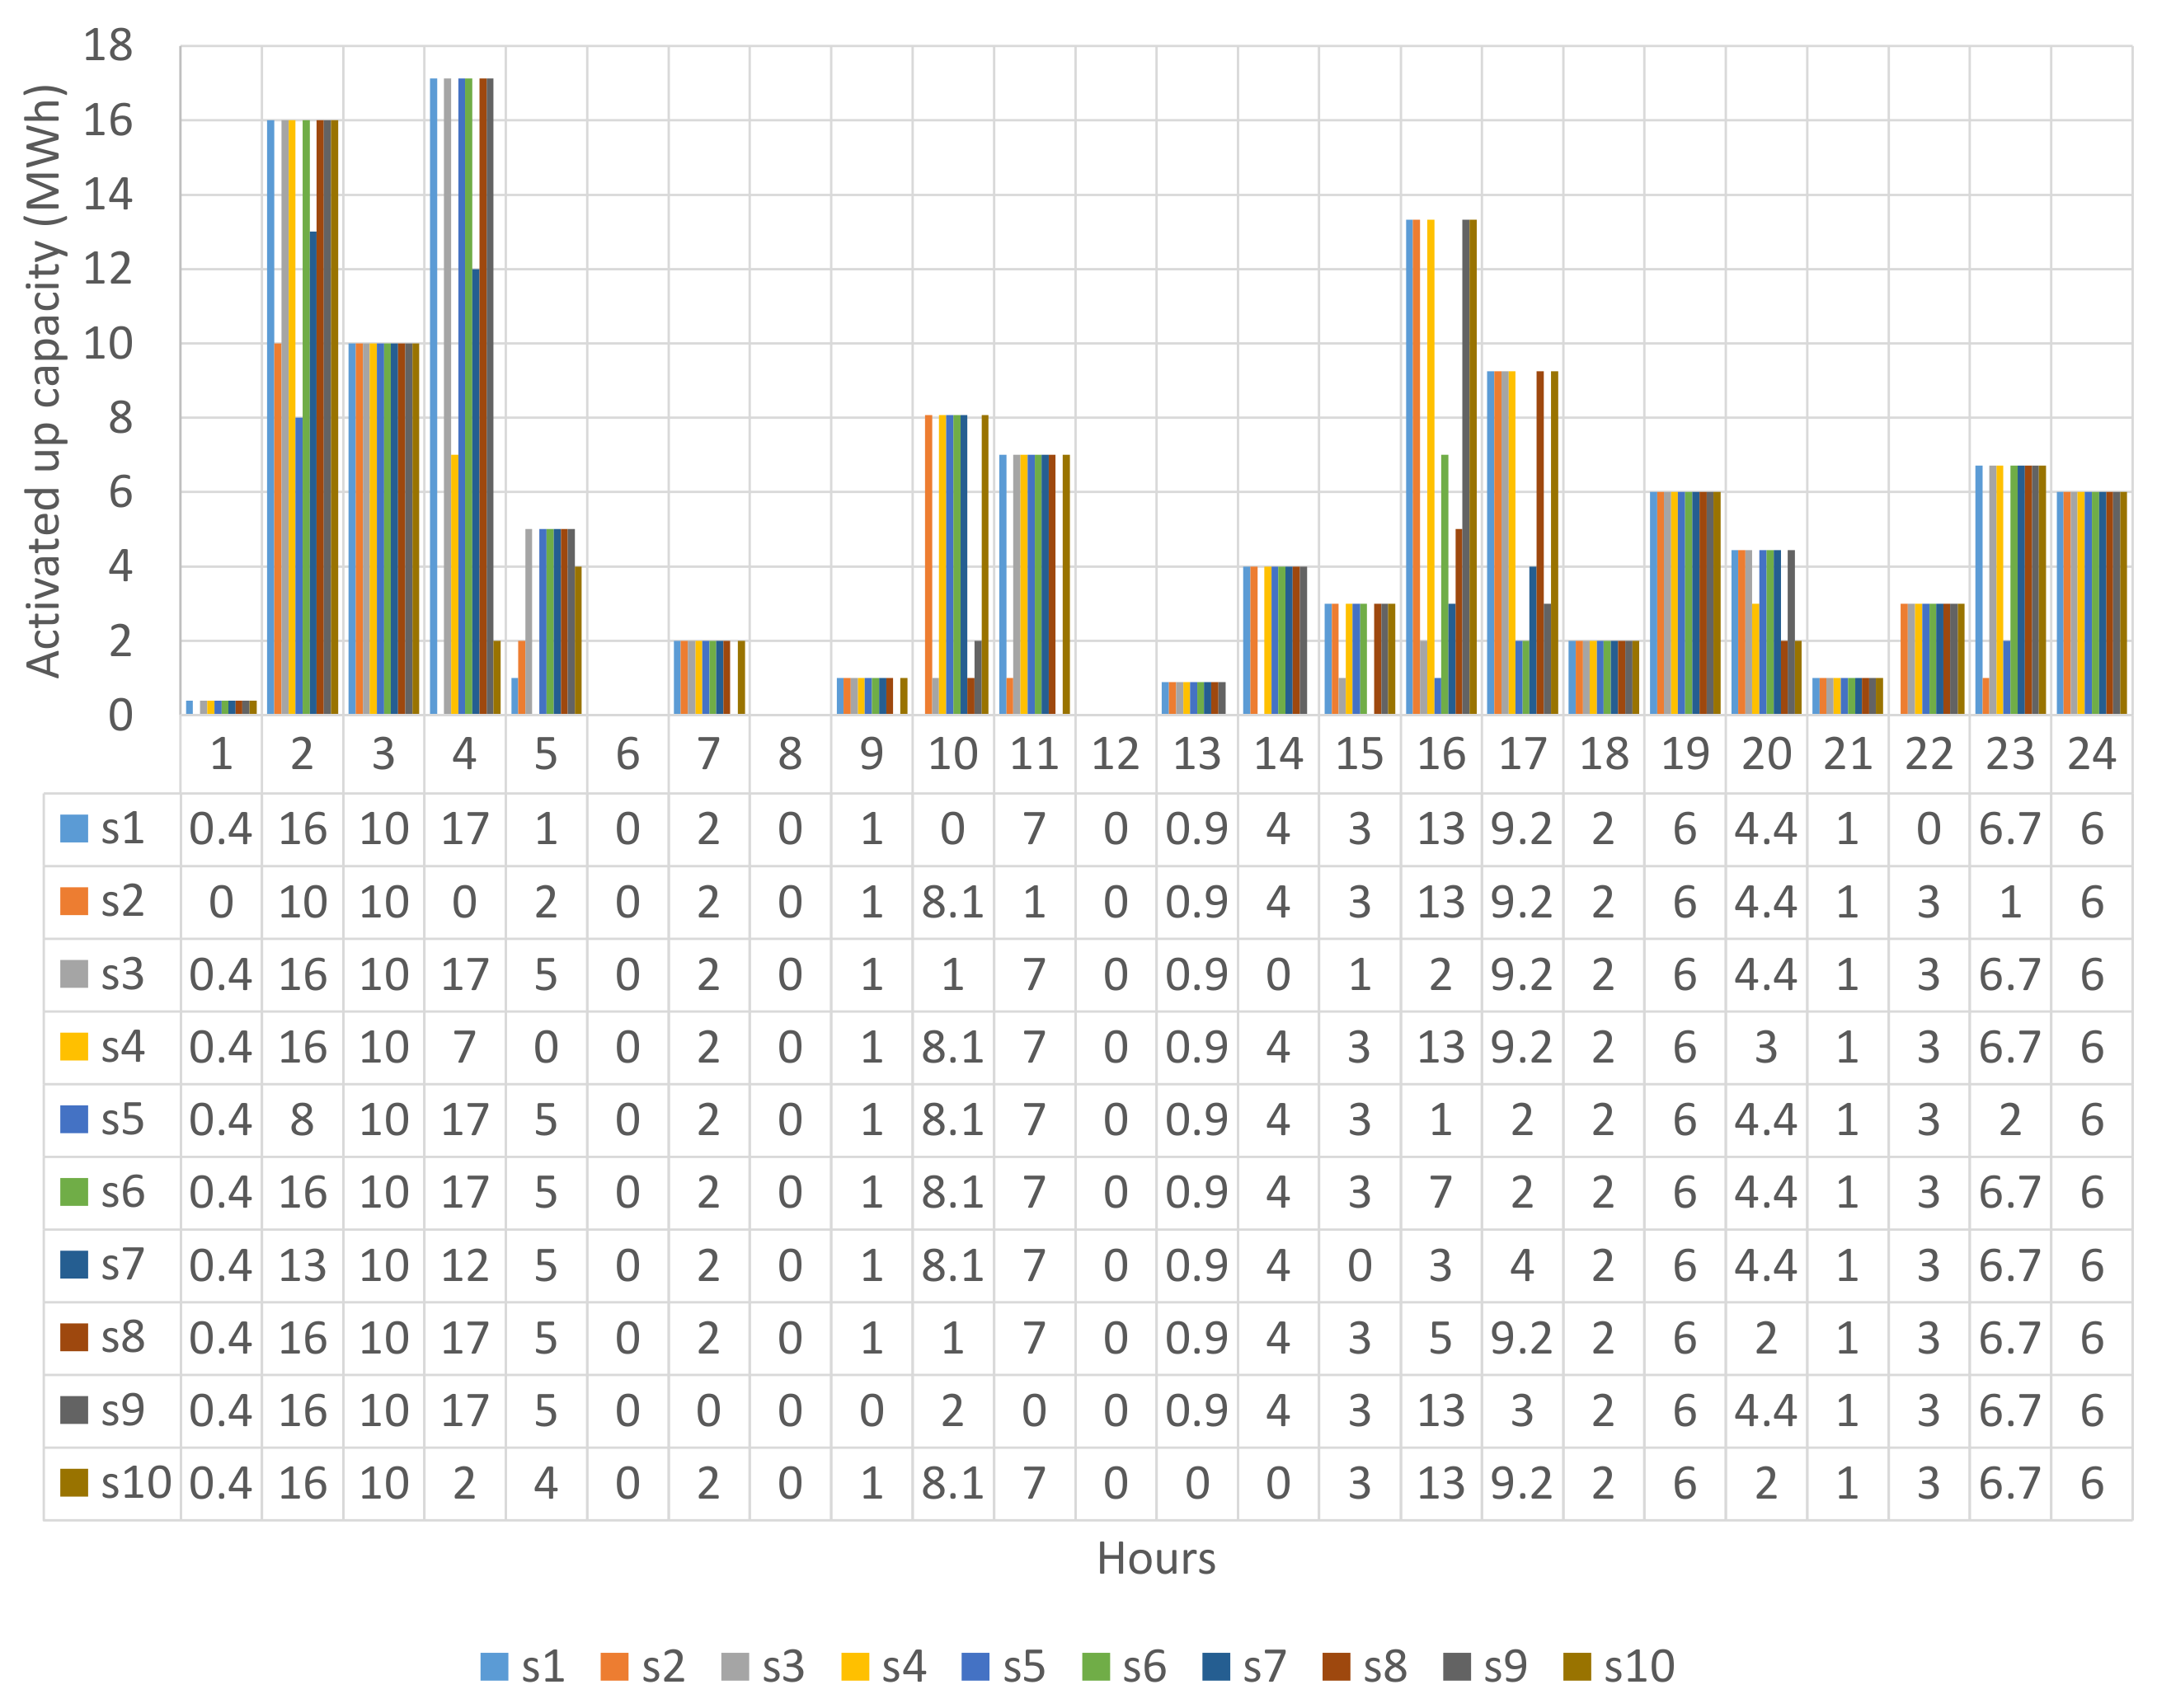
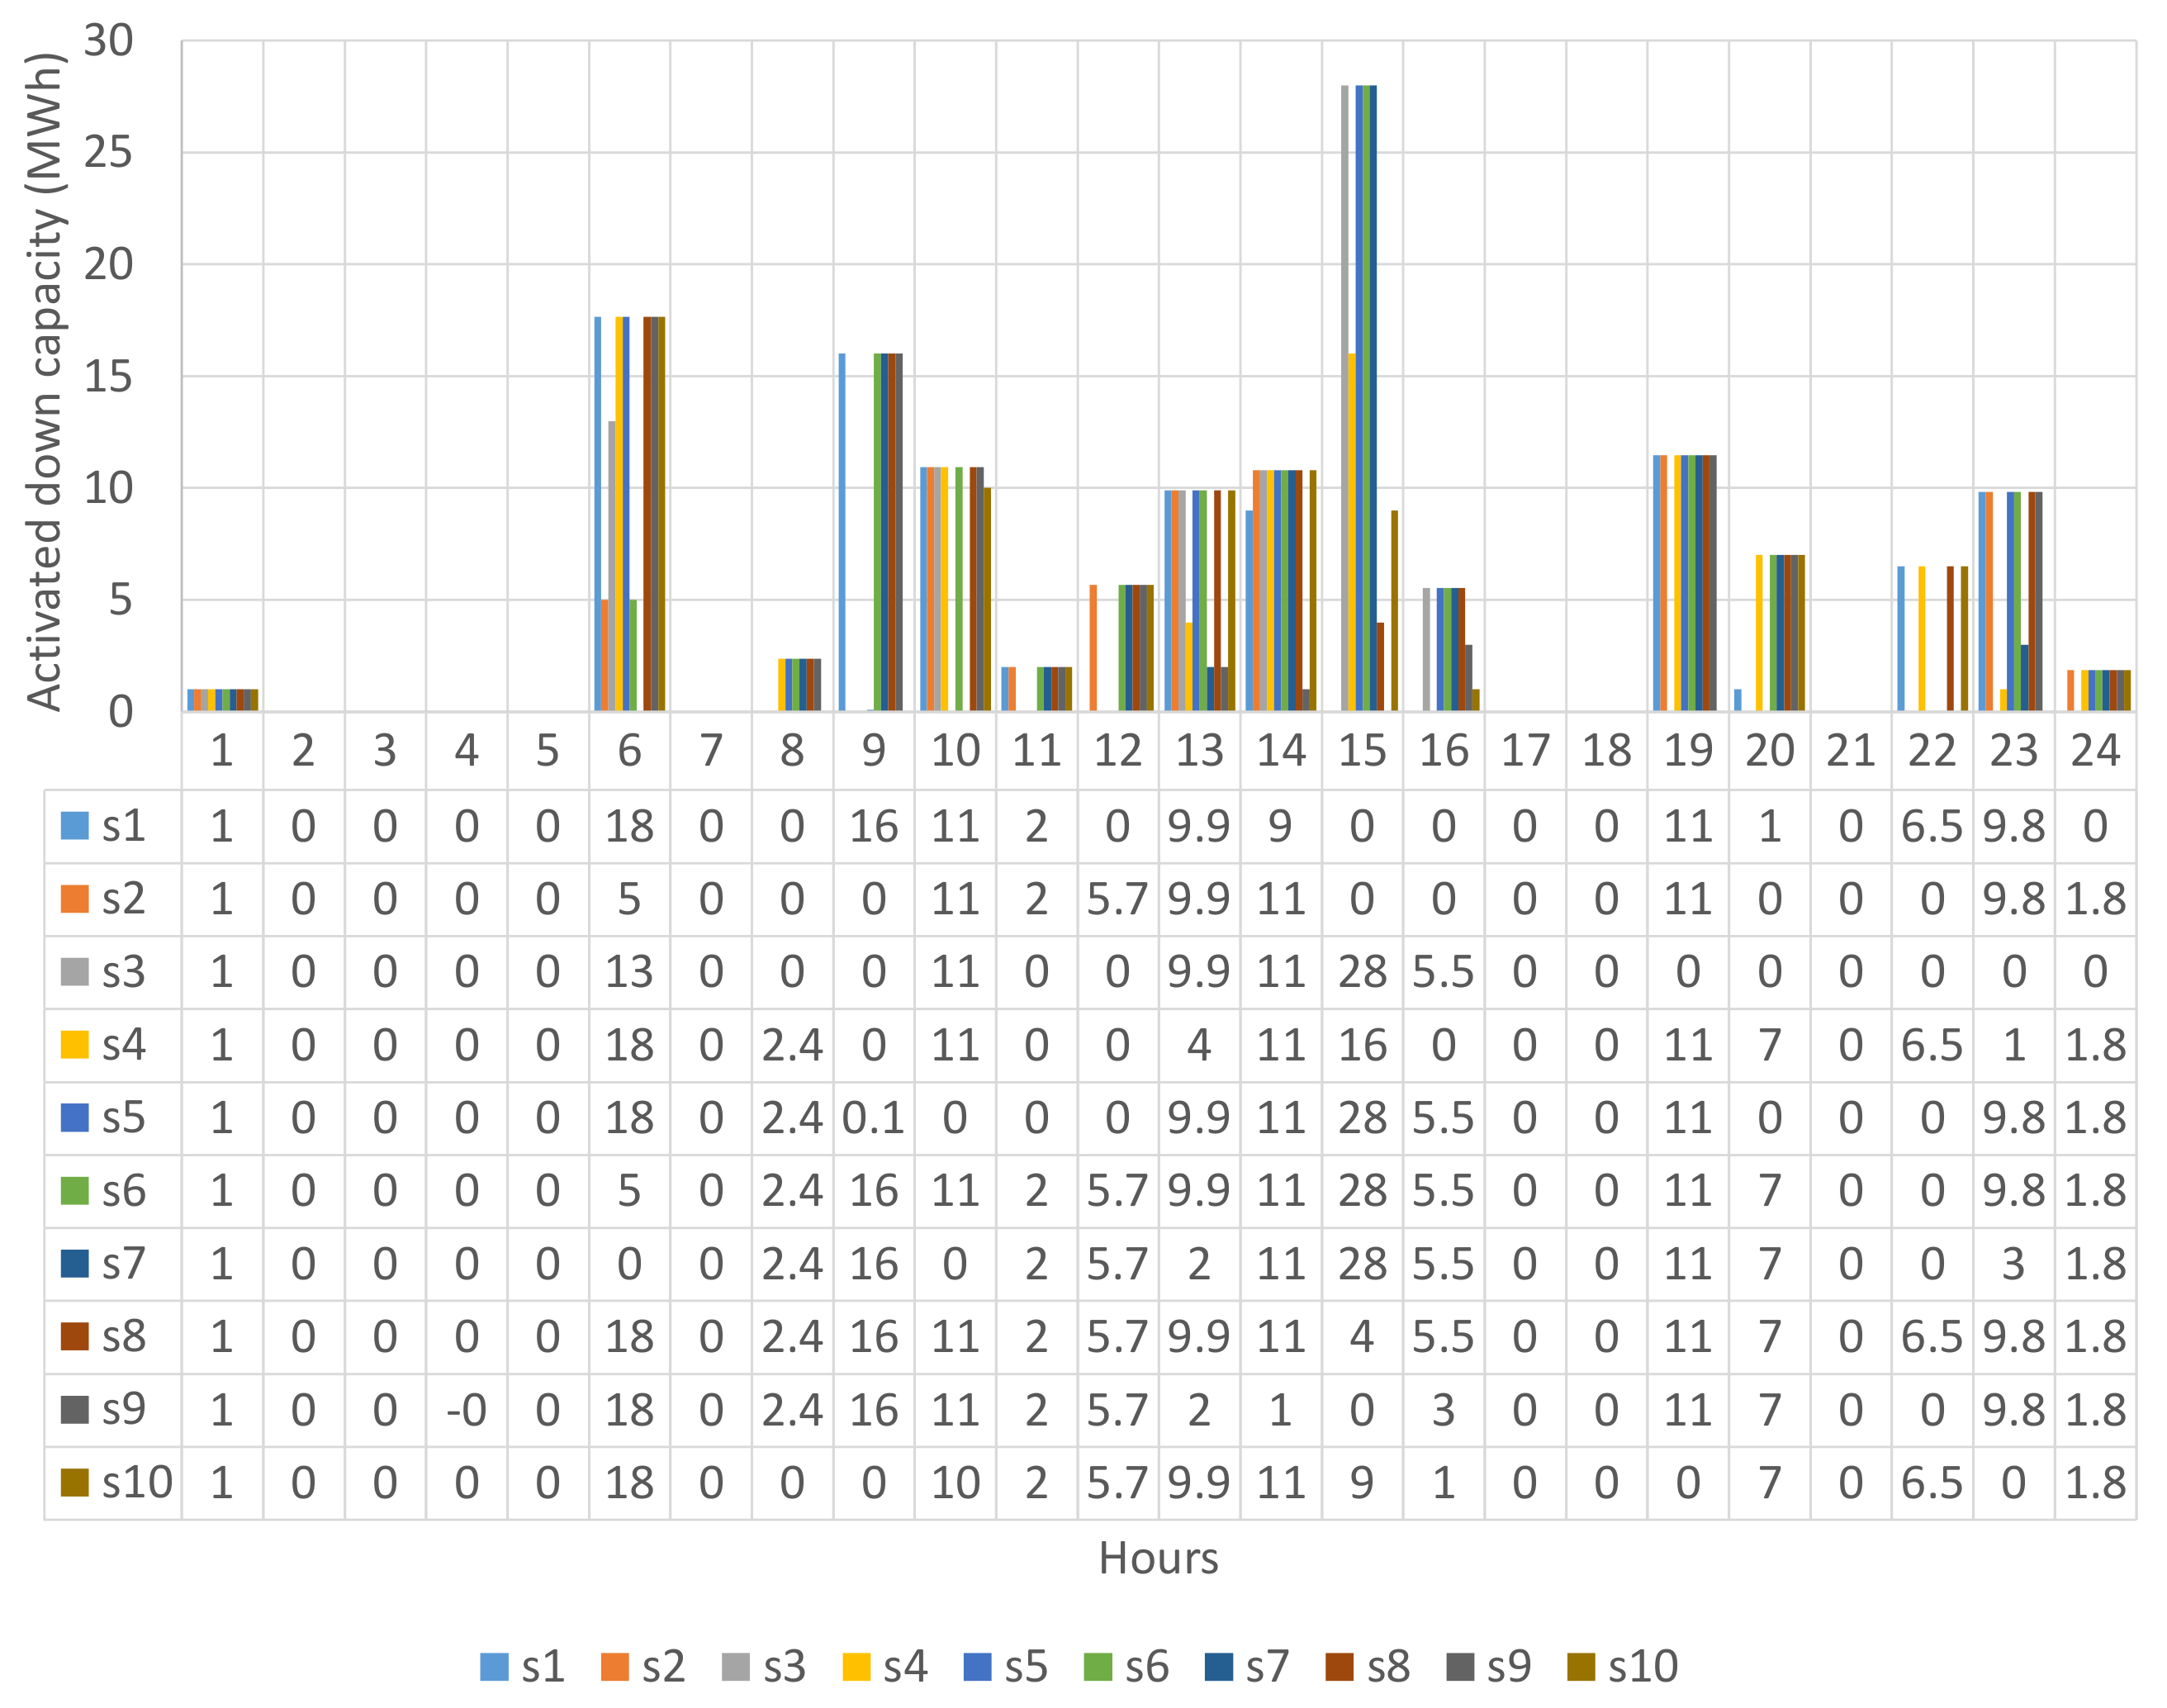
Activation of the energy storage up and down reserves per scenario are visualized and listed in Figure 8 and Figure 9. The numbers in the tables beneath these figures should be read column-by-column. In the first hour, the up reserve is fully activated (0.4 MW) in 9 out of 10 scenarios (Figure 8) and only in scenario s2 the battery up reserve remains inactive. The most noticeable property of the battery storage up reserve provision is having the activated capacity equal to the reserved capacity in the majority of scenarios. The lowest number of scenarios with fully activated up reserve occurs in hour 16, when only five scenarios experience full activation. Similar properties are observed for down reserve activation shown in Figure 9, where the lowest number of scenarios with fully activated reserve takes place in hour 15 with four full activations.
Generally, such uniform behavior of the battery storage reserve activation increases its utilization, i.e., the revenue of reserve activation, and harmonizes the state-of-energy across all scenarios. Since the last term in objective function (1) considers the weighed activation revenue, if the actual up reserve activation price in a certain hour of a scenario with 10% probability is €50/MWh, the value of the dual variable λ t , s a would be €5/MWh. This is a direct consequence of scenario probability π s multiplying the activation costs in lower-level objective function (12).
To provide a better insight into the role of the battery storage in the overall reserve activation process, Table 3 and Table 4 provide ratios of the reserve activation provided by the battery storage and the overall activated reserve for up and down direction. In the first hour, scenarios significantly vary in terms of the activated up reserve (Table 3). For scenario 1 the battery storage provides only 0.1% out of the activated 400 MWh. The same volume of battery’s up activation in scenario 5 consists of 20% of the overall up reserve (0.4/2 MWh). In the second hour, the battery provides up to 16 MWh of the up reserve. In scenarios 2, 5, 6 and 7 this is sufficient to cover the entire required up reserve volume. When it comes to down reserve, the battery does not provide any portion in hours 2–5 (Table 4). In hour 9, it does not provide any reserve in scenarios that require low volumes, but it becomes active once the volumes increase (scenarios 1 and 6–9). This is because the down reserve activation prices of certain generators are negative (see the orange curve in Figure 3) and those are prioritized in the activation phase over the battery storage whose activation price is zero.
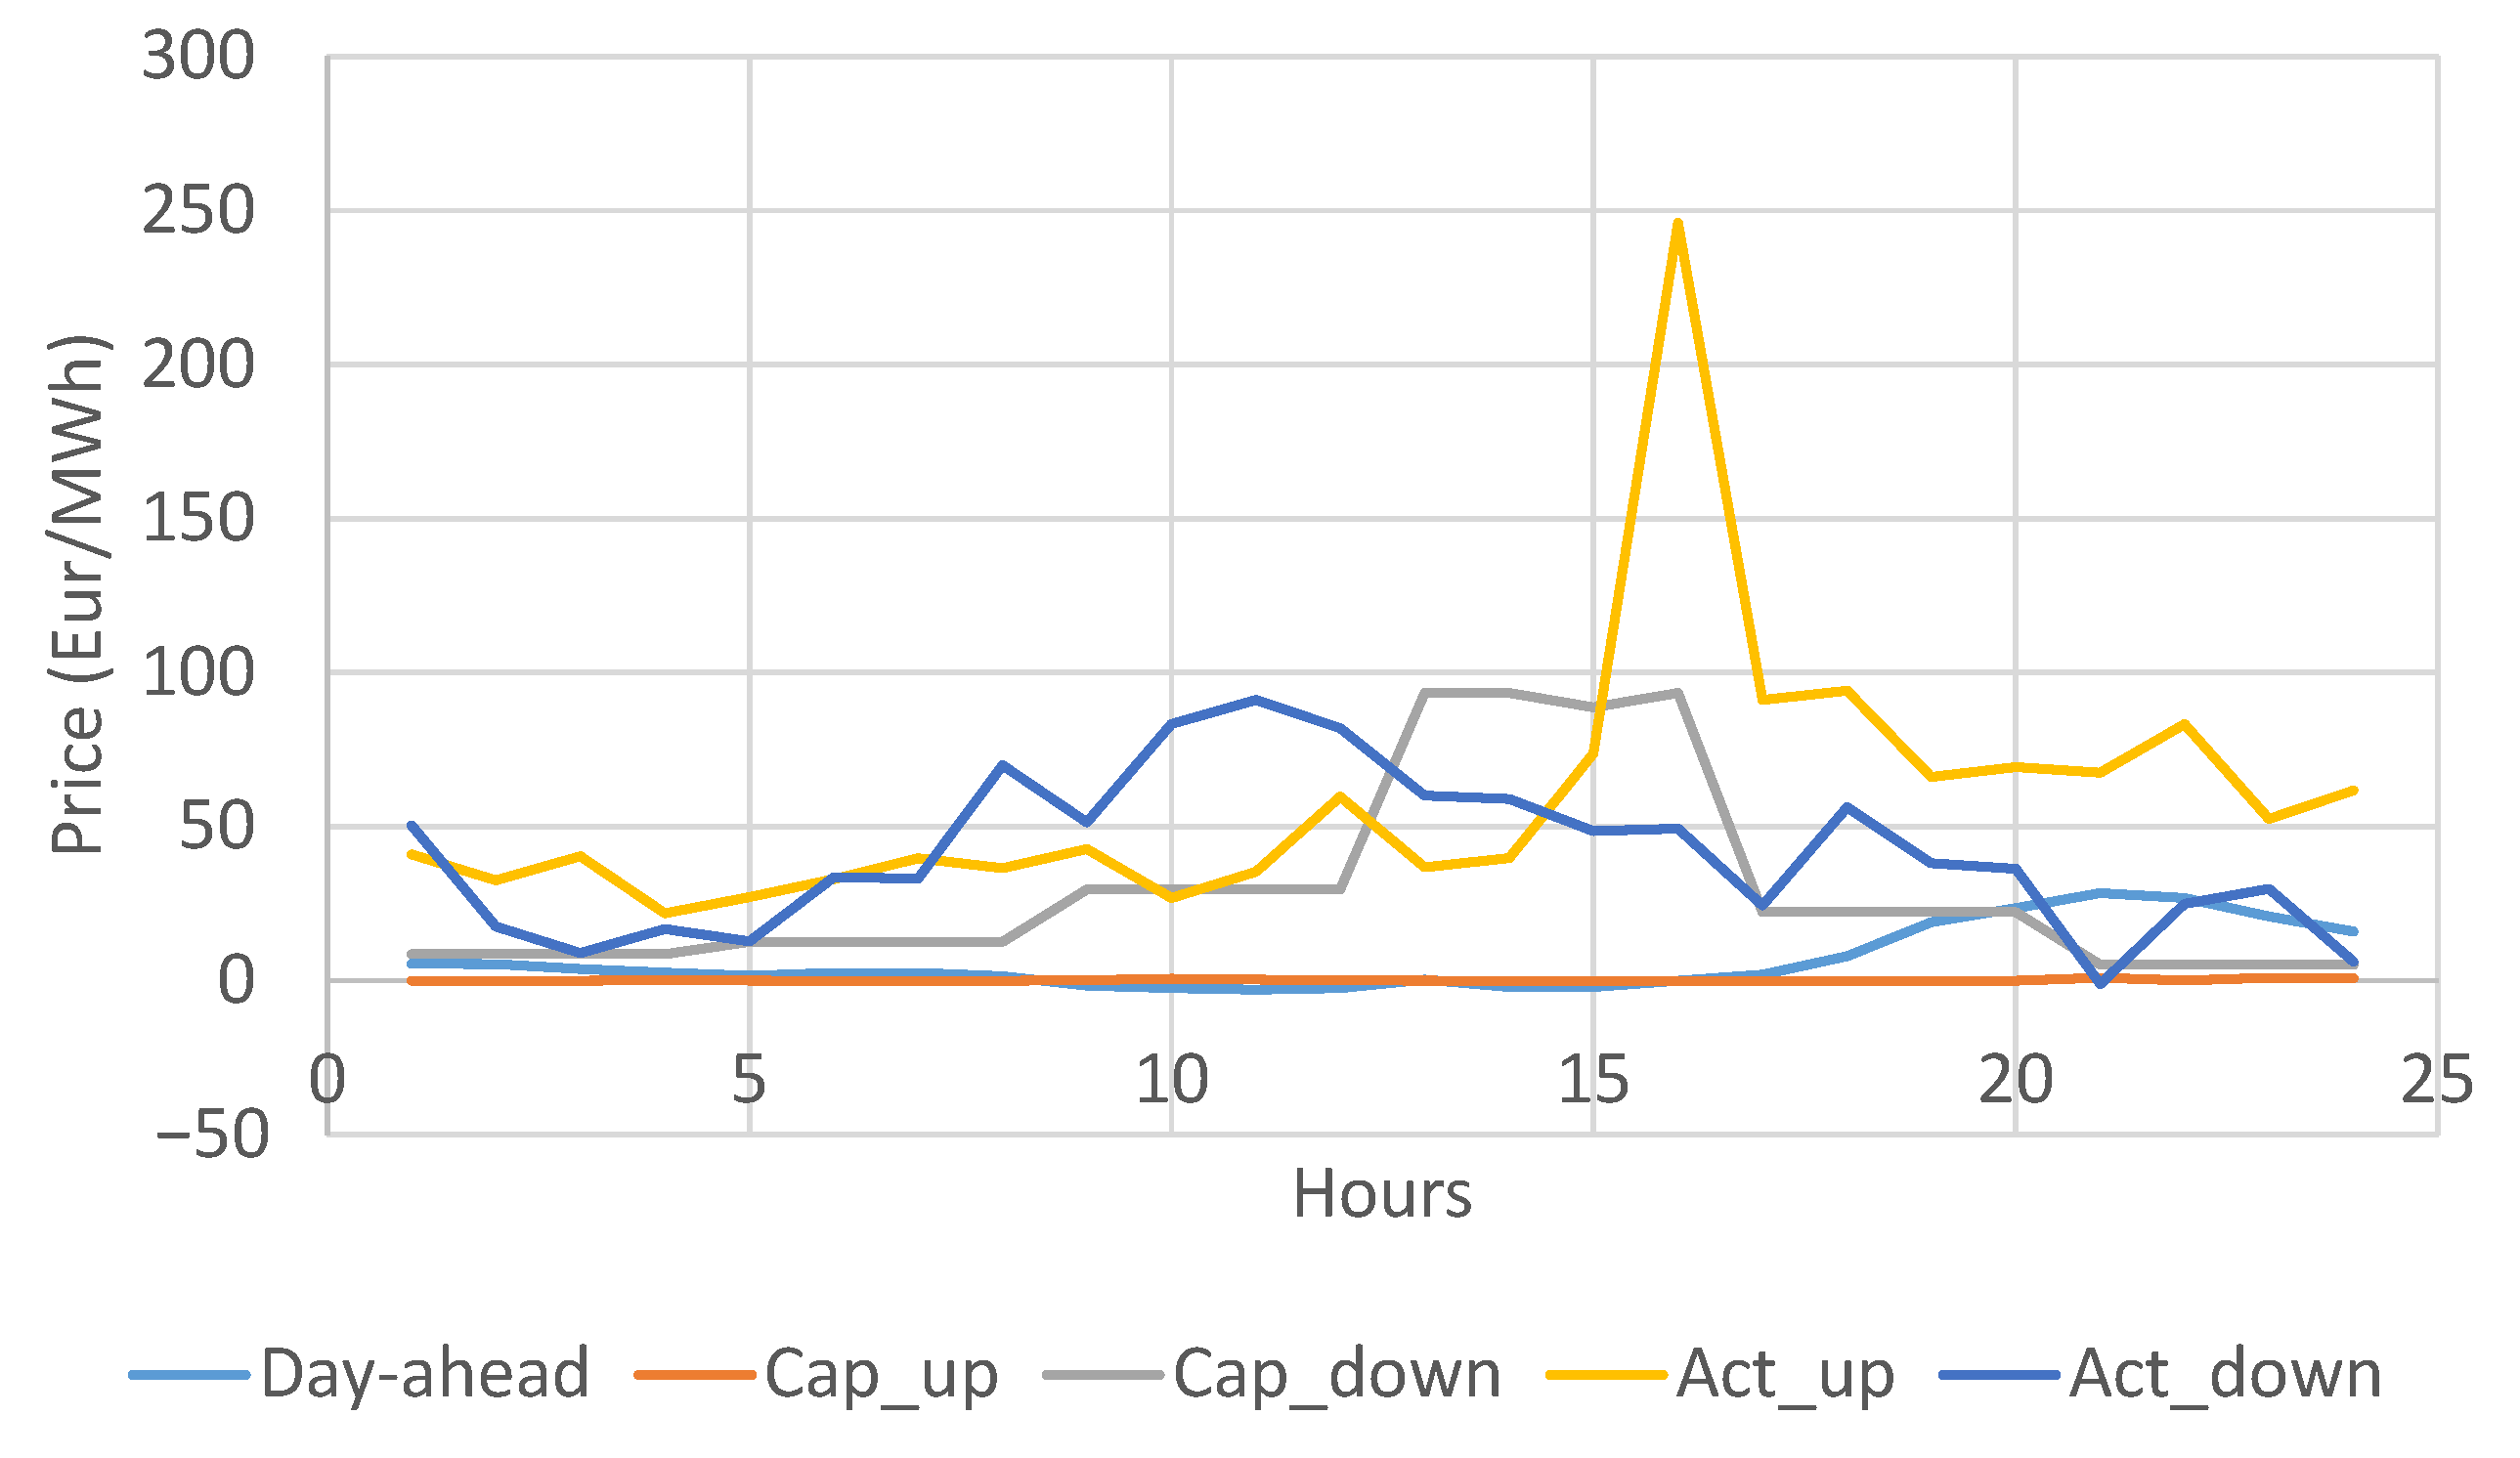
To better understand battery storage actions, the prices in different markets are shown in Figure 10. As shown in Table 1, the day-ahead prices are rather low throughout the day, taking the highest values in hours 19–24. The up capacity prices are zero (or slightly positive) throughout the day, which reflects the very low day-ahead market prices. The down capacity prices are much higher, reaching €93/MW in the afternoon hours. The up and down activation prices in Figure 10 are averaged over all scenarios. They are much higher than the day-ahead prices. Despite extremely low up reserve capacity prices, the activation prices are much higher. The peak price €235/MWh is achieved for up reserve activation in hour 16, which is the main reason for the battery storage reserving 13.3 MW of its up capacity and activating it fully in five out of ten scenarios.

4.3. Sensitivity Analysis

This section analyzes the effects of the battery storage bidding prices on its overall profit using the same data as the simulations in the previous section. The sensitivity includes variations in the four bidding parameters related to the reserves market: (i) up capacity reservation price (€/MW), (ii) down capacity reservation price (€/MW), (iii) up capacity activation price (€/MWh), iv) down capacity activation price (€/MWh). The results presented in Table 5 indicate that, regardless of the bidding prices, the battery storage utilizes the day-ahead market to charge (thus the day-ahead revenue is always negative), while the profit is made in the capacity reservation and activation stage. The only exception is the bidding strategy (10,10,50,−15), which has a high day-ahead positive revenue. This is the result of very frequent down capacity activation (the revenue is €12,416), which, besides that revenue itself, benefits the battery storage by charging it. This energy is discharged in the evening hours with the highest day-ahead prices to bring additional revenue in the day-ahead market.
Up reserve capacity revenue is generally very low, which is a direct consequence of the very low (mostly zero) up capacity reservation prices (see orange curve in Figure 10). However, the up capacity activation prices are high, especially during hour 16, and in most cases this stream of revenue is the highest. Down capacity reservation revenue is usually slightly higher than the activation revenue thanks to the high down capacity reservation prices during the afternoon hours (see the gray curve in Figure 10). The only exception are the last two cases.
The highest daily profit is achieved for bidding at €10/MW for both up and down capacity reservation, €50/MWh for up reserve activation and −€15/MW for down reserve activation. These bidding prices enable the battery storage to both affect the clearing prices (mostly by increasing them in its favor) and to win the auction in the majority of hours and scenarios. On the other hand, (5,5,50,0) bidding scheme results in the lowest overall profit, mostly because the high up reserve activation price €50/MWh reduced the up capacity activation revenue. However, the down activation bid at €0/MWh is insufficiently low for the battery storage to provide enough down reserve activation revenue to cancel out the negative monetary effects of the high up activation bid. On the other hand, the case with the highest profit (10,10,50,−15) provides sufficiently low down capacity activation bid for the battery storage to be cleared for activation more frequently and results in the highest down reserve activation revenue €12,416. This bidding strategy also results in the highest down capacity reservation revenue.

4.4. Comparison to a Baseline Model

To demonstrate the effectiveness and practical importance of the proposed model, we compare it against a baseline model where the battery storage acts as a price taker in all the markets and disregards its impact on the reserve capacity and activation prices. The baseline model includes only the upper-level problem (1) with capacity reservation and activation prices ( λ t cap , λ t cap , λ t , s a , λ t , s a ) treated as parameters. The obtained schedule is included in the market-clearing lower-level problem to obtain the actual profitability of the baseline model. The baseline model assessment procedure is described in the following steps:
  • First we solve only the lower-level problem (2) without battery storage bids, i.e., setting q ¯ t and q ¯ t to zero. This is needed to obtain the capacity reservation and activation prices λ t cap , λ t cap , λ t , s a and λ t , s a .
  • Then we solve the upper-level problem (1) using the capacity reservation and activation prices λ t cap , λ t cap , λ t , s a and λ t , s a from the previous step. Note that the capacity reservation and activation prices are treated as parameters as opposed to being treated as variables in the proposed formulation. The outcome is the battery storage day-ahead and reserves bids.
  • Finally, we solve the lower-level problem (2) again, but this time with battery storage bids q ¯ t and q ¯ t from the previous step. This calculation provides actual reserve capacity and activation prices (note that these may differ from those obtained in step 1) as well as cleared battery storage quantities and profit.
After running Step 2 using the reserve capacity and activation prices from Step 1, the obtained battery storage profit is €57,518, which is more than two and a half times higher than €22,172 obtained using the proposed model. The obtained battery operation schedule for the baseline model is shown in Figure 11. The battery storage very rarely charges in the day-ahead market, the majority in hour 16. The battery charges primarily through the provision of down-regulation capacity.
The obtained battery storage bidding schedule is then applied to the lower-level problem to calculate the reserve capacity and activation quantities actually accepted in the market and to deliver the true profit as the actual profit is expected to decrease if the battery storage’s bids had an effect on the reserve capacity and activation prices. The obtained actual profit of the battery storage is only €8856, which is almost three times lower than €22,172 obtained using the proposed model. Although all battery storage bids were accepted in the market, the obtained baseline battery scheduling process failed to capture the interaction between the battery storage bids and the market-clearing prices. The result is a much lower profit than when using the proposed model, thus proving the effectiveness of the formulation presented in this paper.

5. Conclusions

The paper presented a model for the optimal bidding strategy of battery storage acting in the day-ahead market as a price taker and in the aFRR market as a price maker. The model accurately captures the essence of the electricity market structure in Europe, which is in the process of shifting toward an hourly marginal-price reserve structure. Although the battery storage from the case study is relatively small in size as compared to the overall reserves market volume (50 MW as opposed to over 2.3 GW), the battery storage can significantly affect aFRR reserve market since the activated energy is usually quite low. The bidding prices of the battery storage may have an adverse effect on its profit. Thus, the bidding prices and quantities need to be carefully chosen so the battery storage affects the market prices in a desirable way, but still stays in the money, i.e., gets cleared to provide reserve capacity and, when necessary, becomes activated.
1 May 2020, the day used in the case study, is characterized by a rather low reserve capacity prices. Despite that, the battery storage profit is significant and bidding in the reserves market is much more profitable than bidding only in the energy market. Since most of the days in the year 2020 have higher reserve capacity prices, these results can be considered conservative, i.e., the lower bound on the profits to be achieved in German markets.
The presented model and results should be useful to project developers and battery storage market participants as the battery storage costs are still quite high and accurately seizing all potential revenue streams is essential for the profitability of such investment.

Author Contributions

The authors contributed to the paper in the following capacities: conceptualization, I.A. and H.P.; methodology, I.P.; validation, K.P. and H.P.; model design I.P., I.A., and H.P.; model implementation K.P.; visualization, H.P. All authors have read and agreed to the published version of the manuscript.

Funding

This work was funded in part by the European Union through the European Regional Development Fund Operational Programme Competitiveness and Cohesion 2014–2020 of the Republic of Croatia under project KK.01.1.1.04.0034 “Connected Stationary Battery Energy Storage”. It also received funding from the European Union’s Horizon 2020 research and innovation programme under grant agreement 863876 in the context of the FLEXGRID project.

Conflicts of Interest

The authors declare no conflict of interest.

Abbreviations

The following abbreviations are used in this manuscript:
AESOAlberta Electric System Operator
aFRRAutomatic Frequency Restoration Reserve
FCRFrequency Containment Reserve
KKTKarush–Kuhn–Tucker
MILPMixed-Integer Linear Program
MOLMerit Order List
SOEState-Of-Energy
TSOTransmission System Operator

References

  1. Official Journal of the European Union. Commission Regulation (EU) 2017/2195 of 23 November 2017 Establishing a Guideline on Electricity Balancing; European Commission, Directorate-General for Energy: Brussels, Belgium, 2017. [Google Scholar]
  2. Koch, C.; Hirth, L. Short-term electricity trading for system balancing: An empirical analysis of the role of intraday trading in balancing Germany’s electricity system. Renew. Sustain. Energy Rev. 2019, 113, 109275. [Google Scholar] [CrossRef] [Green Version]
  3. Lackner, C.; Nguven, T.; Byrne, R.H.; Wiegandt, F. Energy Storage Participation in the German Secondary Regulation Market. In Proceedings of the 2018 IEEE PES Transmission and Distribution Conference and Exposition (T&D), Denver, CO, USA, 16–19 April 2018; pp. 1–9. [Google Scholar]
  4. PICASSO Project TSOs. Consultation on the Design of the Platform for Automatic Frequency Restoration Reserve (AFRR) of PICASSO Region, The Platform for the International Coordination of Automated Frequency Restoration and Stable System Operation (PICASSO). 2017.
  5. Figgener, J.; Stenzel, P.; Kairies, K.P.; Linßen, J.; Haberschusz, D.; Wessels, O.; Angenendt, G.; Robinius, M.; Stolten, D.; Sauer, D.U. The development of stationary battery storage systems in Germany—A market review. J. Energy Storage 2020, 29, 101–153. [Google Scholar] [CrossRef]
  6. Simon, B. The German Energy Storage Market 2016–2021: The Next Energy Transition. In GTM Research Report; GTM Research: Boston, MA, USA, 2016. [Google Scholar]
  7. RTE—Le RéSeau de Transport De L’électricité; Electricity Report 2018; Réseau de Transport d’Électricité: Paris, France, 2019.
  8. Regelleistung.net. Internetplattform zur Vergabe von Regelleistung. 2019. Available online: https://www.regelleistung.net/ext/static/prl (accessed on 5 March 2019).
  9. Butler, P.C.; Iannucci, J.; Eyer, J. Innovative business cases for energy storage in a restructured electricity marketplace. In Sandia National Laboratories Report; Sandia National Laboratories: Albuquerqe, NM, USA, 2003. [Google Scholar]
  10. Eyer, J.M.; Iannucci, J.; Corey, G.P. Energy storage benefits and market analysis handbook. In Sandia National Laboratories Report; Sandia National Laboratories: Albuquerqe, NM, USA, 2004. [Google Scholar]
  11. Sioshansi, R.; Denholm, P.; Jenkin, T.; Weiss, J. Estimating the value of electricity storage in PJM: Arbitrage and some welfare effects. Energy Econ. 2009, 31, 269–277. [Google Scholar] [CrossRef]
  12. Akhavan-Hejazi, H.; Mohsenian-Rad, H. Optimal Operation of Independent Storage Systems in Energy and Reserve Markets With High Wind Penetration. IEEE Trans. Smart Grid 2014, 5, 1088–1097. [Google Scholar] [CrossRef]
  13. Kazemi, M.; Zareipour, H.; Amjady, N.; Rosehart, W.D.; Ehsan, M. Operation Scheduling of Battery Storage Systems in Joint Energy and Ancillary Services Markets. IEEE Trans. Sustain. Energy 2017, 8, 1726–1735. [Google Scholar] [CrossRef]
  14. Fleer, J.; Zurmuhlen, S.; Meyer, J.; Badeda, J.; Stenzel, P.; Hake, J.-F.; Sauer, D. Price development and bidding strategies for battery energy storage systems on the primary control reserve market. Energy Procedia 2017, 135, 143–157. [Google Scholar] [CrossRef]
  15. Fleer, J. Techno-economic evaluation of battery energy storage systems on the primary control reserve market under consideration of price trends and bidding strategies. J. Energy Storage 2018, 17, 345–356. [Google Scholar] [CrossRef]
  16. Gomes, I.L.R.; Pousinho, H.M.I.; Melício, R.; Mendes, V.M.F. Stochastic coordination of joint wind and photovoltaic systems with energy storage in day-ahead market. Energy 2017, 124, 310–320. [Google Scholar] [CrossRef]
  17. Miletić, M.; Pandžić, H.; Yang, D. Operating and Investment Models for Energy Storage Systems. Energies 2020, 13, 4600. [Google Scholar] [CrossRef]
  18. Alberta Electric System Operator AESO. Comparison Between Sequential Selection and Co-Optimization Between Energy and Ancillary Service Markets; Technical Report; AESO: Calgary, AB, Canada, 2018. [Google Scholar]
  19. Pavić, I.; Dvorkin, Y.; Pandžić, H. Energy and Reserve Co-optimization—Reserve Availability, Lost Opportunity and Uplift Compensation Cost. IET Gener. Trans. Dis. 2019, 13, 229–237. [Google Scholar] [CrossRef]
  20. Ehsani, A. A Proposed Model for Co-Optimization of Energy And Reserve In Competitive Electricity Market. Appl. Math. Model. 2009, 33, 92–109. [Google Scholar] [CrossRef]
  21. Chen, Y.; Gribik, P.; Gardner, J. Incorporating Post Zonal Reserve Deployment Transmission Constraints Into Energy and Ancillary Service Co-Optimization. IEEE Trans. Power Syst. 2014, 29, 537–549. [Google Scholar] [CrossRef]
  22. Ela, E.; Milligan, M.; Kirby, B. Operating Reserves and Variable Generation. In National Renewable Energy Laboratory Report; National Renewable Energy Laboratory: Golden, CO, USA, 2011. [Google Scholar]
  23. Chen, Y.; Wan, J.; Ganugula, V.; Merring, R.; Wu, J. Evaluating Available Room for Clearing Energy and Reserve Products under Midwest ISO Co-Optimization Based Real Time Market. In Proceedings of the 2010 IEEE PES General Meeting, Providence, RI, USA, 25–29 July 2010. [Google Scholar]
  24. Hassan, M.W.; Rasheed, M.B.; Javaid, N.; Nazar, W.; Akmal, M. Co-Optimization of Energy and Reserve Capacity Considering Renewable Energy Unit with Uncertainty. Energies 2018, 11, 2833. [Google Scholar] [CrossRef] [Green Version]
  25. Zeh, A.; Müller, M.; Naumann, M.; Hesse, H.C.; Jossen, A.; Witzmann, R. Fundamentals of Using Battery Energy Storage Systems to Provide Primary Control Reserves in Germany. Batteries 2016, 2, 29. [Google Scholar] [CrossRef] [Green Version]
  26. Goebel, C.; Jacobsen, H. Aggregator-Controlled EV Charging in Pay-as-Bid Reserve Markets with Strict Delivery Constraints. IEEE Trans. Power Syst. 2016, 31, 4447–4461. [Google Scholar] [CrossRef]
  27. Merten, M.; Rücker, F.; Schoeneberger, I.; Sauer, D.U. Automatic frequency restoration reserve market prediction: Methodology and comparison of various approaches. Appl. Energy 2020, 268, 114978. [Google Scholar] [CrossRef]
  28. Merten, M.; Olk, C.; Schoeneberger, I.; Sauer, D.U. Bidding strategy for battery storage systems in the secondary control reserve market. Appl. Energy 2020, 268, 114951. [Google Scholar] [CrossRef]
  29. Pandžić, H.; Bobanac, V. An Accurate Charging Model of Battery Energy Storage. IEEE Trans. Power Syst. 2019, 4, 1416–1426. [Google Scholar]
  30. Conejo, A.J.; Castillo, E.; Minguez, R.; Garcia-Bertrand, R. Decomposition Techniques in Mathematical Programming; Springer: Berlin/Heidelberg, Germany, 2006. [Google Scholar]
  31. Pandžić, H.; Dvorkin, Y.; Carrion, M. Investments in merchant energy storage: Trading-off between energy and reserve markets. Appl. Energy 2018, 230, 277–286. [Google Scholar] [CrossRef]
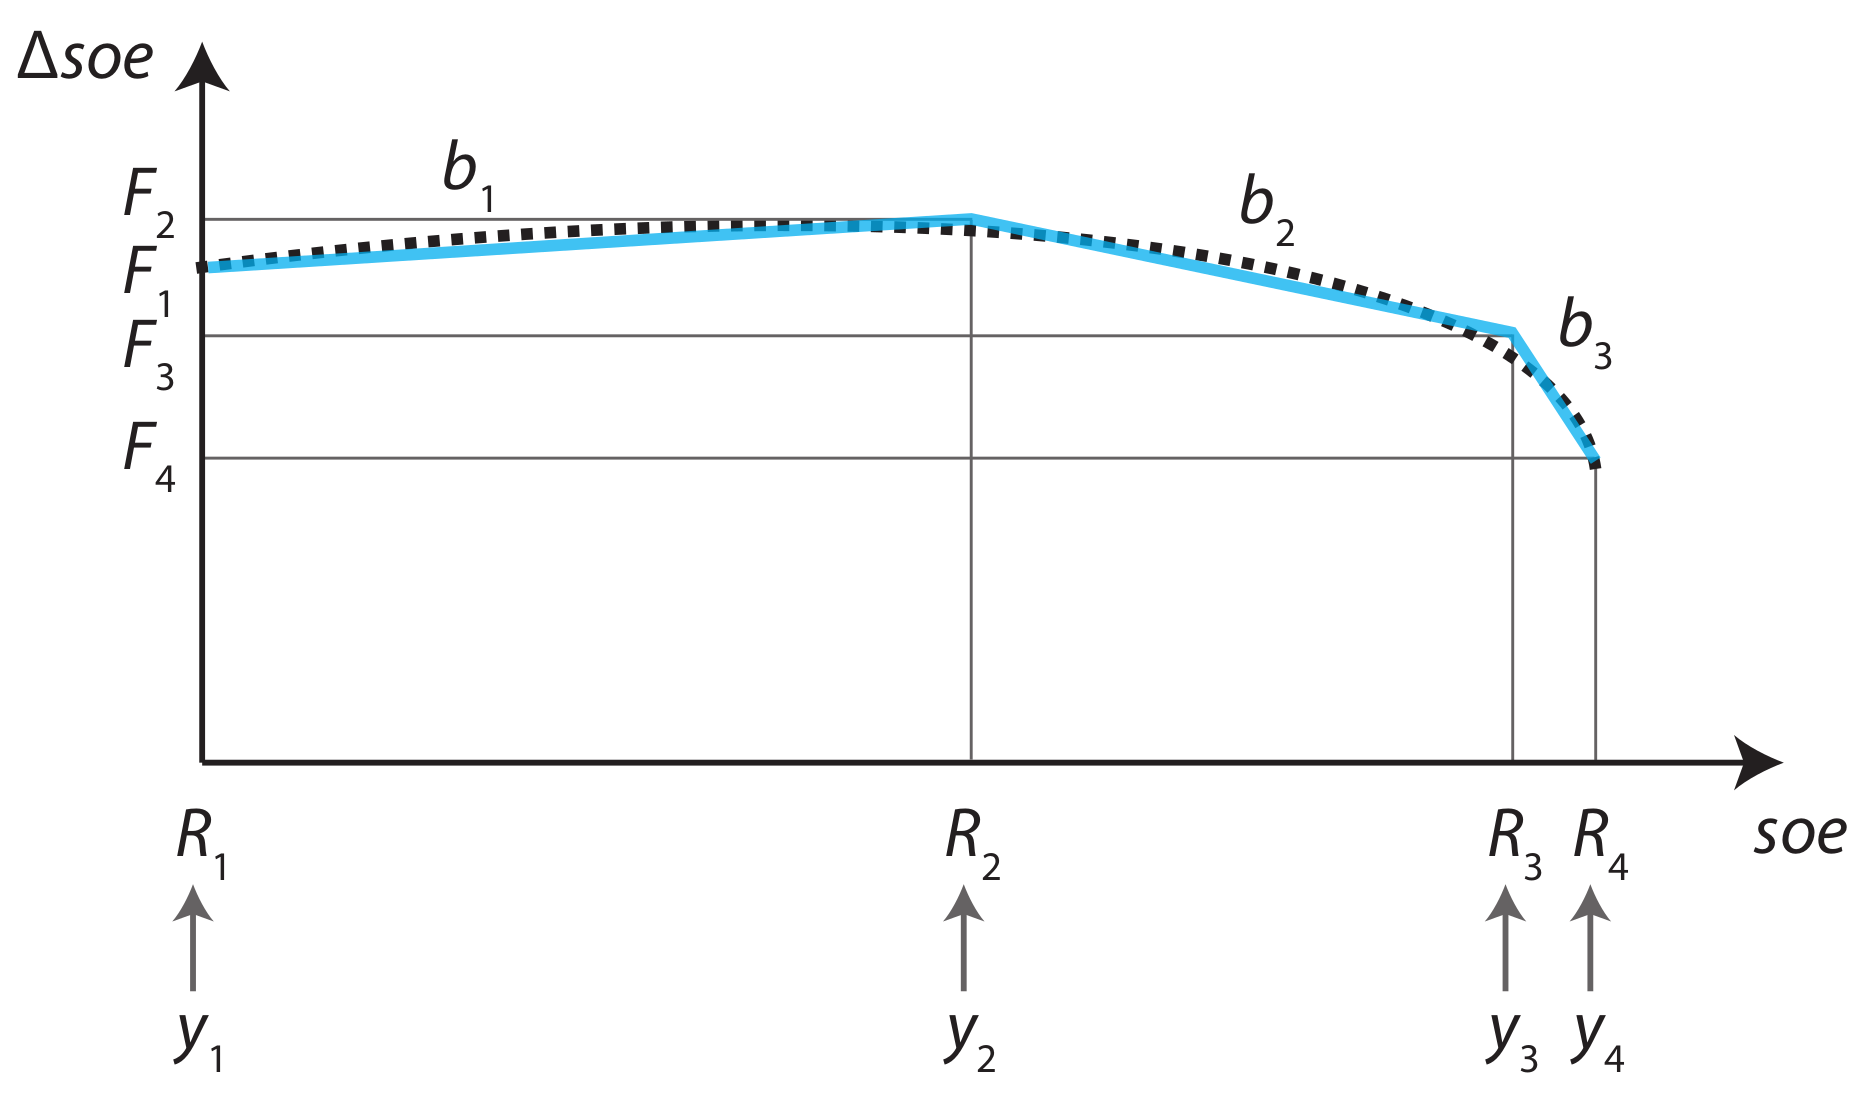
Figure 1. Piecewise linear approximation of an s o e Δ s o e function.
Energies 13 06629 g001
Figure 2. Up capacity reservation ( λ t cap ) and activation ( λ t , s a ) bids.
Energies 13 06629 g002
Figure 3. Down capacity reservation ( λ t cap ) and activation ( λ t , s a ) bids.
Energies 13 06629 g003
Figure 4. Up reserve activation per scenario ( R t , s a ).
Energies 13 06629 g004
Figure 5. Down reserve activation per scenario ( R t , s a ).
Energies 13 06629 g005
Figure 6. Battery charging day-ahead schedule ( q t ch q t dis ) and up/down cleared reserve capacity q t dis and q t ch .
Energies 13 06629 g006
Figure 7. Propagation of the battery storage state-of-energy ( s o e t , s ) per scenario.
Energies 13 06629 g007
Figure 8. Activation of the battery storage up reserve ( q t , s a ) per scenario.
Energies 13 06629 g008
Figure 9. Activation of the battery storage down reserve ( q t , s a ) per scenario.
Energies 13 06629 g009
Figure 10. Prices in the day-ahead market ( λ t da ), up ( λ t cap ) and down ( λ t cap ) capacity reservation prices and up ( λ t , s a ) and down ( λ t , s a ) activated capacity prices.
Energies 13 06629 g010
Figure 11. Battery charging day-ahead schedule ( q t ch q t dis ) and up/down cleared reserve capacity q t dis and q t ch for the baseline case.
Energies 13 06629 g011
Table 1. Day-ahead market prices ( λ t da ) on 1 May 2020.
HourPrice
(€/MWh)
HourPrice
(€/MWh)
HourPrice
(€/MWh)
HourPrice
(€/MWh)
15.572.54130.351918.99
25.3581.5014−2.042023.50
33.829−1.5715−2.062128.43
42.6310−2.4316−0.042226.88
51.5611−2.89171.952320.91
62.4612−2.47187.882416.00
Table 2. Required up ( R t cap ) and down ( R t cap ) reserve per 4-hour periods on 1 May 2020.
Hours 1–4Hours 5–8Hours 9–12Hours 13–16Hours 17–20Hours 21–24
Up reserve (MW)235923342355234423572360
Down reserve (MW)224722952338235423162303
Table 3. Volume of up reserve activation provided by the battery per scenario as a portion of the overall activated reserve (rounded to an integer unless close to zero), in MWh.
Hours1s2s3s4s5s6s7s8s9s10
10.4/4000/00.4/3270.4/80.4/20.4/170.4/380.4/1160.4/790.4/10
216/37710/1016/34116/218/816/1613/1316/7016/6916/177
310/17010/1010/15610/3210/2310/3810/3410/2810/12910/107
417/670/017/327/717/6817/5312/1217/7417/622/2
51/12/25/70/05/115/175/2235/55/154/4
60/00/30/340/390/40/50/720/00/20/9
72/52/132/802/282/522/482/1822/20/02/5
80/40/470/440/170/480/330/350/00/00/213
91/21/171/61/2791/1381/331/91/10/01/489
100/08/201/18/508/548/168/1181/12/28/102
117/71/17/317/577/2637/77/257/130/07/8
120/5540/20/8410/630/1080/70/100/00/40/1
131/1231/231/741/571/581/51/891/171/1041/0
144/3364/1920/04/1104/224/44/174/1254/1240/0
153/3493/4841/13/693/1483/30/03/153/1163/753
1613/26013/862/213/2191/17/73/35/513/7613/1119
179/4779/3759/1579/502/22/24/49/273/39/37
182/972/1152/2632/272/142/22/892/422/102/165
196/206/676/1636/66/526/66/1396/276/136/74
204/984/694/1253/34/2264/1294/1032/24/52/2
211/1571/301/841/201/231/701/931/11/1421/5
220/03/763/1313/153/623/2053/5083/173/1283/3
237/121/17/277/432/27/307/687/107/407/158
246/746/166/1906/86/106/66/236/296/176/148
Table 4. Volume of down reserve activation provided by the battery per scenario as a portion of the overall activated reserve (rounded to an integer unless close to zero), in MWh.
Hours1s2s3s4s5s6s7s8s9s10
11/81/2091/61/2501/4301/371/881/571/101/57
20/50/1320/40/1180/720/430/230/150/100/8
30/40/280/50/320/650/200/310/120/60/8
40/150/1660/50/680/200/270/160/60/120/77
50/2010/480/90/2000/180/490/60/560/810/12
618/725/4013/4818/5518/695/400/1518/40718/24718/64
70/70/1000/40/840/210/660/260/3730/2140/24
80/80/40/142/632/652/1122/1052/5162/4770/5
916/3800/290/270/200/3216/17316/18316/40316/1810/4
1011/16311/5711/7111/420/1511/4440/1411/64811/23710/41
112/382/1480/120/270/42/4552/332/3692/3332/384
120/56/840/40/240/56/1086/586/8276/656/504
1310/3010/11910/284/910/8910/542/710/1692/710/651
149/1411/2011/24611/4911/17911/38711/25311/701/611/392
150/10/228/6016/2128/18028/19828/6034/90/59/14
160/20/46/740/56/5596/996/2716/323/81/6
170/00/20/360/80/1650/3940/1270/1190/1340/62
180/50/80/60/110/1860/2920/2900/2310/2840/30
1911/8311/320/1411/13311/12711/54611/3211/10411/1130/11
201/210/90/57/2310/197/1217/927/2937/857/234
210/300/120/50/1240/90/160/30/1650/60/48
227/4980/400/167/1030/360/450/87/1590/187/155
2310/16710/2740/271/4710/34110/893/4910/22310/1180/7
240/232/1250/152/1512/1452/1412/1732/1632/1552/53
Table 5. Effect of the bidding parameters on the battery storage profit (in €); the four numbers in the top cells indicate (i) up capacity reservation price (€/MW), (ii) down capacity reservation price (€/MW), (iii) up capacity activation price (€/MWh), (iv) down capacity activation price (€/MWh).
Day-Ahead RevenueUp Capacity Res. RevenueUp Capacity Act. RevenueDown Capacity Res. RevenueDown Capacity Act. RevenueOverall Revenue
(0,0,0,0)−3722185076724729122,172
(1,1,0,0)−3682288356511716322,162
(1,1,25,0)−3542186846804727422,429
(1,1,25,15)−3662183165568563019,168
(5,5,0,0)−3602285886703720522,158
(5,5,25,0)−3272180667162751522,438
(5,5,25,15)−3602280965713569819,169
(5,5,50,0)−7553865605635217,342
(10,10,50,−15)103373585917212,41626,212
Publisher’s Note: MDPI stays neutral with regard to jurisdictional claims in published maps and institutional affiliations.