1. Introduction
Intensive digitisation brings new challenges and opportunities for companies and users. Most of them are related to data gathering and processing for the acquisition of potentially new and useful knowledge about processes in enterprise. In the case of industrial companies, the main issue concerns the use of low-level data acquired from monitoring systems. The analysis of this data should ultimately lead to the optimisation of industrial processes and company management procedures. The heterogeneous industrial data are most commonly generated by a range of low-level sensors, monitoring the operation of the machinery involved in the execution of the processes. In order to be practically useful, these data need to be pre-processed and often augmented with certain domain knowledge regarding the process. Moreover, sensor data can be translated into some higher level representation, e.g., event log [
1,
2,
3,
4].
Furthermore, the proper use of such data understanding of industrial processes often requires the use of computer models of the process. Such models, together with the above-mentioned data, can later be used for the process monitoring and possibly enable its optimisation. There are a number of specific issues, such as detection of anomalies in the execution of the process [
5,
6,
7] and predictive maintenance of the machinery [
8]. More recently, there has been a lot of interest in the so-called digital twins—realistic computer models are used for the simulation of the process execution in modified conditions, thereby saving costs of field tests [
9,
10,
11].
A conceptual and practical challenge is related to the selection of the modeling method (language) and approach. Recently, one of the often considered perspectives has been business process management (BPM). It is concerned with designing, monitoring, executing, and evaluating business processes in organisations on a general level. The primary artifact in BPM is a process model, which is an abstract representation of a business process [
12], or corresponds to the industrial process, e.g., manufacturing. A business process model could be built manually or be generated based on the pre-processed monitoring data in the form of event logs through the use of process mining (PM) techniques.However, in industrial practice, such an approach is often not feasible.
BPM use various sources of information about the processes. One of them, especially in industrial installation, is Internet of Things (IoT), defined as a network of connected devices collecting and exchanging data over the Internet [
13]. Process management requires an adequate amount of information as a base. IoT can complement BPM with continuous data delivery and physical actuation to improve decision making. In changeable market conditions it is not enough to use only historical data from traditional repositories (e.g., databases and data warehouses), but there is a need to use and analyse the up-to-dated data. In this context, IoT data, such as events, delivered via in-memory databases or complex event processing can be useful [
13]. On the other hand, it can be pointed that events generated from IoT sensors do not directly correspond to meaningful process activities or process instance, and IoT entities and processes are rarely represented in an explicit way in and through process models [
14]. It results in the hindered analysis of conformance between process model and process data.
Commonly the existing industrial installations, well understood by their designers, are augmented with sensors gathering data. Analysing the machinery operation, we have to handle streams of low-level measurements and events (e.g., measures of currents, temperature, oil levels, two-state signals). Thus high-level modelling techniques can not be applied directly. To overcome this issue, one can translate low-level events into high-level activities and analyse process behaviour with the standard conformance checking techniques. However, industrial processes can be complex and highly variable (e.g., there are no two similar traces in the log—the number of process variants can be equal to a number of traces). Moreover, in real-life scenarios, the differences between an event log and a process model can be large [
15].
In the case of the analysed process of shearer operation in longwall mining, there is difficulty in creating a prescribed high-level model. There is a theoretical model of shearer operation (described in the following section); however, depending on changeable mining conditions, other behaviour is also allowed (e.g., some repetitions denoted as normal behaviour). Moreover, some activities can exist but are not prescribed in the process model (e.g., moving without cutting). Additionally, the spatial context of the mining process influences the assessment of normal/abnormal behaviour (some of the activities are normal in a specific location of their occurrence). Even though we translate low-level events into high-level events, resultant Petri net remains a spaghetti-like model, thus making conformance checking complicated. It should also be emphasised that in the online settings, to detect an anomaly, each low-level event should be translated in-the-fly into a high-level event, making the whole conformance checking process ineffective.
In this context, our paper presents an original approach that combines numerical analysis of low-level data collected from sensors with formal modelling of the industrial process under consideration. We focus on the model of the most important machinery executing the process. The use of a formal language for the given system representation allows for a better understanding of its features and for defining its behaviour unambiguously. The former advantage is crucial for researchers who want to understand the process in details but are not the corresponding domain experts, the latter is necessary for formal model analysis e.g., using model checking techniques [
16]. Our model can be effectively used to validate data from sensors monitoring the machines to detect possible errors in readings, or miss-operation of the equipment. Considering the used formalism, it can also be used for realistic simulation and data generation.
The developed approach supports process users with better, more complete information about the execution of the process and warnings about deviations from the standard process model. What is crucial, we can receive this information in a short time, enabling a quick response of the dispatcher or the person managing the process. In addition, we provide the synergy of information from various sensors, so far presented in visualisation systems on different charts, into one specific message about irregularities in the process. Until now, the supervisor has had to assemble and pre-process various information (e.g., the shearer location, currents of the drums and haulages and moving direction of the shearer) into identification of the process state and notice deviations.
The paper presents results of research work conducted in the CHIST-ERA Pacmel project. (See the project webpage at
http://PACMEL.geist.re). The project is oriented toward the development of novel methods of artificial intelligence for knowledge modelling and intelligent data analysis in Industry 4.0. In the project, we are closely collaborating with several industrial companies providing us with expert knowledge regarding the machinery and industrial installations, and large data samples from industrial sensors. In this use case, we cooperate with both the mining company, and with the producer of the industrial machinery. Our partner, Famur S.A. (see the company webpage at
http://www.FAMUR.com.pl), is one of the global suppliers of mining machines for a number of countries all over the world.
The paper is structured as follows:
Section 2 presents a review of relevant related works. Then,
Section 3 introduces the main concepts related to the longwall mining process and the main machinery used in it. A general description of our approach considered in this paper is given in
Section 4.
Section 5 introduces the original formal model of a longwall shearer. The results of the application of our approach for the conformance checking of the shearer operation process are presented in
Section 6. The final section contains a summary of our work and presents our future research plans.
2. Related Works
It is anticipated that the factories of the future will turn into smart factories with autonomous and adaptive production processes. However, the growing complexity of production process networks is expected to complicate the rapid detection of real-time process anomalies and optimisation of industrial processes.
Detection of process deviation from the model is one of the main tasks of process mining [
17], namely, conformance checking. A conformance checking technique’s input usually consists of an event log and a process model, and its output includes a set of differences between the model and the log. This set can contain specific metrics or measurements and a verbal description.
One of the key challenges of conformance checking in the industrial setting is to identify relevant event data among a pool of data in IoT systems; then one extracts and transforms the data to the process-centric event log format for process mining techniques. This action requires a great amount of domain knowledge and it mostly involves manual and ad hoc solutions. The challenge mentioned gave rise to a number of solutions and techniques for event log creation, presented, among others, in [
14,
18,
19,
20,
21].
Conformance checking techniques detect two types of deviations between a process model and a log [
15]: (1) behaviour observed in the log but disallowed by the model (unfitting behaviour), and (2) behaviour allowed by the model but not observed in the log (additional behaviour). The most recognised conformance checking techniques include token-based replay [
22], alignments techniques [
23], casual footprints [
17] and behaviour profiles [
24]. A comprehensive review of the topic is presented in [
25].
One of the proposals for online conformance checking is a framework that relies on the notion of behavioural patterns in the process [
26]. The proposed approach enables analysis also in the so-called warm start mode (when an analysed case is only a part of real execution). Therefore, authors accompanied a framework with a corresponding instantiation that builds on top of the notion of Petri net unfoldings. The four-step approach includes the creation of reverse Petri net for a given model; then, unfolded models of original and reverse nets are created; after that, transformation of unfolded models to so-called process model for online conformance (PMOC) occurs (via reachability graphs); and at last, online conformance checking with the use of matrices describing possible relations between pairs of activities in the process model. The evaluation of conformance is based on three metrics: actual conformance, completeness and confidence.
In [
27] an approach to computing conformance for online data streams with the replay approach is presented. The authors assumed as input a Petri net, which is converted into a transition system. The transition system is decorated with additional arcs allowing deviation, and a cost function associated with transitions representing deviations. The two-step approach starts with the creation of an augmented model based on region theory and state distance, and cost configuration for deviated behaviour. The second step includes online analysis consisting of replaying the events from the stream on the model and accumulating the costs associated with each execution. All process instances with costs higher than 0 are deviating from the prescribed model.
A distinct approach for conformance checking is presented in [
28]. The authors proposed usage of a procedural process model—a workflow net with time series (TSWF-net) in which fulfilment of the process task can be expressed as a set of temporal conditions about the values of the variables in the log. It is the first conformance checking technique considering the evolution of data over time, which is of the most importance for the analysis of the real-time systems wherein process tasks depend on how one or several variables of the process variate.
The above-mentioned techniques support conformance checking with formal process models (Petri nets). However, other models can also be used.
One of the automaton-based techniques is presented in [
15]. With this technique, an event log is encoded as sequences of words and compressed into a minimal deterministic acyclic finite state automaton (DAFSA), and the process model is transformed into another automaton (reachability graph—RG). After comparison of two automata, an error-correcting synchronised product automaton (called a partial synchronised product) is created, in which each state is a pair—a state in the RG and a state in the DAFSA. Based on this result, a set of optimal trace alignments is enumerated, or a set of behavioural difference statements can be formulated.
The automaton-based approach is also presented in [
29]. In the configurable divide-and-conquer Projected Conformance Checking (PCC) framework, decomposing a log into subsets of activities and partial conformance checking are performed instead of the comparing of complete behaviour over all activities. For each subset, main measures are computed as recall, fitness or precision, and the final measures are provided by the averages over these subsets. The PCC framework handles any formalism which can be expressed in the form of deterministic finite automata (DFAs), including, e.g., BPMN, UML-ADs or Petri nets.
Petri nets, in past years, have been implemented for the modelling and analysis of mining processes (mainly in regard to the operation processes of machinery). In [
30] the process model of mechanised roof support operation was presented. A more extensive model of concurrent operation of longwall shearer and mechanised roof supports was presented in [
31]. However, these models were not used in the conformance checking task.
3. Characteristics of the Mining Process in an Underground Coal Mine
Longwall mining is one of the most important mining techniques used in underground coal mines [
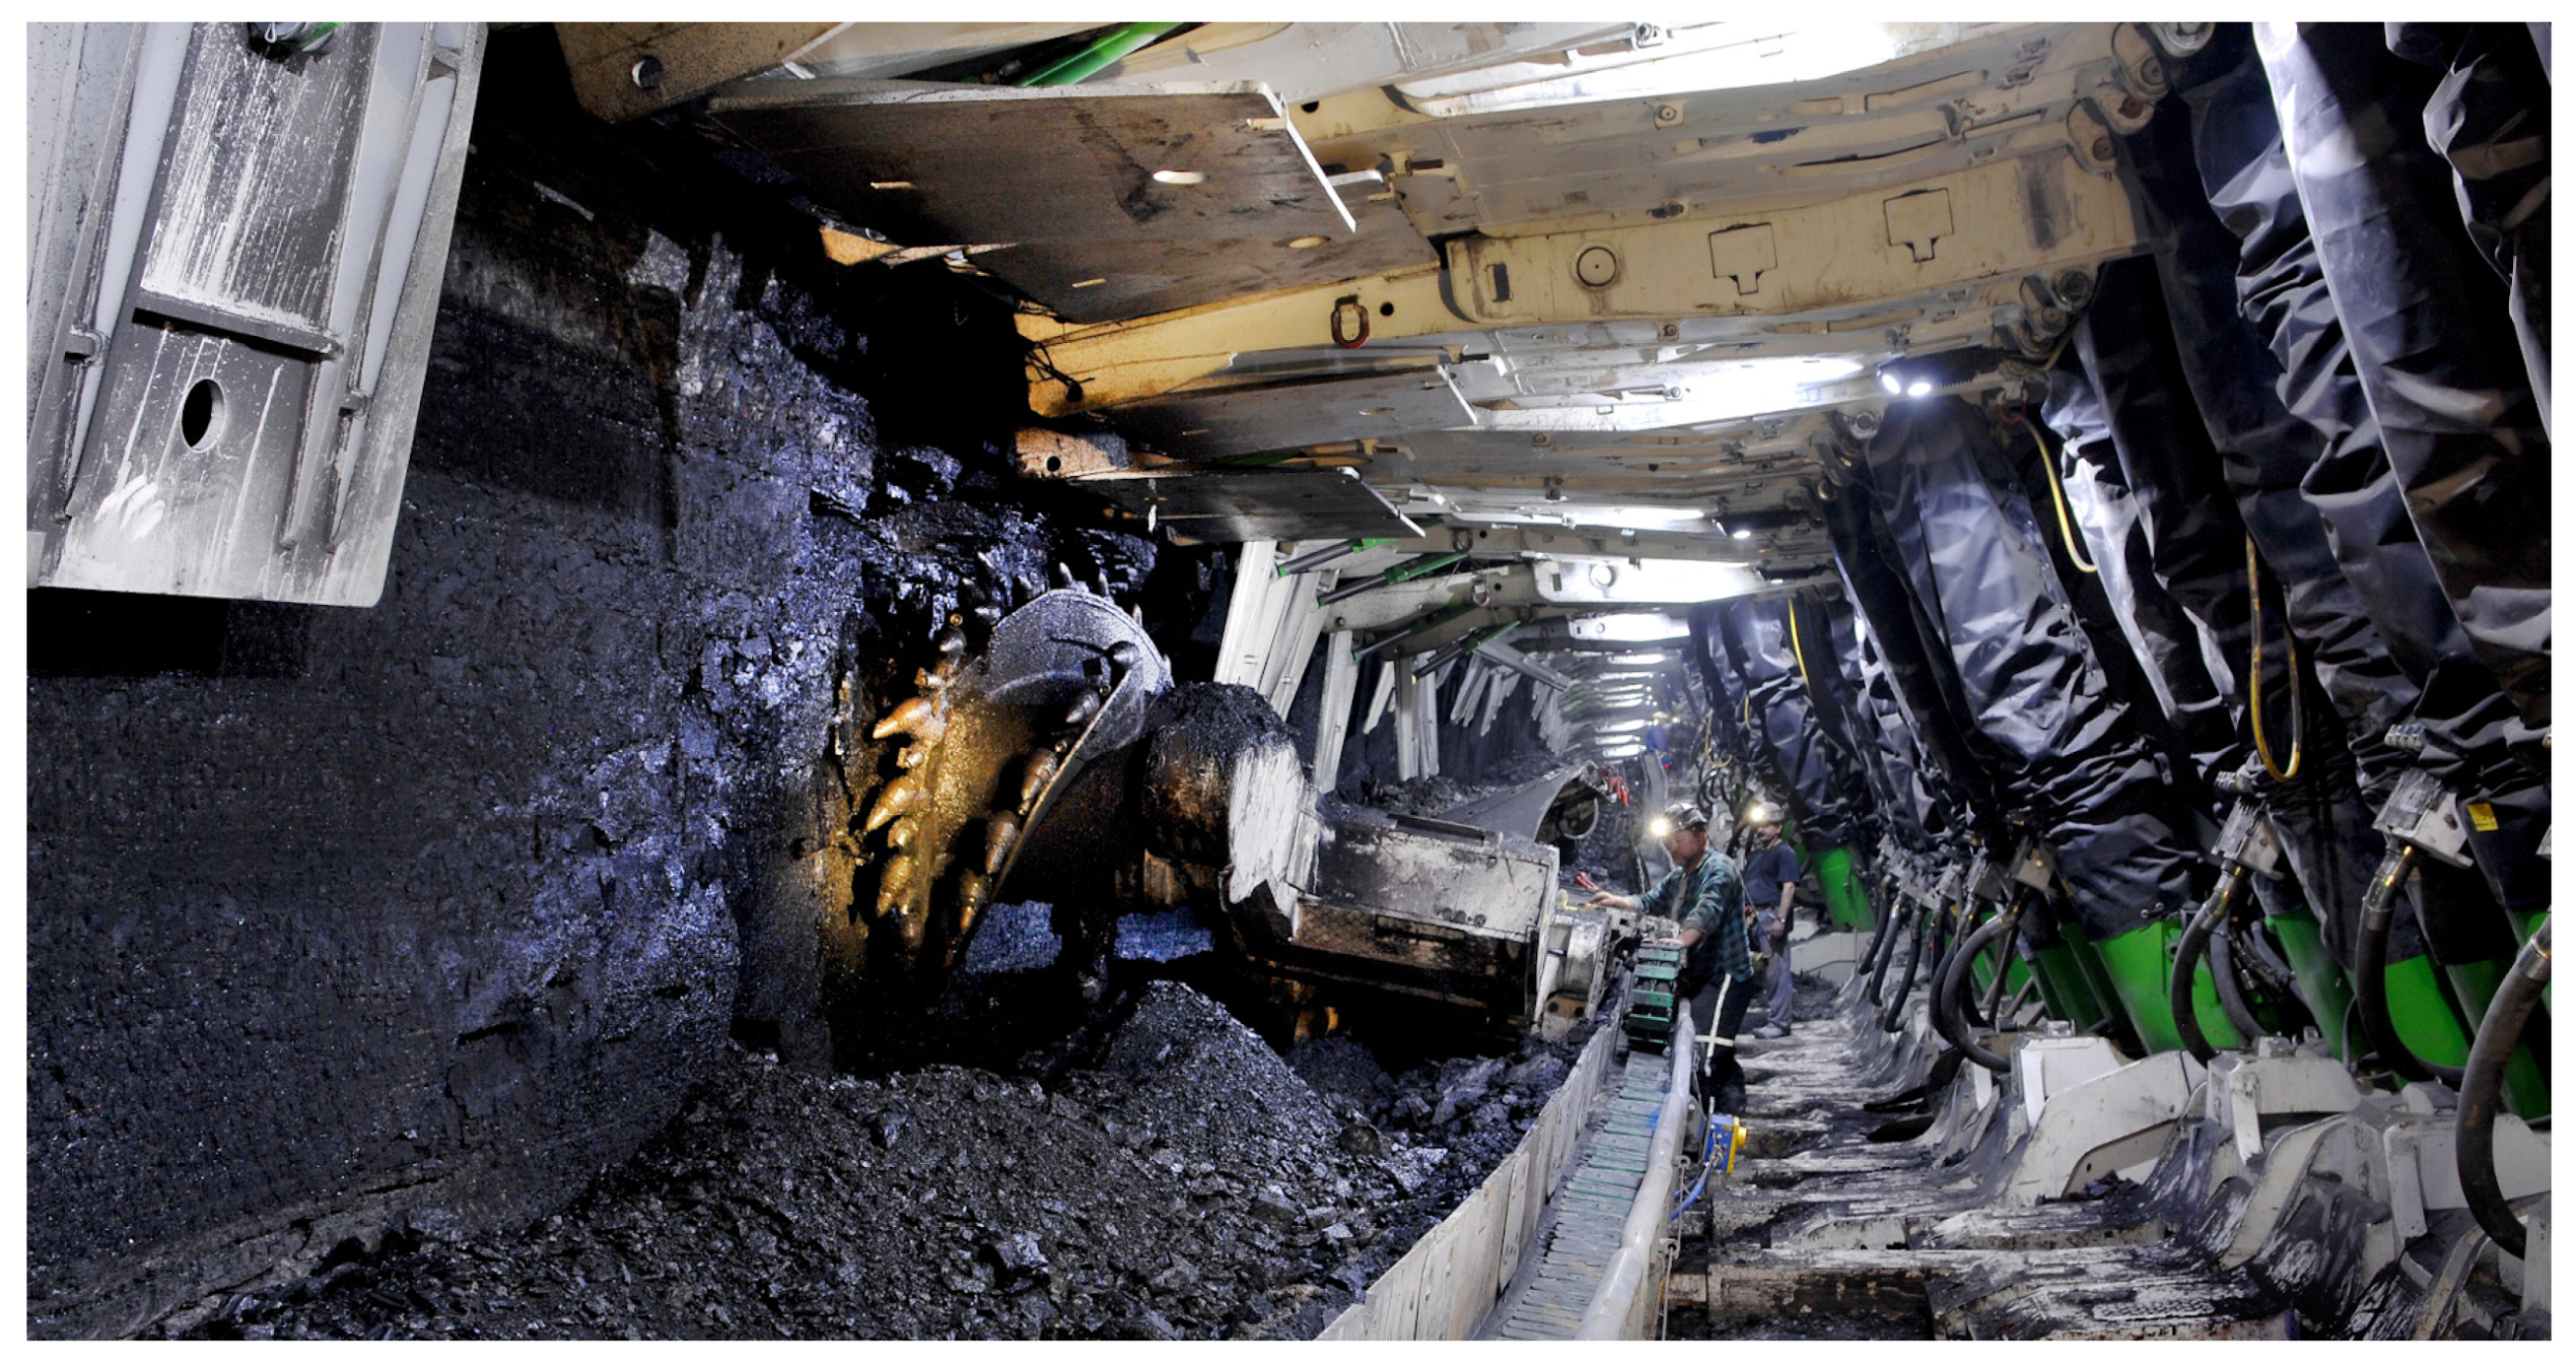
32]. Mining of coal is most often carried out in longwall faces which are equipped with a longwall complex, i.e., a set of machines and devices appropriately selected in terms of efficiency and mutual cooperation. The modern mechanised longwall complex consists of several basic elements, such as the cutting machine (a shearer or a plow); an armoured face conveyor (articulated chain conveyor, AFC); a mechanised roof support; a chain (overhead) conveyor with a crusher (beam stage loader, BSL); a hydraulic pump unit feeding the roof support; and a set of electrical power devices.
The longwall shearer is basically used for coal cutting and loading on the armoured face conveyor. AFC is used as a roadway for the shearer and for coal transport. The coal from AFC goes to BSL; then to a belt conveyor, and by a system of transportation to the main tank; and then to the surface by the vertical transport. In the case of high longwalls, crushers are sometimes used on a shearer in order to crush large lumps of coal. The next part of the longwall complex is mechanised roof support. It is used to prevent the roof from collapsing. From the technical point of view, it is also necessary for adjusting the AFC to the cut surface.
Figure 1 presents a view along a longwall face showing the longwall complex with connections between the mechanised roof supports on the right and AFC on the left.
To reduce the model size and the subset of attributes for the paper purposes, we focus on modelling the shearer behaviour only. A shearer consists of a machine body containing electric motors (haulages), hydraulic equipment and controls which are mounted over the AFC. Horizontal cutting drums (organs) are mounted on the face side of the machine, laced with cutting picks and rotate in a plane parallel to the longwall face.
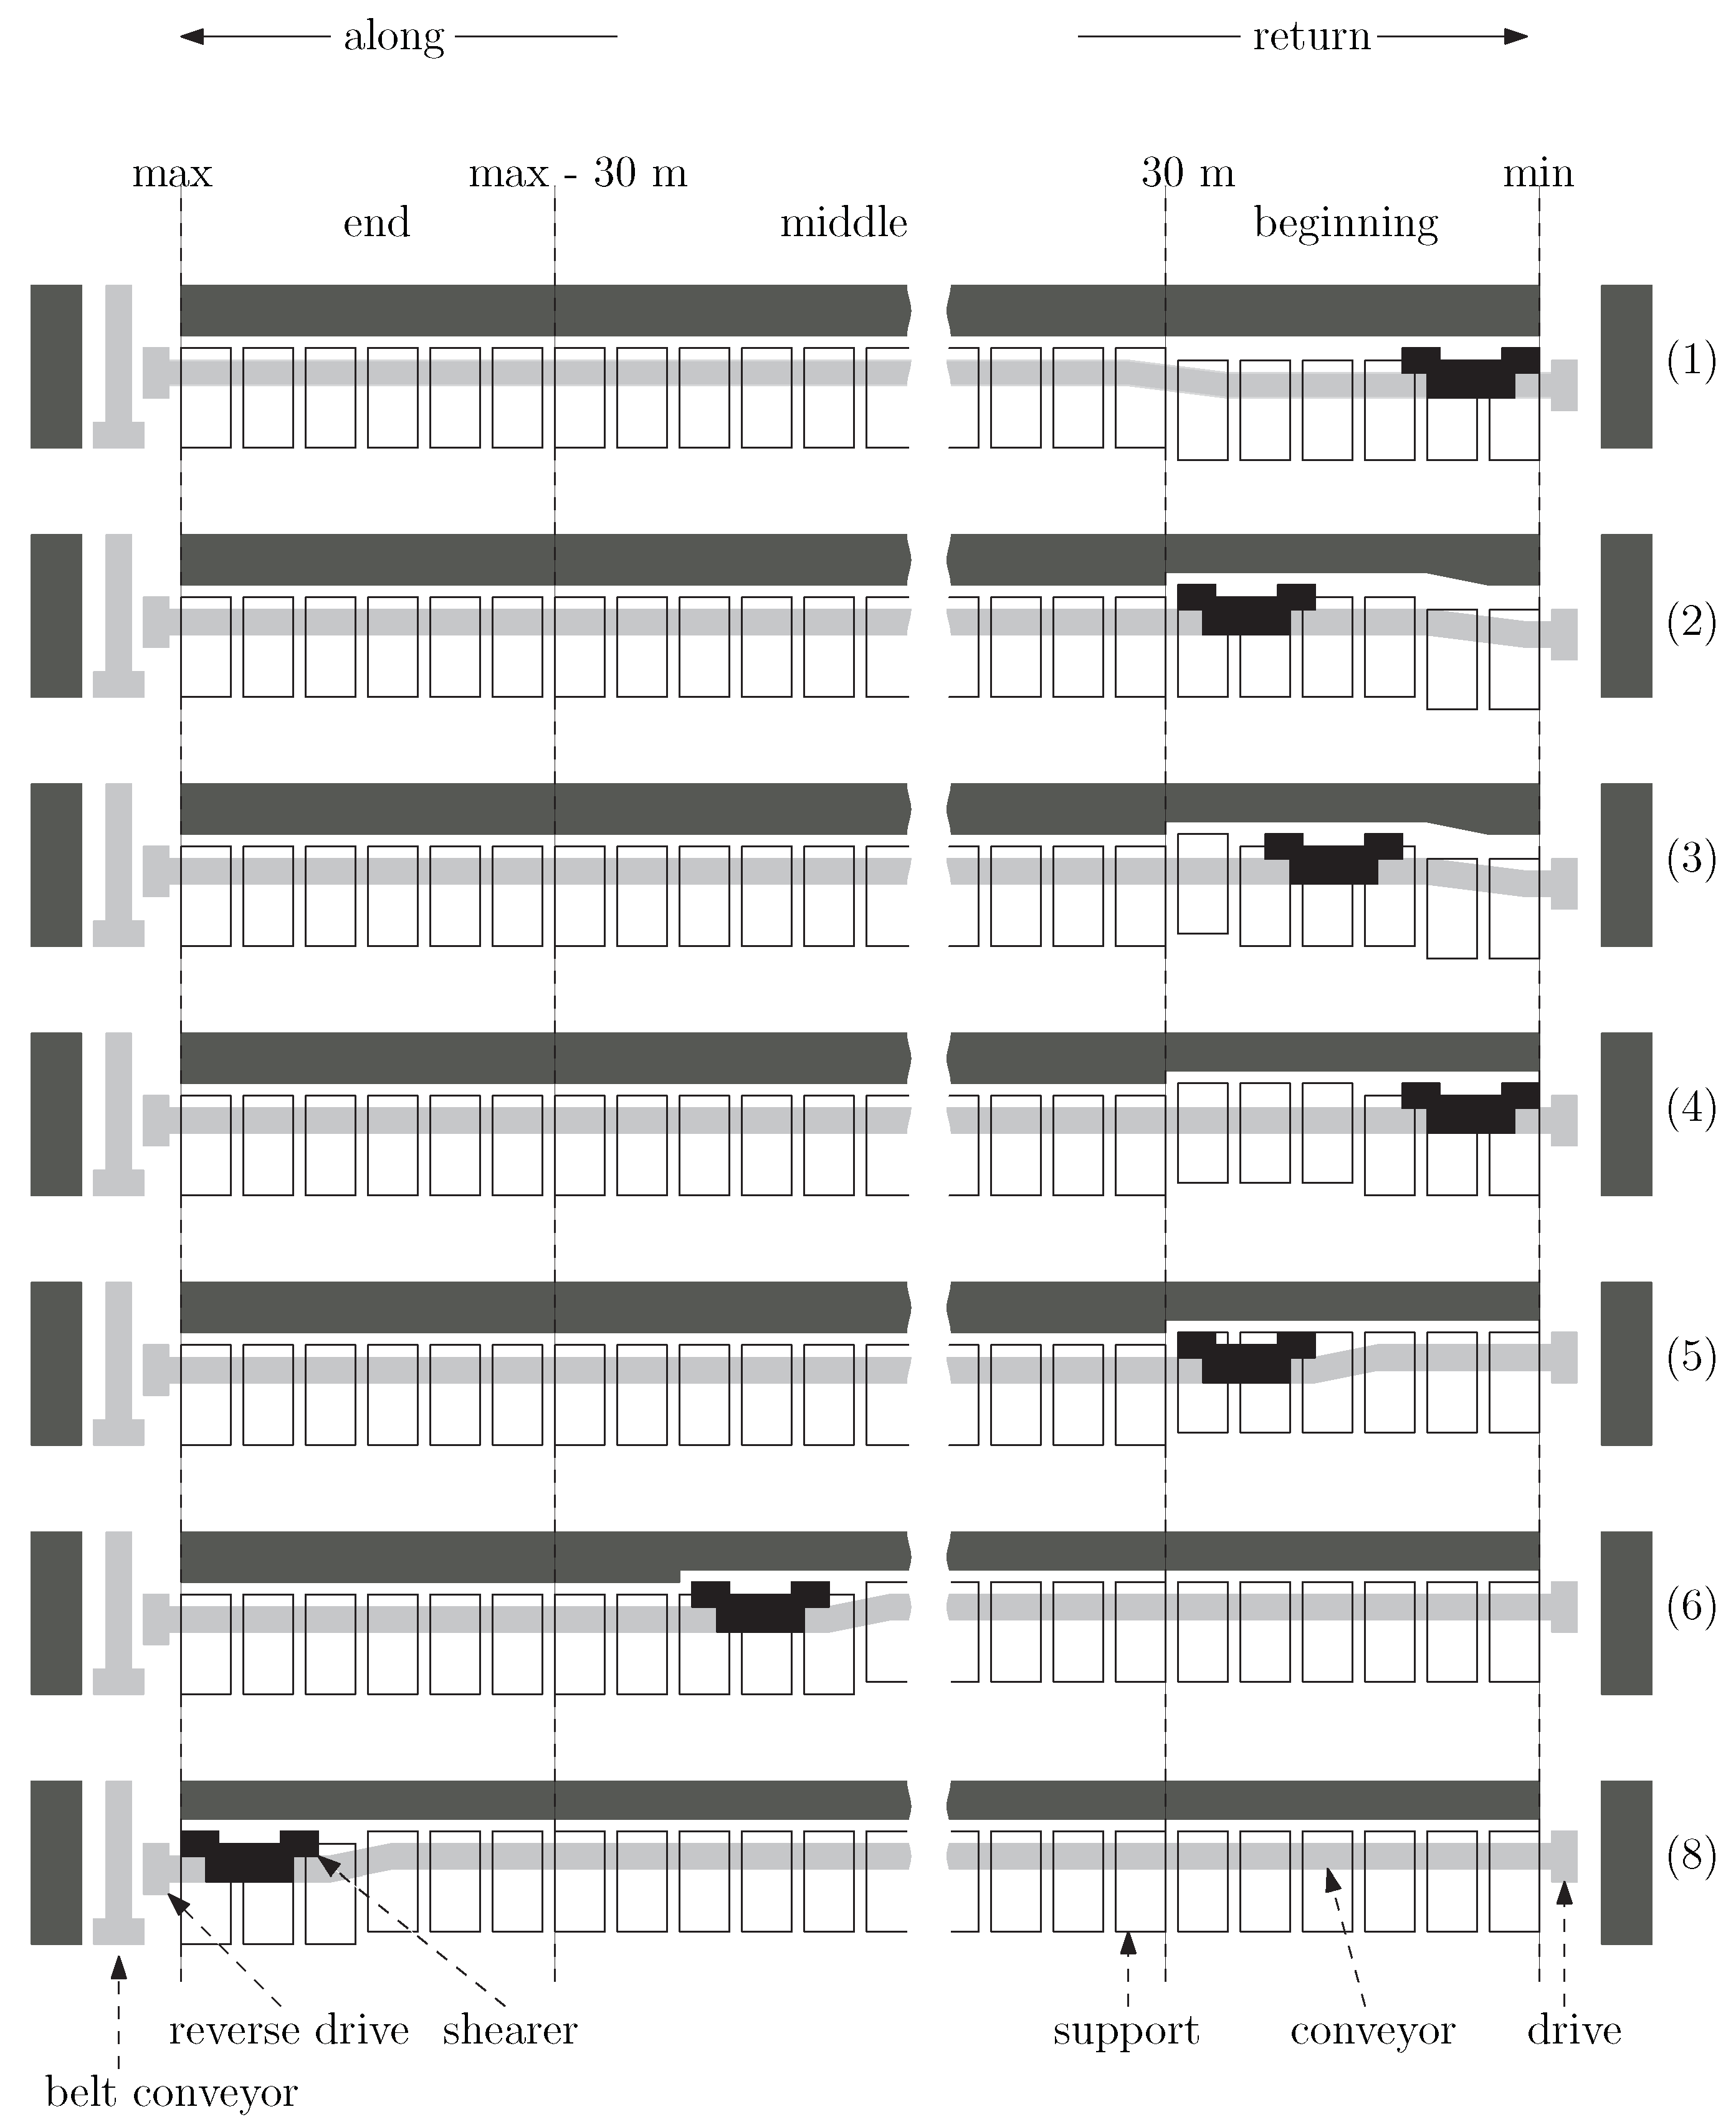
The longwall mining process can be defined as a cyclical implementation of a set of operations (activities) repeated in a specific order and time in a longwall face. The set of these activities depends on technology, equipment and work organisation. However, most often (i.e., in the technology of two-way mining with a shearer) they cover the activities shown in
Figure 2 [
32,
33]. Moving the support and conveyor follows the working shearer. Drive and reverse drive modes are performed at both ends of the longwall face.
The operations performed in the longwall face are monitored by various IT systems. The core information system in an underground mine is the dispatcher system [
34]. It collects data from IT systems implemented in a mine, e.g., monitoring of specific mining machinery; telemetric systems monitoring the mine atmosphere and automatic shutdown of electric devices in case of hazards occurrence; and TV monitoring enabling observation of important mining machinery and excavations.
The data in the longwall monitoring pipeline are mostly low-level data with different granularity. For the purpose of the shearer modelling, we focus on the subset of attributes presented in
Table 1.
Useful variables for shearer process description are: the main status of the shearer, currents on cutting drums and haulages (values of currents are expressed as the averages of three-phase currents), the direction of shearer movement, shearer arm movement, shearer speed, location of the shearer in the longwall and general direction of shearer movement. The abbreviations LDC, RDC, LHC and RHC in the Table correspond to left/right, drum/haulage currents respectively.
Figure 3 presents a description of the ideal shearer cycle with the denotation of general shearer position (beginning, middle and end of the longwall face) and enumerated process stages.
The main operation stages of the shearer are related to the coal cutting. The cutting stage can occur in any location in the longwall face. The return to the drive stage can occur only at the beginning or at the end of the longwall face. There are also other characteristic stages at the beginning and end of the longwall face, named the stoppage in on mode (marked in
Figure 3 with bullets). They are strictly related to planned changes in the positions of the organs. The detailed description of the shearer operation stages is presented in
Table 2.
4. Our Approach in a Nutshell
The overview of the approach presented in this paper is given in
Figure 4. The method uses place-transition Petri nets [
35,
36] for modelling of the operations of the longwall shearer. The model was built based on expert knowledge and represents the behaviour of industrial machinery at such a level of abstraction that we can distinguish important stages of the machinery’s operation.
On the other hand, the trace of the actual behaviour of the industrial machinery takes the form of data records that store the sensors readings. Any such record can be mapped to a marking of the considered Petri net model automatically. Thus, because of the one-to-one correspondence between the sensors’ readings and formal model states, a real-time mapping of the machinery’s behaviour to a path in the reachability graph is possible.
Such an analysis can reveal two types of errors. Type I error means a situation where we cannot assign a legal model marking to the given log record. Type II error denotes a situation where we found two different consecutive markings that are not connected by an arc in the reachability graph. Regardless of the type of error, its occurrence indicates the unusual behaviour of the shearer and is a signal for a detailed analysis of such a situation.
5. The Formal Model of the Shearer Operation
The formal model is a crucial part of the presented approach. Based on expert knowledge, the model represents the shearer behaviour in a way convenient for non-experts. We decided to use place-transition Petri nets with inhibitor arcs [
37] for modelling purposes. The subclass of Petri nets is supported by TINA software (See the project webpage at
http://projects.laas.fr/tina//, [
36]). The tool can be used for model development, interactive model simulation and formal model analysis. The net can be formally defined as follows:
Definition 1. A place-transition net with inhibitor arcs is a tuple , where
P and T are finite sets of places and transitions such that ;
is the flow relation;
is the inhibiting relation;
is the initial marking, where .
The preset of a transition t is the set ; the postset of t is the set . The inhibitor set of a transition t is the set . A marking M is a mapping ; i.e., it is a distribution of tokens in places of the net.
Definition 2. A transition t is enabled in a marking M iff If a transition t is enabled in a marking M, it may fire, changing the marking M to a marking , such that for any We write to denote the change of markings. A firing sequence starting at marking M is a sequence of transitions such that there exists a sequence of markings such that . In such a case we say that leads from M to and that is reachable from M. Am empty firing sequence leads from M to M. The set of all markings that are reachable from M is denoted by .
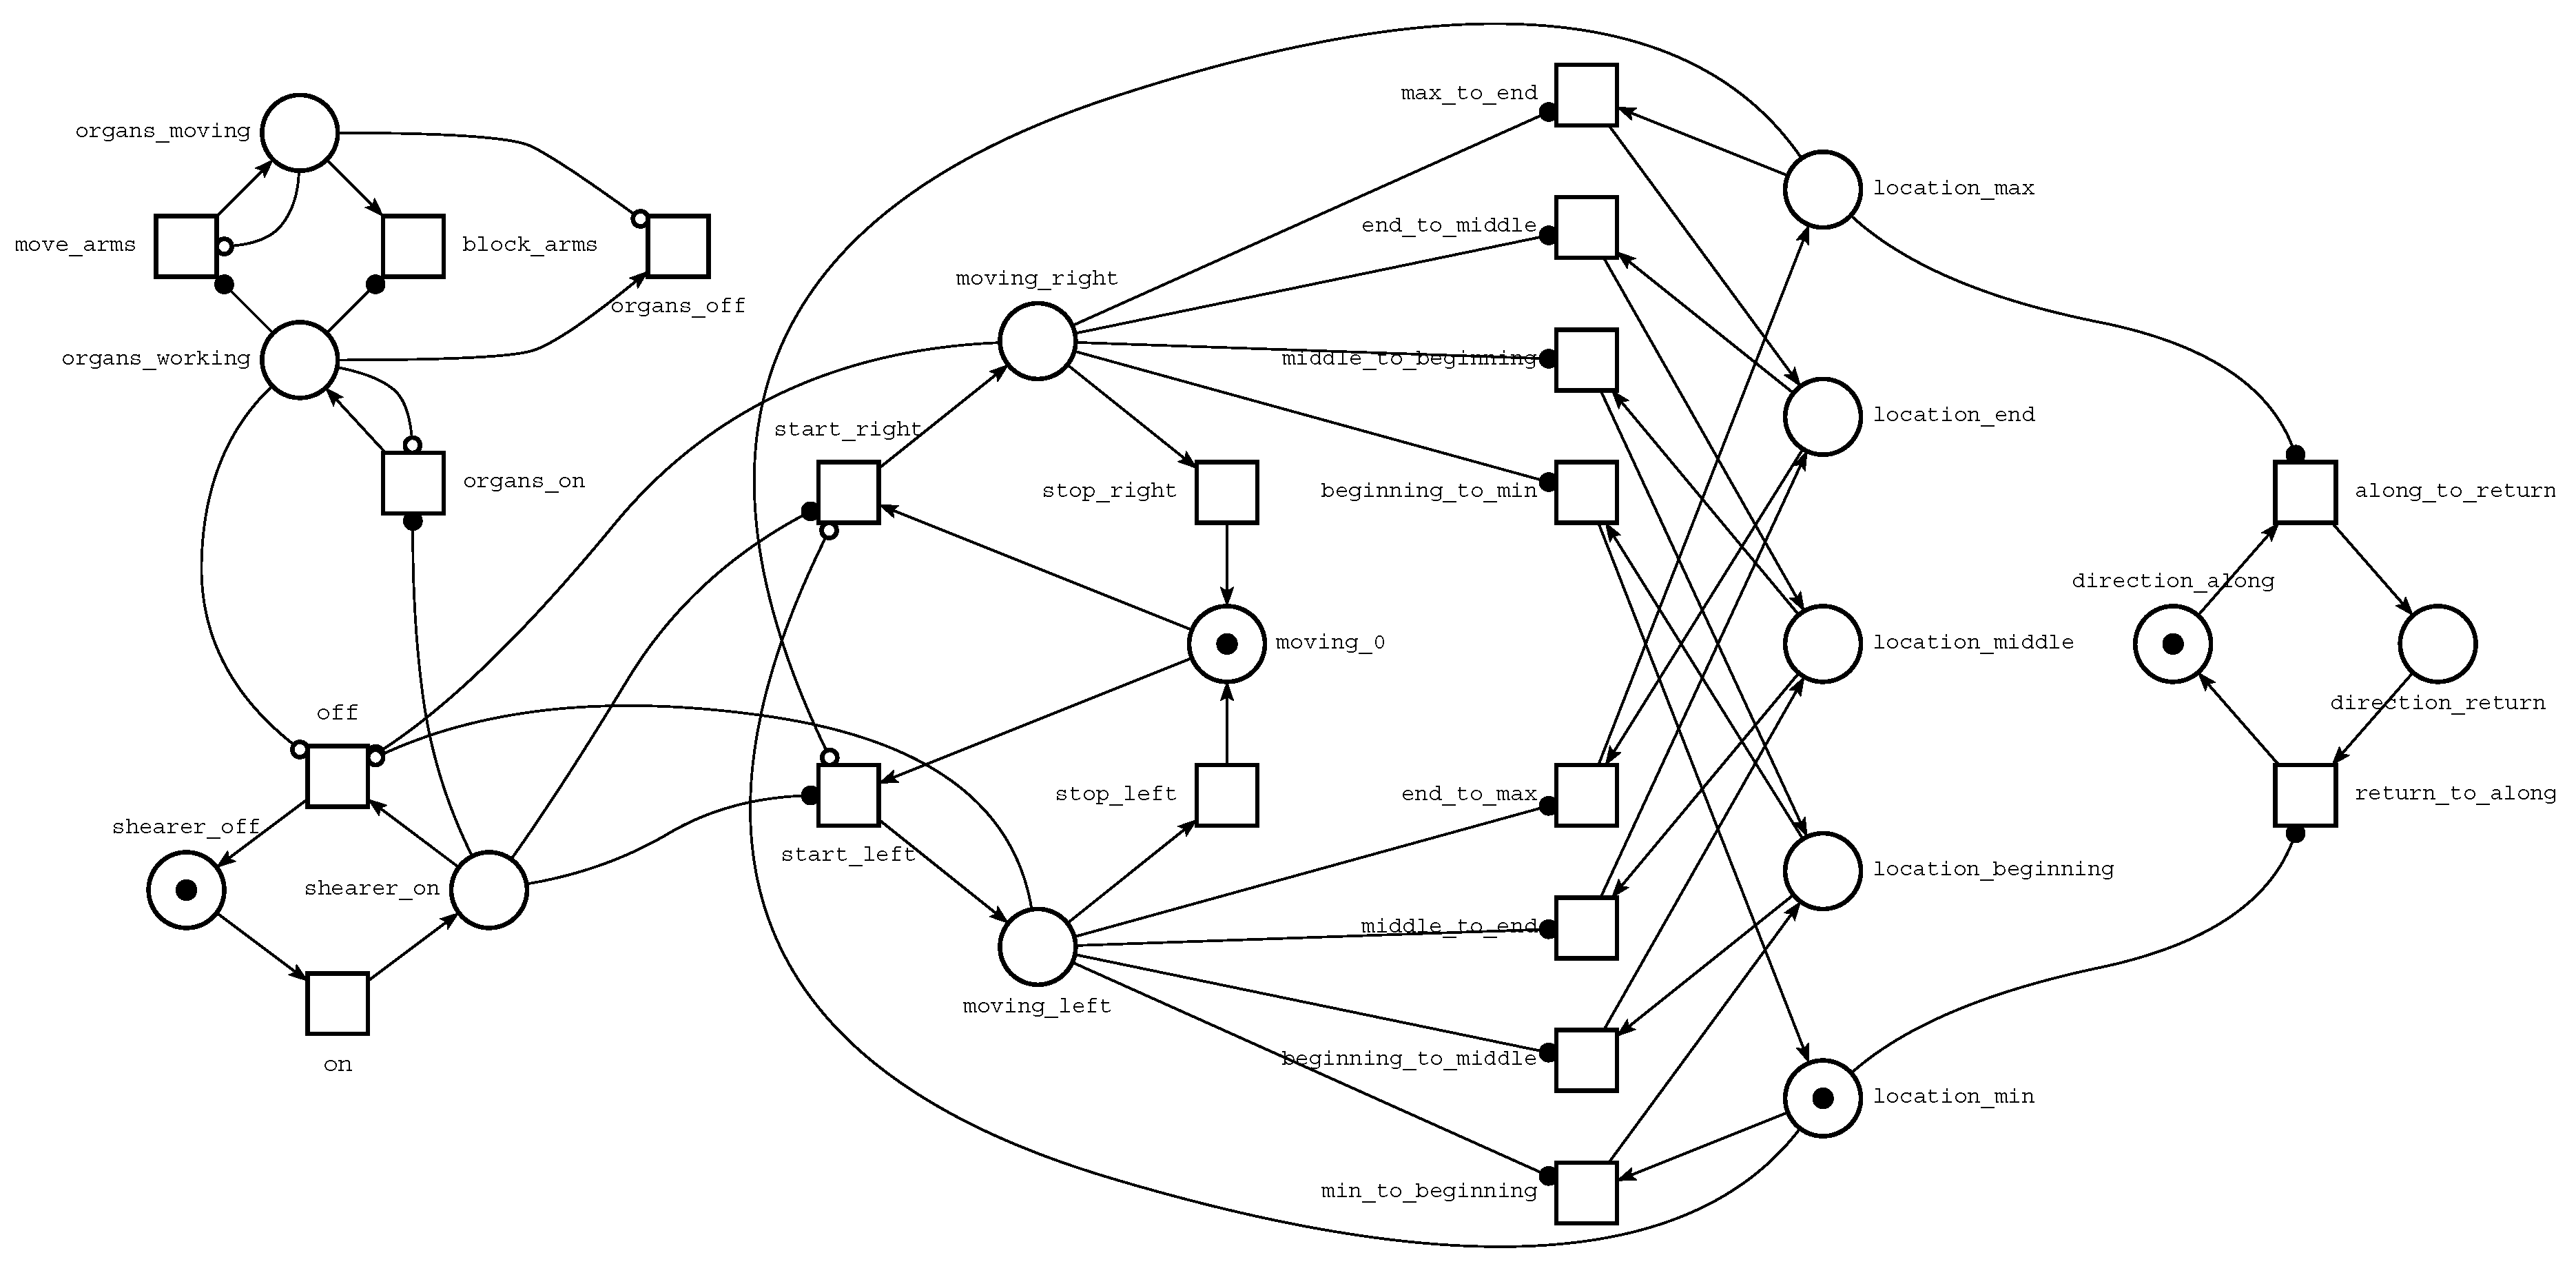
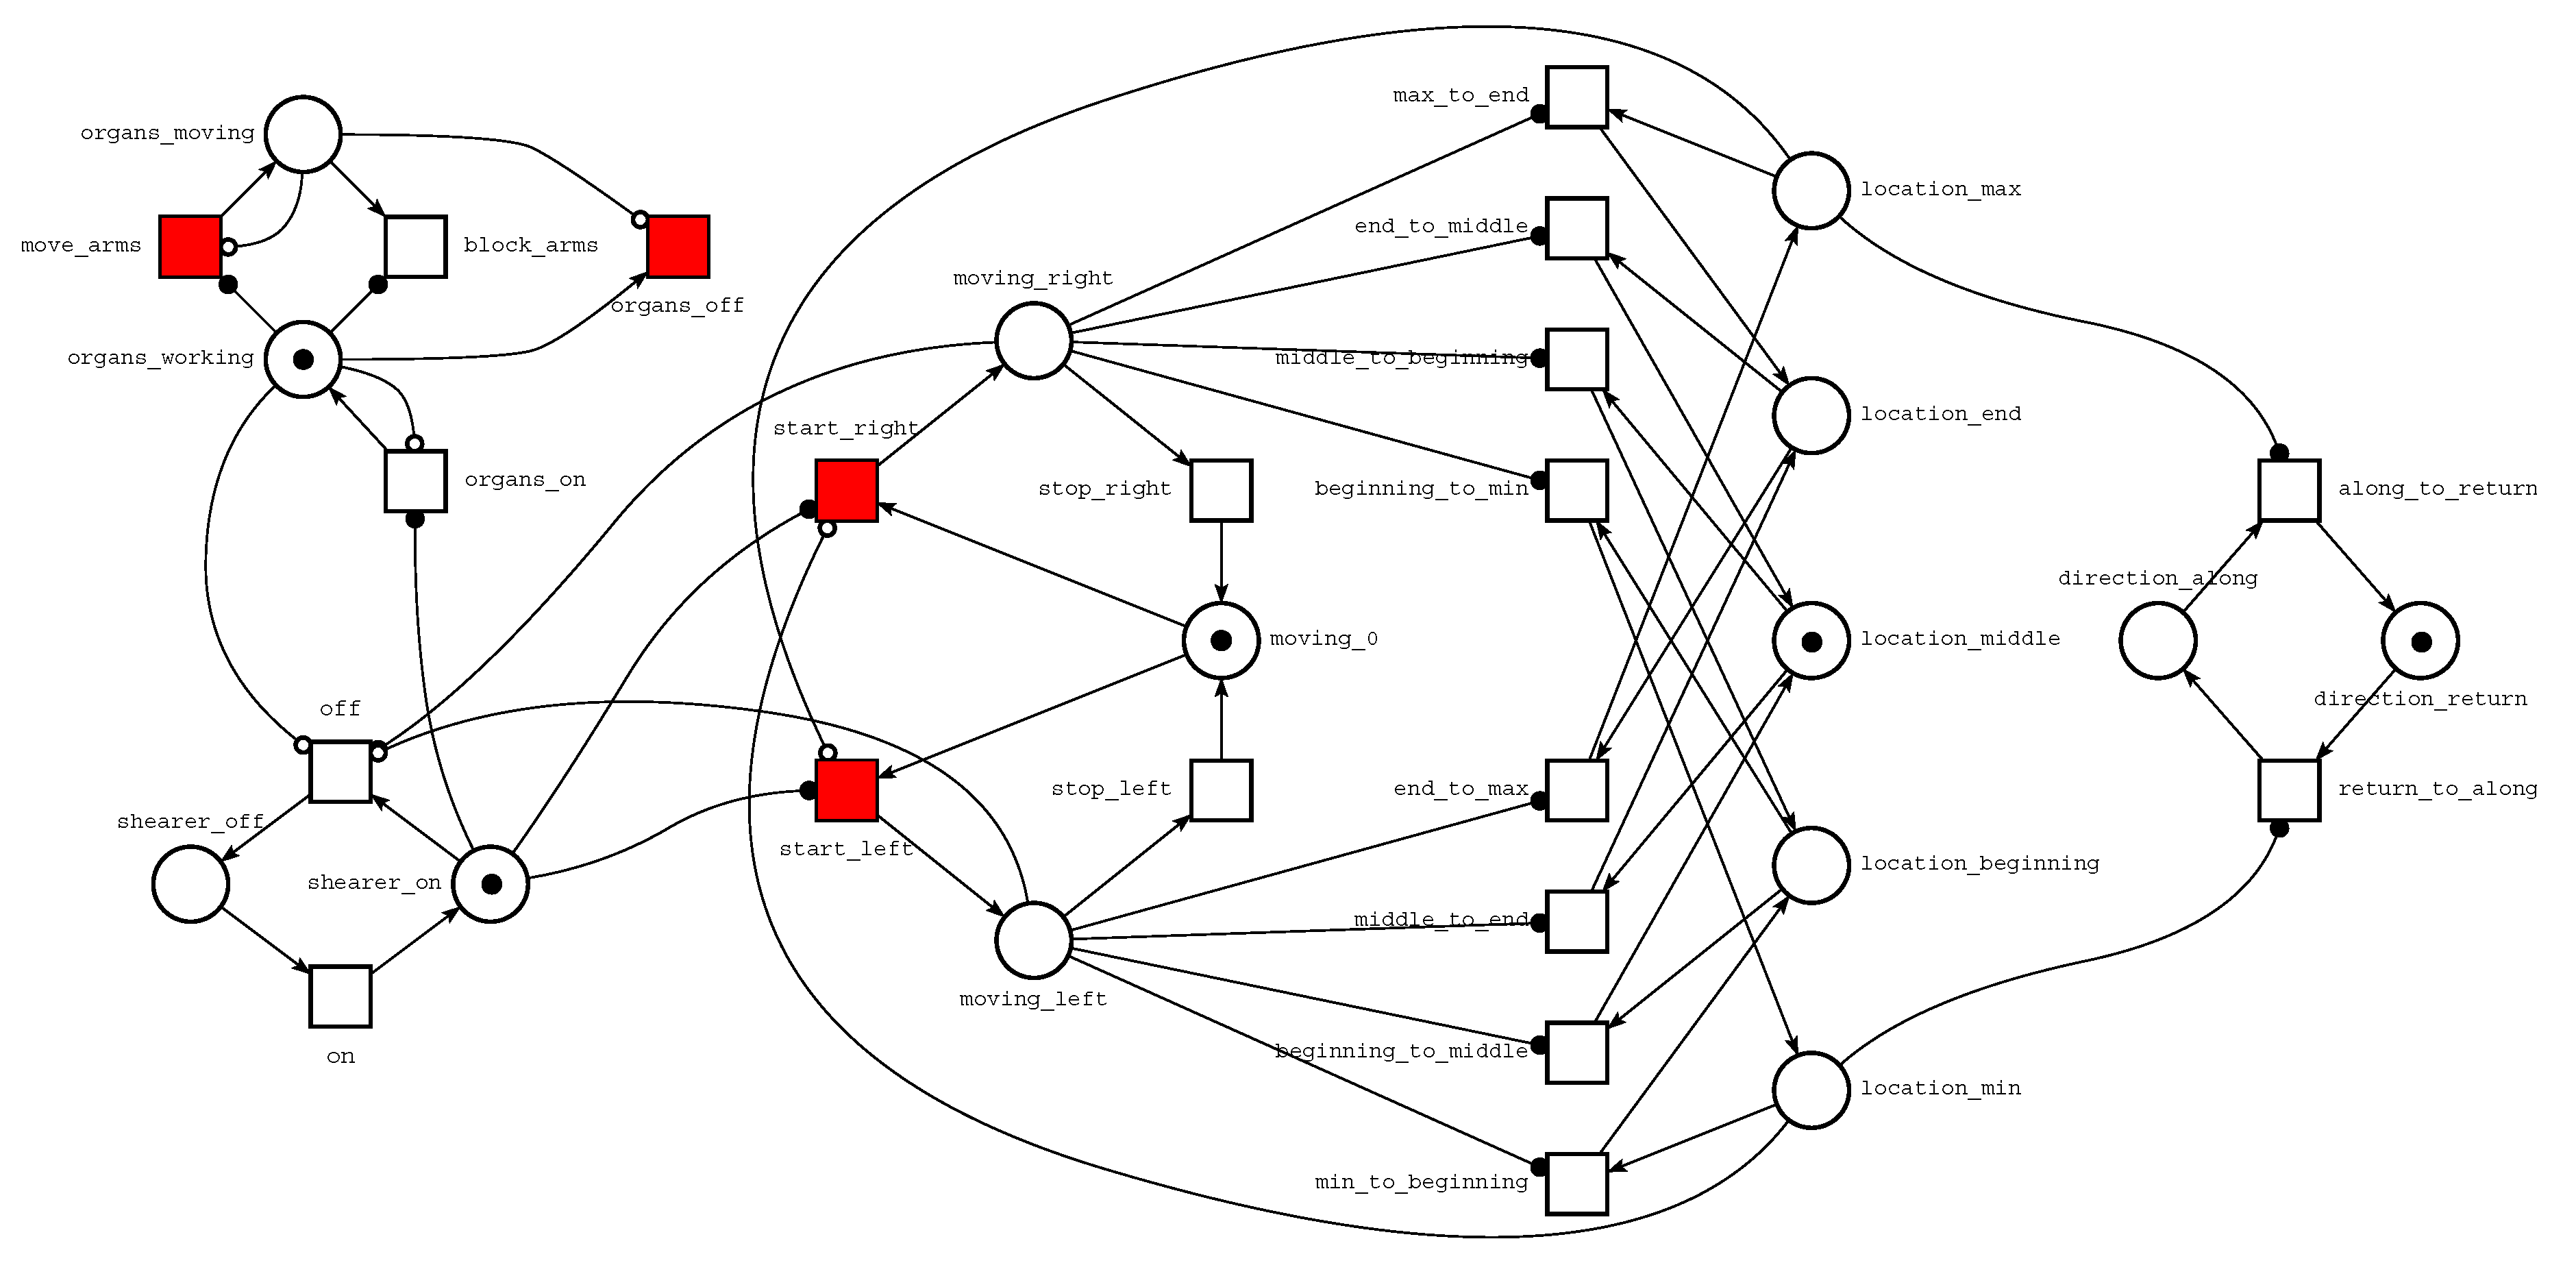
A Petri net model of a shearer is shown in
Figure 5. Let us focus on transition move_arms and places organs_working and organs_moving. The TINA software uses an empty-circle arrowhead to denote an inhibitor arc. Such an arc leads from place organs_moving to transition move_arms, which means that the place must be empty if the transition is enabled. We say that there is a self-loop on a given place
p and transition
t if both
and
. This means that if
t fires, it removes a token from
p and adds back a token to
p. In other words,
t only tests the presence of a token in place
p. To make a model more readable, TINA provides read arcs to represent self loops. It uses filled-circle arrowheads to denote read arcs. Such an arc leads from place organs_working to transition move_arms, which means that there must be a token in the place if the transition is enabled.
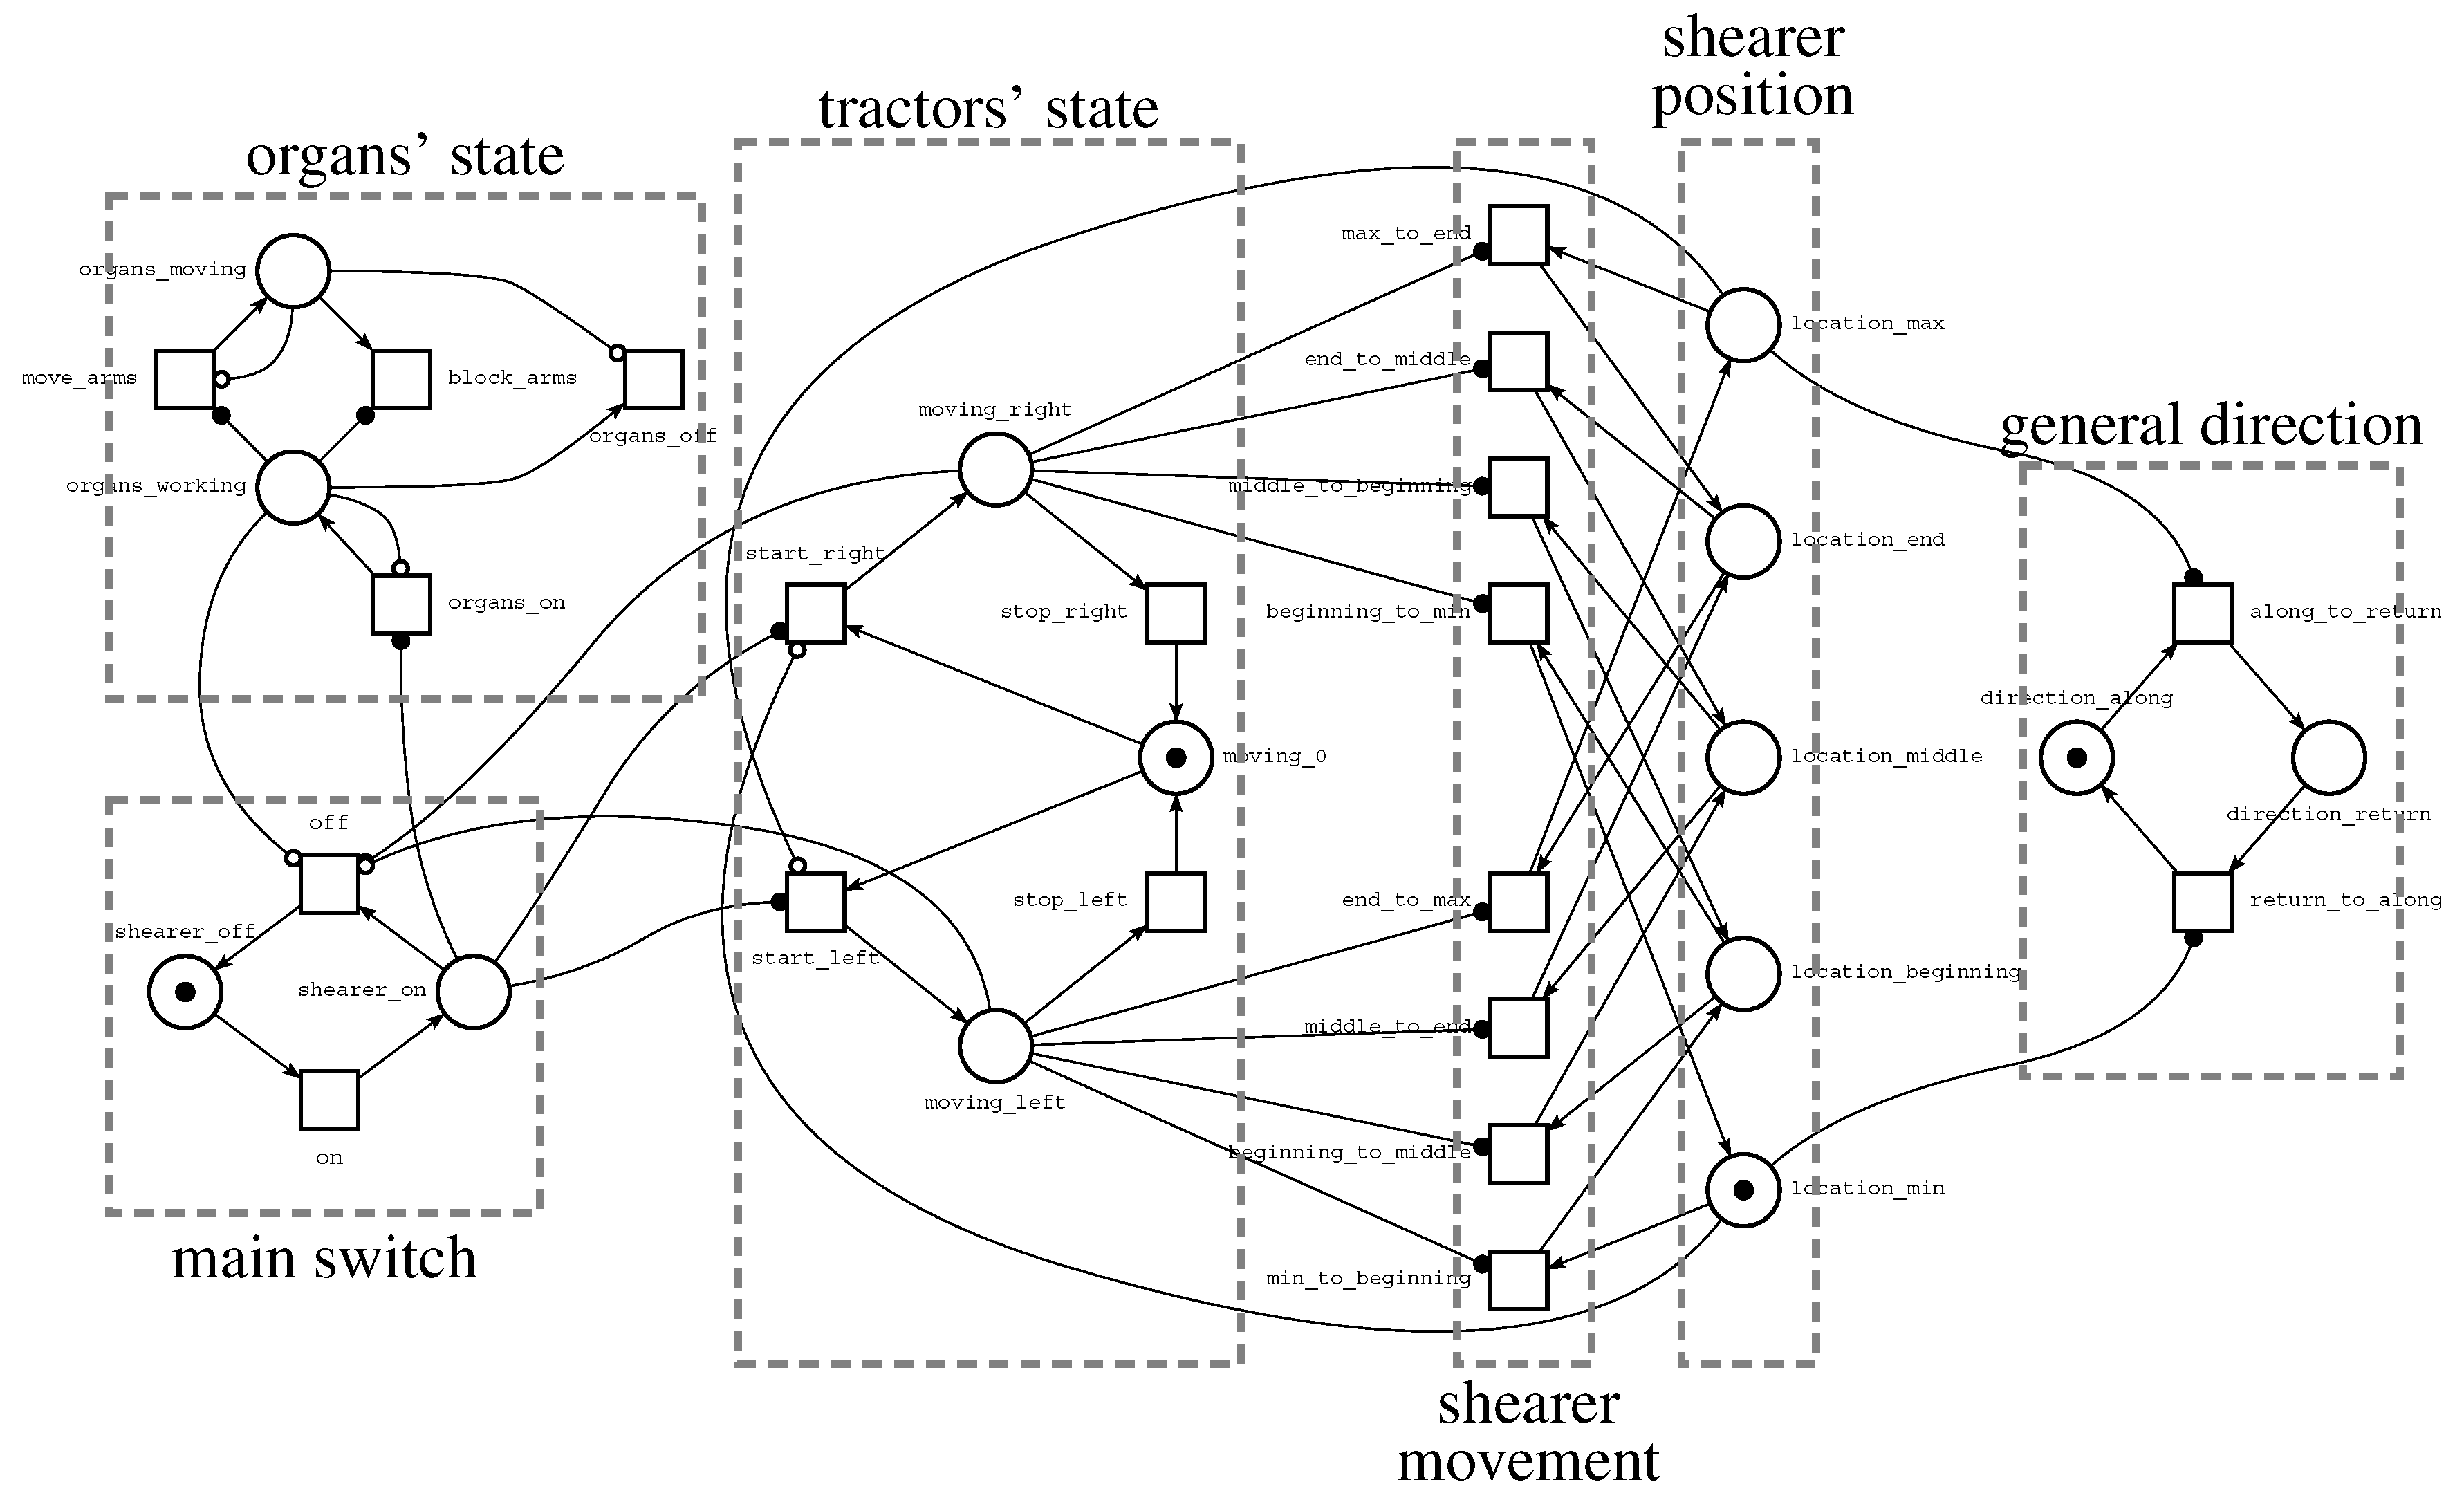
The Petri net presented in
Figure 5 mimics the behaviour of a coal mine shearer and was built to identify the current shearer stage, as shown in
Figure 3 or its illegal (unsafe) behaviour. The meanings of different parts of the model are shown in
Figure 6. The main switch part represents the process of preparing the shearer to work. A token in place shearer_on denotes that all systems (parts of shearer) have been checked and are ready to work. The organs’ state submodel represents the behaviour of shearer arms and organs. Both organs are working or are disabled at the same time. The tractor’s state part models tractor’s behaviour. Three modes are possible: moving right, moving left or stoppage. The shearer position part represents the position of the shearer (see
Figure 3). Transitions from the shearer movement part are used to change the position. Finally, the general direction subnet is used to set the general shearer direction: along or return.
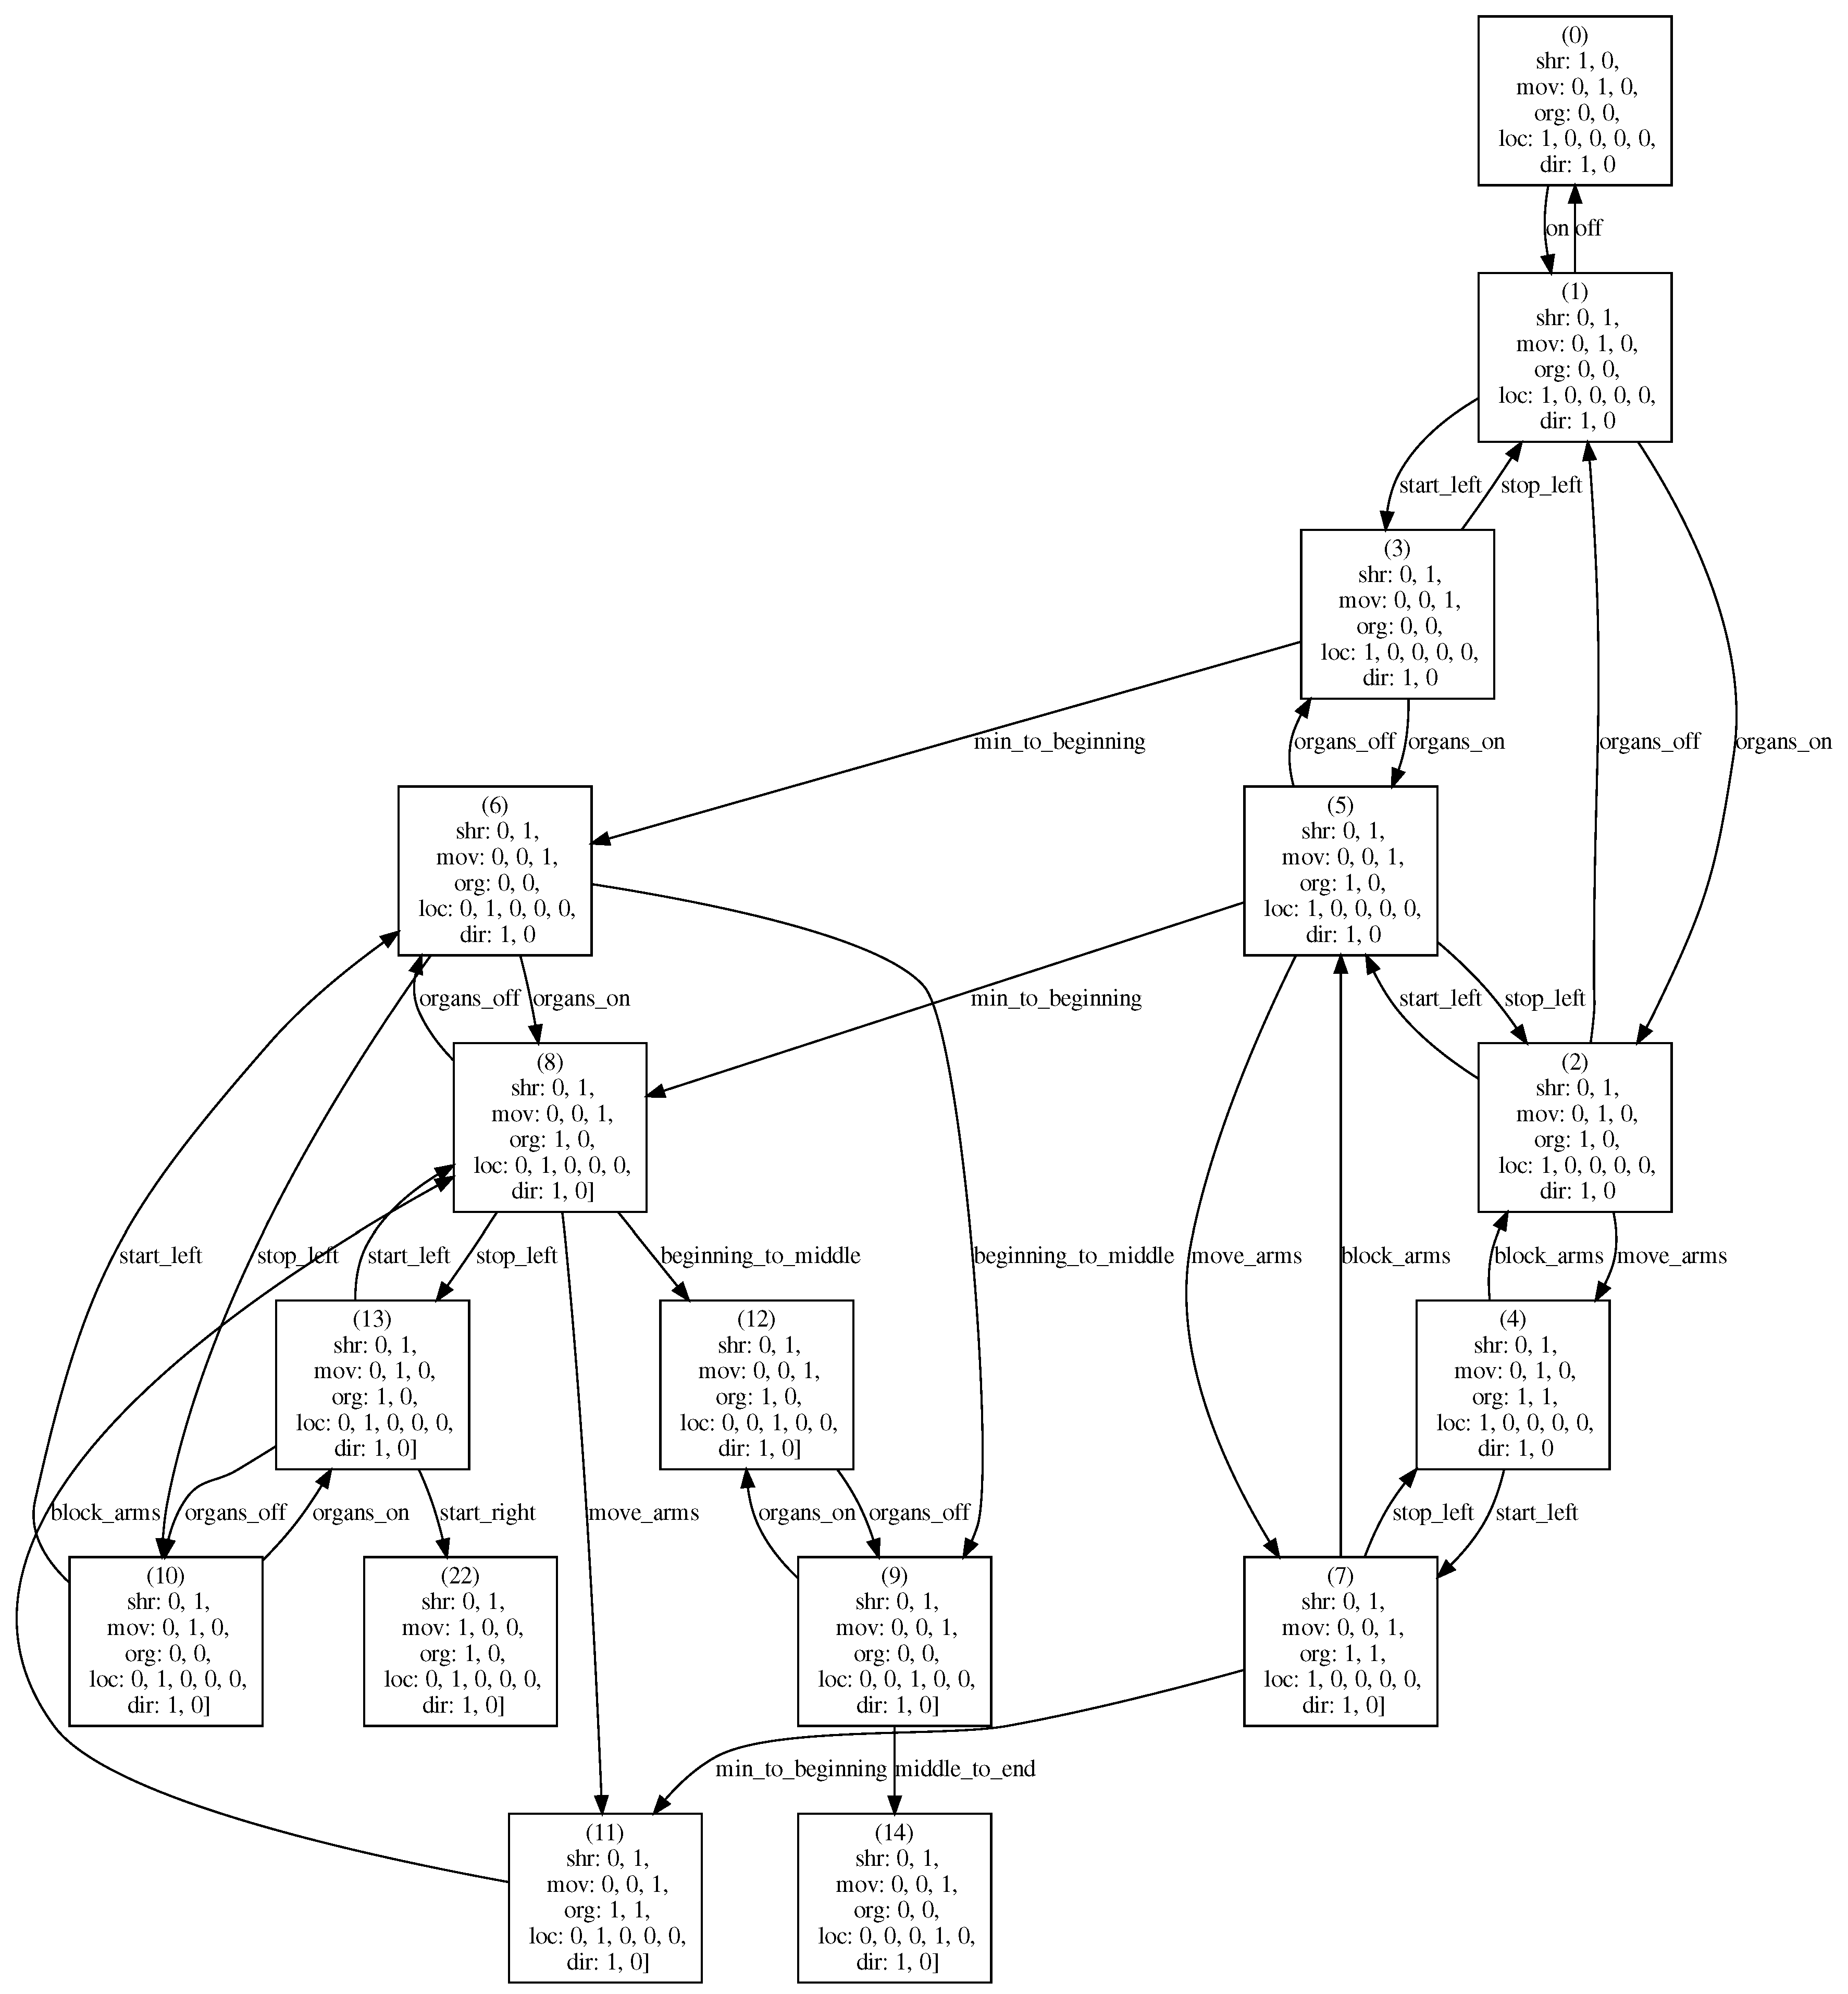
The state-space of a Petri net model is represented using a reachability graph [
35]. The nodes of such a graph represent reachable model’s states. Each arc is labelled with the transition name that leads from the arc source to destination marking. The TINA tool can be used to generate a reachability graph automatically. The reachability graph generated for the model presented in
Figure 5 contains 80 markings and 220 arcs.
Let us assume that the set of places of the Petri net is ordered as follows:
shearer_off, shearer_on, moving_right, moving_0, moving_left, organs_working, organs_moving, location_min, location_beginning, location_middle, location_end, location_max, direction_along, direction_return }. A small part of the reachability graph is shown in
Figure 7. To make the states more readable, markings are broken into four lines and some extra labels are included. Moving along a path in the graph, we can track the consecutive stages of the modelled machinery behaviour.
Selected results of application of the model for a shearer operation analysis are presented in the next section.
6. Experimental Results
Information gathered from the longwall machinery contains values for more than 150 attributes. Only a small subset, as shown in
Table 1, is necessary to identify the current state of the shearer. To show the usability of the presented approach, we used samples of data collected from a coal mine in Poland where Famur equipment is used. Each sample contains between 50,000 and 200,000 records—data collected once a second. In this case, an offline analysis of historical data was carried out, but the same approach can be applied online while a shearer is working. A few records taken from one of the samples are shown in
Table 3.
To supervise a shearer’s work using its formal model, firstly, we have to map the current sensors’ readings into a marking of the Petri net. The mapping rules are as follows:
The marking of places from the general direction subnet (see
Figure 6) is defined based on the direction attribute value; i.e., if the value is equal to along, place direction_along is marked. Otherwise, if the value is equal to return, place direction_return is marked.
The marking of places from the shearer position subnet is defined based on the SM_Location attribute value. Even when analysing samples gathered for the same longwall, the minimum and maximum position may be slightly different. The position of the shearer is estimated based on the distance from its end point, but an end point is defined by pressing a reset button on the remote control by the shearer operator. Thus, we cannot be sure that the reset button is always used at the same real locations. If the shearer position is equal to its minimal location, then place location_min is marked; if the value belongs to the interval
, then place location_beginning is marked, etc. (see
Figure 2 for the descriptions of the middle and end sections).
The marking of places from the tractor’s state subnet is defined based on the values of attributes speed, Move_Left and Move_Right. If Speed , place moving_0 is marked. Otherwise, the values of the other two attributes are used to determine which of the places moving_left and moving_right should be marked.
Finally, the place organs_moving is marked if at least one value of the attributes Right_Arm_Up, Right_Arm_Down, Left_Arm_Up and Left_Arm_Down is equal to true. The place organs_working is marked if arms are moving or at least one value of the attributes LDC, RDC is greater than 0.
Petri net’s markings that correspond to the records in
Table 3 are shown in
Table 4.
The second stage is to track the path in the reachability graph that corresponds to current shearer state changes. If two consecutive shearer’s stages map to the same marking, nothing happens from the formal model’s point of view (records 42519, 42520 and 42521 all map to the marking 74). If they map to two different markings M and , then it is necessary to check whether there exists an arc leading from M to (see records 42521 and 42522 that map to different markings).
Sometimes changes between two consecutive shearer states are not expressed by firing a single transition. If such a change can be expressed by firing two transitions, we can choose whether it is to be reported in the analysis log or not.
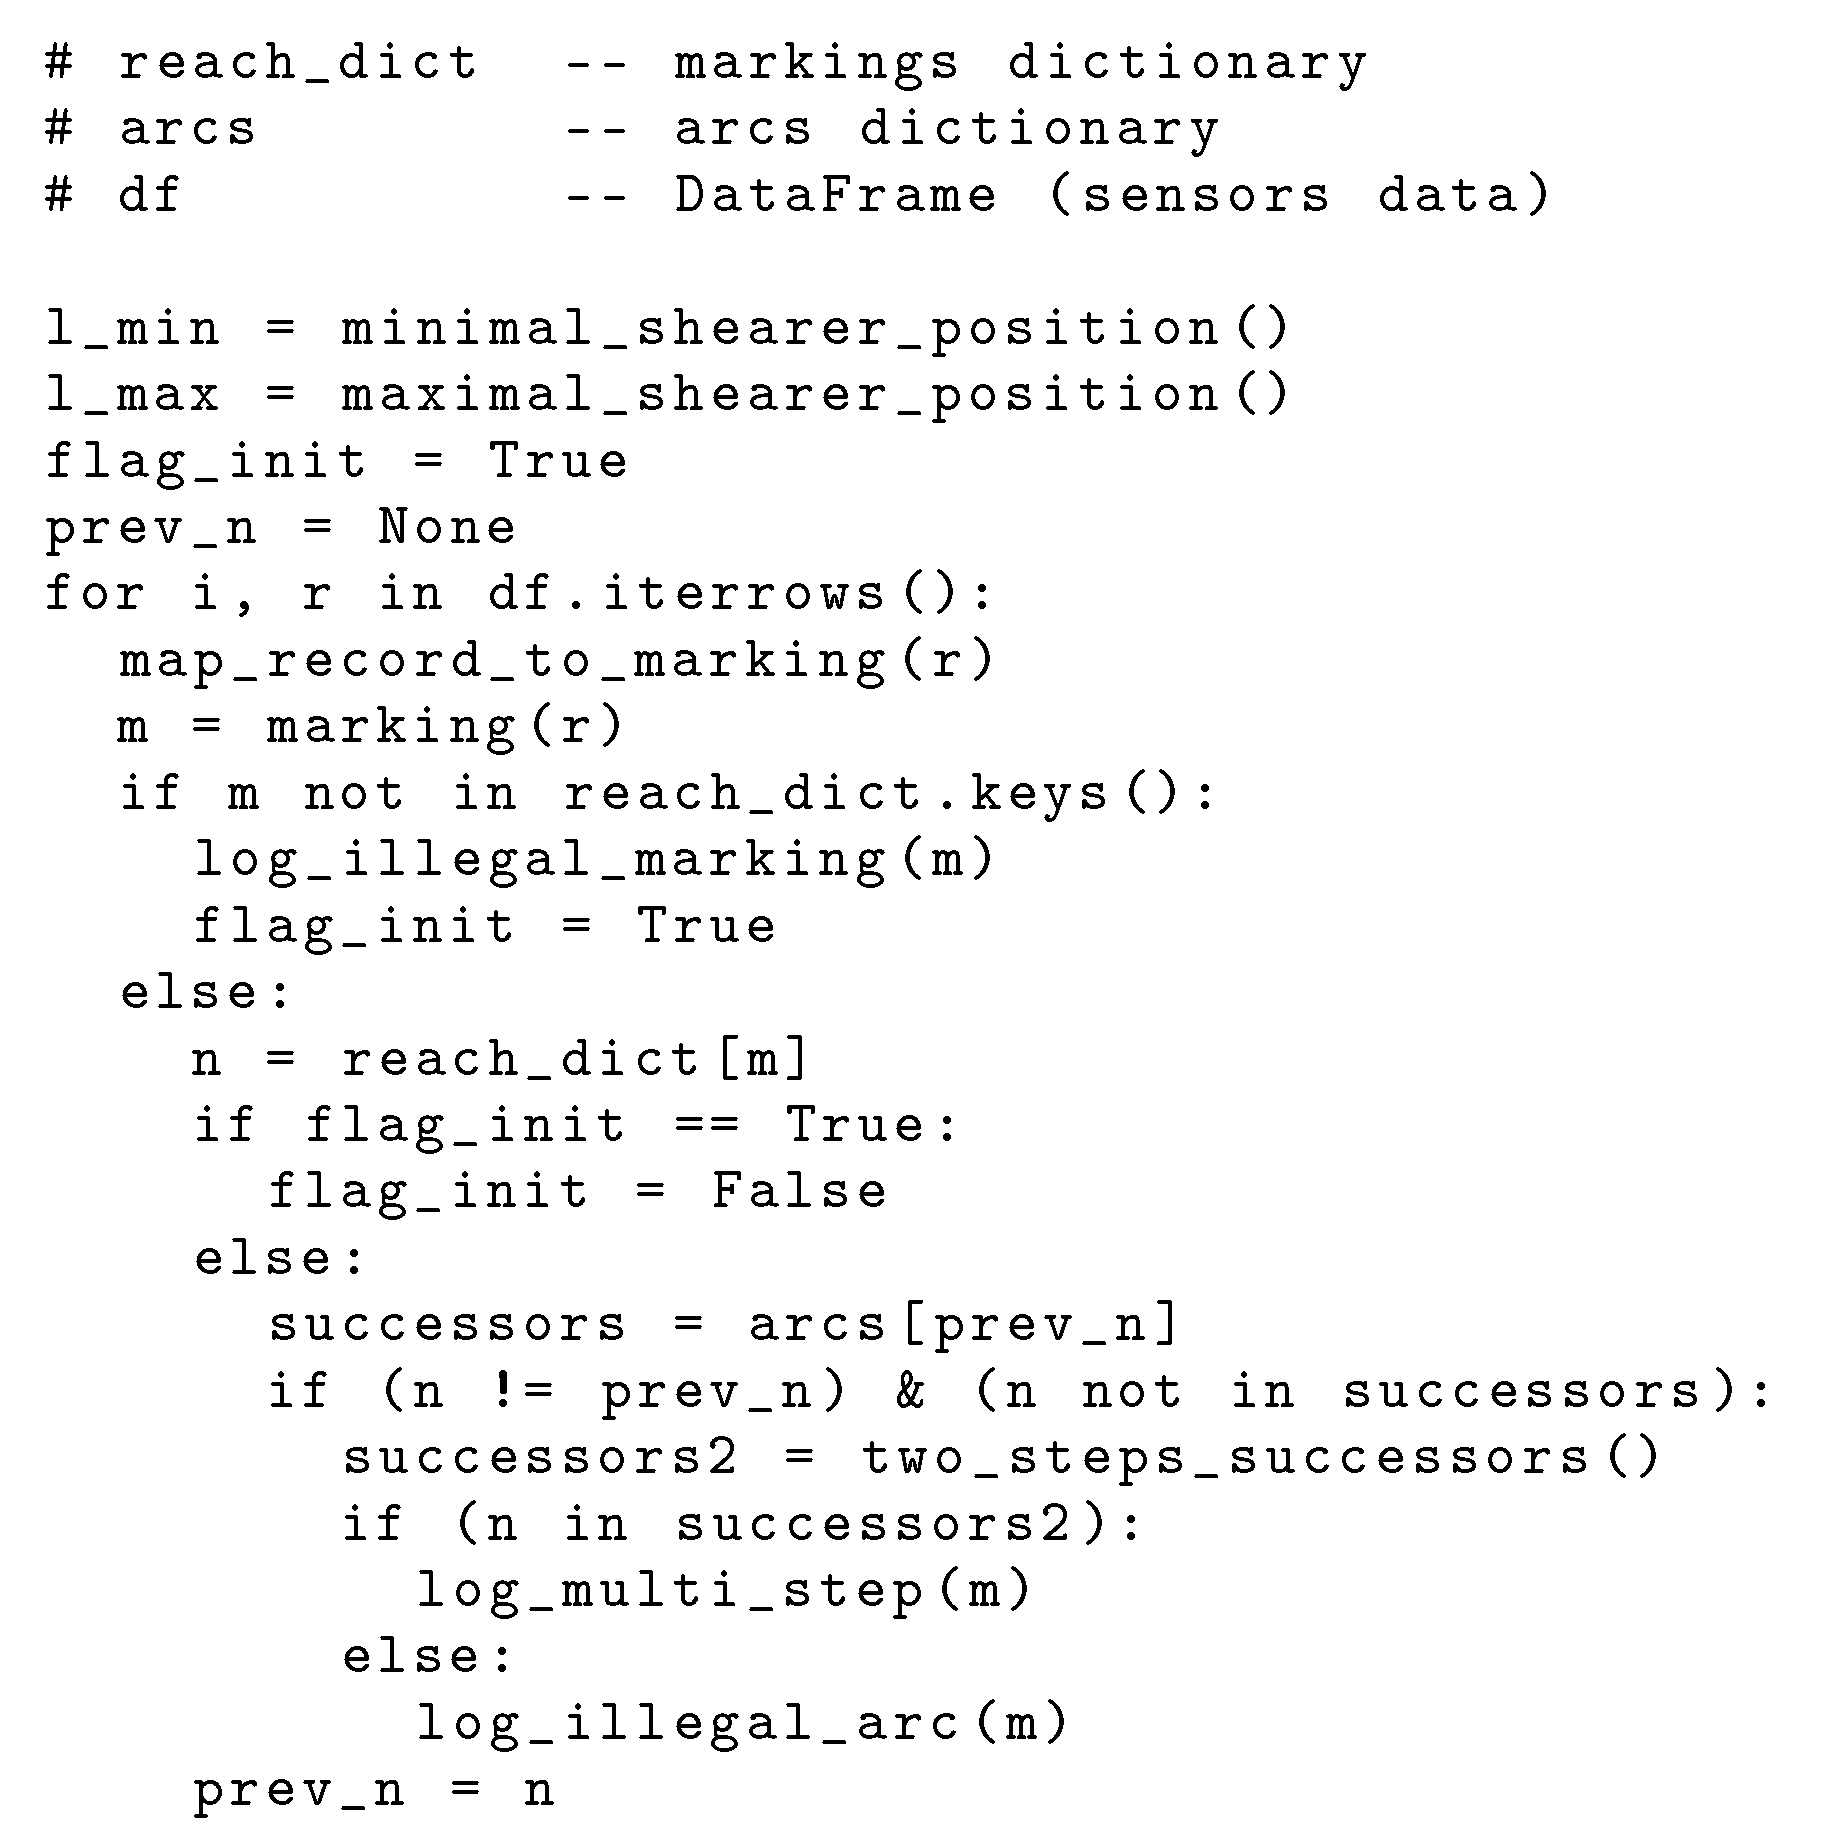
The analysis procedure is implemented using the Python programming language. Two main arguments for the script are the reachability graph generated by the TINA tool (the verbose version) and a CSV file that contains sensors data. The reachability graph is represented by two data structures (two Python dictionaries). The former takes a marking (tuple) as a key and returns its number in the reachability graph. The latter takes a marking number and returns the set of its successors in the reachability graph. The sensors readings are stored using the Pandas DataFrame. The data frame is extended to store the results of mapping records to the corresponding markings and its content is analysed using the two dictionaries. A simplified representation of the verification algorithm is presented in
Figure 8.
The flag_init variable stores the information whether there exists a legal previous marking or not, so it is possible to check the existence of an arc in the reachability graph. The prev_n variable stores the number of the previous legal marking. The meanings of other variables and functions seem straightforward.
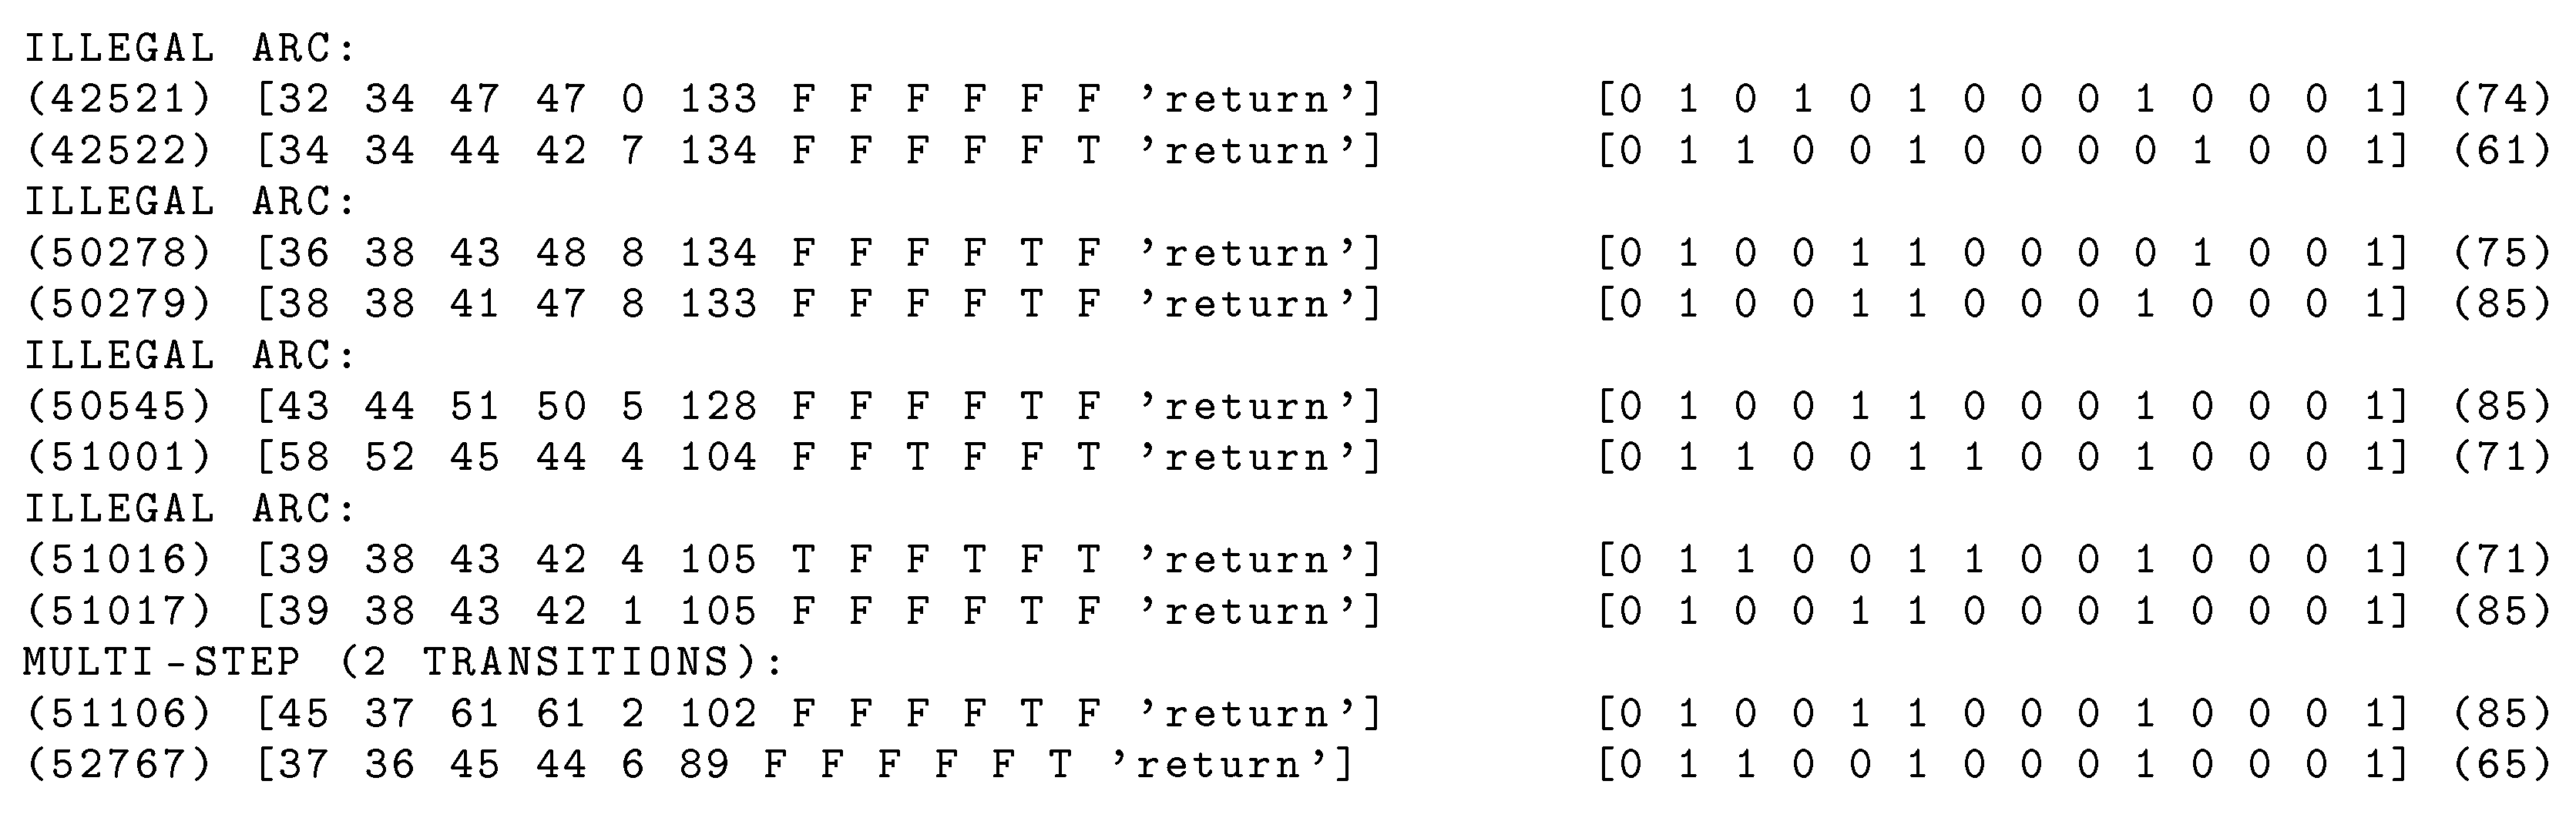
The output of the procedure is a log file that contains information about all changes that do not match the model. A small excerpt from an analysis log is shown in
Figure 9. Let us focus on the first presented problem. It refers to records 42521 and 42522 presented in
Table 3 and the corresponding markings presented in
Table 4. There does not exist an arc leading from marking 74 to marking 61 in the reachability graph, and there is not a two-length path leading from marking 74 to marking 61. Thus, the change from marking 74 to 61 was logged as an illegal arc. After analysing the records, we can see that the shearer begins to move to the right, but its position changes as for moving to the left. It is obvious that this means an error in the data obtained from the shearer sensors.
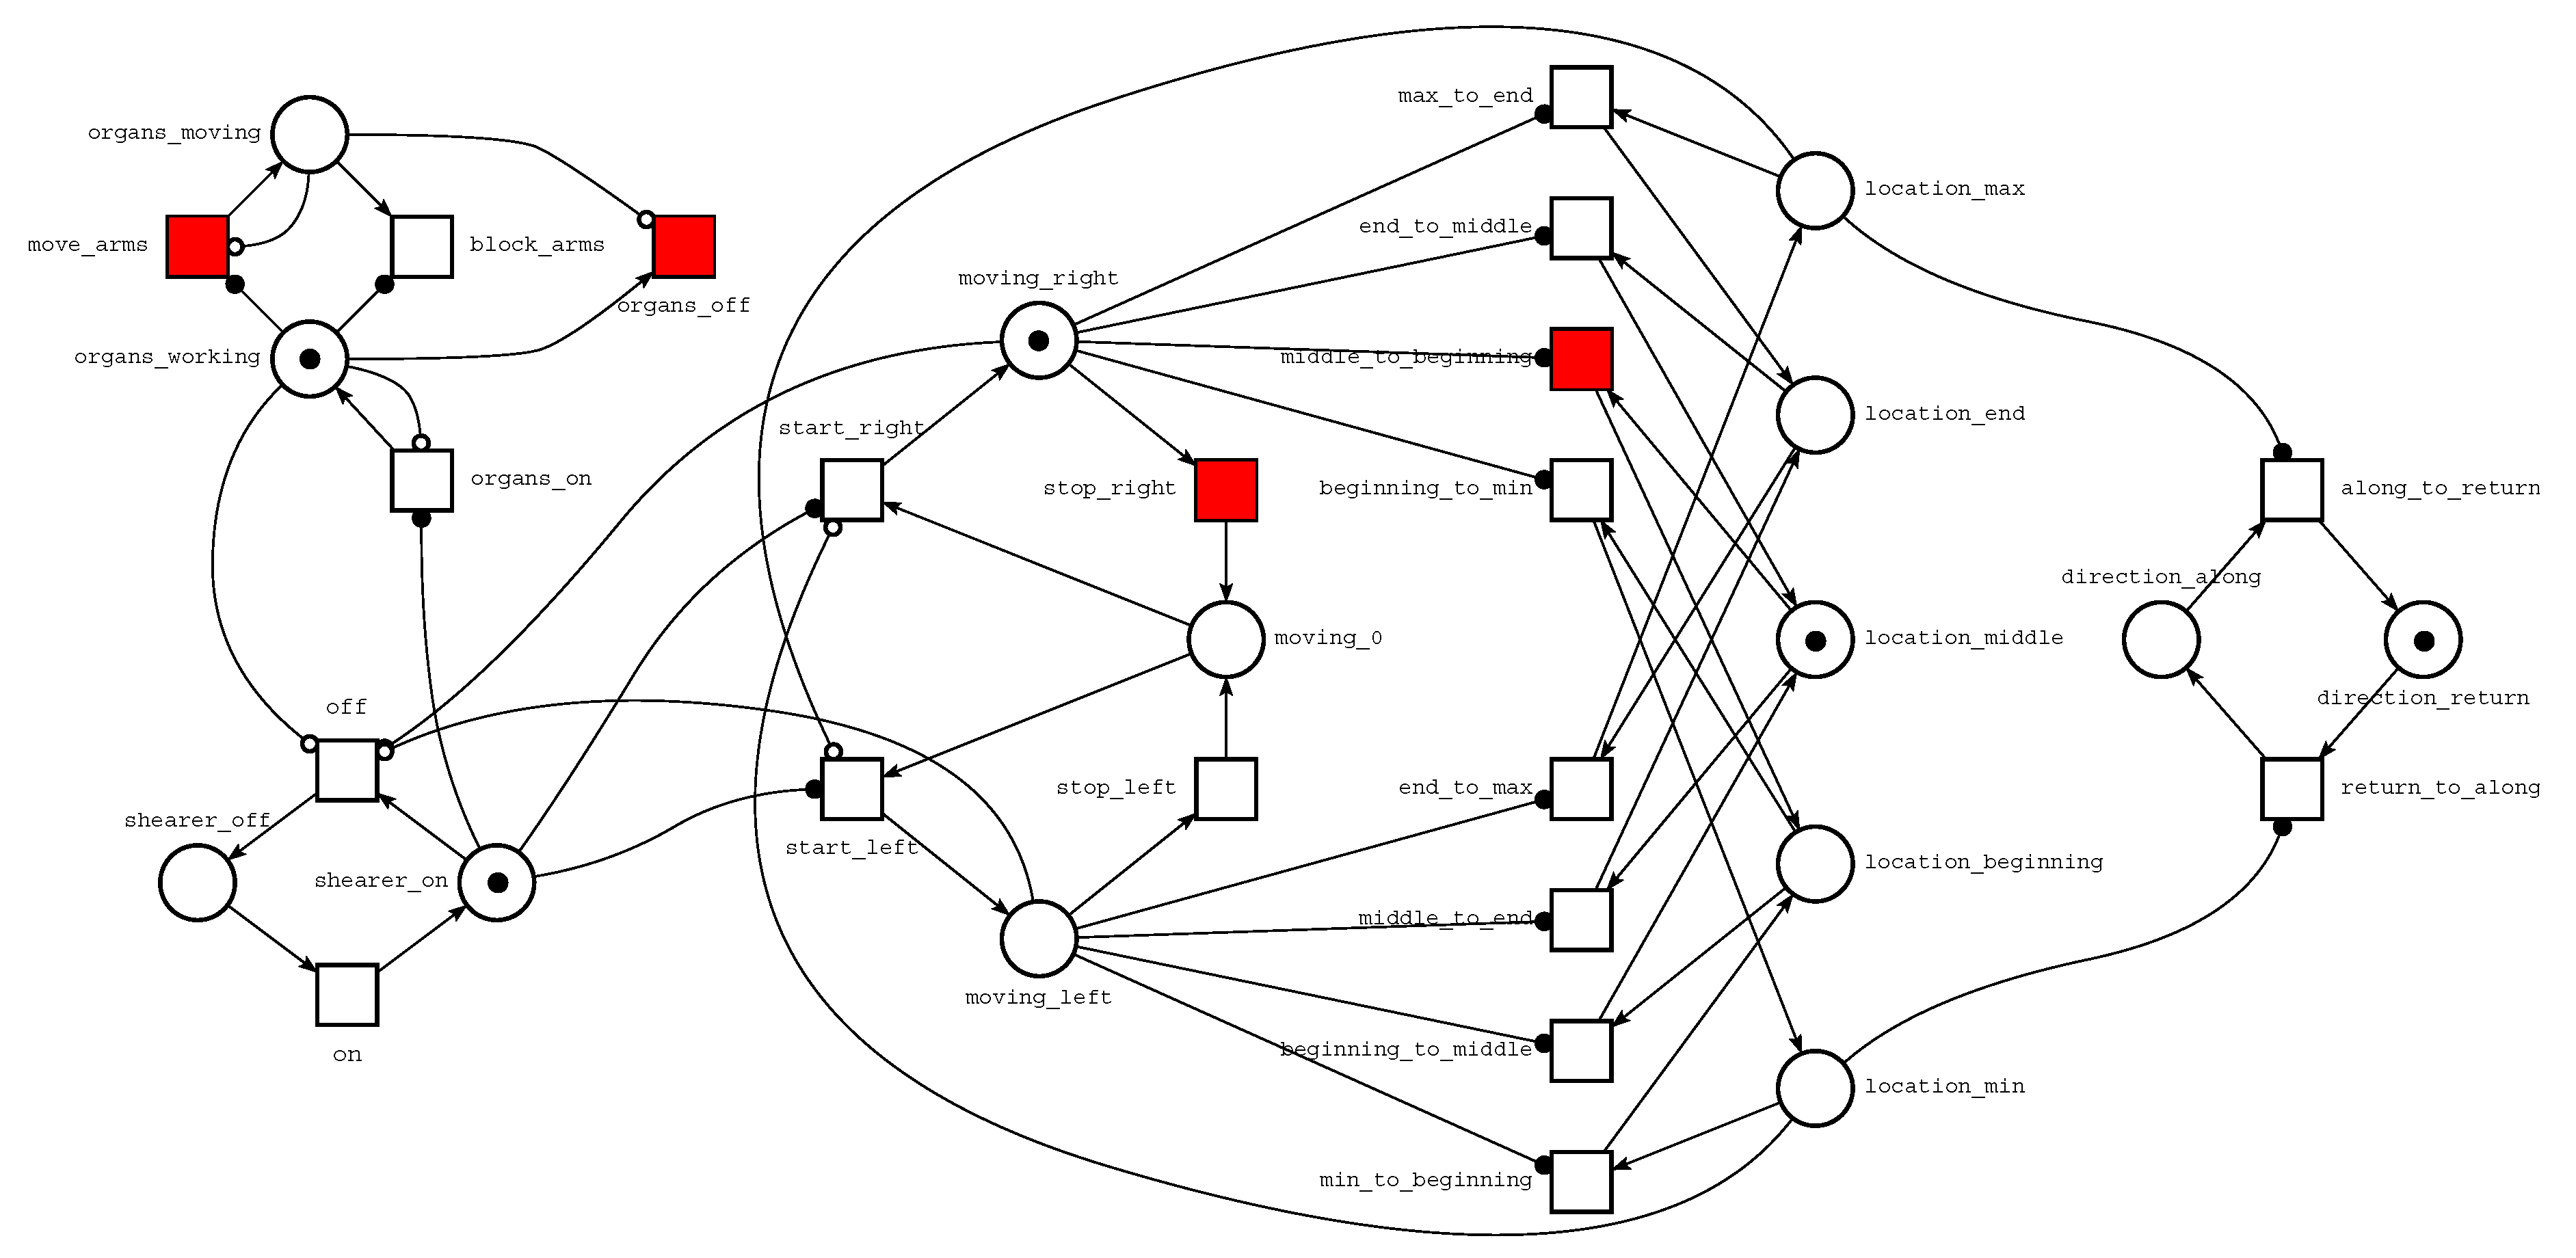
The lack of a one-length or two-length path from marking 74 to marking 61 is also presented using two screenshots from the model simulation presented in
Figure 10 and
Figure 11. Solid squares represent active transitions. Firing transition start_right (other enabling transitions do not lead to a marking similar to marking 61) leads from marking 74 (
Figure 10) to marking 65 (
Figure 11). It is not possible to fire a single enable transition in marking 65 to reach marking 61.
Other errors found in the data include, but are not limited to:
The shearer shifted by one meter even though the sensor indicated speed 0.
The direction of the shearer’s movement changed right to left without stopping.
The shearer moved to the left after reaching the maximum position.
The shearer moved to the right after reaching the minimum position.
Gaps in data, i.e., breaks in the recording of sensor readings.
The average number of errors reported when the multi-steps are not logged is approximately 0.03% of the number of records. If we log multi-steps it is about 0.12% of the number of records in a sample. It is worth noting that most multi-steps represent legal changes, but there are situations when a multi-step represents a significant error in the data, e.g., a sudden change of direction without stopping, which is impossible for a machine with such weight as a shearer.
The process supervisor receiving the warning about detected difference (error) between a formal process model and the process execution can decide, based on his own assessment and experience, whether to stop the process (stop the shearer) or continue the operations, because the deviation results from the known causes (e.g., software errors) or environmental conditions (in the excavation). Having up-to-date information about events in the excavation, the supervisor has more complete information that can be distributed among other participants and owners of the process and further used in decision-making process.
7. Summary
Most approaches to conformance checking available in the literature perform offline analyses. This means that the analysis of the process is performed after the completion of the current execution. The approach presented in this paper can be used both for offline and online analysis. It means it is capable of analysing the deviating behaviour on the fly during the process execution.
In this paper we focus on a specific use case related to the underground longwall mining and its main facility, which is a longwall shearer. As presented in
Section 3, it is possible to describe the longwall process as a sequence of precisely defined stages. In fact, the shearer’s behaviour can be significantly different from its ideal execution. Moreover, an analysis of the execution as a whole seems to be of little use in such a case. Therefore, our approach focuses on a small snippet of the log file to assess whether changes between the last saved shearer states can be considered legal.
The proposed method is implemented using the Python language and was used for verification of log files collected from a few coal mines located in Poland. Due to the lack of access to the real-life operating system, the work presented in this paper was restricted only to the offline analysis, as the online experiments were not possible. Therefore, the online experiments are one of our important directions for future work.
It is worth emphasising that the usability of the approach was assessed directly by Famur employees who deal with the analysis of data collected during the shearer work. Offline analysis of historical logs allowed us to indicate possibilities of improving the system of recording data collected from machinery sensors.
The presented results summarise one of the main stages of the PACMEL project. The described method can be further developed. First of all, the same approach can be applied not only to the shearer but also to the transport system. Such a task requires an extension of the formal model and the acquisition of data from other elements of the mining system. On the other hand, it is possible to apply a high-level Petri net for modelling purposes [
38]. Such an approach would allow one not only to build a model at a lower abstraction level, but also to obtain a digital twin for the shearer.

 ,
, 


